
Testing the Pollution Haven Hypothesis with the Role of Foreign Direct Investments and Total Energy Consumption

 ,
,  ,
,  ,
,
Abstract
:
1. Introduction
2. Review of Literature
3. Materials and Methods
3.1. Data
3.2. Cross-Sectional Dependence (CD) and Unit Root Tests
3.3. Cointegration Tests
3.4. Hausman Test and Pooled Mean Group (PMG)
4. Results
4.1. Cross-Sectional Dependence (CD) Test
4.2. Unit Root Test
4.3. Cointegration Test
4.4. Optimal Lag Length Determination—AIC
5. Discussion and Implications
6. Conclusions
Author Contributions
Funding
Institutional Review Board Statement
Informed Consent Statement
Data Availability Statement
Acknowledgments
Conflicts of Interest
Appendix A

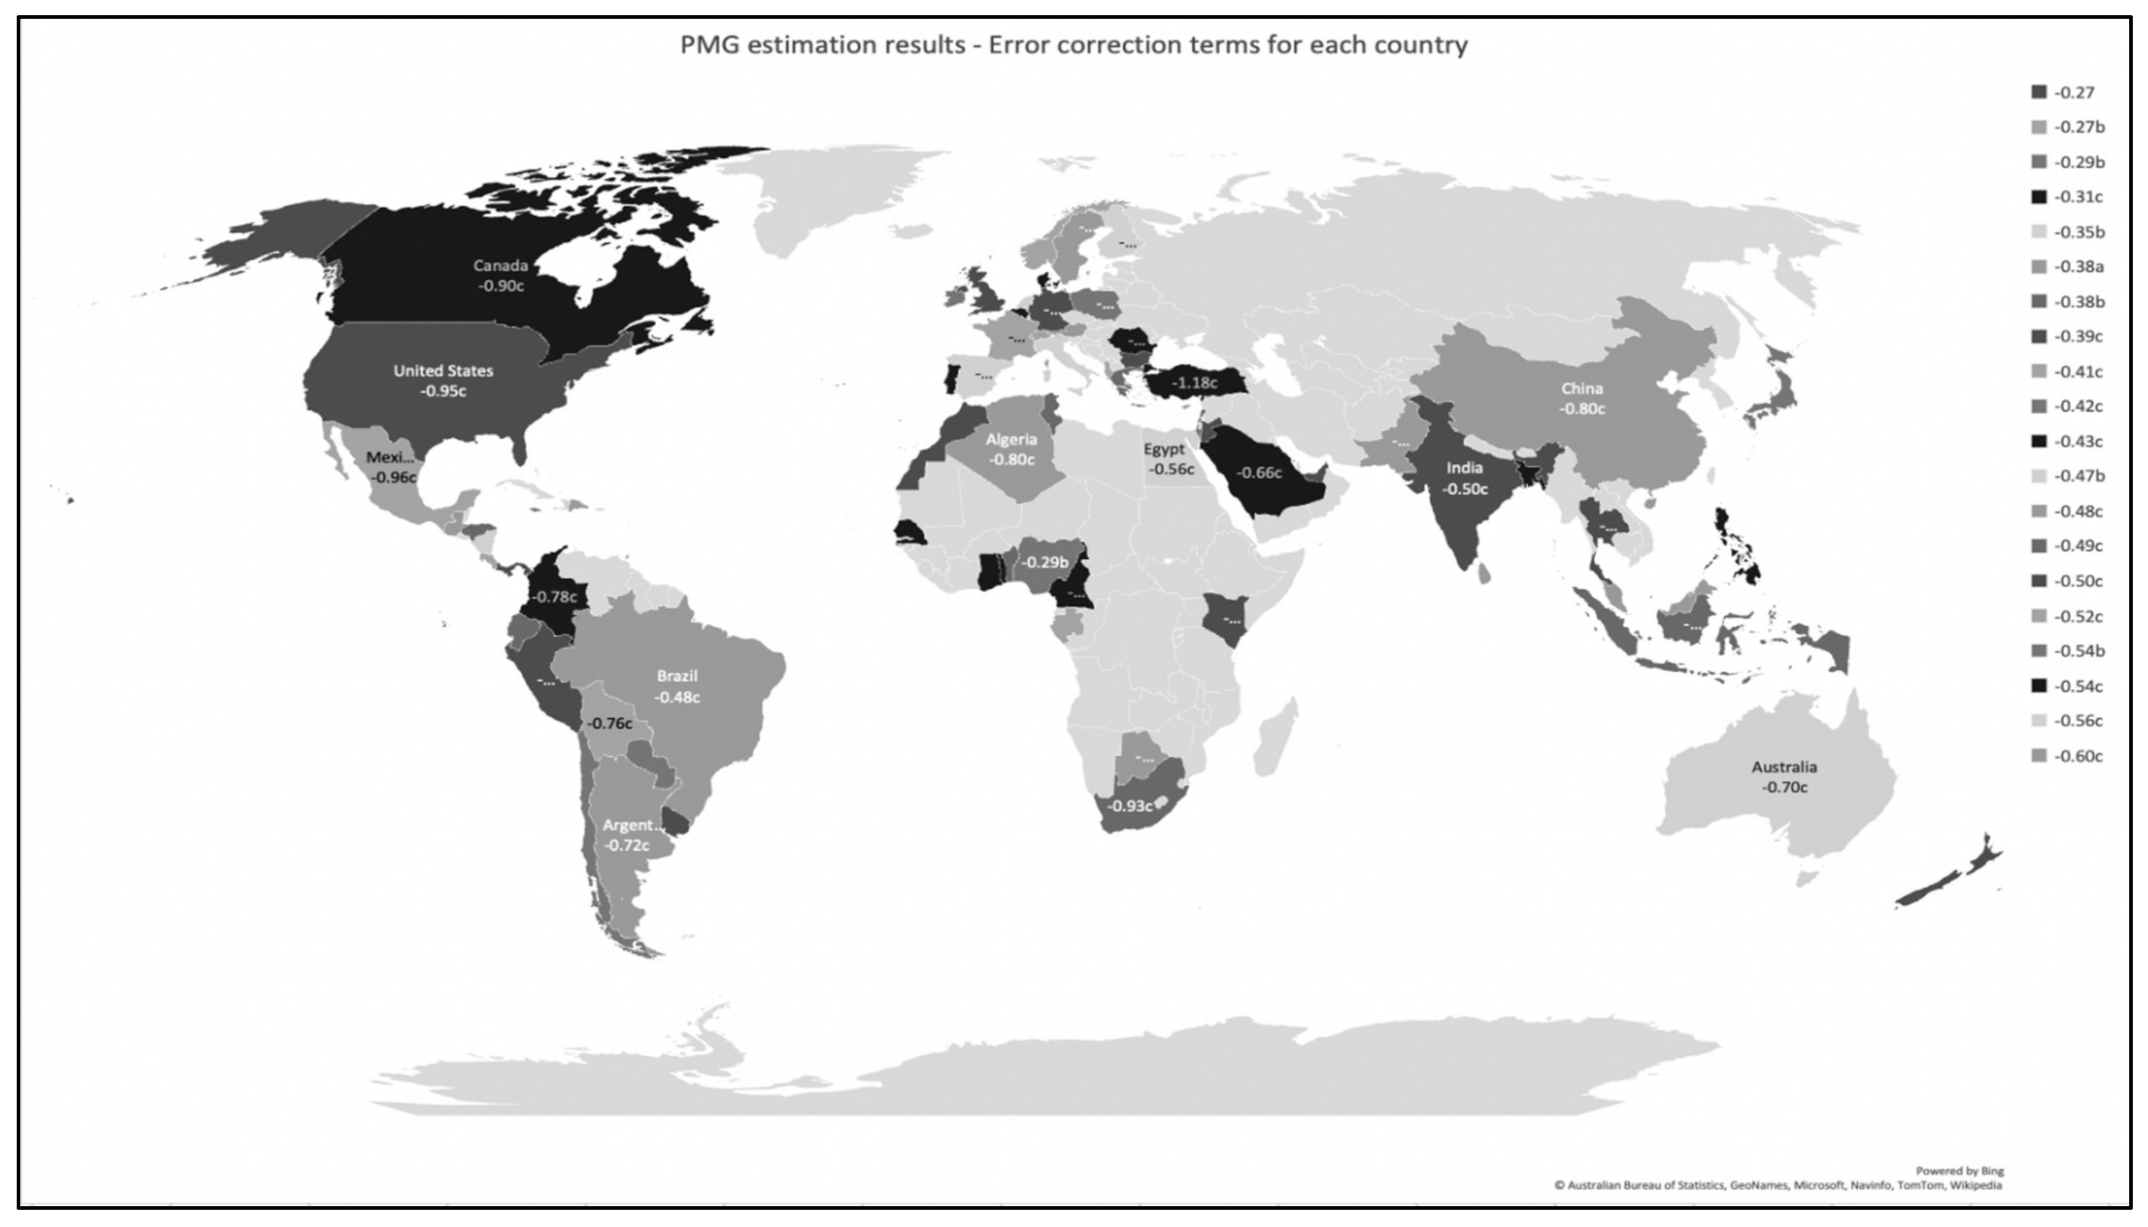
| Sr. No | Country | Coef. | Std. Err. | Z | p-Value | Sr. No | Country | Coef. | Std. Err. | Z | p-Value |
|---|---|---|---|---|---|---|---|---|---|---|---|
| 1 | Albania | −0.74 c | 0.03 | −23.96 | 0.00 | 41 | Jamaica | −0.91 c | 0.14 | −6.35 | 0.00 |
| 2 | Algeria | −0.41 c | 0.11 | −3.92 | 0.00 | 42 | Japan | −1.10 c | 0.16 | −6.87 | 0.00 |
| 3 | Argentina | −0.80 c | 0.16 | −4.94 | 0.00 | 43 | Jordan | −0.54 b | 0.22 | −2.41 | 0.02 |
| 4 | Australia | −0.72 c | 0.19 | −3.83 | 0.00 | 44 | Kenya | −0.62 c | 0.12 | −5.11 | 0.00 |
| 5 | Austria | −0.70 c | 0.19 | −3.74 | 0.00 | 45 | Lebanon | −0.39 c | 0.11 | −3.61 | 0.00 |
| 6 | Bahrain | −0.92 c | 0.14 | −6.76 | 0.00 | 46 | Malaysia | −0.61 c | 0.11 | −5.48 | 0.00 |
| 7 | Bangladesh | −0.54 c | 0.14 | −3.75 | 0.00 | 47 | Malta | −1.02 c | 0.15 | −6.75 | 0.00 |
| 8 | Belgium | −0.43 c | 0.13 | −3.39 | 0.00 | 48 | Mauritius | −0.64 c | 0.20 | −3.29 | 0.00 |
| 9 | Benin | −0.31 c | 0.10 | −3.02 | 0.00 | 49 | Mexico | −0.47 b | 0.19 | −2.49 | 0.01 |
| 10 | Bolivia | −0.82 c | 0.15 | −5.38 | 0.00 | 50 | Morocco | −0.96 c | 0.20 | −4.72 | 0.00 |
| 11 | Botswana | −0.76 c | 0.13 | −5.81 | 0.00 | 51 | Netherlands | −1.57 c | 0.12 | −12.71 | 0.00 |
| 12 | Brazil | −0.80 c | 0.16 | −5.09 | 0.00 | 52 | NewZealand | −1.21 c | 0.16 | −7.62 | 0.00 |
| 13 | Brunei Darussalam | −0.48 c | 0.09 | −5.16 | 0.00 | 53 | Nicaragua | −0.75 c | 0.17 | −4.29 | 0.00 |
| 14 | Bulgaria | −0.60 c | 0.20 | −3.03 | 0.00 | 54 | Nigeria | −0.35 b | 0.18 | −2.00 | 0.05 |
| 15 | Côte d’Ivoire | −0.86 c | 0.17 | −5.22 | 0.00 | 55 | Norway | −0.29 b | 0.14 | −2.10 | 0.04 |
| 16 | Cameroon | −0.89 c | 0.18 | −4.95 | 0.00 | 56 | Pakistan | −1.08 c | 0.19 | −5.38 | 0.00 |
| 17 | Canada | −0.43 c | 0.17 | −2.48 | 0.01 | 57 | Panama | −0.80 c | 0.14 | −5.57 | 0.00 |
| 18 | Chile | −0.90 c | 0.17 | −5.44 | 0.00 | 58 | Paraguay | −0.27 | 0.17 | −1.59 | 0.11 |
| 19 | China | −0.97 c | 0.15 | −6.35 | 0.00 | 59 | Peru | −0.42 c | 0.12 | −3.52 | 0.00 |
| 20 | Columbia | −0.80 c | 0.12 | −6.59 | 0.00 | 60 | Philippines | −0.95 c | 0.13 | −7.37 | 0.00 |
| 21 | Costa Rica | −0.78 c | 0.12 | −6.38 | 0.00 | 61 | Poland | −0.54 c | 0.19 | −2.75 | 0.01 |
| 22 | Cyprus | −0.63 c | 0.23 | −2.81 | 0.01 | 62 | Portugal | −0.77 c | 0.11 | −6.83 | 0.00 |
| 23 | Denmark | −0.63 c | 0.13 | −4.66 | 0.00 | 63 | Romania | −0.78 c | 0.13 | −6.20 | 0.00 |
| 24 | Dominican Republic | −0.54 c | 0.16 | −3.30 | 0.00 | 64 | Saudi Arabia | −0.99 c | 0.17 | −5.98 | 0.00 |
| 25 | Ecuador | −0.80 c | 0.13 | −5.97 | 0.00 | 65 | Senegal | −0.66 c | 0.17 | −3.91 | 0.00 |
| 26 | Egypt | −1.03 c | 0.15 | −6.66 | 0.00 | 66 | Singapore | −0.90 c | 0.21 | −4.25 | 0.00 |
| 27 | Finland | −0.56 c | 0.16 | −3.40 | 0.00 | 67 | South Africa | −0.86 c | 0.19 | −4.45 | 0.00 |
| 28 | France | −1.00 c | 0.22 | −4.50 | 0.00 | 68 | Spain | −0.93 c | 0.15 | −6.28 | 0.00 |
| 29 | Gabon | −0.88 c | 0.19 | −4.69 | 0.00 | 69 | Sri Lanka | −0.79 c | 0.12 | −6.54 | 0.00 |
| 30 | Germany | −0.88 c | 0.19 | −4.71 | 0.00 | 70 | Sweden | −0.60 c | 0.12 | −4.81 | 0.00 |
| 31 | Ghana | −0.62 c | 0.10 | −5.93 | 0.00 | 71 | Switzerland | −1.48 c | 0.16 | −9.20 | 0.00 |
| 32 | Greece | −0.90 c | 0.15 | −6.07 | 0.00 | 72 | Thailand | −0.52 c | 0.12 | −4.20 | 0.00 |
| 33 | Guatemala | −1.52 c | 0.21 | −7.14 | 0.00 | 73 | Togo | −0.62 c | 0.13 | −4.82 | 0.00 |
| 34 | Haiti | −0.38 a | 0.20 | −1.88 | 0.06 | 74 | Trinidad and Tobago | −0.43 c | 0.11 | −3.82 | 0.00 |
| 35 | Honduras | −0.79 c | 0.16 | −4.82 | 0.00 | 75 | Tunisia | −0.27 b | 0.13 | −2.17 | 0.03 |
| 36 | India | −0.49 c | 0.15 | −3.21 | 0.00 | 76 | Turkey | −0.93 c | 0.17 | −5.45 | 0.00 |
| 37 | Indonesia | −0.50 c | 0.16 | −3.10 | 0.00 | 77 | UAE | −1.18 c | 0.07 | −16.96 | 0.00 |
| 38 | Ireland | −0.38 b | 0.16 | −2.41 | 0.02 | 78 | UK | −0.50 c | 0.12 | −3.98 | 0.00 |
| 39 | Israel | −0.97 c | 0.18 | −5.39 | 0.00 | 79 | USA | −0.50 c | 0.13 | −3.68 | 0.00 |
| 40 | Italy | −0.77 c | 0.22 | −3.45 | 0.00 | 80 | Uruguay | −0.95 c | 0.15 | −6.17 | 0.00 |
References
- Cai, B.; Li, W.; Dhakal, S.; Wang, J. Source data supported high resolution carbon emissions inventory for urban areas of the Beijing-Tianjin-Hebei region: Spatial patterns, decomposition and policy implications. J. Environ. Manag. 2018, 206, 786–799. [Google Scholar] [CrossRef] [PubMed]
- Lin, B.; Jia, Z. Is emission trading scheme an opportunity for renewable energy in China? A perspective of ETS revenue redistributions. Appl. Energy 2020, 263, 114605. [Google Scholar] [CrossRef]
- Kousar, S.; Ahmed, F.; López García, M.d.l.N.; Ashraf, N. Renewable energy consumption, water crises, and environmental degradation with moderating role of governance: Dynamic panel analysis under cross-sectional dependence. Sustainability 2020, 12, 10308. [Google Scholar] [CrossRef]
- Shahbaz, M.; Balsalobre-Lorente, D.; Sinha, A. Foreign direct Investment–CO2 emissions nexus in Middle East and North African countries: Importance of biomass energy consumption. J. Clean. Prod. 2019, 217, 603–614. [Google Scholar] [CrossRef] [Green Version]
- Abbas, S.; Kousar, S.; Shirazi, S.A.; Yaseen, M.; Latif, Y. Illuminating Empirical Evidence of Climate Change: Impacts on Rice Production in the Punjab Regions, Pakistan. Agric. Res. 2022, 11, 32–47. [Google Scholar] [CrossRef]
- Mujtaba, A.; Jena, P.K.; Mukhopadhyay, D. Determinants of CO2 emissions in upper middle-income group countries: An empirical investigation. Environ. Sci. Pollut. Res. 2020, 27, 37745–37759. [Google Scholar] [CrossRef]
- Shabbir, A.; Kousar, S. Impact of founder CEO and CEO ownership on entrepreneurial orientation, moderating role of CEO narcissism. Asia Pac. J. Innov. Entrep. 2019, 13, 153–167. [Google Scholar] [CrossRef] [Green Version]
- Kousar, S.; Ahmed, F.; Pervaiz, A.; Zafar, M.; Abbas, S. A Panel Co-Integration Analysis between Energy Consumption and Poverty: New Evidence from South Asian Countries. Stud. Appl. Econ. 2020, 38, 2–16. [Google Scholar] [CrossRef]
- Ahmed, F.; Kousar, S.; Pervaiz, A.; Shabbir, A. Do institutional quality and financial development affect sustainable economic growth? Evidence from South Asian countries. Borsa Istanb. Rev. 2021, 22, 189–196. [Google Scholar] [CrossRef]
- Gozgor, G. Does trade matter for carbon emissions in OECD countries? Evidence from a new trade openness measure. Environ. Sci. Pollut. Res. 2017, 24, 27813–27821. [Google Scholar] [CrossRef]
- Pal, D.; Mitra, S.K. The environmental Kuznets curve for carbon dioxide in India and China: Growth and pollution at crossroad. J. Policy Model. 2017, 39, 371–385. [Google Scholar] [CrossRef]
- Upadhyay, B.D.; Jirakiattikul, S.; Gyawali, S. Does Financial Development, Energy and Trade Drive Environmental Kuznets Curve? A Survey in Light of Nepal Setting. Available online: https://journal.envi.psu.ac.th/jemes/uploadfile/JEMES_MANUSCRIPT_12-22.pdf (accessed on 29 May 2022).
- Dogan, E.; Turkekul, B. CO 2 emissions, real output, energy consumption, trade, urbanization and financial development: Testing the EKC hypothesis for the USA. Environ. Sci. Pollut. Res. 2016, 23, 1203–1213. [Google Scholar] [CrossRef] [PubMed]
- Shahbaz, M.; Nasreen, S.; Abbas, F.; Anis, O. Does foreign direct investment impede environmental quality in high-, middle-, and low-income countries? Energy Econ. 2015, 51, 275–287. [Google Scholar] [CrossRef]
- Rehman, M.U.; Rashid, M. Energy consumption to environmental degradation, the growth appetite in SAARC nations. Renew. Energy 2017, 111, 284–294. [Google Scholar] [CrossRef]
- Zafar, M.; Sabri, P.S.U.; Ilyas, M.; Kousar, S. The impact of trade openness and external debt on economic growth: New evidence from south asia, east asia and middle east. Sci. Int. 2015, 27, 509–516. [Google Scholar]
- Al-Mulali, U.; Tang, C.F. Investigating the validity of pollution haven hypothesis in the gulf cooperation council (GCC) countries. Energy Policy 2013, 60, 813–819. [Google Scholar] [CrossRef]
- Cetin, M.; Ecevit, E.; Yucel, A.G. The impact of economic growth, energy consumption, trade openness, and financial development on carbon emissions: Empirical evidence from Turkey. Environ. Sci. Pollut. Res. 2018, 25, 36589–36603. [Google Scholar] [CrossRef]
- Behera, S.R.; Dash, D.P. The effect of urbanization, energy consumption, and foreign direct investment on the carbon dioxide emission in the SSEA (South and Southeast Asian) region. Renew. Sustain. Energy Rev. 2017, 70, 96–106. [Google Scholar] [CrossRef]
- Sun, C.; Zhang, F.; Xu, M. Investigation of pollution haven hypothesis for China: An ARDL approach with breakpoint unit root tests. J. Clean. Prod. 2017, 161, 153–164. [Google Scholar] [CrossRef]
- Destek, M.A.; Ulucak, R.; Dogan, E. Analyzing the environmental Kuznets curve for the EU countries: The role of ecological footprint. Environ. Sci. Pollut. Res. 2018, 25, 29387–29396. [Google Scholar] [CrossRef]
- Destek, M.A.; Okumus, I. Does pollution haven hypothesis hold in newly industrialized countries? Evidence from ecological footprint. Environ. Sci. Pollut. Res. 2019, 26, 23689–23695. [Google Scholar] [CrossRef] [PubMed]
- Lee, J.W. The contribution of foreign direct investment to clean energy use, carbon emissions and economic growth. Energy Policy 2013, 55, 483–489. [Google Scholar] [CrossRef]
- Abdouli, M.; Kamoun, O.; Hamdi, B. The impact of economic growth, population density, and FDI inflows on CO2 emissions in BRICTS countries: Does the Kuznets curve exist? Empir. Econ. 2018, 54, 1717–1742. [Google Scholar] [CrossRef]
- Grossman, G.M.; Krueger, A.B. Environmental Impacts of a North American Free Trade Agreement; National Bureau of Economic Research: Cambridge, MA, USA, 1991. [Google Scholar]
- Nathaniel, S.; Aguegboh, E.; Iheonu, C.; Sharma, G.; Shah, M. Energy consumption, FDI, and urbanization linkage in coastal Mediterranean countries: Re-assessing the pollution haven hypothesis. Environ. Sci. Pollut. Res. 2020, 27, 35474–35487. [Google Scholar] [CrossRef]
- Abdo, A.-B.; Li, B.; Zhang, X.; Lu, J.; Rasheed, A. Influence of FDI on environmental pollution in selected Arab countries: A spatial econometric analysis perspective. Environ. Sci. Pollut. Res. 2020, 27, 28222–28246. [Google Scholar] [CrossRef]
- Solarin, S.A.; Al-Mulali, U. Influence of foreign direct investment on indicators of environmental degradation. Environ. Sci. Pollut. Res. 2018, 25, 24845–24859. [Google Scholar] [CrossRef]
- Abbas, S.; Kousar, S.; Khan, M.S. The role of climate Change in food security; empirical evidence over Punjab regions, Pakistan. Environ. Sci. Pollut. Res. 2022. [Google Scholar] [CrossRef]
- Cole, M.A.; Elliott, R.J. FDI and the capital intensity of “dirty” sectors: A missing piece of the pollution haven puzzle. Rev. Dev. Econ. 2005, 9, 530–548. [Google Scholar] [CrossRef]
- Copeland, B.R.; Taylor, M.S. North-South trade and the environment. Q. J. Econ. 1994, 109, 755–787. [Google Scholar] [CrossRef]
- Bakirtas, I.; Cetin, M.A. Revisiting the environmental Kuznets curve and pollution haven hypotheses: MIKTA sample. Environ. Sci. Pollut. Res. 2017, 24, 18273–18283. [Google Scholar] [CrossRef]
- Mert, M.; Bölük, G. Do foreign direct investment and renewable energy consumption affect the CO 2 emissions? New evidence from a panel ARDL approach to Kyoto Annex countries. Environ. Sci. Pollut. Res. 2016, 23, 21669–21681. [Google Scholar] [CrossRef] [PubMed]
- Mert, M.; Caglar, A.E. Testing pollution haven and pollution halo hypotheses for Turkey: A new perspective. Environ. Sci. Pollut. Res. 2020, 27, 32933–32943. [Google Scholar] [CrossRef] [PubMed]
- Sarkodie, S.A.; Strezov, V. Effect of foreign direct investments, economic development and energy consumption on greenhouse gas emissions in developing countries. Sci. Total Environ. 2019, 646, 862–871. [Google Scholar] [CrossRef] [PubMed]
- Asghari, M. A test for the pollution haven effect in the selected EU-Asian countries. Int. Econ. Stud. 2013, 41, 49–66. [Google Scholar]
- Udemba, E.N. Ecological implication of offshored economic activities in Turkey: Foreign direct investment perspective. Environ. Sci. Pollut. Res. 2020, 27, 38015–38028. [Google Scholar] [CrossRef] [PubMed]
- Alfaro, L.; Chanda, A.; Kalemli-Ozcan, S.; Sayek, S. Does foreign direct investment promote growth? Exploring the role of financial markets on linkages. J. Dev. Econ. 2010, 91, 242–256. [Google Scholar] [CrossRef]
- Zafar, M.W.; Zaidi, S.A.H.; Khan, N.R.; Mirza, F.M.; Hou, F.; Kirmani, S.A.A. The impact of natural resources, human capital, and foreign direct investment on the ecological footprint: The case of the United States. Resour. Policy 2019, 63, 101428. [Google Scholar] [CrossRef]
- Omri, A.; Nguyen, D.K.; Rault, C. Causal interactions between CO2 emissions, FDI, and economic growth: Evidence from dynamic simultaneous-equation models. Econ. Model. 2014, 42, 382–389. [Google Scholar] [CrossRef] [Green Version]
- Tang, C.F.; Tan, B.W. The impact of energy consumption, income and foreign direct investment on carbon dioxide emissions in Vietnam. Energy 2015, 79, 447–454. [Google Scholar] [CrossRef]
- Acharyya, J. FDI, growth and the environment: Evidence from India on CO2 emission during the last two decades. J. Econ. Dev. 2009, 34, 43. [Google Scholar] [CrossRef]
- Aliyu, M.A. Foreign Direct Investment and the Environment: Pollution Haven HYPOTHESIS Revisited. 2005. Available online: https://www.gtap.agecon.purdue.edu/resources/download/2131.pdf (accessed on 29 May 2022).
- Aliyu, A.; Ismail, N. Foreign direct investment and pollution haven: Does energy consumption matter in African countries. Int. J. Econ. Manag. 2015, 9, 21–23. [Google Scholar]
- Baek, J. A new look at the FDI–income–energy–environment nexus: Dynamic panel data analysis of ASEAN. Energy Policy 2016, 91, 22–27. [Google Scholar] [CrossRef]
- Baloch, M.A.; Zhang, J.; Iqbal, K.; Iqbal, Z. The effect of financial development on ecological footprint in BRI countries: Evidence from panel data estimation. Environ. Sci. Pollut. Res. 2019, 26, 6199–6208. [Google Scholar] [CrossRef]
- Chandran, V.G.R.; Tang, C.F. The impacts of transport energy consumption, foreign direct investment and income on CO2 emissions in ASEAN-5 economies. Renew. Sustain. Energy Rev. 2013, 24, 445–453. [Google Scholar] [CrossRef]
- Gökmenoğlu, K.; Taspinar, N. The relationship between CO2 emissions, energy consumption, economic growth and FDI: The case of Turkey. J. Int. Trade Econ. Dev. 2016, 25, 706–723. [Google Scholar] [CrossRef]
- Gorus, M.S.; Aslan, M. Impacts of economic indicators on environmental degradation: Evidence from MENA countries. Renew. Sustain. Energy Rev. 2019, 103, 259–268. [Google Scholar] [CrossRef]
- Pendo, K.; Arminen, H. Carbon dioxide emissions, energy consumption, economic growth, and foreign direct investment: Causality analysis for Sub-Saharan Africa. Energy 2014, 74, 595–606. [Google Scholar]
- Emrah, K.; Şarkgüneşi, A. The impact of foreign direct investment on CO2 emissions in Turkey: New evidence from cointegration and bootstrap causality analysis. Environ. Sci. Pollut. Res. 2018, 25, 790–804. [Google Scholar]
- Hongbo, L.; Kim, H. Ecological footprint, foreign direct investment, and gross domestic production: Evidence of belt & road initiative countries. Sustainability 2018, 10, 3527. [Google Scholar]
- Merican, Y.; Yusop, Z.; Noor, Z.M.; Hook, L.S. Foreign direct investment and the pollution in five ASEAN nations. Int. J. Econ. Manag. 2007, 1, 245–261. [Google Scholar]
- Pasquale, P. The relationship between CO2 and Foreign Direct Investment in the agriculture and fishing sector of OECD countries: Evidence and policy considerations. Intelektinė ekonomika 2015, 9, 55–66. [Google Scholar]
- Rafindadi, A.A.; Muye, I.M.; Kaita, R.A. The effects of FDI and energy consumption on environmental pollution in predominantly resource-based economies of the GCC. Sustain. Energy Technol. Assess. 2018, 25, 126–137. [Google Scholar] [CrossRef]
- Seker, F.; Ertugrul, H.M.; Cetin, M. The impact of foreign direct investment on environmental quality: A bounds testing and causality analysis for Turkey. Renew. Sustain. Energy Rev. 2015, 52, 347–356. [Google Scholar] [CrossRef]
- Shaari, M.S.; Hussain, N.E.; Abdullah, H.; Kamil, S. Relationship among foreign direct investment, economic growth and CO2 emission: A panel data analysis. Int. J. Energy Econ. Policy 2014, 4, 706–715. [Google Scholar]
- Muhammad, S.; Nasir, M.A.; Roubaud, D. Environmental degradation in France: The effects of FDI, financial development, and energy innovations. Energy Econ. 2018, 74, 843–857. [Google Scholar]
- Zhang, C.; Zhou, X. Does foreign direct investment lead to lower CO2 emissions? Evidence from a regional analysis in China. Renew. Sustain. Energy Rev. 2016, 58, 943–951. [Google Scholar] [CrossRef]
- Zhu, H.; Duan, L.; Guo, Y.; Yu, K. The effects of FDI, economic growth and energy consumption on carbon emissions in ASEAN-5: Evidence from panel quantile regression. Econ. Model. 2016, 58, 237–248. [Google Scholar] [CrossRef] [Green Version]
- Baltagi, B.H. Forecasting with panel data. J. Forecast. 2008, 27, 153–173. [Google Scholar] [CrossRef]
- Dong, K.; Sun, R.; Li, H.; Liao, H. Does natural gas consumption mitigate CO2 emissions: Testing the environmental Kuznets curve hypothesis for 14 Asia-Pacific countries. Renew. Sustain. Energy Rev. 2018, 94, 419–429. [Google Scholar] [CrossRef]
- Pesaran, M.H.; Smith, R. Estimating long-run relationships from dynamic heterogeneous panels. J. Econom. 1995, 68, 79–113. [Google Scholar] [CrossRef]
- Pesaran, M.H. A simple panel unit root test in the presence of cross-section dependence. J. Appl. Econom. 2007, 22, 265–312. [Google Scholar] [CrossRef] [Green Version]
- Westerlund, J. Testing for error correction in panel data. Oxf. Bull. Econ. Stat. 2007, 69, 709–748. [Google Scholar] [CrossRef] [Green Version]
- Pedroni, P. Critical values for cointegration tests in heterogeneous panels with multiple regressors. Oxf. Bull. Econ. Stat. 1999, 61, 653–670. [Google Scholar] [CrossRef]
- Pedroni, P. Panel cointegration: Asymptotic and finite sample properties of pooled time series tests with an application to the PPP hypothesis. Econom. Theory 2004, 20, 597–625. [Google Scholar] [CrossRef] [Green Version]
- Pesaran, M.H.; Shin, Y.; Smith, R.P. Pooled mean group estimation of dynamic heterogeneous panels. J. Am. Stat. Assoc. 1999, 94, 621–634. [Google Scholar] [CrossRef]
- Pesaran, M.H. General diagnostic tests for cross-sectional dependence in panels. Empir. Econ. 2021, 60, 13–50. [Google Scholar] [CrossRef]
- Tamazian, A.; Chousa, J.P.; Vadlamannati, K.C. Does higher economic and financial development lead to environmental degradation: Evidence from BRIC countries. Energy Policy 2009, 37, 246–253. [Google Scholar] [CrossRef]
- Bojnec, Š.; Križaj, A. Electricity markets during the liberalization: The case of a European Union country. Energies 2021, 14, 1–21. [Google Scholar] [CrossRef]
- Bojnec, Š.; Fertő, I. Effects of globalization and corruption on the outward FDI in OECD countries. J. Econ. 2017, 65, 201–219. [Google Scholar]
- Bojnec, Š.; Fertő, I. Globalization and outward foreign direct investment. Emerg. Mark. Financ. Trade 2018, 54, 88–99. [Google Scholar] [CrossRef]
- Zhang, Y.; Qamruzzaman, M.; Karim, S.; Jahan, I. Nexus between Economic Policy Uncertainty and Renewable Energy Consumption in BRIC Nations: The Mediating Role of Foreign Direct Investment and Financial Development. Energies 2021, 14, 4687. [Google Scholar] [CrossRef]
| No | Author(s) | Sample Period | Economies/Country(ies) | Variable | Technique | Hypothesis |
|---|---|---|---|---|---|---|
| 1 | Abdouli et al. (2018) [24] | 1990–2014 | BRICS countries | CO2 | Ordinary least squares (OLS), fixed effects (FE) model, random-effects model (RE) and system generalized method of moments (GMM) | P-HH |
| 2 | Acharyya (2009) [42] | 1980–2003 | India | CO2 | OLS | PHH |
| 3 | Al-Mulali and Tang (2013) [17] | 1980–2009 | GCC Countries | CO2 | Fully modified OLS (FMOLS) and Granger causality tests | PHH is rejected |
| 4 | Aliyu (2005) [43] | 1990–2000 | 14 non-OECD Countries | CO2 | Panel OLS | PHH is rejected |
| 5 | Aliyu and Ismail (2015) [44] | 1990–2010 | 19 African countries | CO2 | Pooled mean group (PMG) | Neutrality |
| 6 | Asghari (2013) [36] | 1980–2011 | MENA Region | BOD | Panel OLS (FE and RE) | P-HH |
| 7 | Baek (2016) [45] | 1981–2010 | 5 ASEAN Countries | CO2 | Pooled mean group (PMG) | PHH |
| 8 | Bakirtas and Cetin (2017) [32] | 1982–2011 | MIKTA Countries | CO2 | Panel Vector Auto Regressive Model (PVAR) | PHH |
| 9 | Baloch et al. (2019) [46] | 1990–2016 | 59 Belt and Road Initiative (BRI) Countries | EFP | Panel data regressions with Driscoll–Kraay standard errors | PHH |
| 10 | Behera & Dash (2017) [19] | 1980–2012 | 17 countries in south and southeast Asia (SSEA) region | CO2 | FMOLS, dynamic OLS | PHH |
| 11 | Chandran and Tang (2013) [47] | 1971–2008 | ASEAN—5 economies | CO2 | Johansen cointegration, VECM Granger causality | Mixed |
| 12 | Destek and Okumus (2019) [22] | 1982–2013 | 10 newly industrialized countries | EFP | Error correction based cointegration tests | Non-linear relation |
| 13 | Gokmenoglu and Taspinar (2016) [48] | 1974–2010 | Turkey | CO2 | ARDL error correction model PDOLS | PHH |
| 14 | Gorus and Aslan (2019) [49] | 1980–2013 | MENA Region | CO2 | Dumitrescu–Hurlin non-causality | Mixed |
| 15 | Kivyiro and Arminen (2014) [50] | 1971–2009 | 6 sub-Saharan African countries | CO2 | ARDL, Granger VECM causality, and Maki structural break cointegration test | Mixed |
| 16 | Kocak and Sarkgunesi (2018) [51] | 1974–2013 | Turkey | CO2 | Stock and Watson dynamic OLS Hacker and Hatemij bootstrap causality | PHH |
| 17 | Liu and Kim (2018) [52] | 1990–2016 | 44 BRI countries | EFP | PVAR | P-HH |
| 18 | Merican et al. (2007) [53] | 1976–2002 | 5 ASEAN Countries | CO2 | ARDL, unrestricted error-correction model (UECM) | Mixed |
| 19 | Mert and Boluk (2016) [33] | 2002–2010 | 21 Kyoto countries | CO2 | Panel ARDL, Panel VECM Causality | P-HH |
| 20 | Mert and Caglar (2020) [34] | 1974–2018 | Turkey | CO2 | Crouching ECM, VECM | P-HH |
| 21 | Omri et al. (2014) [40] | 1990–2011 | 54 countries | CO2 | GMM | PHH |
| 22 | Pazienza (2015) [54] | 1981–2005 | 30 OECD countries | CO2 | Panel OLS (FE and RE) | P-HH |
| 23 | Rafindadi et al. (2018) [55] | 1990–2014 | GCC Countries | CO2 | PMG | P-HH |
| 24 | Sarkodie and Strezov (2019) [35] | 1982–2016 | China, India, Iran, Indonesia, and South Africa | CO2 | Panel data regressions with Driscoll–Kraay standard errors | P-HH |
| 25 | Seker et al. (2015) [56] | 1974–2010 | Turkey | CO2 | Hatemi-J cointegration test, ARDL, Granger VECM Causality | PHH |
| 26 | Shaari et al. (2014) [57] | 1992–2012 | 15 developing countries | CO2 | FMOLS, Granger VECM causality | Neutrality |
| 27 | Shahbaz et al. (2015) [14] | 19975–2012 | 99 countries | CO2 | FMOLS | PHH |
| 28 | Shahbaz et al. (2018) [58] | 1955–2016 | France | CO2 | The bootstrap ARDL | PHH |
| 29 | Shahbaz et al. (2019) [4] | 1990–2015 | 17 MENA countries | CO2 | GMM | PHH |
| 30 | Solarin and Al-Mulali (2018) [28] | 1982–2013 | 20 developing and developed countries | CO2, EFP | Westerlund panel cointegration test Augmented meean group estimator (AMG), STIRPAT Model | Mixed |
| 31 | Solarin and Al-Mulali (2018) [28] | 1980–2012 | Ghana | CO2 | ARDL | PHH |
| 32 | Sun et al. (2017) [20] | 1980–2012 | China | CO2 | ARDL | PHH |
| 33 | Tang and Tan (2015) [41] | 1976–2009 | Vietnam | CO2 | Johansen cointegration, VECM Granger causality | PHH |
| 34 | Udemba [37] | 1974–2017 | Turkey | EFP | Structural break analysis, ARDL Bound testing, Granger causality | PHH |
| 35 | Zafar et al. (2019) [39] | 1970–2015 | United States of America | EFP | ARDL | P-HH |
| 36 | Zhang and Zhou (2016) [59] | 1995–2010 | 29 provinces in China | CO2 | Pedroni cointegration test, STIRPAT | P-HH |
| 37 | Zhu et al. (2016) [60] | 1981–2011 | 5 ASEAN-5 economies | CO2 | Panel quantile regression | P-HH |
| Measure | EFP Per Capita (In Million Hectares) | Real GDP Per Capita (USD) | Foreign Direct Investment, Net Inflows (BoP, Million USD) | Energy Use (kg of Oil Equivalent Per Capita) | Renewable Energy Consumption (% of Total Final Energy Consumption) |
|---|---|---|---|---|---|
| Mean | 4.77 | 383,239 million | 1310 million | 2436.76 | 28.13 |
| Median | 3.12 | 8547 million | 135 million | 1371.36 | 20.33 |
| Maximum | 432.33 | 562 million | 734 million | 15,108.65 | 95.04 |
| Minimum | 0.46 | 323.64 million | 296 million | 118.90 | 0 |
| Std. Dev. | 17.97 | 129 million | 408 million | 2539.54 | 25.54 |
| Skewness | 17.72 | 41.43 | 7.13 | 1.82 | 0.8 |
| Kurtosis | 339.32 | 1776.34 | 77.67 | 6.71 | 2.5 |
| Obs. | 2000 | 2000 | 2000 | 2000 | 2000 |
| Source | WDI | WDI | WDI | WDI | WDI |
| Variables | CD-Test | p-Value | Correlation | Abs(Corr.) |
|---|---|---|---|---|
| LEFP | 28.37 | 0.00 | 0.10 | 0.39 |
| LREALGDP | 60.66 | 0.00 | 0.22 | 0.54 |
| LFDI | 121.06 | 0.00 | 0.43 | 0.46 |
| LFDI2 | 149.42 | 0.00 | 0.53 | 0.54 |
| LENERGY | 59.28 | 0.00 | 0.21 | 0.51 |
| LRENEWABLE | 248.56 | 0.00 | 0.88 | 0.88 |
| Global Panel | ||||||||
|---|---|---|---|---|---|---|---|---|
| Variables | At Level | At 1st Difference | ||||||
| Drift | p-Value | Drift and Trend | p-Value | Drift | p-Value | Drift and Trend | p-Value | |
| LEFP | 2.72 | 1 | 4.22 | 1 | −7.68 | 0.00 | −4.22 | 0.00 |
| LREALGDP | −3.57 | 0.00 | −3.43 | 0.00 | −9.33 | 0.00 | −4.30 | 0.00 |
| LFDI | 1.77 | 0.96 | 9.47 | 1 | −6.80 | 0.00 | −4.17 | 0.00 |
| LFDI2 | −2.57 | 0.01 | 1.11 | 0.87 | −13.07 | 0.00 | −8.64 | 0.00 |
| LENERGY | 3.78 | 1 | 7.33 | 1 | −3.79 | 0.00 | −1.63 | 0.05 |
| LREN. | −0.30 | 0.38 | −0.83 | 0.2 | −12.70 | 0.00 | −9.16 | 0.00 |
| Low Income Panel | ||||||||
| LEFP | 0.45 | 0.67 | −0.27 | 0.39 | −3.65 | 0.00 | −2.86 | 0.00 |
| LREALGDP | 0.47 | 0.68 | −0.52 | 0.30 | −2.64 | 0.00 | −1.83 | 0.03 |
| LFDI | −2.38 | 0.01 | −2.78 | 0.00 | −6.46 | 0.00 | −5.92 | 0.00 |
| LFDI2 | −1.3 | 0.10 | −0.85 | 0.20 | −4.83 | 0.00 | −3.99 | 0.00 |
| LENERGY | −0.82 | 0.21 | 0.37 | 0.64 | −2.41 | 0.01 | −1.80 | 0.04 |
| LREN. | −3.98 | 0.00 | 0.35 | 0.64 | −4.03 | 0.00 | −3.21 | 0.00 |
| Lower-Middle Income Panel | ||||||||
| LEFP | −0.81 | 0.21 | 1.44 | 0.93 | −7.03 | 0.00 | −6.15 | 0.00 |
| LREALGDP | −1.90 | 0.03 | −1.11 | 0.14 | −6.72 | 0.00 | −4.59 | 0.00 |
| LFDI | −2.30 | 0.01 | 0.46 | 0.68 | −8.81 | 0.00 | −7.66 | 0.00 |
| LFDI2 | −4.78 | 0.00 | −2.81 | 0.00 | −10.14 | 0.00 | −7.65 | 0.00 |
| LENERGY | 0.31 | 0.62 | 1.79 | 0.96 | −6.83 | 0.00 | −5.53 | 0.00 |
| LREN. | 1.96 | 0.98 | 3.59 | 1 | −4.33 | 0.00 | −2.44 | 0.01 |
| Upper-Middle Income Panel | ||||||||
| LEFP | −0.95 | 0.17 | 0.42 | 0.66 | −8.31 | 0.00 | −5.89 | 0.00 |
| LREALGDP | −3.85 | 0.00 | −5.29 | 0.00 | −9.15 | 0.00 | −7.10 | 0.00 |
| LFDI | −4.14 | 0.00 | −3.45 | 0.00 | −10.87 | 0.00 | −8.57 | 0.00 |
| LFDI2 | −5.92 | 0.00 | −3.66 | 0.00 | −12.28 | 0.00 | −10.14 | 0.00 |
| LENERGY | −0.51 | 0.31 | 2.70 | 1 | −7.02 | 0.00 | −4.95 | 0.00 |
| LREN. | −1.55 | 0.06 | −0.54 | 0.29 | −7.25 | 0.00 | −4.70 | 0.00 |
| High Income Panel | ||||||||
| LEFP | 0.72 | 0.77 | 1.02 | 0.85 | −10.53 | 0.00 | −8.29 | 0.00 |
| LREALGDP | −4.62 | 0.00 | −2.45 | 0.01 | −7.92 | 0.00 | −4.64 | 0.00 |
| LFDI | −0.90 | 0.19 | 0.37 | 0.64 | −14.87 | 0.00 | −12.51 | 0.00 |
| LFDI2 | −3.74 | 0.00 | −2.70 | 0.00 | −15.83 | 0.00 | −12.85 | 0.00 |
| LENERGY | −0.53 | 0.30 | −1.33 | 0.09 | −11.88 | 0.00 | −8.24 | 0.00 |
| LREN. | 0.09 | 0.00 | −1.91 | 0.03 | −6.96 | 0.00 | −5.86 | 0.00 |
| Models | Global Panel | Low-Income Panel | Lower-Middle Income Panel | Upper-Middle Income Panel | High Income Panel | |||||
|---|---|---|---|---|---|---|---|---|---|---|
| Get | −2.80 c | 0.00 | −1.22 | 0.99 | −2.79 a | 0.08 | −2.68 | 0.19 | −2.97 c | 0.00 |
| Ga | −10.12 | 1 | −6.99 | 0.90 | −9.48 | 0.99 | −9.06 | 1 | −11.30 | 0.97 |
| Pt | −25.41 c | 0.00 | −1.70 | 0.96 | −10.49 | 0.28 | −9.86 | 0.89 | −22.61 c | 0.00 |
| Pa | −10.50 | 0.50 | −7.02 | 0.77 | −8.00 | 0.95 | −8.47 | 0.92 | −22.61 b | 0.05 |
| Models | Global Panel | Low-Income Panel | Lower-Middle Income Panel | Upper-Middle Income Panel | High Income Panel | |||||
|---|---|---|---|---|---|---|---|---|---|---|
| Panel v-statistic | 1.79 b | 0.04 | −0.76 | 0.78 | 2.00 b | 0.02 | 4.55 c | 0.00 | −2.73 | 1 |
| Panel σ-statistic | −8.24 c | 0.00 | −0.12 | 0.45 | −3.51 c | 0.00 | −1 | 0.16 | −9.26 c | 0.00 |
| Panel ρρ-statistic | −18.65 c | 0.00 | −0.81 | 0.21 | −9.86 c | 0.00 | −1.99 b | 0.02 | −22.70 c | 0.00 |
| Panel adf-statistic | −22.39 c | 0.00 | −0.61 | 0.27 | −6.39 c | 0.00 | −5.69 c | 0.00 | −22.10 c | 0.00 |
| Group σ-statistic | −0.65 | 0.26 | 0.34 | 0.63 | −0.63 | 0.26 | 0.28 | 0.61 | −0.81 | 0.21 |
| Group ρρ-statistic | −14.83 c | 0.00 | −0.68 | 0.25 | −8.23 c | 0.00 | −6.25 c | 0.00 | −10.98 c | 0.00 |
| Group adf-statistic | −12.08 c | 0.00 | −0.44 | 0.33 | −6.50 c | 0.00 | −5.25 c | 0.00 | −9.01 c | 0.00 |
| Countries | LEFP | LREALGDP | LFDI | LFDI2 | LENERGY | LRENEWABLE |
|---|---|---|---|---|---|---|
| Global | 1 | 0 | 0 | 0 | 0 | 0 |
| Low-income | 1 | 1 | 1 | 1 | 1 | 1 |
| Lower-middle-income | 1 | 0 | 0 | 0 | 0 | 0 |
| Upper-middle-income | 1 | 0 | 0 | 0 | 0 | 0 |
| High-income | 1 | 0 | 0 | 0 | 0 | 0 |
| Global Panel | Lower-Middle-Income Panel | Upper-Middle-Income Panel | High-Income Level | |||||||||
|---|---|---|---|---|---|---|---|---|---|---|---|---|
| Variables | (b) MG | (B) PMG | (b-B) Difference | (b) MG | (B) PMG | (b-B) Difference | (b) MG | (B) PMG | (b-B) Difference | (b) MG | (B) PMG | (b-B) Difference |
| LREALGDP | −0.03 | −0.04 | 0.02 | −0.16 | −0.08 | −0.08 | 0.20 | −0.02 | 0.23 | −0.10 | −0.09 | −0.01 |
| LFDI | 2.34 | 0.01 | 2.32 | 2.39 | 0.53 | 1.86 | 5.89 | 0.02 | 5.87 | −0.02 | 0.01 | −0.03 |
| LFDI2 | −0.05 | 0.00 | −0.05 | −0.01 | 0.00 | 0.00 | −0.19 | 0.00 | −0.19 | 0.01 | 0.00 | 0.01 |
| LENERGY | 0.14 | −0.11 | 0.25 | −0.21 | −0.10 | −0.11 | 0.57 | −0.10 | 0.67 | 0.06 | −0.13 | 0.19 |
| LRENEWABLE | −0.40 | −0.05 | −0.34 | 0.77 | 0.25 | 0.52 | −4.62 | −0.13 | −4.49 | 1.62 | −0.08 | 1.70 |
| Chi2(5) = 7.76; Prob > Chi2 = 0.17 | Chi2(5) = 36.09; Prob > Chi2 = 0.30 | Chi2(5) = 5.69; Prob > Chi2 = 0.34 | Chi2(5) = 7.77; Prob > Chi2 = 0.17 | |||||||||
| Global Panel | Low-Income Panel | Lower-Middle-Income Panel | Upper-Middle-Income Panel | High Income Panel | ||||||
|---|---|---|---|---|---|---|---|---|---|---|
| Long-Run | Short-Run | Long-Run | Short-Run | Long-Run | Short-Run | Long-Run | Short-Run | Long-Run | Short-Run | |
| LREALGDP | −0.04 c | 0.01 | 0.14 c | 0.11 | −0.08 c | 0.12 c | −0.02 b | −0.21 | −0.09 c | 0.12 c |
| LFDI | 0.01 c | 1.47 | 7.31 c | 1.99 | 0.53 c | 0.83 | 0.02 c | 3.22 | 0 | 0.55 |
| LFDI2 | 0 | −0.01 | −0.01 | −0.00 a | −0.00 c | 0 | −0.00 b | −0.03 | 0.00 a | 0 |
| LENERGY | −0.11 c | 0.44 c | −0.01 | 0.2 | −0.10 a | 0.33 c | −0.10 a | 0.47 c | −0.13 b | 0.46 c |
| LRENEWABLE | −0.05 | −0.05 | 0.15 | −0.42 c | −0.25 | −0.17 | −0.13 | −0.7 | −0.08 | −1.36 |
| No of countries | 80 | 80 | 2 | 2 | 19 | 19 | 23 | 23 | 36 | 36 |
| Obs. | 1920 | 1920 | 48 | 48 | 456 | 456 | 552 | 552 | 864 | 864 |
Publisher’s Note: MDPI stays neutral with regard to jurisdictional claims in published maps and institutional affiliations. |
© 2022 by the authors. Licensee MDPI, Basel, Switzerland. This article is an open access article distributed under the terms and conditions of the Creative Commons Attribution (CC BY) license (https://creativecommons.org/licenses/by/4.0/).
Share and Cite
Dagar, V.; Ahmed, F.; Waheed, F.; Bojnec, Š.; Khan, M.K.; Shaikh, S. Testing the Pollution Haven Hypothesis with the Role of Foreign Direct Investments and Total Energy Consumption. Energies 2022, 15, 4046. https://doi.org/10.3390/en15114046
Dagar V, Ahmed F, Waheed F, Bojnec Š, Khan MK, Shaikh S. Testing the Pollution Haven Hypothesis with the Role of Foreign Direct Investments and Total Energy Consumption. Energies. 2022; 15(11):4046. https://doi.org/10.3390/en15114046
Chicago/Turabian StyleDagar, Vishal, Farhan Ahmed, Farah Waheed, Štefan Bojnec, Muhammad Kamran Khan, and Sana Shaikh. 2022. "Testing the Pollution Haven Hypothesis with the Role of Foreign Direct Investments and Total Energy Consumption" Energies 15, no. 11: 4046. https://doi.org/10.3390/en15114046
APA StyleDagar, V., Ahmed, F., Waheed, F., Bojnec, Š., Khan, M. K., & Shaikh, S. (2022). Testing the Pollution Haven Hypothesis with the Role of Foreign Direct Investments and Total Energy Consumption. Energies, 15(11), 4046. https://doi.org/10.3390/en15114046