Abstract
In Korea, energy consumption within apartments in metropolitan areas accounted for more than 33% of the total energy consumption by buildings in 2020. In this study, in order to increase the energy efficiency of MDU (multi-dwelling unit) complexes in metropolitan areas, improvement factors and economic effects were analyzed using ECO2, a building energy efficiency evaluation program. Optimal improvement measures are proposed, to reduce the economic burden on users by applying energy saving technologies. This study was conducted in four stages; in the first stage, using ECO2 software, five types of apartments were selected as standards among 46 complexes. Standard MDUs were selected if more than two factors were satisfied from among the following: (1) household type, (2) average exterior wall insulation and window performance, (3) average energy consumption and demand per unit area per year, (4) average applied facility system, and (5) average monthly energy demand per unit area. In the second stage, improvement factors were derived by analyzing the 10 most recent energy efficient MDU complexes. The third stage involved analysis of the energy saving effect generated by the improvement of windows and total heat exchangers in five selected complexes. Primary energy consumption per unit area per year improved from 158.8 to 132. kWh/m2y in complex E, which had been upgraded from ‘floor heating system’ to ‘total heat exchanger’. Finally, in the fourth stage, optimal improvement factors were selected for economic analysis. By simultaneously applying the optimal improvement factors, such as windows and total heat exchanger, to the M complex, primary energy consumption per unit area per year was improved from 147.6 to 111.4 kWh/m2 y. When optimal improvement factors were applied to 59 m2, 74 m2, 84 m2 types in complex M, life cycle cost savings of energy consumption for 30 years became $1384~1970.
1. Introduction
Given the global shortage of fossil fuel reserves and the emergence of climate change, increased attention is being devoted to greenhouse gas reduction and energy conservation [1,2]. In October 2021, the Republic of Korea deliberated and decided on the ‘2050 Carbon Neutral Scenario Plan’ and the ‘2030 Nationally Determined Contribution (NDC) Upgrade Plan’ [3,4]. As shown in Figure 1a, upgraded plans increased by 40% the total greenhouse gas emission reduction goal, compared with the previously established 2018 target [3,5]. In particular, the reduction target in the building sector was strengthened by 32.8% compared with the 2018 reduction rate, with the goal of reducing 35.0 million tons of CO2eq [3].
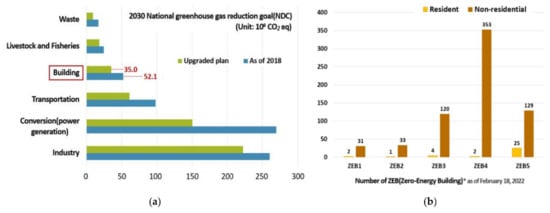
Figure 1.
(a) 2030 national greenhouse gas reduction goals (NDC) [3]; (b) Number of buildings certified as preliminary zero-energy buildings (ZEBs) [13].
In order to achieve the CO2 emission reduction target in the building sector, energy and eco-friendly buildings are being evaluated worldwide [6,7]. Each country has developed and utilized standard indicators and systems for evaluation of building energy efficiency [8,9].
To achieve the NDC upgrade plan within the building sector, various domestic incentives have been launched, including strengthening the energy efficiency ratings of new buildings, zero-energy building certification, energy diagnosis of existing buildings, and green remodeling businesses, and their standards are being upgraded [5,10,11,12].
Considering zero-energy buildings certified in recent years, there have been significantly fewer certification cases for residential buildings compared to nonresidential buildings, as shown in Figure 1b [13].
Currently, zero-energy building certification is mandatory for new buildings, but it is difficult to apply this rule to existing buildings [13,14]. In addition, based on an examination of building status in the domestic ‘building life history management system’ (Figure 2a), approximately 59% of buildings are older than 20 years [5,15,16]. With regard to the green remodeling project, which is being carried out in Korea to improve the energy ratings of existing buildings, support projects are actively being conducted, but it is difficult to evoke positive perceptions owing to the economic burden [17,18,19,20]. In particular, in terms of the energy consumption of buildings, it was observed that MDUs (multi-dwelling units) accounted for the highest proportion [20,21]. As shown in Figure 2b, based on energy consumption by building use in 2020 described in the ‘Green Together-Building Energy Statistics’, the average building energy consumption for MDUs in metropolitan areas is 33% or more [22]. It was also noted that MDUs accounted for 48% of the total energy consumed in Gyeonggi-do province [23].
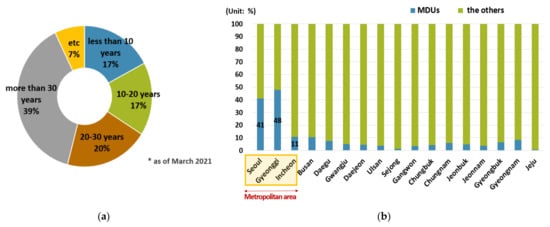
Figure 2.
(a) Age status of domestic buildings as of March 2021 [15,16]; (b) Comparison of energy consumption by region for MDUs and other uses [22].
As mentioned previously, policies and R&D for energy saving in buildings are expanding worldwide due to climate change and a decrease in fossil fuel reserves. In particular, various domestic incentives are being actively carried out to improve the energy use of buildings in Korea. However, the energy consumption of MDUs in the metropolitan area accounted for more than 33% of the total energy consumption by buildings in 2020. Therefore, research is needed to lower the energy consumption of MDUs in the metropolitan area. As shown in Table 1, this study presents suggestions for the improvement factors for MDU complexes with high energy consumption in metropolitan areas. To present reasonable results, standard materials and equipment elements that are currently applied to MDUs were studied. Futhermore, analysis of the improvement effects and proposals for optimal improvement factors to reduce the economic burden on users were also studied. Reduction of primary energy consumption per unit area per year, and life cycle cost savings, were compared when optimal improvement factors were applied to selected complexes.

Table 1.
Comparison of literature review.
2. Methods
This study was conducted on 46 MDUs that obtained building energy efficiency ratings and received permits between 2014 and 2015. To suggest elements for improvement in metropolitan areas, economic analysis was carried out for these MDUs [23]. In addition, 10 MDUs that obtained certifications and received building permits in 2021 were analyzed to select improvement factors with regard to applied materials and facilities [23]. As shown in the research methodology presented in Figure 3, the research process was divided into four stages; standard MDU selection using ECO2, standard MDU improvement factor selection, improvement factor application effect analysis and optimal improvement factor selection, and economic analysis of the optimal plan.
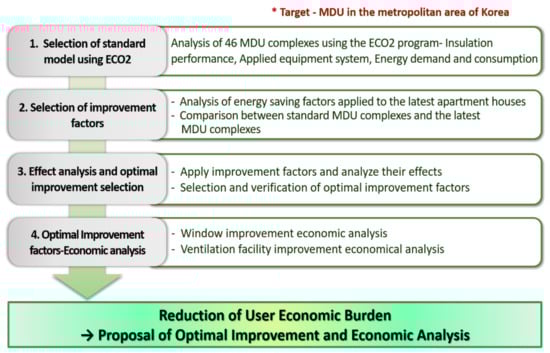
Figure 3.
Research methodology: selection of optimal improvement factors and economic analysis of MDUs in metropolitan areas of Korea, using the building energy assessment program ECO2.
3. Selection of Standard MDU Using ECO2
3.1. Definition of ECO2
From 1 September 2013, domestic building energy efficiency rating certifications have been issued to residential and nonresidential buildings that have been evaluated by the building energy evaluation program ECO2. [24,25]. The ECO2 program utilizes weather data of 13 regions in Korea in accordance with the ‘Rules for Building Energy Efficiency Rating Certification and Zero Energy Building Certification’. Energy consumption simulations are carried out for heating, cooling, hot water supply, lighting, ventilation, and new renewable systems. As a result, energy demand per unit area per year, energy consumption, and primary energy consumption are calculated [24,25,26,27]. ECO2 is a building energy consumption evaluation program based on the ISO 13790 and DIN 18599 [25,26,27,28]. The ECO2 program is mainly used for building energy evaluation, including zero energy building evaluation [29,30]. It is a program similar to Energy Plus, a dynamic analysis program that is widely used for building energy evaluation [31,32,33]. The ECO2 program was applied to MDUs between 2014 and 2015 [24,25].
3.2. Standard MDU
For selection of standard MDUs, the floor area, exterior wall insulation, window types, ventilation facilities, new and renewable energy facilities, energy demand, energy consumption, and primary energy consumption were analyzed for 46 MDU complexes that obtained building energy efficiency ratings in 2014 and 2015.
3.2.1. Floor Area
The floor areas of 46 complexes were analyzed, to study how area affects facility capacity, wall insulation, and window size. A total of 73 area types were applied to 46 complexes, with the smallest type being 11 m2 and largest type 273 m2. Figure 4 shows the results of the most frequently applied types across 46 complexes consisting of 46,398 households in total. After analyzing 46 complexes, the most applied types were 59 m2, 74 m2, and 84 m2. Among 46 complexes, 19 of them had 59 m2, 74 m2, and 84 m2 types.
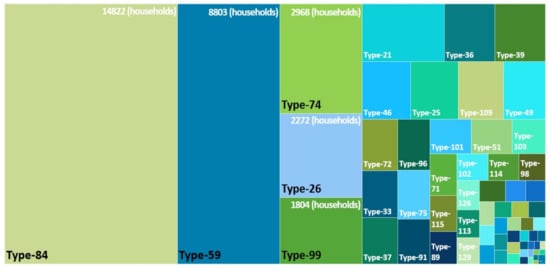
Figure 4.
Type distribution of 46,398 households in 46 complexes.
3.2.2. Insulation Performance and Facility Status
First, exterior wall insulation performance was studied to reveal how heating energy demand, heating energy consumption and primary energy consumption were affected [34]. Insulation materials and thermal conductivity applied to the exterior walls were investigated, as shown in Table 2. The most frequently applied exterior wall insulation in the 46 complexes was ‘bead method thermal insulation plate type 2 No. 2’.
Table 2.
Results of investigation on external wall insulation in 46 MDU complexes.
Then, as a result of examining window insulation performance [35,36], which affects insulation performance, heating energy demand, energy consumption and primary energy consumption of buildings, it was found that ‘air-injected low-e double-glazed windows (soft coating)’ were applied in 12 complexes. For balcony-extended windows, ‘argon-injected low-e double glazed (soft coating) + air-injected low-e double glazed (soft coating)’ were applied in 18 complexes.
Third, when analyzing heating systems, cooling systems, ventilation, and new and renewable systems for the facility application status analysis, cooling systems were excluded because these are the occupants’ responsibility. Among 46 MDU complexes surveyed, no complex had adopted the new and renewable system. As a result of the analysis of heating system status, it was found that 37 complexes used district heating. In ventilation system status analysis, 27 complexes used total heat exchangers which have the feature of ventilation energy recovery when exchanging indoor and outdoor air.
3.2.3. Annual Energy Demand, Energy Consumption and Primary Energy Consumption
Following ECO2 program analysis, results were obtained for annual energy demand, energy consumption, primary energy consumption, and CO2 generation, per unit area per year. Here, ‘energy demand’ means energy per unit area per year required for heating, cooling, hot water supply and lighting of a building; ‘energy consumption’ means energy per unit area per year consumed for heating, cooling, hot water supply, lighting, and ventilation [24,37]; ‘primary energy consumption’ is the standard for evaluating the building energy efficiency rating certification, referring to energy per unit area per year including energy conversion efficiency and losses in the fuel supply process [24,38,39]. Figure 5 shows the building energy efficiency rating certification grade, energy demand per unit area per year, energy consumption per unit area per year, and primary energy consumption per unit area per year for the 46 MDU complexes analyzed using the ECO2 program.
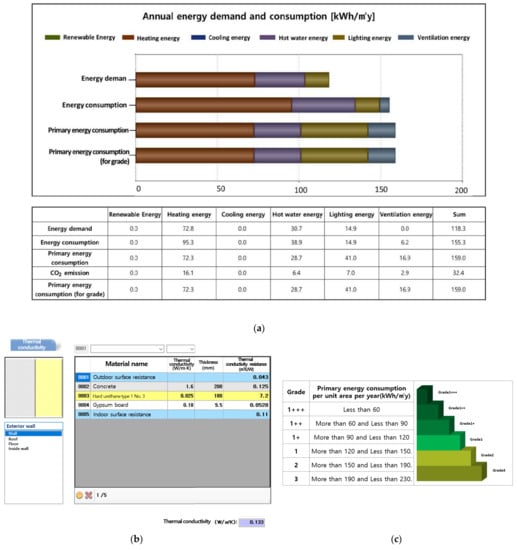
Figure 5.
Input and output of ECO2 program; (a) Analysis results: annual energy demand, energy consumption, and primary energy consumption (b) Input of external wall insulation (c) primary energy consumption per unit area per year by building energy efficiency grade.
According to the analysis of 46 MDUs, the average energy demand per unit area per year was 107.5 kWh/m2y, and the average energy consumption per unit area per year was 146.5 kWh/m2y. In addition, the average primary energy consumption per unit area per year was 150.7 kWh/m2y.
This corresponded to Grade 2 of the building energy efficiency grading system. Figure 5c shows the primary energy consumption per unit area per year for each energy efficiency grade.
3.2.4. Selection of Standard MDU Complex
Among the 46 MDU complexes, 19 complexes including 59 m2, 74 m2, and 84 m2 types were selected as standard groups due to their frequency of occurrence. Figure 6 shows five factors for selecting standard MDUs. Floor area, exterior wall and window insulation, energy demand and energy consumption, facility system, and monthly energy demand were analyzed. Among 19 MDUs, five complexes E, F, J, M, and P satisfied two or more of the five factors, and were selected as standard MDU complexes for this study.
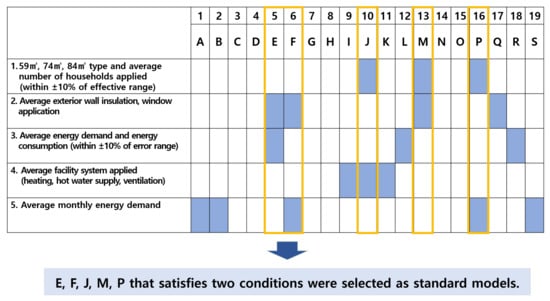
Figure 6.
The frequency analysis results showing occurrence of two or more of the five types of 1. TYPE, 2. exterior wall insulation, 3. windows, 4. ventilation, 5. energy demand and consumption, out of 46 MDU complexes.
4. Selection of Improvement Factors
In order to improve the energy efficiency of E, F, J, M, and P complexes, selected as standard MDUs, we analyzed the technology applied to the 10 latest MDUs that obtained building energy efficiency Grade 1+ or higher in 2021. Through this analysis, improvement factors were selected.
4.1. Energy-Saving Factors Applied to the Latest MDU Complexes
4.1.1. Insulation Performance and Facility System Status
Exterior wall insulation, window insulation, heating system, ventilation system, and new and renewable system application status were analyzed for 10 MDU complexes that obtained building energy efficiency grades of 1+ or higher. First, according to the analysis of exterior wall insulation, ‘hard urethane foam type 1 No. 3′ was applied to 9 complexes. ‘Hard urethane foam type 1 No. 3′ has a thermal conductivity of 0.025 W/m∙K. This thermal conductivity is less by 0.007 W/m∙K than the 0.032 W/m∙K of the ‘bead method warming plate type 2 No. 2′, which was the most frequently applied insulation across the 46 complexes [40,41,42,43]. Energy saving effects can be expected after improvement of exterior wall insulation. Second, in the case of windows, ‘argon injection-(low-e double-glazed glass + general double-glazed glass)’ was applied in five complexes. For balcony extension windows, ‘argon injection-(low-e double glazing + double glazing (soft coating))’ was applied in seven complexes. Third, heating systems, ventilation systems, and renewable systems were analyzed. District heating systems were applied in eight complexes. Total heat exchangers with energy recovery were applied in all 10 complexes. In terms of new and renewable systems, PV(photo voltaic) was applied in nine complexes.
4.1.2. Energy Demand, Energy Consumption and Primary Energy Consumption Analysis
The 10 selected MDU complexes that acquired certification in 2021 were analyzed using the ECO2 program. As a result, the average energy demand per unit area per year was found to be 74.5 kWh/m2y. The average energy consumption per unit area per year was 111.1 kWh/m2y. The average primary energy consumption per unit area per year was 102.9 kWh/m2y, which corresponded to building energy efficiency Grade 1+. Comparison of the average monthly heating energy demand per unit area of 10 MDUs certified in 2021 and 46 MDUs certified in 2014–2015 was analyzed, as shown in Table 3. Monthly average heating energy demand per unit area of MDU certified in 2021 was reduced by 1.7 kWh/m2 when compared to complexes certified during 2014 and 2015.
Table 3.
Comparison of monthly heating energy demand per unit area.
4.2. Analysis of Improvement Effect
Energy saving products including exterior wall insulation, windows, mechanical facility systems, and renewable systems applied to 10 MDUs certified in 2021 as Grade 1+ or higher were analyzed. These products were applied to standard models E, F, J, M and P to study their effects and also for selecting optimal improvement factors. In addition, to verify the effect of the improvement factors, the results of ECO2 simulation were compared with the actual measurements.
4.2.1. Effect of Exterior Wall Insulation Improvement
As a result of implementing exterior insulation material ‘hard urethane type 1 No. 3′ in E, F, J, M, and P MDU complexes, the P complex saw the most significant effect in reducing energy demand and energy consumption, as shown in Figure 7a. In the case of the P complex, with ‘bead method warming plate type 2 No. 3′, insulation applied in the past, the overall heat transfer coefficient of the exterior wall was 0.251 W/m2K, calculated as shown in Figure 7b. The overall heat transfer coefficient became 0.194 W/m2K, an improvement of 0.057 W/m2K. As a result of implementing higher exterior wall insulation in the P complex, the annual primary energy consumption reduction per unit area became 3.2 kWh/m2y.
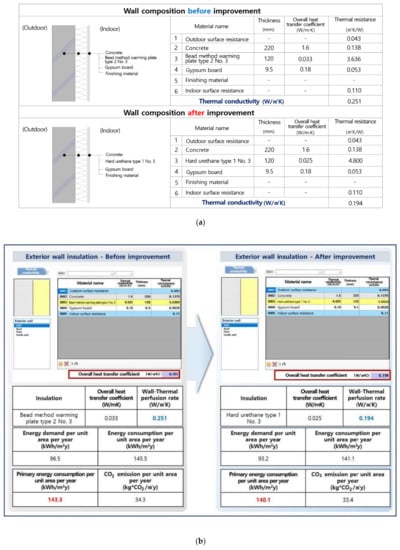
Figure 7.
ECO2 input for P complex. (a) Composition of exterior wall; (b) Exterior wall insulation.
Table 4 shows that the average annual primary energy consumption reduction per unit area for E, F, M, and P was 1.9 kWh/m2y. J complex was excluded since in this complex, ‘hard urethane type 2 No. 2’ which has higher performance than ‘hard urethane type 1 No. 3′ was already applied and thus required no further improvement.
Table 4.
Changes in energy demand and energy consumption of E, F, J, M, and P MDU complexes before and after exterior wall improvement.
4.2.2. Effect of Window Improvement
For recently built energy-saving MDUs, ‘argon injection low-e double-glazed windows (soft coating)’ with thermal conductance of 0.717 W/m2K were applied. To analyze the window improvement effect, inputs for the ECO2 program were carried out by dividing the window category into household windows and balcony extension windows. Figure 8a shows the ECO2 input conditions for balcony extension windows in the M complex, which showed the best result. In the case of the balcony extension type windows in the M complex, ‘argon injection low-e double-glazed (soft coating) + air-injected low-e double-glazed (soft coating)’ of 1.3 W/m2K was applied. As shown in Figure 8b, by applying air to one side of the filler, the thermal conductance of the improved window was reduced by 0.58 W/m2K compared to the old type [44,45,46]. As a result of the ECO2 analysis of E, F, J, M, and P complexes, the average annual primary energy consumption reduction per unit area per year after improvement was found to be 8.5 kWh/m2y, as shown in Table 5.
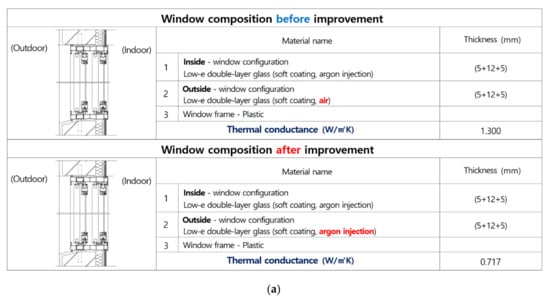
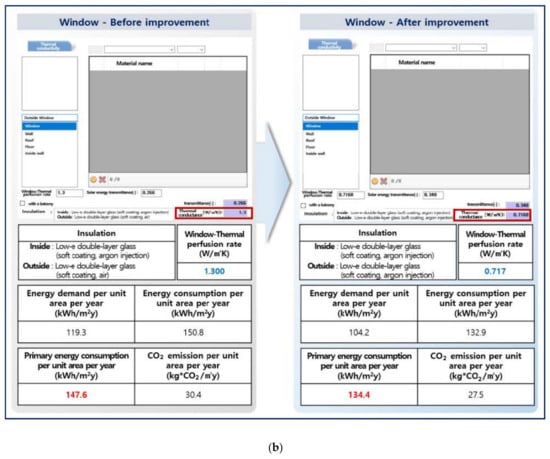
Figure 8.
(a) Window composition before and after improvement in M MDU; (b) Window input and simulation calculation results before and after ECO2 simulation window improvement in M MDU.
Table 5.
Changes in energy demand and energy consumption of E, F, J, M, and P MDUs before and after window improvement.
4.2.3. Effect of Ventilation System
For the ventilation systems in new energy-saving MDUs, 100 cmh (cubic meter per hour, m3/h) was applied to the 59 m2 type, and 150 cmh was applied to the 74 m2 and 84 m2 types. Heat recovery efficiencies applied to the 59 m2 type were heating 77% and cooling 60%, whereas those applied to the 74 m2 and 84 m2 types were heating 72% and cooling 59%. Figure 9a lists input values for the ECO2 program for analyzing the ventilation system improvement effect. Input factors were heat recovery rate (efficiency), air volume flow rate, fan power, and fan pressure loss [24]. Figure 9b shows the input conditions of the E complex which showed the best improvement result. In complex E, the ‘floor heat supply system’ was applied before the improvement. This is a system that supplies outdoor air to the inside of the house using floor heat [47]. If the floor heat supply system was replaced by total heat exchanger (ERV) used in new energy-saving MDUs, the primary energy consumption per unit area per year was reduced by 26.4 kWh/m2y.
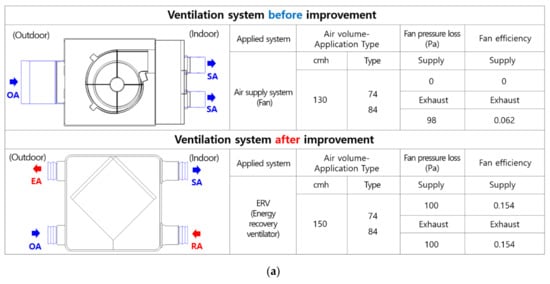
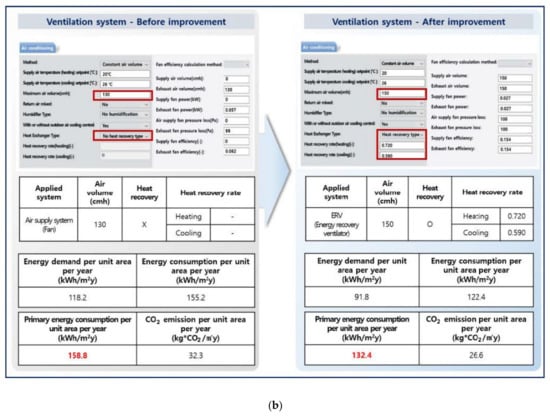
Figure 9.
(a) Composition of ventilation systems before and after improvement of MDU E; (b) Ventilation system input and simulation calculation results before and after improvement of ECO2 simulation MDU E.
For ventilation systems, total heat exchangers were applied to E, F, and M complexes. J and P complexes were excluded since they had already applied total heat exchangers (ERV) [48] with higher heat recovery efficiency than the ventilation systems of new energy-saving MDUs. Before improvement, the E complex applied an ‘underfloor air distribution system’, the F complex used a total heat exchanger (ERV) with a heat recovery rate of heating 72% and cooling 45%, and the M complex used a total heat exchanger (ERV) with air flow rates of 200 cmh and 300 cmh, twice as high as those of ERVs in new energy saving MDUs. By comparing before and after the improvements using the ECO2 program, the average primary energy consumption reduction per unit area per year was found to be 18.7 kWh/m2y, as shown in Table 6.
Table 6.
Changes in energy demand and energy consumption of E, F, J, M, and P MDU complexes before and after ventilation system improvement.
4.2.4. Effect of New and Renewable System
Among 10 MDU complexes that obtained building energy efficiency Grade 1+ or higher in 2021, 9 complexes installed solar PV modules on the roof. On the other hand, new and renewable systems were not applied to all of the standard model E, F, J, M, and P complexes before the improvement. For analysis of the application of the new and renewable systems, it was assumed that solar PV modules were installed on the roof by referring to the application status of 9 new energy-saving MDU complexes [47,48,49].
The average solar module capacity applied to the new energy saving MDU was a horizontal type with a nominal power output of 455 W per module. Available area for PV installation on the roof for each building of E, F, J, M, and P complexes for ECO2 simulation was calculated under the assumption that no other facilities existed on the roof [47,48,49].
Among E, F, J, M, and P complexes, the F complex showed best energy performance when solar PV system was installed, as shown in Figure 10, with primary energy consumption reduction per unit area per year of 2.5 kWh/m2y according to ECO2 simulation. In addition, by adoption of solar PV system the average primary energy consumption reduction per unit area per year of E, F, J, M, and P complexes was 2.3 kWh/m2y, as shown in Table 7.
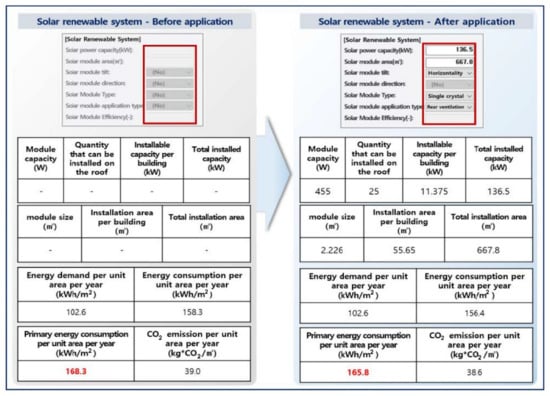
Figure 10.
Input and simulation results of ECO2 before and after application of solar PV renewable system in MDU F.
Table 7.
Changes in energy demand and energy consumption of E, F, J, M, and P MDU complexes before and after solar PV system application.
The effect of improving energy demand, energy consumption, and primary energy consumption by exterior wall-insulation material, window, ventilation system, and solar PV renewable systems showed a different energy saving effect for each improvement element. The factor with the highest reduction in primary energy consumption per unit area per year was the improvement of the ventilation system.
4.3. Selection and Verification of Optimal Improvement Factors
Figure 11 shows primary energy consumption per area per year after implementing four factors (exterior wall insulation material, windows, ventilation system, and solar PV renewable system) to E, F, J, M, and P complexes using the ECO2 program. Among the four factors, window and ventilation system improvement showed the best energy saving results. Thus, these two factors were selected as the optimal improvement factors. The energy saving effect of applying these two improvement factors simultaneously was further analyzed. In addition, for standard E, F, J, M, and P MDU complexes, it was determined whether the improvement satisfied 20% improvement of energy consumption, which is required to satisfy the criteria for Green Building Certification [50,51,52].
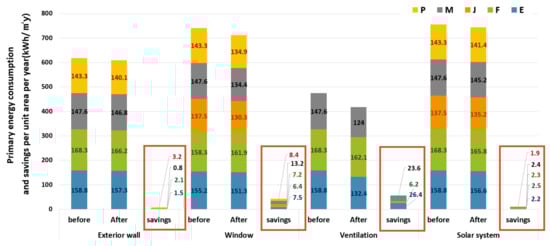
Figure 11.
Reduction in primary energy consumption per unit area per year by four improvement factors (kWh/m2y).
4.3.1. Improvement Effect by Applying the Optimal Improvement Factor
Figure 12 shows the improvement rate of energy demand and primary energy consumption per unit area per year by application of windows and ventilation facilities, which were selected as the optimal improvement factors. By applying improved ventilation systems, energy demand per unit area per year was reduced by 28.8% in the E complex. By applying improved windows, energy demand per unit area per year was reduced by 14.5% in the M complex.
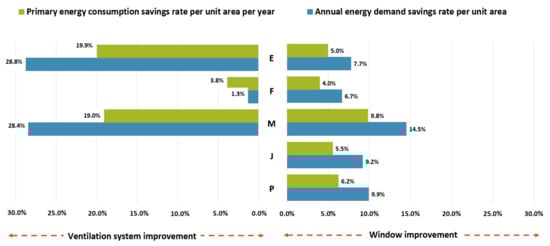
Figure 12.
Improvement rate (%) of primary energy consumption per area per year and energy demand per unit area, after simultaneous application of window and ventilation system improvements.
When both improved window and ventilation system were simultaneously applied to E, F, and M MDUs, average primary energy consumption reduction per unit area per year became 26.6 kWh/m2y, as shown in Table 8.
Table 8.
Changes in energy demand, energy consumption and primary energy consumption of E, F, and M MDU complexes before and after window and ventilation system improvement.
The reduction rate of primary energy consumption and the change in building energy efficiency rating after the simultaneous improvement of windows and ventilation systems can be viewed in Figure 13. The building energy efficiency rating of the E and M complexes was improved by one grade, and the primary energy consumption per unit area per year reduction rates were 26.8% for the E complex and 32.5% for the M complex. Complexes M and E met the condition of improving primary energy consumption by 20% per unit area per year, which is the standard for green building conversion in the ‘Energy Performance Improvement Standard for Existing Buildings’ [50].
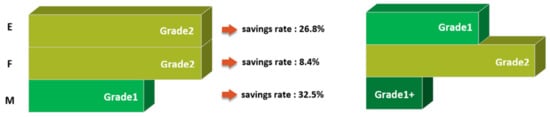
Figure 13.
The reduction rate of primary energy consumption per unit area per year and changes in building energy efficiency ratings, due to improvements in windows and ventilation systems.
4.3.2. Examples of Calibration through Verification
Comparison with the actual measurement results for heating energy consumption and ventilation energy consumption was carried out, to assess the reliability of the ECO2 simulation results for analyzing the improvement effect of windows and ventilation systems. Analysis showed these to be the most effective factors. Correction work was done to improve the reliability of the simulation results [53,54,55,56].
First, heating energy consumption before and after improvement were corrected as shown in Table 9, using ‘Comparison of heating energy consumption and actual usage in MDU by the Building Energy Efficiency Rating Program’ [55].
Table 9.
Results of applying the heating energy correction factor suggested in ‘Comparison of heating energy consumption and actual consumption of MDU by the Building Energy Efficiency Rating Program’ (application of the correction factor for the central region).
Second, to improve the reliability of the ECO2 analysis results for the application of total heat exchangers, the energy consumption was derived by changing the total heat exchangers applied in the study to natural ventilation. This was done by following the methodology in ‘Comparative Analysis of Energy Performance by Ventilation Systems in MDUs’ [56]. A correction factor of 4.22% was chosen to correct primary energy consumption of ventilation [56]. Table 10 shows the results of the primary energy consumption per unit area per year of E, F, M complexes, applying both the first heating energy correction factor and the second ventilation system correction factor.
Table 10.
Results of the correction of the primary energy consumption of the final E, F, and M complexes, applying the heating coefficient correction and the ventilation system correction factors.
Average primary energy consumption per unit area per year of E, F, M complexes before correction was 131.6 kWh/m2y. After applying corrections as suggested in [55,56], the value became 110.9 kWh/m2y. As the next stage of the study process, economic analysis was carried out.
5. Economic Analysis
To study the economic burden on users, the effects of windows and ventilation systems, which were selected as the optimal improvement factors, on annual energy cost and life cycle cost were analyzed [57,58,59]. For economic analysis of heating and electricity energy cost, 84 m2 of complex M, which showed the highest cost reduction after improvement, was analyzed. For life cycle cost analysis, annuity present value analysis was conducted using only energy cost [57,58,59].
5.1. Annual Energy Usage Fee Analysis
The annual energy cost analysis used district heating fuel consumption and electricity consumption derived from the ECO2 simulation. Primary energy consumption per unit area per year using district heating can be calculated by Equation (1).
The variables in Equation (1) are defined as follows:
: Annual primary energy consumption per unit area per year (kWh/m2y)
: Primary energy conversion factor for district heating (-)
: Annual district heating energy consumption (kWh/y)
: Total floor area of the MDU (m2)
Primary energy consumption per unit area per year using electricity can be calculated by Equation (2).
The variables in Equation (2) are defined as follows:
: Annual primary energy consumption per unit area per year (kWh/m2y)
2.75: Primary energy conversion factor for electricity (-)
: Annual power energy consumption (kWh/y)
: Total floor area of the MDU (m2)
Energy cost can be calculated with Equations (3) and (4). Cost of district heating energy can be calculated with Equation (3).
The variables in Equation (3) are defined as follows:
: District heating energy cost ($)
: Unit conversion factor (Mcal/kWh)
0.053: Unit cost of district heating energy ($/Mcal)
: Annual primary energy consumption per unit area per year (kWh/m2y)
: Floor area of house (m2)
: Basic fee additional factor (-)
Cost of electricity can be calculated with Equation (4).
The variables in Equation (4) are defined as follows:
: Electricity cost ($)
: Unit cost of electricity ($/kWh)
: Annual primary energy consumption per unit area per year (kWh/m2y)
: Floor area of house (m2)
: Basic cost additional factor ($)
Energy cost by primary energy consumption per unit area per year before and after improvement of the M complex was analyzed, as shown in Table 11 [60,61,62].
Table 11.
Energy cost of district heating energy and electricity for the M complex before and after improvement. (Currency: 1$≒1200 KRW, as of 7 January 2022).
Cost analysis based on primary energy consumption of heating and ventilation was carried out by referring to the heat cost table of the ‘Korea District Heating Corporation’ and electricity cost calculation standards of the ‘Korea Electric Power Corporation’ [60,61,62]. As a result, the 84 m2 type was calculated to return an annual profit of $82.9 if improvements were implemented.
5.2. Life Cycle Cost Analysis
Life cycle cost analysis was performed for 30 years of operation with implementation of energy saving windows and ventilation systems. Future costs were converted to present costs using a ‘present value method’ that considers annual cost increase. Annual energy cost increase of gas and electricity was assumed to be 1.53%, which was derived considering consumer price increase during 2012–2021 [57,58,59,63].
Annuity present value coefficient can be derived with Equation (5).
Variables in Equation (5) are defined as follows:
: Electricity cost ($)
: Average consumer price inflation rate from 2012 to 2021 (-)
In order to include construction cost to life cycle cost analysis when applying window and total heat exchanger improvements, product and construction costs of Companies A and B were collected. Product and installation costs are shown in Table 12.
Table 12.
Window and total heat exchanger installation and product costs. (Currency: 1$≒1200 KRW, As of 7 January 2022).
Based on M complex, profits for 30 years of use became $1385, $1736 and $1970 for types 59 m2, 74 m2, and 84 m2, respectively. As a result, it was confirmed that the construction costs were greater than the profit from energy saving (Table 13) [57,58,59,64].
Table 13.
Reflecting an average inflation rate of 1.53% for 2012–2021, life cycle cost analysis using annuity present value factor for 30 years. (Currency: 1$≒1200 KRW, as of 7 January 2022).
Table 14 shows the results of life cycle cost analysis reflecting the sharply increased inflation rate of 4.8% as of April 2022 [65]. As shown in Table 14, the energy saving benefits for 59 m2, 74 m2, and 84 m2 were $911, $1142, and $1296, respectively.
Table 14.
Reflecting the inflation rate of 4.8% as of April 2022, life cycle cost analysis using annuity present value factor for 30 years. (Currency: 1$≒1200 KRW, as of 7 January 2022).
6. Discussion
In this study, energy improvement factors and economic feasibility were analyzed for MDUs in the metropolitan areas of Korea, which account for 33% of the total energy consumption by buildings in 2020. This study was conducted on 46 MDU complexes that have obtained domestic building energy efficiency rating certification. Four factors were used to derive a standard apartment complex: (1) applied household type, (2) average exterior wall insulation and window performance, (3) average energy consumption and demand per unit area per year, (4) average applied facility system, and (5) average monthly energy demand per unit area. In the case of deriving improvement factors, 10 MDU complexes that recently acquired a building energy efficiency rating above Grade 1+ were targeted. Primary energy consumption comparison analysis and economic feasibility analysis were conducted by applying the improvement factors to the standard MDU complexes using the ECO2 program.
This study is a case study applied to domestic MDU complexes, and is limited in the extent to which it can reflect various renewable energy systems [66,67,68]. Using present value method economic analysis, this study has found a limit to the profit obtained only from energy saving when compared to construction costs [67,68]. Therefore, future studies are necessary to analyse diverse renewable energy systems, and it is important that their calculations include change in asset values after improvements are made.
7. Conclusions
In this study, analysis was conducted by using ECO2, a building energy efficiency rating program, to present improvement factors for MDU complexes with high energy consumption in the metropolitan areas of Korea, to reduce the economic burden on users. Factor effects and energy costs were analyzed; in particular, standard complexes were identified, by analyzing buildings with building energy efficiency ratings from 2014 to 2015, and energy improvement factors were derived by analyzing buildings that obtained building energy efficiency ratings of Grade 1+ or higher in 2021 after the strengthening of domestic building energy standards. By applying the improvement factors to the standard complex, the energy cost was derived from the primary energy consumption before and after the improvement of the ECO2 program results. Life cycle cost analysis was also carried out, using the present value method.
- (1)
- As a result of analyzing 46 MDU complexes that obtained building energy efficiency rating certification from 2014 to 2015, the average energy demand per unit area per year was found to be 107.5 kWh/m2, the average energy consumption per unit area per year was 146.5 kWh/m2, the average primary energy consumption per unit area per year was 150.7 kWh/m2. The building energy efficiency rating was analyzed to correspond to an average of Grade 2.
- (2)
- The monthly heating energy requirement per unit area was analyzed, revealing that the monthly average heating energy demand of new energy saving MDUs in 2021 was reduced by 1.7 kWh/m2y compared to MDUs certified in 2014–2015.
- (3)
- As a result of analyzing the primary energy consumption reduction rate due to the simultaneous improvement of windows and ventilation systems, the building energy efficiency ratings of E and M complexes were improved by one grade. The reduction rate of primary energy consumption was analyzed as 26.8% for E complex and 32.5% for M complex.
- (4)
- As a result of life cycle cost analysis using the present value method for 30 years, it was confirmed that a profit of $1384.6~$1970.5 was acquired for M complex, which had undergone simultaneous improvement of the windows and ventilation system.
In this study, life cycle cost analysis for energy consumption was presented; for future research, we plan to include demolition costs as well as product and construction costs. Furthermore, to improve life cycle analysis, we plan to continue research on increases in asset costs if improvements are implemented.
Author Contributions
Conceptualization, K.-W.L.; methodology, K.-W.L.; experiment, K.-W.L.; software, K.-W.L.; validation, Y.I.K.; formal analysis, K.-W.L.; investigation, K.-W.L.; resources, K.-W.L.; data curation, K.-W.L.; writing—original draft preparation, K.-W.L.; writing—review and editing, Y.I.K.; visualization, K.-W.L.; supervision, Y.I.K.; project administration, Y.I.K.; funding acquisition, K.-W.L. All authors have read and agreed to the published version of the manuscript.
Funding
This study was supported by the Research Program funded by the SeoulTech (Seoul National University of Science and Technology).
Institutional Review Board Statement
Not applicable.
Informed Consent Statement
Not applicable.
Conflicts of Interest
The authors declare no conflict of interest.
References
- Park, Y.-G. Energy Policy Trends and Implications of Major Countries in the World; Korea Rural Economic Institute: Naju, Korea, 2015. [Google Scholar]
- Ministry of Environment. New Climate System after Kyoto Protocol Guide to the Paris Agreement; Ministry of Environment: Sejong City, Korea, 2016.
- 2050 Carbon Neutral Committee. 2030 National Greenhouse Gas Reduction Goal (NDC) Amendment. Available online: https://www.2050cnc.go.kr/base/board/read?boardManagementNo=4&boardNo=100&searchCategory=&page=1&searchType=&searchWord=&menuLevel=2&menuNo=15 (accessed on 18 October 2021).
- Kwon, P.-S.; Kim, S.-J. Scenario Analysis for the Achievement of the 2030 National Greenhouse Gas Reduction Goal in the Korean Electricity Sector. Korea Environ. Policy Adm. Soc. 2017, 25, 129–163. [Google Scholar]
- MOLIT, the 2nd Green Building Master Plan in Korea; Ministry of Land, Infrastructure and Transport: Sejong City, Korea, 2019.
- Airaksinen, M.; Matilainen, P. A carbon footprint of an office building. Energies 2011, 4, 1197–1210. [Google Scholar] [CrossRef]
- Acquaye, A.A.; Duffy, A.P.; Basu, B. Stochastic hybrid embodied CO2-eq analysis: An application to the Irish apartment building sector. Energy Build. 2011, 43, 1295–1303. [Google Scholar] [CrossRef]
- Birgisdottir, H.; Moncaster, A.; Wiberg, A.H.; Chae, C.; Yokoyama, K.; Balouktsi, M.; Malmqvist, T. IEA EBC annex 57 ‘evaluation of embodied energy and CO2eq for building construction’. Energy Build. 2017, 154, 72–80. [Google Scholar] [CrossRef]
- Zhang, Y.; Wang, J.; Hu, F.; Wang, Y. Comparison of evaluation standards for green building in China, Britain, United States. Renew. Sustain. Energy Rev. 2017, 68, 262–271. [Google Scholar] [CrossRef]
- Jeong, K.-B. Policies and Research Trends related to Green Remodeling. J. Korea Inst. Constr. Eng. Manag. 2021, 22, 32–35. [Google Scholar]
- Choi, M.-J.; Jeon, J.-W.; Lee, D.-H. The Analysis of Energy Performance for Certification Case of Zero Energy Building through Green Remodeling in Korea. J. Korean Inst. Arch. Sustain. Environ. Build. Sys. 2021, 15, 213–223. [Google Scholar]
- Lee, H.-J.; Kim, I.-S. A Study on the Issues and Trends of Zero Energy Policy. J. Energy Eng. 2020, 29, 79–84. [Google Scholar]
- Zero Energy Building. Available online: https://zeb.energy.or.kr/BC/BC03/BC03_06_001.do (accessed on 18 February 2022).
- Korea Heating, Air-Conditioning, Refrigeration & Renewable Energy News. Available online: http://www.kharn.kr/mobile/article.html?no=17680 (accessed on 31 October 2021).
- Building Life History Management System, Building Statistics. Available online: https://blcm.go.kr/stat/customizedStatic/CustomizedStaticSttst.do (accessed on 30 November 2021).
- Ministry of Land, Infrastructure and Transport, Existing Building Status. Available online: https://www.molit.go.kr/USR/NEWS/m_71/dtl.jsp?lcmspage=1&id=95085286 (accessed on 30 November 2021).
- Yoo, J.-H.; Lee, J.-G.; Kim, B.-J.; Bang, S.-K. A Study on the Improvement of Interest Support Program for Activating Green Remodeling Business. J. Archit. Inst. Korea Struct. Constr. 2019, 35, 147–152. [Google Scholar]
- Kim, S.-R.; Ahn, Y.-H. Identifying Drivers Influencing Green Remodeling Project in the Perspective of Participant. Archit. Inst. Korea Acad. Conf. 2018, 38, 696–699. [Google Scholar]
- Lee, Y.-Y.; Koo, B.-K.; Lee, K.-H. A Study on Policy Alternatives for Activating Green Remodeling of the Existing Building. J. Korean Inst. Arch. Sustain. Environ. Build. Sys. 2015, 9, 151–156. [Google Scholar]
- Nam, S.-H.; Kim, K.-R. The Study on the Project Delivery System for Vitalizing the Green Remodeling. J. Korea Inst. Constr. Eng. Manag. 2017, 18, 3–11. [Google Scholar]
- Ministry of Land, Infrastructure and Transport. Available online: http://www.molit.go.kr/USR/NEWS/m_71/dtl.jsp?lcmspage=7&id=95085598 (accessed on 30 November 2021).
- Main Purpose Building Energy Consumption Statistics. Available online: https://www.greentogether.go.kr/sta/sta010101.do (accessed on 30 November 2021).
- Building Energy Efficiency Rating System. Available online: https://beec.energy.or.kr/BC/BC04/BC04_04_001.do (accessed on 30 November 2021).
- Kim, T.-Y.; Kim, Y.-H.; Hwang, J.-H. Comparison of Primary Energy Requirement of Neighborhood Facilities according to Heat Source Types and Window Wall Ratio by Usage Purpose. J. Korean Inst. Arch. Sustain. Environ. Build. Sys. 2017, 11, 425–439. [Google Scholar]
- Korea Energy Agency. Building Energy Evaluation Program. Available online: https://www.energy.or.kr/web/kem_home_new/info/data/open/kem_view.asp?q=22116 (accessed on 30 November 2021).
- Ministry of Land, Infrastructure and Transport, Regulations on Building Energy Efficiency Rating Certification and Zero Energy Building Certification, Ministry of Land, Infrastructure and Transport Ordinance No. 878.
- Jeon, S.-M.; Choi, G.-S.; Kang, J.-S. A Method for the Classification of Calculation Method for Energy Consumption of School Buildings on ECO2 Software. In Proceedings of the 2019 SAREK Summer Annual Conference, Yongpyong, Korea, 25–28 June 2019; pp. 509–512. [Google Scholar]
- Park, S.-M.; Song, D.-S. Validation of Building Heat capacity on Building Energy Rating Evaluation Program in Korea. In Proceedings of the 2020 SAREK Summer Annual Conference, Pyeongchang, Korea, 21–23 June 2020; pp. 37–40. [Google Scholar]
- Kim, Y.; Yu, K.H. Study on the certification policy of zero-energy buildings in Korea. Sustainability 2020, 12, 5172. [Google Scholar] [CrossRef]
- Choi, B.E.; Shin, J.H.; Lee, J.H.; Kim, S.S.; Cho, Y.H. Establishment of passive energy conservation measure and economic evaluation of fenestration system in nonresidential building of Korea. Int. J. Polym. Sci. 2017, 2017. [Google Scholar] [CrossRef]
- Jradi, M. Dynamic Energy Modelling as an Alternative Approach for Reducing Performance Gaps in Retrofitted Schools in Denmark. Appl. Sci. 2020, 10, 7862. [Google Scholar] [CrossRef]
- No, S.T.; Kim, J.Y. A Comparison of Detailed and Simple Building Energy Analysis Tools for Eco–Friendly Office Building Design. In Applied Mechanics and Materials; Trans Tech Publications Ltd.: Freienbach, Switzerland, 2012; Volume 178, pp. 3–6. [Google Scholar]
- Kwon, J.H.; Jang, H.I.; Kim, M.K.; Park, H.S.; Suh, S.J. Comparison on the Annual Energy Demand by Building Energy Assessment Tool and Dynamic Energy Simulation. In Proceedings of the 2012 SAREK Summer Annual Conference, Yongpyong, Korea, 27–29 June 2012; pp. 363–366. [Google Scholar]
- Kim, M.-K.; Park, H.-S.; Song, K.-D. Evaluation and Analysis of Building Energy Rating System According to Insulation Performance of Building Envelope in Regional and Building Form of Apartment House. J. Korean SAREK 2013, 25, 49–54. [Google Scholar]
- Lee, D.-H.; Yoon, J.-H.; Lee, K.-W.; Seo, M.-G. Heating Energy Performance of Heated Glass According to Insulation Level of the Residential Building. J. Korean Sol. Energy Soc. 2021, 41, 73–84. [Google Scholar] [CrossRef]
- Kim, S.-B.; Lee, S.-Y.; Kim, S.-H.; Park, K.-Y.; Choi, W.-K. Correlation between Insulation and Energy of Windows in Apartment. In Proceedings of the 2017 SAREK Summer Annual Conference, Yongpyong, Korea, 26–28 June 2017; pp. 615–618. [Google Scholar]
- Passive House Institute Korea. Available online: http://www.phiko.kr/bbs/board.php?bo_table=z3_01&wr_id=5 (accessed on 30 December 2021).
- Ministry of Land, Infrastructure and Transport. Ministry of Land, Infrastructure and Transport Notice No. 878, Attachment 1. Available online: https://www.law.go.kr/admRulLsInfoP.do?chrClsCd=010202&admRulSeq=2100000073970#AJAX (accessed on 24 May 2022).
- Ministry of Land, Infrastructure and Transport. Ministry of Land, Infrastructure and Transport Notice No. 878, Attachment 2. Available online: https://www.law.go.kr/admRulLsInfoP.do?chrClsCd=010202&admRulSeq=2100000073970#AJAX (accessed on 24 May 2022).
- Kim, H.-S.; Yun, H.-D.; Byun, W.-S. A Study on the Evaluation of Apartment Building Energy Efficiency Rating Considering the Performance of Thermal Insulators and Window glasses. In Proceedings of the 2009 SAREK Summer Annual Conference, Yongpyong, Korea, 26–28 June 2009; pp. 706–711. [Google Scholar]
- Hyun, J.-H.; Hong, S.-H.; Park, H.-S.; Choi, M.-H. Study on High Performance Building Envelope for raising Building Energy Rating. In Proceedings of the 2008 SAREK Summer Annual Conference, Yongpyong, Korea, 26–28 June 2008; pp. 801–806. [Google Scholar]
- Cha, S.-G. Energy Saving Technology of Building Envelope; Korea Institute of Science and Technology Information: Daejeon, Korea, 2011. [Google Scholar]
- Jo, H.-P.; Oh, J.-H.; Kim, S.-S. A Study on the Target Parts for Envelope Remodeling Prototype to Improve Thermal Performance of Old Multi-family Residential Buildings. J. Korean Inst. Archit. Sustain. Environ. Build. Syst. 2017, 2, 52–57. [Google Scholar]
- Kim, C.-B.; Park, J.-U.; Kim, K.-S.; Lee, E.-J. Optimum Window Selection through Building Energy Performance Simulation. In Proceedings of the 1998 SAREK Summer Annual Conference, Yongpyong, Korea, 26–27 June 1998; pp. 1241–1246. [Google Scholar]
- Park, M.-S.; Kang, I.-K.; Lee, D.-W.; Cho, Y.-J.; Liu, J.; Lee, J.-H. U-value Characteristics of Window in Residential Building with the Variation of Specification. In Proceedings of the 1997 SAREK Summer Annual Conference, Yongpyong, Korea, 20–21 June 1997; pp. 132–138. [Google Scholar]
- Lee, J.-S.; Cho, S.; Jang, M.-S.; Jang, C.-Y.; Yoo, S.-W. Research about Thermal Performances of Windows and Doors System by Glass Association. In Proceedings of the 2002 SAREK Summer Annual Conference, Pyeongchang, Korea, 21–23 June 1998; pp. 1241–1246. [Google Scholar]
- Lee, K.-R.; Lee, Y.-S.; Lim, J.-H. An Analysis of the Shadow Influence of Roof-top Structure on Output Power of Photovoltaic System Mounted on Apartment Buildings. In Proceedings of the 2018 Architectural Institute of Korea Autumn Annual Conference, Pyeongchang, Korea, 23–26 October 2018; pp. 258–261. [Google Scholar]
- Lee, K.-R.; Lee, Y.-S.; Lim, J.-H. Evaluation on the Photovoltaic Module Arrangement Planning Considering Shading Conditions in Apartment Buildings. J. Arch. Inst. Korea Struct. Constr. 2019, 5, 169–179. [Google Scholar]
- Won, J.-H.; Tae, Y.-R. A Study on the Capacity Estimation of Photovoltaic System Applied to Multi-Unit Dwelling by Zero Energy Building Certification Grade. J. Korean Inst. Archit. Sustain. Environ. Build. Syst. 2021, 6, 279–288. [Google Scholar]
- Ministry of Land, Infrastructure and Transport. Energy Performance Improvement Standards of Existing Buildings. Ministry of Land, Infrastructure and Transport Notice No. 2021-322.
- Jeong, H.-S.; Byeon, I.-H.; Kim, W.-Y. A Improvement of Energy Efficient Ratings for Public Buildings. In Proceedings of the KIEE Conference; The Korean Institute of Electrical Engineers: Seoul, Korea, 2011; Volume 7, pp. 2097–2098. [Google Scholar]
- Korea Institute of Construction Technology. A Study for Standardization of Quantitative Evaluation Methods for Building Energy Performance; Ministry of Transportation: Sejong City, Korea, 2014.
- Jung, S.-H. A Study to Improve the Evaluating Tool for Based on Comparison between Actual Energy Use and Tool Result; Seoul National University of Science and Technology: Seoul, Korea, 2016. [Google Scholar]
- Jeon, B.-K.; Park, C.-Y.; Jang, H.-I.; Choi, S.-W.; Kang, M.-G.; Kim, E.-J. Comparison of ECO2 Results using Calibrated Input Data Pertaining to Room Operating Conditions. J. Korean Inst. Archit. Sustain. Environ. Build. Syst. 2018, 12, 223–234. [Google Scholar]
- Lee, A.-R.; Kim, J.-G.; Kim, J.-H.; Jeong, H.-G.; Jang, C.-Y.; Song, K.-D. Comparing the actual heating energy with calculated energy by the amended standard building energy rating system for apartment buildings. J. Korea Inst. Ecol. Archit. Environ. 2015, 15, 103–107. [Google Scholar]
- Kim, G.-T.; Chun, C.-Y.; Kim, S.-D. A Comparative Analysis of Energy Performance according to the Ventilation System in Apartment House. J. LHI 2015, 6, 215–220. [Google Scholar]
- Jung, S.-S. A Study on the Cost Breakdown Structure for Life Cycle Cost of Individual Air Conditioning system and Central Air Conditioning system. J. Archit. Insitute Korea Plan. Des. 2004, 20, 277–284. [Google Scholar]
- Jung, S.-S. A Study on the Development of Life Cycle Cost Analysis Methodology in HVAC system for Decision Maker. J. Korean Sol. Energy Soc. 2004, 12, 55–63. [Google Scholar]
- Kim, Y.-D.; Cha, H.-S.; Kim, K.-R.; Shin, D.-W. Evaluation Method of Green Construction Technologies Using Integrated LCC and LCA Analysis. J. Korea Inst. Constr. Eng. Manag. 2011, 12, 91–100. [Google Scholar]
- Korea Energy Statistical Information System, Energy Conversion Factor. Available online: http://www.kesis.net/sub/sub_EnergyChange.jsp (accessed on 30 December 2021).
- Korea District Heating Corporation. District Heating and Heating Fee Table. Available online: https://www.kdhc.co.kr/cyb/Cy_Content/CM2017.do (accessed on 30 December 2021).
- Korea Electric Power Corporation. Electricity Usage Rates for Houses. Available online: https://cyber.kepco.co.kr/ckepco/front/jsp/CY/E/E/CYEEHP00101.jsp (accessed on 30 December 2021).
- National Indicator System, Consumer Price Inflation. Available online: https://www.index.go.kr/unify/idx-info.do?idxCd=4226 (accessed on 30 December 2021).
- Korea Housing Finance Corporation Housing Finance Research Institute. 2020 Housing Finance Insight Report; Korea Housing Finance Corporation: Seoul, Korea, 2020. [Google Scholar]
- Consumer Price Index by Month for 2022. Available online: https://kostat.go.kr/incomeNcpi/cpi/cpi_td/2/1/index.action?bmode=cpidtval (accessed on 14 May 2022).
- Hong, G.-P.; Kim, H.-G. Improvements and Limits to Achieve Zero Energy Building Certification for Multi-Family Residential Buildings. In Proceedings of the Korean Society for Solar Energy Conference, Seoul, Korea, 23–25 October 2019; p. 41. [Google Scholar]
- Kim, M.-Y.; Kim, H.-g.; Hong, G.-P. Optimal-Design Process for Residential Buildings to Implement Obligatory Renewable Energy Service Ratio in Green Building Design Criteria, Seoul Metropolitan Government. KIEAE J. 2018, 18, 39–45. [Google Scholar]
- Park, J.-W.; Yoon, J.-H.; Kwak, H.-Y.; Lee, J.-B.; Shin, U. A study on building energy demand for design of energy system on green home apartment. J. Korean Sol. Energy Soc. 2013, 33, 24–31. [Google Scholar] [CrossRef][Green Version]
Publisher’s Note: MDPI stays neutral with regard to jurisdictional claims in published maps and institutional affiliations. |
© 2022 by the authors. Licensee MDPI, Basel, Switzerland. This article is an open access article distributed under the terms and conditions of the Creative Commons Attribution (CC BY) license (https://creativecommons.org/licenses/by/4.0/).