1. Introduction
The role and importance of households in the electricity market have changed in recent years, as electricity consumers are shifting from being passive consumers to becoming active market participants. Regardless of whether the household consumer is becoming a prosumer or prevailing just on the consumption side, there are several behavioral aspects through which consumers can encourage the electricity system to become more intelligent and environmentally-friendly. This new role for consumers in the energy markets can be derived from EU directives that aim toward carbon neutrality. The purpose of these directives is to promote and encourage the participation of electricity consumers in the energy transition through new and innovation services, which enable money savings and contribute to the overall reduction in the energy consumption [
1] and to empower the consumers by providing them with information on their energy use, related costs, and easy access to a competitive market of any materials and products that can help improve their energy efficiency [
2]. The basic requirement behind the consumers’ changed role is their awakening, thus becoming aware of their electricity consumption habits.
Carbon neutrality signifies that only as much carbon dioxide should be released into the atmosphere as can be removed from the atmosphere. The goals and objectives for carbon neutrality are set at the EU level with the help of directives and are implemented by each country with the help of laws, regulations, and restrictions. Household consumers cannot affect carbon neutrality directly, but they can do so indirectly by changing and rationalizing their energy consumption, thereby acting more energy efficient. The electricity demand of household consumers in 2019 accounted for 28% of the total electricity demand in Finland [
3]. Therefore, consumers have great potential to contribute to the energy saving. New markets are already emerging in the energy domain that enable the participation of consumers by providing their houses, real properties, and heat pumps as energy resources. This kind of resource aggregation supports demand flexibility [
4], which has become evitable as energy systems are increasingly based on variable renewable energy sources such as solar and wind, according to which the energy consumption must be adapted. From the viewpoint of the electricity consumer, supporting demand flexibility means timing the consumption on the basis of some external signal, in other words, heating the house or water, going to sauna or washing the laundry at different times, depending on the situation on the markets. The energy consumption behavior of people is generally dictated by lifestyle [
5] (i.e., how and when to consume energy) and the energy culture [
6] (i.e., diversity of values, beliefs, knowledge, and practice) [
7]. The awareness of people of their electricity consumption habits is growing with the help from information provided about the environment and their own electricity consumption. This awareness enables them to rationalize their electricity consumption and thereby direct their consumption behavior toward carbon neutrality goals.
In this paper, we defined awareness, according to [
8,
9], as being a capability of the consumer to understand the electricity consumption time, costs and prices, and to realize why, when, and how to reduce their energy consumption. According to Kažukauskas and Broberg [
10], consumers typically base their decisions regarding the usage of electricity on poor knowledge about the costs, and the cost perceptions are often upwardly estimated and are generally higher among unaware consumers. Consumers with a high awareness of their electricity bills, prices, and costs tend to reduce their electricity consumption [
8,
9,
11,
12,
13]. According to Rosak-Szyrocka and Zywiolek [
14], although consumers may be well aware of the factors that influence the increase in energy consumption, they may still not understand the rationale behind energy saving and its impact on the environment. Good environmental knowledge does not necessarily lead to more positive attitudes and behaviors regarding conserving energy [
15]. The behavior of consumers is often far from the purely rational, so they act in a way that fails to align with their knowledge, values, attitudes, and intentions: the behavior is often driven by cognitive biases, heuristics, and other irrational tendencies, and there is a lack of a relationship between knowledge and attitudes, and between knowledge and behavior [
15,
16]. For example, consumers with poor knowledge about their energy consumption are often not willing to receive information about their own energy usage and costs [
10]. It has also been found that the effect of real-time data on reducing consumption diminishes over time [
12]. Therefore, behavioral-level motivation and consumer engagement is needed to activate behavioral change.
Environmental issues are constantly being addressed in the world, and an increasing amount of data is available for consumers about the environmental effects of energy consumption. Therefore, consumers should have had a good chance to acquire and receive information and become aware of their electricity consumption habits. Consumption behavior and energy awareness have been the subjects of several studies [
8,
9,
10,
11,
12,
13,
14,
15,
16]. Only a few studies in Finland have evaluated these kinds of social factors. Trotta [
8] examined the electricity awareness of Finnish households concerning their electricity bills, prices (summertime, wintertime), and operating costs (e.g., dishwashers, ovens). Ruokamo et al. [
17] analyzed the household preferences toward dynamic electricity price contracts. They also analyzed the consumers’ willingness to change their behavior based on emission reductions. Ruokamo et al. [
18] evaluated the impacts of information nudges on the residential electricity consumption and found that the information channel and peer effects could have significant impacts on behavioral change. The existing studies did not enable universal results to form that could be easily compared and generalized to other occasions. This paper had a cross-domain viewpoint that combined the energy domain with social factors and human behavior, aiming to understand the rationale behind the consumers’ energy consumption behavior. The purpose was to evaluate the awareness of individual consumers on energy-related issues and their consciousness of their own energy consumption behavior and its effect on the environment. To achieve this goal, a comprehensive consumer survey was designed and implemented. The research utilized existing key performance indicators (KPIs) that arise from the social viewpoint, determines the criteria for their evaluation, and evaluates them from the consumers’ behavior viewpoint. The evaluation revealed the consumers’ every-day behavior, general attitudes, and beliefs that are typically general of the whole area (country) (i.e., people’s lifestyle and culture). The main advantage of utilizing the KPI approach is that the evaluated KPIs provide a universal description of the status of the consumers’ energy awareness and their engagement in supporting the environment. In addition, they can be easily used together with the technical KPIs to construct a larger evaluation from several perspectives.
The rest of this paper is structured as organized as follows.
Section 2 describes the background of this research; the drivers for consumer involvement, the potential, and status of demand flexibility in Finland; and the earlier work on evaluating the social factors in the energy domain.
Section 3 presents the design and implementation of this research, with an emphasis on the qualitative method to achieve the residents’ viewpoint. The results of the survey are introduced in
Section 4, and the key points of the results are discussed in
Section 5. Finally, our conclusions are presented in
Section 6.
3. Design and Implementation of the Research
The research was implemented in the H2020 MAKING-CITY project, (
https://makingcity.eu/, accessed on 1 November 2021), which is a 60-month Horizon 2020 project launched in December 2018, consisting of 34 partners from 11 countries in Europe. Its main target is to address and demonstrate the urban energy system transformation toward smart and low-carbon cities. The project analyzed the performance of a certain district from a technical, social, and economic point of view, and this research concentrated on the social perspective.
Social factors can be analyzed by both quantitative and qualitative methodologies. The qualitative research can be used to better understand human behavior in different contexts and situations, to adapt to unexpected situations, and to focus on collecting data to describe certain topics, consisting of descriptions, attitudes, and opinions. Therefore, a qualitative research approach was chosen to capture the electricity consumers’ awareness of their own energy consumption behavior and its effect on the environment as well as their intentions to change their behavior to support the carbon neutrality goals.
Qualitative research methods such as interviews, case studies, focus groups, and observations provide different means for interaction between the researchers and the research target. Conversational techniques such as interviews, workshops, and surveys provide a means in which to extract data from people’s verbalized response. The selection of method depends on the type of respondent, the number of responses required, and the ability to ask predetermined questions. A survey research method was chosen for the data collection from electricity consumers, as surveys enable standardized data collection, ensuring that the same data are collected from each respondent. Survey methods are applicable to studying social phenomena, helping to understand people, their motives, and actions [
59]. Surveys can also be used to ask questions about their opinions, attitudes, beliefs, and personal preferences [
60]. A cross-sectional survey approach enables the collection of insights and opinions from respondents during a particular time interval. This survey method was seen to be the most applicable for this study because it can be used in both quantitative and qualitative research, which in this case was necessary. The quantitative research here focused on collecting hard facts such as numbers and percentages, whereas the qualitative research focused on collecting data that describes certain topics consisting of the descriptions, attitudes, and opinions of electricity consumers.
The research method consisted of four phases (see
Figure 1). The phases are described in more detail in the following sub-sections.
3.1. Context Definition
The main context of the research was the residents’ awareness of their own electricity consumption behavior. The goal was to evaluate their awareness and their willingness to support environmental goals. Therefore, the selected KPIs for the research needed to support the evaluation of the social factors in the energy domain: energy awareness and the behavior of the residents in support of achieving carbon neutrality. The existing works on KPIs such as [
42,
43,
44] were utilized in the context definition. However, the definitions of the existing KPIs are highly quantitative, which is not very compatible with the qualitative approach of this research. Here, the purpose was to keep the indicators close to the consumers’ everyday life practices and things and terms that were familiar to them. Therefore, the definition of the KPIs had to be made from a qualitative, people-oriented perspective. The KPI definition process consisted of the following phases: (1) structuring the evaluation framework by preparing a draft list of KPIs within the categories of Social and Residents, Society and Citizens, and Governance; (2) defining the evaluation procedure and scale to evaluate the KPIs; and (3) the validation of the indicators by reviewing the included indicators in terms of feasibility, relevance, evaluation boundaries, data sources, and methodological approaches. The three identified categories were found to be those most closely influencing consumption behavior. The Social and Residents category refers directly to the consumer’s own habits and attitudes, whereas the Society and Citizens category refers to the national norms and culture, but also to the practices and regulations in the energy domain. The last category refers to the role and impact of government. These categories were examined from the residents’ viewpoint.
Due to the qualitative approach, the definition of the content of the KPIs must be conducted case-specifically. The selected KPIs and their definitions in the context of this research include the following:
Energy poverty: In Finland, 68% of the households’ electricity consumption is used for space heating, 15% for water heating, 9% for household appliances, and the rest for the sauna, cooking, and lighting [
61]. Energy poverty mainly affects the heating in low-income households living in non-densely populated areas (e.g., the countryside), and living in oil and electrically heated detached houses [
62]. Thereby, energy poverty affects around 3% of households in Finland [
63]. Finland’s social policies such as general housing allowance, pension security, and housing renovation grants guarantee that all citizens have the right to basic needs, and are seen as good practices to mitigate energy poverty [
64]. Therefore, in this work, energy poverty was examined from the consumers’ viewpoint. The indicator is defined as how the different aspects of energy costs are experienced and what the share of the electricity bill is in the household’s disposable income. The scale used was: Low–1–2–3–4–5–High.
Consciousness of the residents: According to a recent study [
8], the electricity awareness of Finnish households is currently low. A previous study in Finland has shown that the effect of information on consumption behavior decreases as the amount of the electricity bill is reduced and the initial enthusiasm is over [
18]. Consumers have a desire to receive information such as that which is suitable for the current season, and for the current living and life situation as well as personalized information. In this research, the consciousness of the residents was defined as how aware the residents were of their own electricity consumption and costs, and how willing they were to increase their awareness. The scale used was: No consciousness–1–2–3–4–5–High consciousness.
Citizen engagement in climate conscious actions: Currently in Finland, some services are already provided for consumers that bring the idea of demand flexibility closer to the individual consumers. However, the efforts toward demand flexibility and its main purposes are not currently familiar to a large proportion of Finnish people [
29]. The incentives and motives for climate conscious actions are obviously not clear for many people. Consumption advice is needed, but it must be related to the current situation and provide a variety of proposals for action [
18]. As the awareness of the users’ own consumption behavior increases, the understanding of the impact of their behavior on the environment also increases. In this work, citizen engagement was defined as how willing the residents are to take actions on conserving electricity. The scale used for this purpose was: Not at all–1–2–3–4–5–High engagement.
Quality of open data: Recent research in Finland confirms that the people interested in energy-related issues are also interested in receiving guidance information [
18]. In Finland, the consumption and environmental data are available to consumers, for example, from DSOs, cities, regional environmental services, meteorological and environmental institutes, the Ministry of the Environment, Statistics Finland, different media outlets, and the European Commission. Locally, the city of Oulu provides a lot of local consumption and environment data through its web pages and data portal. In this work, the value of these data to residents was studied from the local viewpoint, examining whether the data provided by the city of Oulu increased the residents’ awareness. The scale used was: Not at all–1–2–3–4–5–Excellent.
Oulu, the largest city in northern Finland, was chosen as a target area for the research due to its current intentions to promote low-carbon urban targets. Oulu is acting as a pioneer city in the H2020 project (
https://makingcity.eu/, accessed on 1 November 2021), where the new concepts will be tested and validated. In addition, the city has adopted the “Light of the North” strategy, reinforcing the willingness of the city to implement a sustainable urban energy transformation. The target group of the survey was the residents of the city of Oulu including all of the ordinary residents who lived within the city limits or the boundaries of a municipal association. The number of responses needed to be 300–400.
3.2. Selecting the Techniques, Approaches, and Tools
Surveys enable standardized data collection, ensuring that the same data are collected from each respondent. Surveys can be roughly divided into two categories: questionnaires and interviews. The questionnaire format was chosen because we wanted a high number of responses, and questionnaires provide an efficient way of collecting information from multiple stakeholders quickly. They can force users to select from choices, rate something, or include open-ended questions, allowing for free-form responses. A questionnaire can be in different formats such as in a PDF format or online form, or it can be made available through an online platform. It was decided to implement the questionnaire for this study as a web-based questionnaire using the Questback Essential (
https://www.questback.com/, accessed on 2 March 2021) online survey tool, which makes the questionnaire available for residents in several ways via a direct link. The tool enables one to present questions based on the answers given (e.g., “yes” and “no” answers result in different follow-up questions). The distribution channels for the questionnaire were the web pages (VTT, City of Oulu, and Making-City project) and the social media channels of VTT and the other Finnish project partners including the city of Oulu, University of Oulu, a large grocery chain, a housing company, and a building company.
3.3. Collecting the Data
The questions of the questionnaire were defined iteratively in co-operation between the project partners in the MAKING-CITY project. All of the project partners were also able to add questions according to their own interests. The questionnaire was first tested, during which it went through several iterations. The test persons included the members of the project team and company representatives as well as other employees of the partners who were not familiar with the project. Each iteration resulted in modifications and additions. The final questions were implemented in Finnish, because not all Finnish people, especially the elderly, speak English. The questionnaire included both close-ended and open-ended questions. Close-ended questions typically have a limited set of possible answers. Some of the close-ended questions were multiple choice questions, whereas some only allowed one answer. The open-ended questions enabled respondents to describe their thoughts and opinions more freely. It was decided to keep the number of the open-ended questions as low as possible due to their more time-consuming analysis. The questions were related to the pre-defined indicators:
Energy poverty: How satisfied are the residents with their energy costs? How is the price of energy experienced? What percentage (%) of the total household disposable income is an energy bill? What practices do residents currently have for conserving energy at home in everyday life?
Consciousness of residents: What properties affect the selection of the electricity retailer? Does the price of energy affect the consumption behavior? What awareness do residents have of their energy bills? How satisfied are consumers with their access to the consumption information and its level? What availability is there and what needs to exist for energy-related data and services?
Citizen engagement to climate conscious actions: How do residents aim to influence their consumption of electricity and thereby support the environmental goals? What is the willingness of residents to change their energy retailer to a 100% renewable energy supplier? How willing are residents to change their own electricity consumption behavior against the benefits? How willing are residents to allow a service/device provider to control their heating, air conditioning, or water heater against the benefits? How willing are residents to receive recommendations for their electricity consumption, to invest in smart meters, and to produce electricity themselves?
Quality of open data: Does the city of Oulu provide enough environmental data for its citizens? What data do the residents follow, and how is the quality of the data experienced?
3.4. Analyzing the Data
The collected data were first analyzed, after which the KPIs were evaluated with the help of the results of the analysis. These are described in the following sub-sections.
3.4.1. Data Analysis
Quantitative methods can be used to analyze the responses to closed-ended questions (e.g., yes/no answers or numbers from 1 to 5), described as percentages or numbers (Likert scale). These form direct values for the results. There exist several methods that can be used for data analysis in qualitative data, for example, phenomenology, narratives, grounded theory, ethnography, and content analysis. In this research, the answers obtained from the open-ended questions were analyzed using content analysis [
65], which parses and presents the data in words and themes, and finally identifies the common characteristics among the responses. Four main stages have been identified [
65] that are used in a content analysis: decontextualization, recontextualization, categorization, and compilation.
The four stages were utilized in the analysis of the open questions, and the responses to each question were transcribed with the following classifications: meaning unit, code, category, and theme.
Decontextualization: In this stage, the responses were read through several times and meaning units were identified. A meaning unit is the smallest unit that answers the question. The meaning units were labelled with a code that had a direct relation to the context of the research [
66]. The list of codes was formed during the analysis process.
Recontextualization: In this stage, the responses were re-read alongside the final list of meaning units, checking whether all aspects of the content had been covered in relation to the aims of the research, and removing the unimportant information that did not correspond to the aims of the research.
Categorization: This stage involved condensing the meaning units and identifying the themes and categories that were internally homogeneous and externally heterogeneous (no data should fall between two groups or fit into more than one group) [
67,
68]. Depending on the question, three to five clear themes were identified.
Compilation: The results could be compiled at the manifest level or at the latent level. The manifest level analysis was chosen because it allowed for the use of the respondents’ actual words, referring back to the original text and remained closer to the original meanings and contexts [
69].
One of the main advantages of this kind of analysis is that it enables working close to the data. This means that the content remains as unchanged as possible. Therefore, the context analysis helps to understand the intentions of the individuals, interpret them, and detect common themes among them. In addition, the content analysis provided a systematic process that enabled the data to be processed in a similar way, which increased the analysis reliability. The quality and trustworthiness of the analysis were ensured by performing the stages several times.
3.4.2. Evaluation
The evaluation of qualitative KPIs differs from the evaluation of quantitative KPIs, since a qualitative evaluation is always more human-centric. For the evaluation of the qualitative KPIs with the help of the results of the questionnaire, evaluation criteria are needed. The following tables (
Table 1,
Table 2,
Table 3 and
Table 4) describe the defined criteria for the indicator evaluation. For the evaluation of the KPIs, an evaluation group was formed that consisted of experts from the different partners of the project. These included domain experts from the city of Oulu and from a housing company Sivakka, and the researchers from the VTT Technical Research Center of Finland and University of Oulu. The evaluation group gathered twice to evaluate the results of the survey against the evaluation criteria. For each criterion, a value was formed and the value for the KPI was formed as a weighted average of the values of the criteria.
4. Results
The questionnaire was available online during March 2021. It received 378 responses. This section presents a summary of the results of the survey. A more detailed description of the results can be found in the
Appendix A,
Appendix B,
Appendix C,
Appendix D and
Appendix E. The evaluation of the KPIs is presented in
Section 5.
4.1. Background of the Respondents
A slight majority of the respondents were women (52.4%) and the most dominant age group was 30–50 years old (51.1%), followed by 50–70 years old (33.1%). Most of the respondents lived as tenants (52.6%) and the family sizes of the respondents were equally divided between one, two, and three and over persons per household. The majority (62.4%) of the respondents had fixed-price electricity contracts. District heating was the main heating method for the majority (74.1%). A clear majority of the respondents (63.8%) did not have any form of automatically optimized/controlled smart technology at home. A majority (33.6%) had under 5000 kWh of electricity consumption/year, but a considerably large proportion of the respondents (27.8%) did not know their own yearly electricity consumption. A more detailed description of the respondents can be found in
Appendix A.
4.2. Energy Poverty
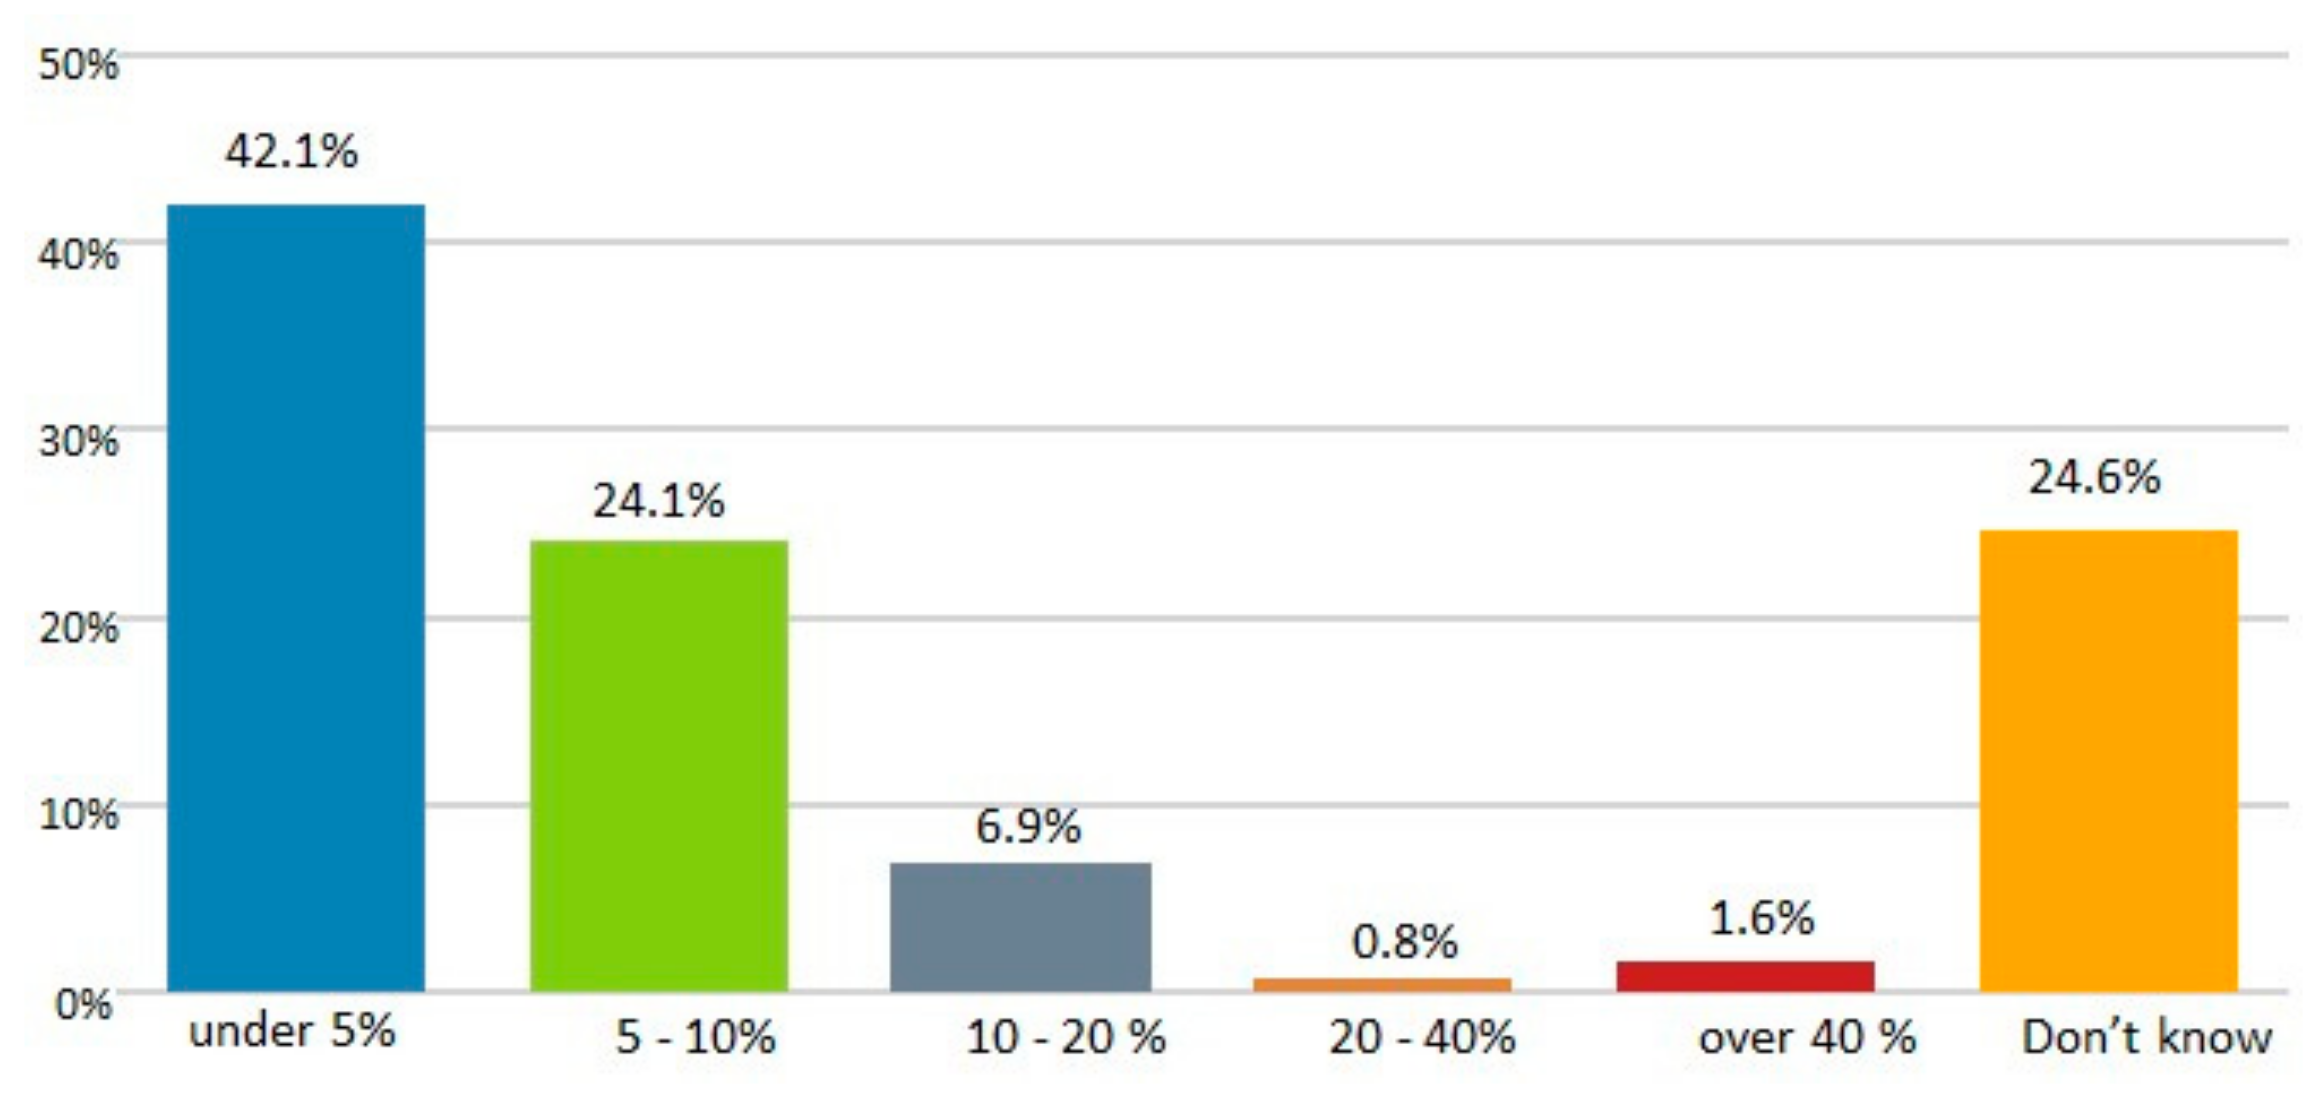
In this section, the respondents were asked about the price of energy and the percentage of energy bills (electricity and heating) of the total household disposable income. A large proportion of respondents (48.1%) considered the price of energy to be quite expensive. For most of the respondents, the percentage of energy bills of the total disposable income was under 5%.
The respondents were asked about their satisfaction with different energy-related aspects such as the electricity price, electricity distribution price, electricity retailer, electrical devices, and electricity taxes. Most of the respondents considered the electricity price, electricity retailer, electrical devices, and electricity taxes to be “OK” (meaning that they were neither satisfied nor dissatisfied). However, 50.3% of respondents were dissatisfied with the electricity distribution price.
The respondents were also asked about their practices to save energy in their everyday life. Many practices could be found: 94.4% of respondents turned the lights off when leaving the house, 64.0% used low-energy lighting, 59.5% aimed to buy energy efficient appliances, 57.9% aimed to use less warm water, and 51.3% tended to keep the room temperature sensible.
A more detailed description of the responses to the questions related to energy poverty can be found in
Appendix B.
4.3. Consciousness of Residents
The respondents were asked what characteristics influenced their choice of electricity retailer. The responses included the following: the electricity price (81.5%), credibility (42.1%), environmental concerns (40.5%), locality of the company (31.7%), company brand (21.2%), and other (4.2%).
The respondents were asked whether variations in electricity price (i.e., peak pricing) affected their consumption behavior. A total of 14.8% of respondents answered ‘yes’, 70.1% ‘no’, and 15.1% could not say.
The respondents were asked about their opinions on the following suggestions: “I am aware of the content of my electricity bill”, “I am satisfied with the access to the information and its level regarding my own energy consumption and bills”, and “I would like to monitor my own consumption behavior and consumption more precisely”. Most of the respondents agreed with these three suggestions (50.5% with the first suggestion, 46.8% with the second suggestion, and 37.0% with the third suggestion). The more detailed answers are presented in
Appendix C.
The respondents were asked about their willingness to obtain other energy-related data. The most preferred data included information about the consumption peaks of home/property (61.4%), detailed information and statistics on individual device consumption (56.6%), and data concerning the consumption of similar types of households (50.8%). More detailed answers can be found in
Appendix C.
The respondents were asked that if they could not be identified from the consumption data, what of the pre-defined alternatives would they be willing to provide to the service provider for free use. A total of 54.2% of respondents said that they would provide companies with data on their heat consumption, 73.5% on their electricity consumption, and 56.6% on their indoor air temperature.
The respondents were asked with an open question that if companies were allowed to develop services based on the consumption data of consumers, what kind of service would be useful for them. Three main themes could be identified among the responses to this question. These are described below in the order of the number of responses.
Visualization of consumption. A service that visualizes the consumption would be the most beneficial. Two main types of visualization needs could be identified. First, to compare a household’s own consumption with others and similar consumer groups and with the average value of other households. Second, to be able to monitor a household’s own consumption and identify the causes of energy consumption. This should include comprehensive statistics about the household consumption, the energy consumption of individual devices, information about their own consumption behavior, and its effects on everything. Both the real-time consumption data and the forecast of electricity consumption were considered as beneficial.
Transfer and optimization of consumption. A service that could assist in transferring electricity consumption to low-priced time periods was required, thus optimizing consumption. The optimization targets included both energy consumption and heating. The optimization of energy consumption included personal energy forecasting and optimization, reducing energy consumption, and transferring the consumption time based on the stock energy prices. The optimization of heating included the optimal heating adjustment and anticipatory adjustment.
Advice. A service that provides consumption advice and recommendations was seen as useful. This included recommendations for energy saving behavior and measures and for consumption-related choices, making consumption more environment-friendly. It should also involve the detection of consumption deviations and assistance changing consumption patterns based on a household’s own goals. In addition, notification about the consumption peaks would be beneficial.
4.4. Resident Engagement to Climate Conscious Actions
The respondents were asked whether they would be willing to change their own electricity consumption behavior (for example, whether to do laundry or go to the sauna at different times) if this would achieve some benefits. A total of 63% of respondents were willing, 14.6% were unwilling, and 22.5% could not say. Those who were willing to change their behavior were able to select their preferred benefits among multiple choices. The most preferred benefits included reductions in the electricity bill (75.2%), environmental benefits (54.6%), and some service, for example, automatic heat control (17.6%).
Those respondents who were not willing to change their consumption behavior were asked for their reasons with an open question. Four main reasons could be identified and are listed here in order of the number of responses.
The current life situation limits changes: The life situation is so hectic that the changes are not possible. Life is so tightly scheduled that there are certain moments for consumption between work, free-time, and sleep, and these are not flexible.
Unwilling to change consumption behavior: Everyone should have a freedom of choice when home activities are carried out. The justifications include, among others, that comfort and freedom of choice are important, the price of electricity should not schedule life, and home activities must be carried out when there is a need for them.
Regarded as useless: The change in consumption behavior is ineffective. The change has no effect, or the effect is small globally and even locally, and the change has no financial significance; it provides no savings and it might even cause extra costs.
Unable to change consumption behavior: Their change in the consumption behavior is impossible since there is not anything to change. Their consumption is already low and they have already made all of the significant changes.
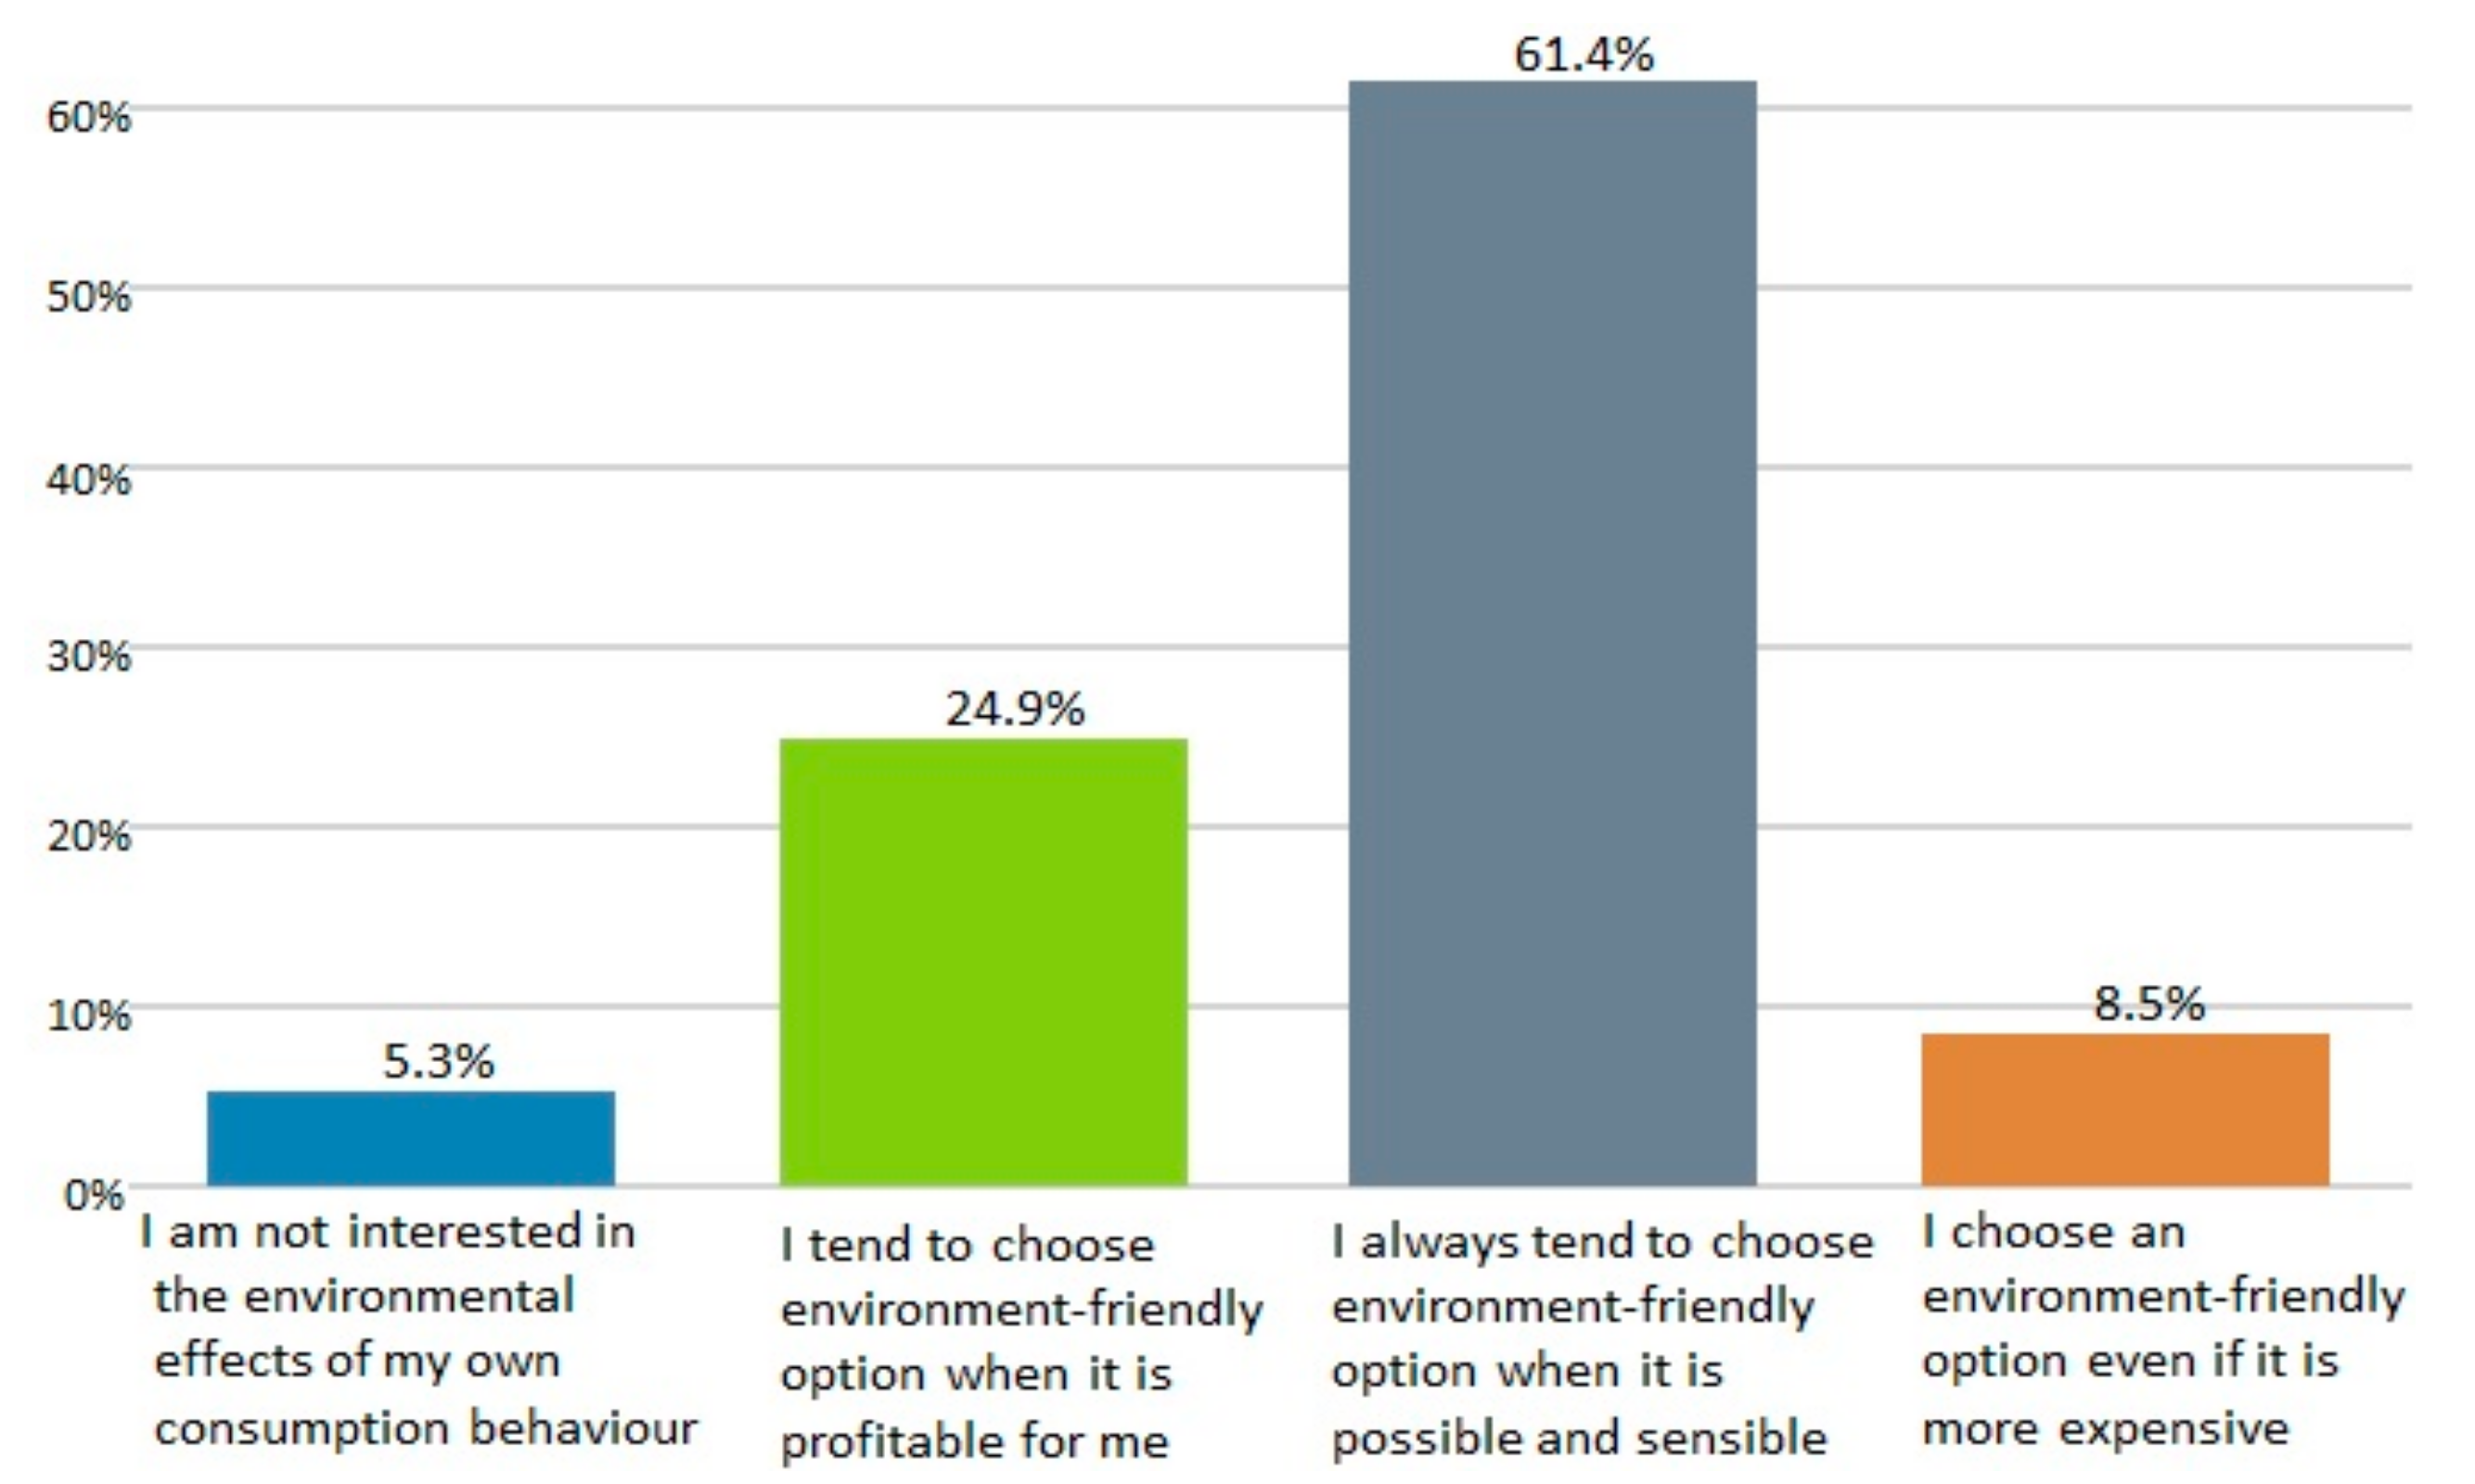
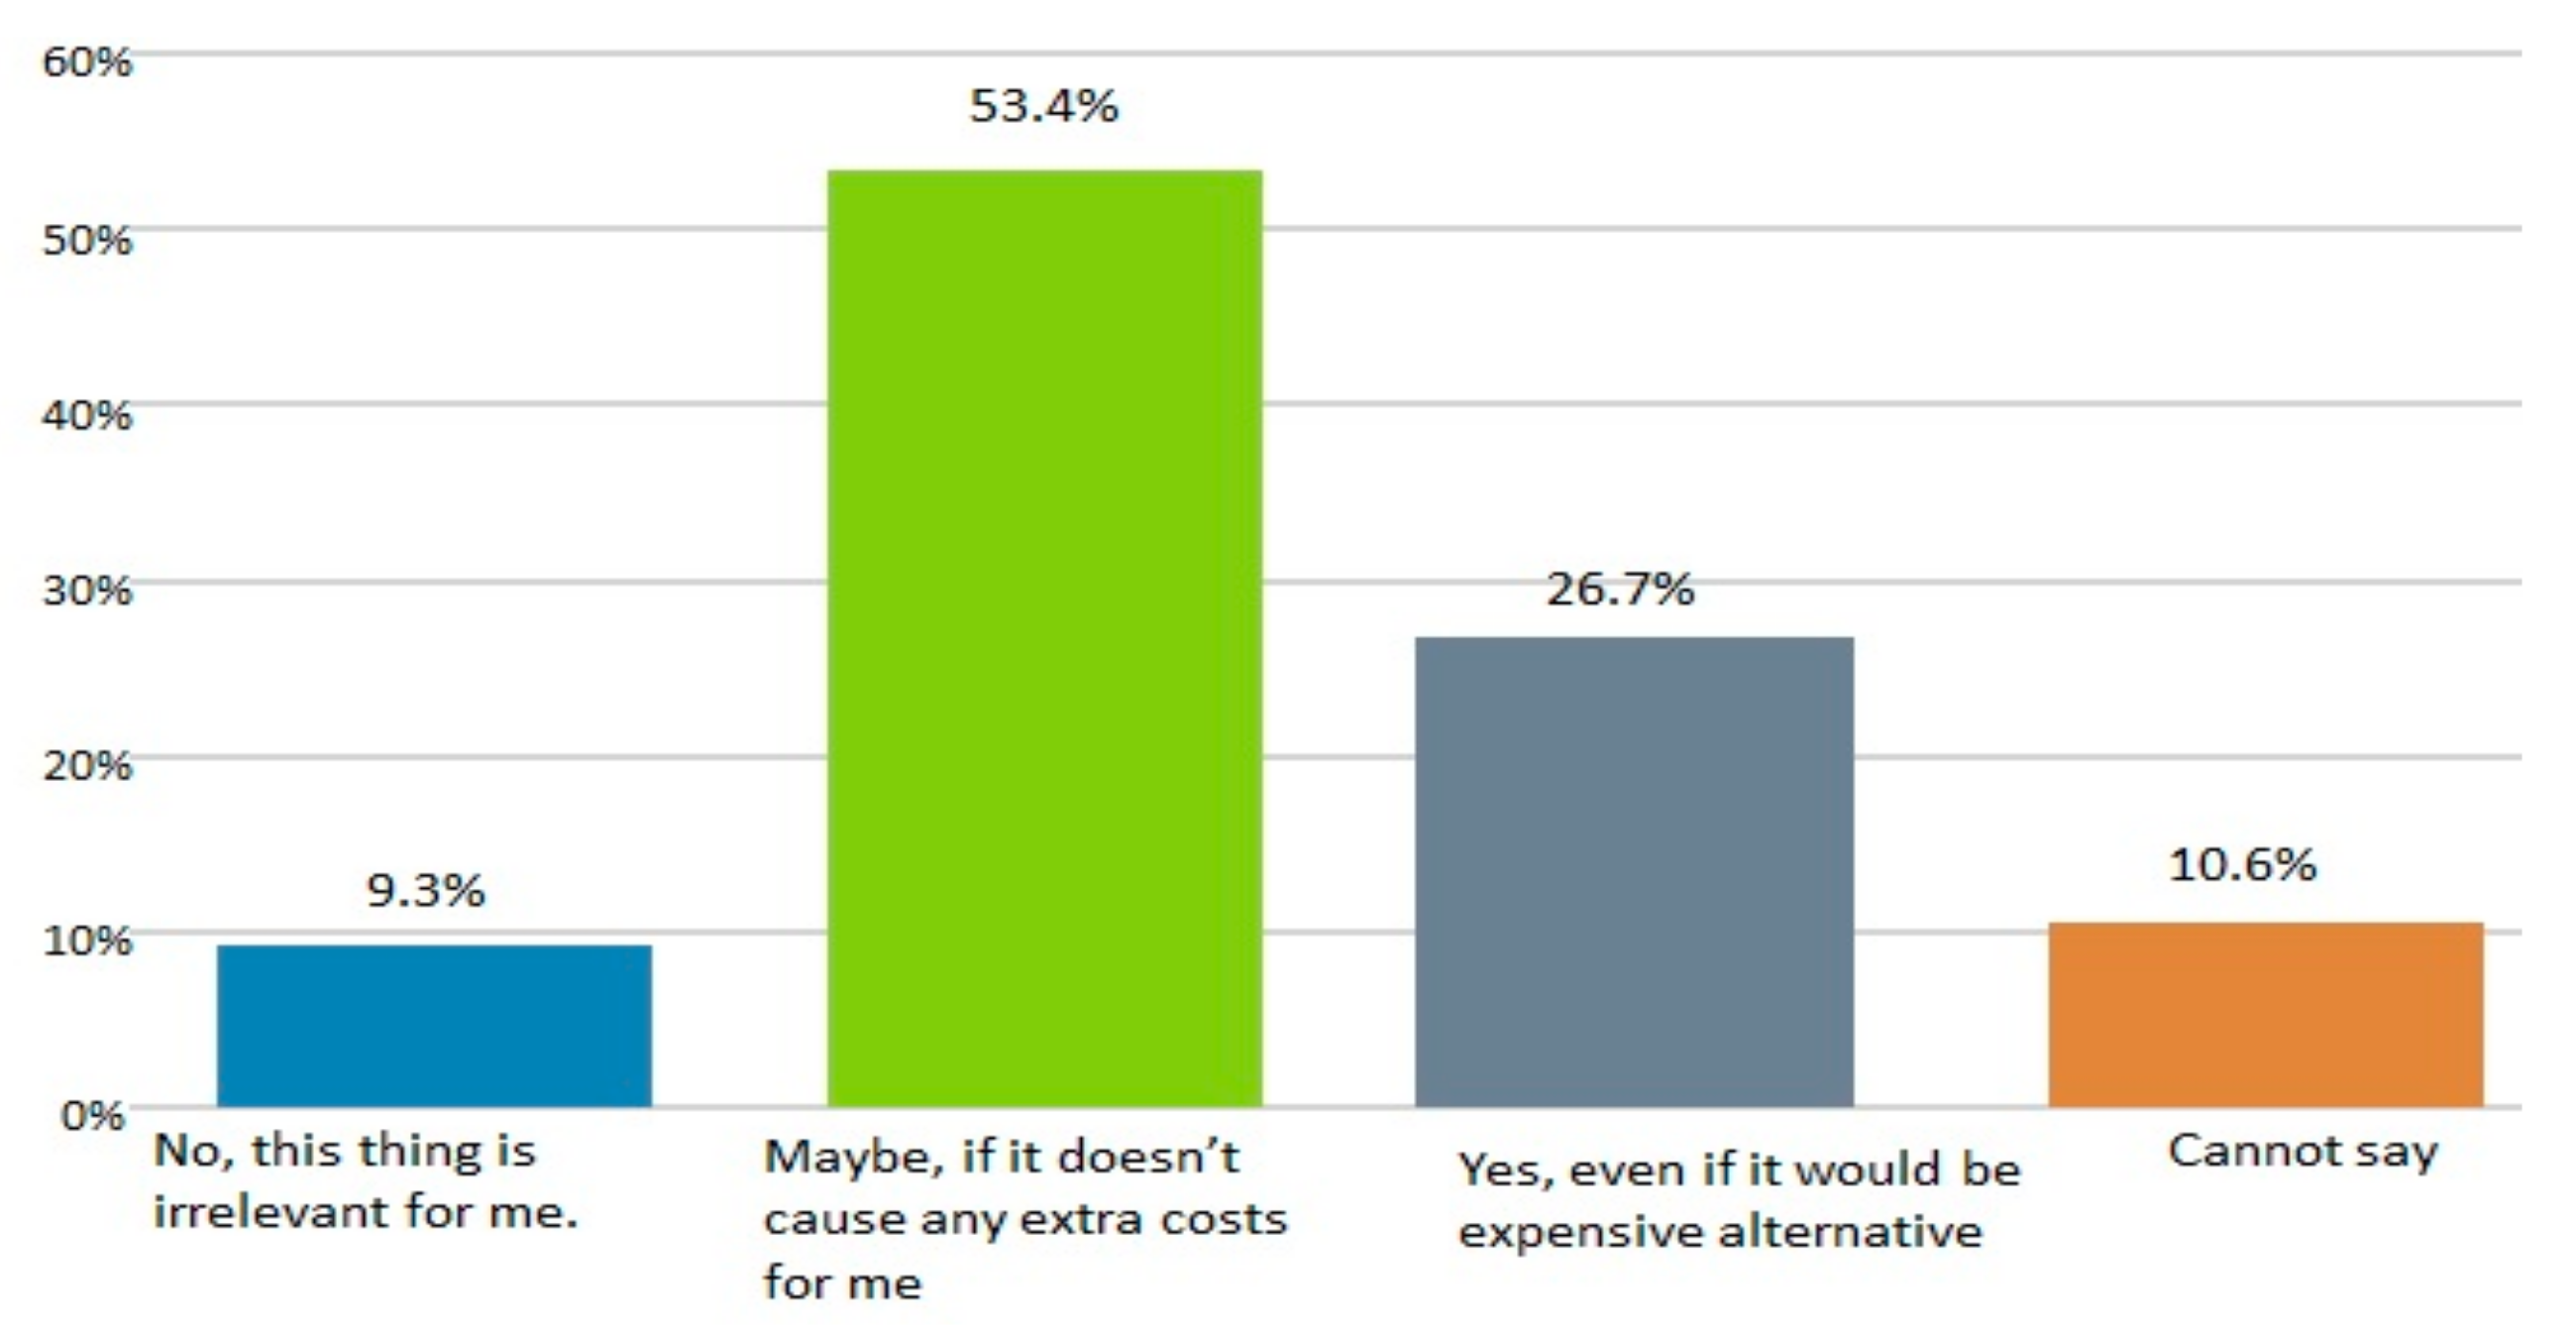
The respondents were asked whether they aimed to influence the environment through their own energy consumption. The majority of the respondents (61.4%) reported choosing an environmentally-friendly option when it was possible and sensible. In addition, the respondents were asked whether they would change their energy provider to a 100% renewable energy provider. The majority of respondents (53.4) answered “maybe”, if it would cause no extra costs. More detailed answers to these questions can be found in
Appendix D.
The respondents were asked about their opinions on the following suggestions: (A) I would allow a service/device provider to control my heating, air conditioning, or water heater for some benefits, (B) I would like to receive personal recommendations to lower/change my energy usage, (C) I am willing to invest in meters, smart devices, and systems to achieve some benefits, and (D) I am interested in becoming an electricity producer in the future, for example, by using solar panels. The majority of respondents would not allow third-party control, but wanted, however, to receive personal recommendations. Furthermore, a large proportion of respondents were willing to invest in smart meters or become an electricity producer. More detailed answers can be found in
Appendix D.
4.5. Quality of Open Data
The respondents were asked whether the city of Oulu provided enough environmental data to its citizens. According to 21.7% of respondents, the data were adequately available, 29.4% felt that the data were not adequately available, and 48.9% of respondents could not say.
Next, the respondents were asked if they followed any open data provided by the city of Oulu. The most followed data were about the quality of air (35.2%), the quality of water (23.7%), and the data related to traffic (20.0%). A total of 51.5% did not follow any data. For those who followed some of the data items, a question to evaluate the quality of the data was presented. Half of the respondents considered the quality to be good (50.0%) and 28.0% considered it to be very good. More detailed responses can be found in
Appendix E.
Finally, the respondents were asked with an open question about their data needs: what data they would like their city to open. The following main themes were identified among the answers to this question. The themes are displayed below in the order of the number of responses.
Data about the energy consumption: the total energy consumption, the energy consumption broken down into heat, electricity, and energy sources used, consumption per household (from single houses to larger buildings), and comparisons of the electricity consumption data with similar households.
Information about the costs and decisions of the city of Oulu: the city proposals and decisions regarding the energy consumption and electricity transmission prices, and the heating costs of the city-owned buildings.
All information: all of the possible information should be available to all residents.
Data about the energy production: the way the energy is produced and how environmentally-friendly it is.
Data about the air and water: the quality of the air, the quality of water (including both natural waters and tap water), and the amount of water consumption in Oulu.
5. Discussion
The data for this research were acquired with the help of an online questionnaire. People were able to find the questionnaire from the Internet (web pages or social media), for example, when reading the general news of the city, at the grocery store or the university, or following the project partners in social media. The following sub-section describes the results of the evaluation of the criteria for each of the KPIs by the evaluation group. The other sub-section provides a discussion on the findings and a comparison to related work.
5.1. Evaluation of Social KPIs
The responses to this kind of questionnaire are always affected by the current situation and events in the energy markets. Additionally, national and international events affect people’s opinions. For example, if the questionnaire is launched right after a great increase in electricity prices or some major investments, the respondents may be more critical in their answers. At the time when the questionnaire was launched, the price of electricity in Finland was at an average level when compared to the prices in 2021, but there had been several news releases and discussions on the increase in the distribution prices, and people had been quite displeased. Additionally, the COVID-19 pandemic had slightly affected the people’s energy consumption, as people were situated more at home and also worked remotely in some cases. In addition, it must be noted that because the respondents consisted of a heterogeneous group of people, some questions may have been difficult for some of the respondents to answer. Therefore, many questions included the ‘don’t know’ or ‘cannot say’ response option.
Energy poverty: Altogether 27.8% of the respondents did not know their own yearly electricity consumption. The gender of the respondents and the ownership of a house or an apartment affected this knowledge: 16% of men and 37.4% of women as well as 18.6% of house/apartment owners and 35.7% of tenants did not know their energy consumption. The age of the respondent did not seem to affect the knowledge. The respondents seemed to be quite satisfied with the different aspects of energy such as the electricity price, their electricity retailer, their own devices, and electricity taxes, and very dissatisfied with the distribution price. Electricity generation, retail, and distribution are separated from each other in Finland. Distribution is a local monopoly, but generation and retail operate in competitive markets. Because of this, the distribution and retail prices were evaluated separately. In Finland, consumers cannot select their distribution system operator (DSO), but the electricity is always distributed by the local DSO. Electricity distribution is regulated by the Finnish Energy Authority, but despite the regulated prices, many local distribution companies have increased their prices significantly during the last year. Price increases have been justified by investments of more weather resistance networks by building them underground, for example. Respondents found the price of the energy (including electricity and heating) in general as quite expensive in Finland. Nonetheless, according to the statistics on electricity prices for household consumers, the electricity price in Finland is fairly average across Europe. As the electricity cost only accounts for about a third of Finnish electricity bills, the total sum of an electricity bill may be experienced as expensive. How the respondents felt about the price of energy conflicts with the fact that the portion of the respondents’ energy bill of the total household disposable income was only about 7% on average. There may be several reasons for this. The responses revealed how people experienced the price, and the result is therefore subjective. In addition, although the increases in the electricity distribution prices do not affect the price of electric energy, people may perceive it that way. Furthermore, severe frosts in winter make people think that their heating will become expensive. In general, energy may be perceived as expensive from old habits and general attitudes due to the fact that Finland is located in the far north. This refers to a feature formed by the energy culture [
7]. According to the results, the respondents already followed energy saving practices in their everyday life quite well: only 1.6% reported not carrying out any of the listed activities to save energy. Most of this involved automatic behavior (e.g., turning the lights off when leaving the house), but a great number of respondents also took energy-efficiency into account in their new investments such as when buying new appliances and lighting. The results of the evaluation are summarized in
Table 5.
Consciousness of the residents: The respondents were not willing to change their electricity retailer often, and they were quite loyal to their current company. The most important selection criterion for the retail company was the price of the electricity. A total of 40.5% of respondents considered the environmental factors of the electricity retailer as important. Since this criterion was evaluated from the environmental point of view, and for most of the respondents, the electricity price and the credibility of the retailer were more important, and the activity of the electricity retailer was considered to be quite low. The respondents were not willing to change their consumption behavior according to peak pricing, so this type of pricing has not yet made a consumer consumption shift in a more environmentally-friendly direction. A total of 60% of those whose behavior was not affected by the peak-hour pricing still regarded energy as quite expensive or expensive. Currently, there are no widespread incentives for this in Finland, and therefore, there are no experiences with peak-hour pricing. However, night–day control is more familiar to Finnish people. The respondents were well aware of the content of their electricity bill and were quite happy about how the consumption information was made available to them. The majority were also willing to monitor their own consumption data in more detail. Of those who were interested in monitoring, a slight majority (54.3%) were tenants. A total of 59% of those who did not know the amount of their energy consumption were willing (agreeing or strongly agreeing) to monitor their own consumption behavior more precisely. The respondents were slightly cautious of providing their personal consumption data to companies. This could be a slightly unfamiliar idea for the respondents, as the motives behind this question may not be necessarily clear. Their interest in services based on their own consumption data was therefore low. The interest was clarified with an optional open question, where no given alternatives were available, and this is probably why the response percentage to the question was low. Those who answered were able to identify reasonable services and all of the answers fell into three main categories (consumption visualization, consumption optimization and advice). The results of the evaluation are summarized in
Table 6.
Resident engagement in climate conscious actions: The respondents were quite willing to influence the environment through their own energy consumption actions by choosing environmentally-friendly options when possible and sensible. In the same way, most were willing to change their energy retailer to a 100% renewable energy provider if it did not lead to extra costs. It can be concluded that the respondents thought about the environment and aimed to be environmentally-friendly, but for most of them, these actions should not cause any financial costs. However, based on the results, efforts made toward environmental friendliness were seen as high. A total of 26.7% of the respondents would be willing to pay more when selecting a 100% renewable energy provider. Since this is quite a large portion of the responses, it means that a relatively large part of the respondents were willing to pay more for so-called ‘green energy’. There was only a slight difference between genders: only 25% of men and 28.3% of women would commit themselves to a 100% renewable energy provider. Most interested were those respondents under 30-years-old (37%). Most of the respondents (63%) were willing to change their own electricity consumption behavior if this led to benefits. This result is in conflict with the result according to which households were unwilling to react to peak pricing. However, 60.3% of those who were not willing to change their consumption behavior based on peak-hour pricing were willing to change their consumption behavior against benefits. This probably means that the benefits related to allocating consumption away from peak-priced hours is unclear to consumers and signals the need for more concrete information provision related to this. Women seemed to be more willing to change their own electricity consumption behavior against the benefits (72% of women and 54% men). The size of the family had no significance. The most desired benefit for changing the consumption behavior was financial (i.e., a decrease in electricity bills (75.2%)). Environmental benefits came second at 54.6%. Since the change in behavior included daily activities such as doing the laundry or going to the sauna at different times, the willingness was evaluated as quite high. It should be noted that consumer attitudes and interests are in many cases dependent on the incentives and benefits. Therefore, the possible benefits were clearly defined for the question in the questionnaire. The respondents were not very keen on allowing third-party service providers to control their heating or water heater against the benefits: a quarter of respondents (25.9%) would not allow this in any case, 33.1% would not be likely to do so, and 27.5% were unsure. This most probably reveals the fear of losing control, as the idea of third-party control is unclear [
29]. Instead, respondents were very keen on receiving personal recommendations to change their energy usage. This shows that in the end, the respondents wanted to make the decision to change their consumption practices themselves. Only 13% of those who selected their electricity retailer based on environmental issues would enable third-party control. This may indicate that the link between the demand flexibility and environmental concerns is not clear for the respondents. Surprisingly, many respondents expressed a willingness to become an electricity producer in the future, for example, by using solar panels. The results of the evaluation are summarized in
Table 7.
Quality of open data: A total of 48.9% of the respondents could not say whether the city of Oulu provided enough environmental data for the citizens. This may be because they were unaware of the available data. There was only a slight difference between the view that the data was adequately available (21.7%) and not adequately available (29.4%). However, since the adequacy of the data could not be clearly reasoned, the value of the criteria was hard to define. The interest toward the open data was not high: a half of the respondents (51.5%) did not follow any data. Those who followed some form of data estimated the quality of the data as good. However, it was difficult to assess what “follow” meant for the respondents: whether they read the news or actively searched for the data, and whether they knew who made the data available. Only 28% of the respondents could specify their data needs. The identified themes included the energy consumption data, information about the finance, costs, and decisions of the city, all available information, information about the energy production, and information about air and water. Through all of the information, the respondents stated that all of the possible information that the city collected must be made available to all citizens. The results of the evaluation are summarized in
Table 8.
5.2. Summary of the Main Findings
According to the results of the survey, the respondents may be aware of the high-level intentions to achieve carbon neutrality, but the influence of their own consumption behavior may be unclear to them. The general attitude was often that the effect of a single household was small compared to the effort. However, as the number of households, and especially that of electrically heated buildings, is high in Finland, behavioral changes in consumption habits can have a significant impact on the emissions. As a larger ensemble, a behavioral change in consumption supports the goals of demand flexibility and energy savings.
The results showed that clearly the largest portion of Finnish consumers are willing to reschedule their own electricity consumption against some benefits. The most preferred benefits were financial, which was similar to what many other studies have concluded [
29,
30]. However, the question was formulated in a way that it was hard to estimate how much inconvenience the respondents were willing to tolerate due to rescheduling. Earlier research has shown that a major portion of respondents emphasize that rescheduling consumption should not cause any visible harm to the household [
37] or require changes in people’s everyday routines [
38]. According to our results, the environmental benefits also were a preferable incentive for respondents, and a large portion were willing to pay more for green energy. The incentives for this kind of action may be motivated simply by intrinsic rewards, which, according to Frederiks [
16], make people feel socially responsible and good about themselves.
The respondents’ reasons for not changing their consumption behavior included having an overly hectic life situation, the freedom to choose when to consume electricity, and that the changes in consumption were regarded as useless. The first reason depended on people’s routines (i.e., lifestyles [
5]). Electricity is regarded as a necessity and in many cases, it is taken for granted. It is a part of the everyday routine of a household and when life routines are hectic, people feel that they cannot be flexible in their everyday actions. This result is in line with the results by Ruokamo et al. [
17], who found that restricting energy usage in the evening required higher compensation than in the morning. This may be because many of the household routines such as cooking and laundry typically take place in the evening. The second reason is related to people’s attitudes (i.e., energy culture [
6]): people want to decide on the timing of their consumption and want to control the consumption themselves. In addition, their own comfort is highly important, when a change in consumption patterns would be a step backward. This, and the third reason, according to which the change in consumption time was regarded as useless, reveals that there are still a lack of clear incentives from the consumer’s viewpoint. The last two issues were also revealed in a survey in 2018 in Finland [
29]. It is clear that more efficient incentives for behavioral change are required. Compared to many other studies, our results revealed the lack of information and understanding on the impact of consumption timing about the energy system efficiency and emissions by analyzing two separate questions fundamentally asking the same thing (allocating consumption away from the peak hours). We received contradictory answers that revealed the consumers’ lack of knowledge on the consequences of their behavioral change in larger context.
The desire of the respondents to support the environment and to save energy came out in the survey on several occasions. The respondents already had practices and habits that saved energy in their everyday lives. Similar observations were found with a survey implemented by Rosak-Szyrocka and Zywiolek [
14], but the significant difference was that lighting (turning off the lights when leaving the house, and their energy efficiency) and buying energy efficient appliances were much higher in Finland’s case. In the survey research of Paco and Lavrador [
15], the respondents emphasized the importance of providing information and acquiring knowledge to save energy. According to Trotta [
8], up to 70% of respondents (Finnish households) were willing to receive information about their energy consumption and how to save energy. This also came out in our survey, and the respondents identified several means for saving energy. A considerably large portion of those who did not know the amount of their energy consumption were willing to improve their knowledge on the matter. This slightly conflicts with the results by Kažukauskas and Broberg [
10], but the number of people who did not know the amount of their consumption was quite small in our case. The results showed that people had clear intentions to improve their awareness by monitoring their consumption behavior and receiving personal recommendations and more energy-related data. Some of these data could be already available to them without them knowing about it. In addition, for consumption monitoring and receiving recommendations, the consumers should be active with their energy providers. For many, this may be too difficult, and therefore the energy providers, aggregators, or service providers should be more active toward the consumers.
According to the results of the survey, the willingness to allow a service/device provider to control the heating, air conditioning, or a water heater was low. In an earlier survey by Immonen et al. [
29], the results showed that a little over half of the survey respondents (Finnish consumers) held positive views toward third-party control. Therefore, there has not been any progress in people’s attitudes in three years. The reasons for not allowing third-party control included the desire to maintain control, the lack of experience/knowledge, lack of incentives (benefits), reliability in problem situations, data privacy, and skepticism about the capabilities of the services [
29]. Most of the identified problems clearly emphasized a lack of trust in the services and service providers, and a lack of knowledge on the incentives and benefits. According to the results of our research, a small part of respondents (13%) expressed interest in third-party services tailored according to their own consumption data. They listed some required properties for a service and important information needs. Because services that provide that kind of content already exist, it is clearly obvious that people do not know about the services that are currently available.
As the respondents emphasized their hectic lives, it is clear that people do not have time to think about energy savings in every action they make. It is hard to influence a busy life, but automated services could provide some help with the scheduling of consumption. There is still some work to do before people are ready to use services targeting demand flexibility and make their consumption behavior more beneficial on a larger scale. It is obvious that the environment is being taken more and more into account in people’s everyday life. As environmental thinking becomes a part of people’s lifestyles, the whole energy culture is slowly changing in an environmentally-friendly direction.
6. Conclusions
The key point of consumer motivation to support the carbon neutrality goals is to become aware of their own electricity consumption habits. With a survey targeted toward individual electricity consumers, this research evaluated the current status of consumer awareness and their intentions to support achieving carbon neutrality, and identified some open questions and problem areas to which more attention should be paid. The KPI-based approach utilized in this work provided a universal description of the current status that can be compared with results of similar cases. In addition, these qualitative values, combined with technical and economic KPIs, provided a comprehensive description of a certain area. By following the four-phase method, the survey can be applied to similar countries in the EU area. However, the usage and definition of the KPIs as well are their evaluation are very case-specific. Therefore, the KPIs and their evaluation criteria should be carefully defined.
The findings of the research indicate that although Finnish energy consumers are not yet highly aware of their consumption behavior and its effects on the environment, they are willing to support the environment and save energy. To help consumers implement their targets in their everyday life actions, new kinds of services are required to address the consumers’ changing needs and abilities and to provide them with tools to enable energy efficient consumption. According to the results, the consumers requested data and services that were already available or could be easily made available to them. There can be revealed a clear gap in communication between the consumers and energy (service) providers. In addition, more communication is required about the advantages of the change in the consumption behavior and the incentives, as the findings indicated that consumers did not seem to understand the significance of their role in the overall intention of achieving carbon neutrality. The resistance mainly exists because people feel that their self-determination will be violated or the change in consumption behavior serves no purpose. Based on our results, some policy implications can be drawn. First, efficient information channels through which consumers receive real-time information on their behavior should be offered. Second, the market mechanisms that integrate consumers to the market, for example, by using some form of aggregation service, should be developed. Third, economic incentives for energy efficient consumption behavior should be established. These could be tax reductions for investments in energy efficiency improvements, direct subsidies for solar power investments, for instance, or lower energy prices to offer more flexible consumption and third-party load control. Finally, even though we were able to show important results on the consumers’ energy-related behavior and the aspects through which it can be affected, it was limited to Finnish inhabitants, which operate in the Finnish energy market and other energy-related infrastructure. Additionally, the survey was designed using a qualitative content analyses methodology and some deeper quantitative collecting questions were not included. In our future research, we aim to investigate the energy-related awareness and consumption in a broader context.


