Abstract
Transmission towers are prone to collapse under strong wind load, resulting in significant economic losses. In order to investigate the collapse mechanism and failure modes of the transmission tower under strong wind load and whether the wind vibration factor can greatly reflect the increasing effect of the fluctuating wind, the finite element method (FEM) is utilized to analyze the ultimate bearing capacity of a typical 220 kV transmission tower. The results show that the collapse of the tower under strong wind loads is usually due to the buckling of the leg members. When the reference wind speed is equal to 27 m/s, a small part of the main leg members reaches their yield strength, while the diagonal members are still in the elastic range, and the deformation of the transmission tower is unapparent at this wind speed. When reference wind speed is equal or greater than 30 m/s, the growing variety of main legs is totally into the plastic yield stage, and the overall deformation of this tower is visible. Therefore, the transmission tower is collapsed due to the large deformation caused by the elastic-plastic buckling of leg members. Based on the aforementioned study, a finite element model involving three transmission towers and four span transmission lines is established to analyze the dynamic response of the tower-line system below fluctuating wind. Results show that the wind-induced coefficients designed by current code not only notably satisfy the stress response of tower components subjected to fluctuating wind loads in the elastic phase but also accurately assess the collapse displacement of the transmission tower. The increasing effect of displacement on the top tower under fluctuating wind, unfortunately, could not considerably reply with the investigated factor, and the load-carrying capacity of the transmission tower in the plastic phase can be overestimated by static calculation results.
1. Introduction
The electric power system plays an important role in the development of national economy [1]. Remarkably, the stability of transmission tower as a vital component of the electric power system is related to the safety of the whole electric power system. In the event of a collapse of a transmission tower, the overall transmission line could suffer a serious blackout, bringing inconvenience to economic development and people’s daily life. In addition, a number of secondary disasters caused by the collapse of transmission towers could result in huge economic and property losses to a country.
According to released statistics, strong wind is the major reason of transmission tower collapse in all types of natural disasters. Dempsey et al. have found that 80% to 90% of transmission tower system failures have been caused by high wind speed [2]. In 1960s, Davenport et al. initially proposed the concept of gust factor and equivalent static load method and carried out relevant calculations, which developed the empirical formula of downwind fluctuating wind speed spectrum [3]. Ozono et al. investigated the vibration characteristics of the tower-line system in the plane via a large number of experiments and utilized the FEM to study the coupling effect of transmission line span, conductor mass and boundary conditions on the wind-induced dynamic response of tower-wire coupled system [4]. Simultaneously, Yasui et al. employed a hybrid truss-beam model to analyze the wind-induced dynamic response of the transmission-line tower coupled system in the time domain and then proposed a method to determine the aerodynamic damping parameters of transmission towers and wires [5]. Mara et al. investigated the effect of wind direction on self-supported transmission tower in power transmission lines, and results revealed that the most unfavorable wind direction for the lines is lateral, which was perpendicular to the transmission line corridor direction [6]. Battista et al. established a finite element model of the tower-line system and analyzed the dynamic response and stability of the system under the simulated wind fields in the time and frequency domains, respectively [7]. Dasi et al. have studied the wind vibration response of the tower-line system via simulating conductors and ground lines with catenary cable elements [8]. Structural damage detection utilizing dynamic vibration data has also been the subject of much research attention by Salawu et al. in the past few decades [9,10]. Most of the vibration-based methods in the literature are verified by simple structural systems, such as two-dimensional trusses [11], shear building models [12,13], beams [14,15,16,17,18], and plates [19,20,21,22]. Alminhana et al. developed a special-purpose nonlinear dynamic analysis technique in order to investigate the multispan line sections under progressive failure scenarios and validated the method through full-scale tests [23]. Loredo-Souza et al. proposed a novel approach for wind tunnel modeling of transmission lines and carried out a relative test on conductors so as to investigate their dynamic behavior under strong wind [24].
Deng Hongzhou et al. regarded the Jiangyin long span tower-line system as a project background and conducted experimental studies on wind vibration at different wind speeds for single tower and tower-line system in the uniform and turbulent flow fields, separately [25]. The results showed that the conducting wire had little effect on the self-vibration frequency of the tower, but the damping of the tower-line system was remarkably improved compared with that of the single tower. With background of the Jiaojiang longs span linear tower, Lou Wenjuan et al. conducted wind tunnel tests on the transmission tower, employed the numerical calculation analysis based on the test, and then proposed a simplified calculation method for the transverse wind response of the transmission tower [26]. Yan Zhitao et al. carried out a wind tunnel test on the air-elastic model of the 1000 kV Sutong long span transmission tower-line coupled system [27]. By increasing the stiffness matrix of the transmission wire model, not changing the drape of the line and deriving the accurate aerodynamic similarity ratio of the wire, the air-elastic model of the tower-line system was designed to test the wind-induced response of the single tower and the tower-wire coupled system, which revealed the mechanism of tower-line coupling mechanism in terms of displacement, frequency, and damping. Guo Yong et al. established a spatial finite element model of the tower-line system with the Zhoushan long span transmission tower as the project background, conducted a time-domain analysis of the wind vibration response of the system, and also performed a wind tunnel experiment of the aeroelastic model of the tower-line coupled system [28]. Cheng Zhijun et al. carried out wind tunnel tests with aeroelastic model of an overhead transmission line, observed the wind vibration response of transmission towers at different wind speeds and wind angles, and finally conducted a qualitative analysis of the tower-line coupling effect [29]. Xie Qiang et al. performed a failure analysis of a transmission tower and carried out static nonlinear buckling analysis and dynamic analysis to assess the ultimate load-carrying capacity and the most vulnerable parts of the tower based on the field investigation of a damaged transmission line following Typhoon Mujigae in 2015 [30]. Niu Huawei et al. conducted wind performance assessment for a typical single-circuit tower-line system subjected to strong wind loads, proposed a probabilistic assessment method for the aforementioned system under strong wind, and then carried out wind tunnel tests to obtain the capacity spectrum curves of the tower-line system by incremental dynamic analysis (IDA) [31]. An Liqiang et al. utilized numerical simulation method to analyze the damage mechanism and failure modes of 13 transmission towers in 110 kV transmission lines following the super strong typhoon in Hainan province and to deeply study the influence of typhoon load characteristics on the structural force of the tower [32]. Based on the Tian-Ma-Qu stress-strain relationship, Bi Wenzhe performed a continuous collapse simulation of the tower-line system under the down-strike storm winds, which found that the collapse of the tower in this case was mainly caused by the significant local deformation of the tower in a short period of time [33]. Xu et al. and Qu et al. verified vibration control performance of friction dampers installed in a truss TV tower through numerical analysis, but their study is limited to the numerical analysis and lacks details for real implementation. Then, aeolian vibration of the transmission line, which is induced by the interaction between the transmission line motion and wind, is controlled using the stockbridge-type damper, a kind of tuned mass damper [34,35,36,37,38,39].
In order to ensure the operational safety of transmission lines under strong winds, it is critical to accurately predict the vulnerable parts in a transmission tower, which reveals collapse mechanism of this tower and provides scientific references for the wind-resistant design of transmission lines, tower retrofitting and maintenance. In this paper, a typical 220 kV transmission tower subjected to strong wind load was utilized as a project example to study the collapse mechanism and failure mode. Meanwhile, the analysis of wind vibration response of tower-line system under dynamic wind load was also carried out to investigate the dynamic response characteristics of the transmission tower under the impact of fluctuating wind so as to provide valuable reference for the wind-induced design of the high-voltage transmission tower.
2. Collapse Mechanism and Failure Mode of Transmission Tower
2.1. Investigation Description
A latticed 220 kV transmission tower designed by State Gird Corporation of China is studied in this paper. The tower is located in Hebei province where belongs to the IV meteorological zone. The parameters of this meteorological condition are as follows: design wind speed is 25 m/s, temperature is 25 degrees C above zero, and ice thickness is 0. The model number of the investigated tower is 2B2-ZM2. Its nominal height is 30 m. The wind span, weight span, and equivalent span are 410 m, 550 m, and 450 m, respectively. The properties of the conductor and ground line are shown in Table 1.

Table 1.
Properties of conductor and ground line.
2.2. FEM Models
2.2.1. FEM Elements and Material Properties
The transmission tower is a spatial structure system composed of main leg members, diagonal members, and redundant members. The main leg members and diagonal members are generally connected by bolts and gusset plates in order to make the nodes have a strong restraining effect. According to released research results, the difference between the calculation results of rigid connection and semirigid connection is not significant, and they can be utilized for FEM analysis. Therefore, the rigid node model is used in the numerical simulation to simplify the calculation [40,41,42]. Hence, the transmission tower is modeled in ABAQUS software, where tower members are modeled using B31 elements assuming rigid connections. In addition, tower members are structured with equal-legged angles, the yield strength of main leg members is 345 MPa, and the yield strength of diagonal members as well as redundant bracing members is 235 MPa. Last, the damping coefficients and in tower-line coupled system are totally based on Rayleigh formula, where the and of transmission towers are 0.2 and 0 compared to conductors with 0.02 and 0. The elastic modulus of both kinds of steel and density are taken as 206 GPa and 7850 kg/m3, respectively. Specific information about the angles of model tower is shown in Table 2.
Table 2.
Information of angles in model tower.
2.2.2. Selection of Stress-Strain Relationship
In this paper, the stress–strain relationship of angles is the double broken line model of the yield strength of 345 MPa and 235 MPa with Mises yield and kinematic hardening criterion. When the steel reaches yield strength, there is an increasing number of slip surfaces and the material changes from yielding to strengthening, exhibiting elastic–plastic properties. The stress–strain relationship is shown as Figure 1.
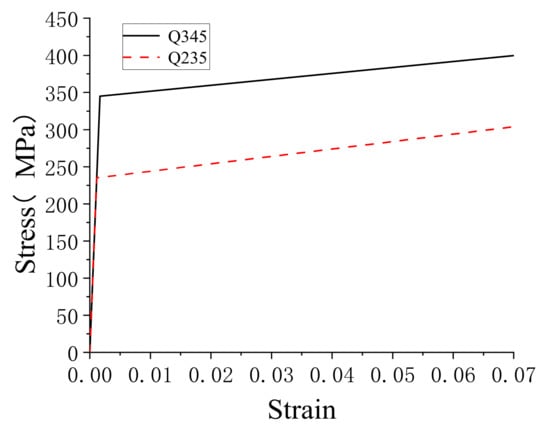
Figure 1.
The stress-strain relationship for angles in the FEM models.
2.2.3. Modal Analysis of the Transmission Tower
In order to verify the reasonableness of the transmission tower, the self-vibration characteristics of the structure are usually calculated when the structural design is carried out.
The first three modes and the corresponding frequencies of the transmission tower obtained by the modal analysis in this paper are shown in Figure 2. As can be seen from Figure 2, the distribution of the first three modes of the transmission tower is reasonable. The first mode is out of plane bending deformation, the second mode is in-plane bending deformation, and the third mode is out of plane torsional deformation. There is no local vibration phenomenon, indicating that the finite element model of the tower is correct.
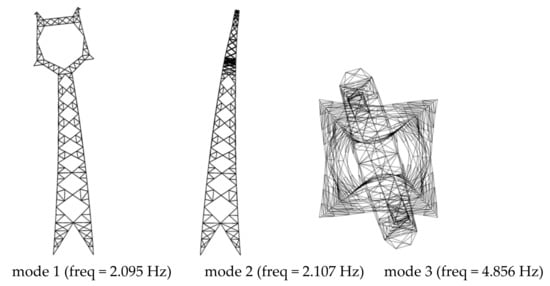
Figure 2.
The first three modes and the corresponding frequencies of the tower.
2.3. Loads Calculation and Application
Structure loads of the studied tower under the strong wind can be divided into horizontal and vertical loads according to the different direction. The direction of the wind load applied to the structure is perpendicular to the direction of the conductor and ground wire, and the vertical loads refer to the load acting along the direction of gravity. The wind loads are calculated separately according to the load code for the design of overhead transmission line [43].
2.3.1. Calculation of Vertical Loads
The vertical loads are composed by the gravity loads amongst transmission towers, conductors, ground lines, insulator strings, and metal fittings, respectively. The dead load of the transmission tower itself is considered by defining the material density and gravitational acceleration, which is automatically calculated by the ABAQUS software. The characteristic value of the self-weight load of conductors and ground lines should be calculated according to Equation (1).
where, is the number of subconductor per phase of the conductor. is the vertical span from conductor and ground line, unit: m. is ice-free vertical specific load between the conductor and ground line, unit: N/(m·mm2). is cross-sectional area for conductor and ground wire, unit: mm2.
2.3.2. Calculation of Horizontal Loads
Based on the height of the transmission tower and cross-sectional location, the transmission tower is divided into 7 panels and set 7 simulation points. Referring to the load code for the design of overhead transmission line [43] to calculate the value of the wind load, the most unfavorable wind angle is 90°, which provided considerable impact on the transmission line. Therefore, only calculated the wind direction angle of 90°. The tower segmentations and simulating points are as shown in Figure 3.
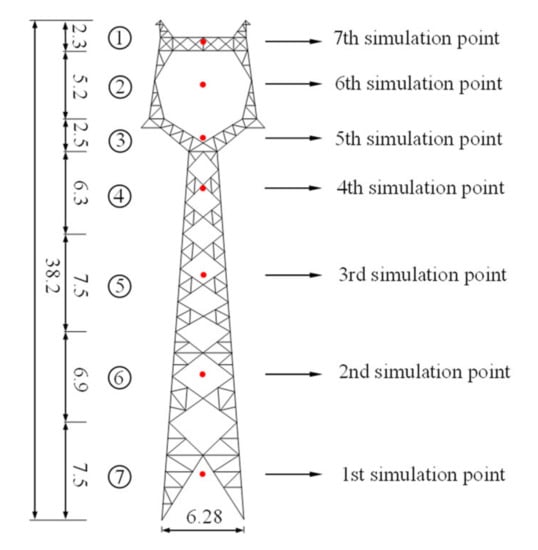
Figure 3.
Divisions and simulating points of the studied tower (unit: m).
When the wind direction is perpendicular to the conductor and ground wire, the characteristic value of wind loads applied to the transmission lines can be expressed by Equations (2) and (3).
In Equation (2), is the span reduction factor. is the wind pressure height variation coefficient. is the body coefficient. When line diameter is less than 17 mm, it should be taken as 1.1. When the wire diameter is greater than or equal to 17 mm, it should be taken as 1.0. is the wind gust factor of conductor and ground line. is the diameter of the conductor and ground wire or the calculated outside one in case of ice cover. Split conductor is taken as the sum of the outside diameter of all subconductors. is the horizontal span of the tower. is the increase coefficient of ice load, when the thickness of ice coating is 5 mm and 10 mm, and is 1.1 and 1.2, respectively. For the case of no ice load, is 1.0, and for calculating tension of conductor, is 1.0, where is the angle between the wind direction and direction of conductor and ground line. In Equation (3), is the characteristic value of the reference wind pressure, and is the basic wind speed.
Wind load of transmission tower could be predicted by Equation (4).
where, is the wind vibration factor of the tower at height Z (m) given by Equations (5)–(8).
where, g is the peak factor, taking 2.5; is the pulsation reduction coefficient of tower under wind load; I10 is the nominal turbulence intensity at 10 m height, taking 0.14 for Class B ground roughness; BZi is the background factor; R2 is the resonance factor; is the first-order mode of the tower; cohZ (zj, zj’) is the vertical coherence function; is the first-order damping ratio of the tower; and f1 is the first-order vibration frequency of the tower.
To analyze the mechanical properties of the transmission tower under strong wind, the effect of wind load on the insulator string at the conductor line should also be taken into account. The characteristic value of the insulator string wind load can be obtained by Equation (9).
In Equation (9), is the number of insulator strings in the vertical wind direction; is the wind load shielding reduction factor for downwind insulator strings; is the calculated value of wind pressure aera of sing insulator string; and B3 is increased factor of wind load of insulator string over ice. The calculation results of wind load applied to the tower, conductors, and ground lines are illustrated in Table 3 and Table 4.
Table 3.
Wind loads of tower sections (the wind speed is 25 m/s and the wind direction angle is 90°).
Table 4.
Wind loads on the conductor, ground line, and insulator.
2.3.3. Load Application on Transmission Tower
Before loading, the tower foot of the FEM model is set as a fixed constraint boundary, and the wind loads of the tower are applied to the corresponding nodes of the transmission tower body and cross arm. In addition, the wind loads and weight of conductor wires, ground wires and insulators, are applied as point forces to the corresponding positions of the transmission tower. The load application on the transmission tower is as shown in Figure 4.
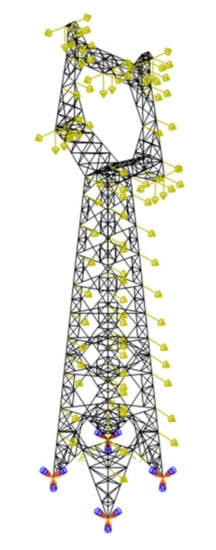
Figure 4.
Load application on transmission tower.
2.4. Analysis of Failure Mode of Transmission Tower
When the transmission tower is subjected to external loads, main legs, and diagonal bracings are mainly carried the combined effect of axial forces and bending moment so as to result members in the buckling failure and potential deficiency of local stiffness and strength, which cause the collapse of the transmission tower. Hence, it is necessary to analyze the collapse of transmission towers.
To simulate the vulnerable member and mechanical characteristics of the transmission tower under strong winds, there are seven different wind speeds among 15 m/s, 20 m/s, 25 m/s, 26 m/s, 27 m/s, 28 m/s, and 30 m/s setting in this paper. The deformation of the transmission tower and the variation rule of the member internal force are analyzed by calculating the wind loads at different wind speeds, so as to obtain the maximum stress of the members and the top displacement of the transmission tower at different wind speeds. The results are shown in Table 5.
Table 5.
Calculation results of displacement and internal force of transmission tower at different speed.
As shown in Table 5, the transmission tower is still in elastic stage when the wind speed rises to 26 m/s. When the speed increases to 27 m/s, the member with maximum stress, the lower part of leg members in the 5 panel on the pressure side, proceeds to the plastic stage. Although the deformation begins to accelerate and this member even gradually withdraw from work, the maximum stress bracing is not buckled at this time, leading to stress redistribution in the transmission tower. After the structure enters the plastic stage, the stress of the main leg on the pressure side of the 5th panel increases significantly due to the leg member in the 6th panel on the same side reaching the yield strength. Figure 5 presents that leg members with the most significant change in stress are the No. 1 and No. 2 in the 5th panel. The stress variation curves of No.1 and No. 2 are shown in Figure 6. It can be seen from Figure 6 that the No. 2 rod will become the second yielding member on the compression side, and the stress of No. 1 member will increase sharply after the maximum stress member reaches yield strength. The stress–strain nephogram of vulnerable members is shown in Figure 7. It can be seen that due to the symmetry structure of the transmission tower, when the wind direction is perpendicular to the direction of the transmission line, and the wind blows to the tower at a 90 degree angle, the stresses of the two main legs is relatively close to each other, which indicates that the main members are more significantly affected by the axial forces and bending moments. Therefore, the possibility of lateral torsional behavior of the structure under wind loads is unlikely.
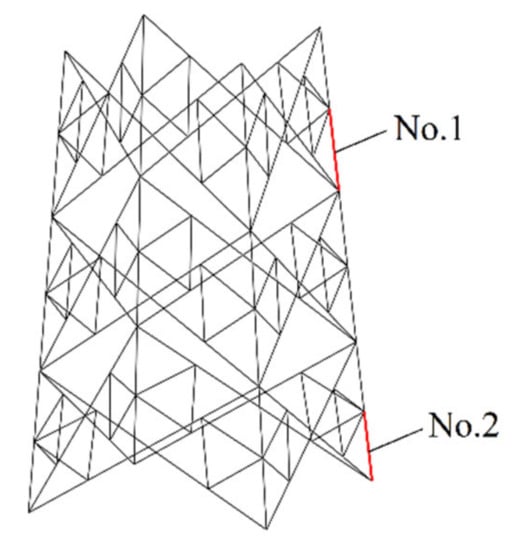
Figure 5.
Positions of No. 1 and No. 2.
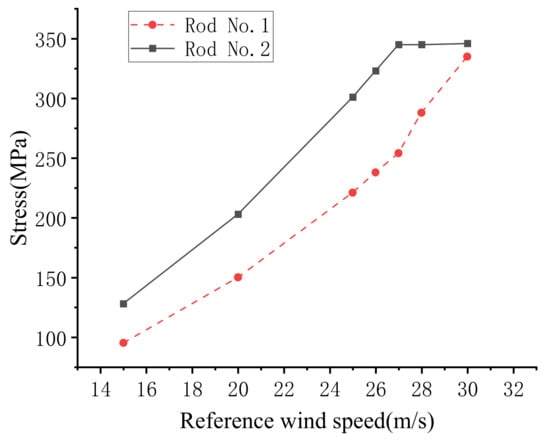
Figure 6.
Stress variation curves of No. 1 and No. 2.
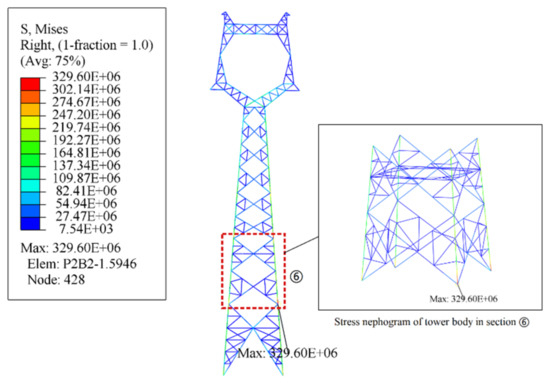
Figure 7.
Stress nephogram of the transmission tower (V10 = 26 m/s).
The variation curve of transmission tower top displacement with wind speed is shown in Figure 8. When the wind speed exceeds to 30 m/s, the displacement of top tower changes abruptly. Here, the buckling analysis of transmission tower can be carried out. Firstly, the eigenvalue buckling analysis is performed on the transmission tower. Secondly, the obtained first-order buckling mode was applied to the tower as an initial defect. Finally, the nonlinear buckling analysis was carried out on the tower after updating the model. The results showed that vulnerable members in the studied tower was complied with buckling failure. Before the collapse of the transmission tower, the ultimate displacement of top tower is 0.378 m which can be taken as collapse displacement of the tower. Similarly, the wind speed of 30 m/s was determined as the critical collapsed wind speed in the same structure. The stress nephogram of the transmission tower and position of the failed member under this speed are shown in Figure 9. Since the main leg on the pressurized side of the 6th panel yielded in the first time, this member is determined to be the one that initially failed.
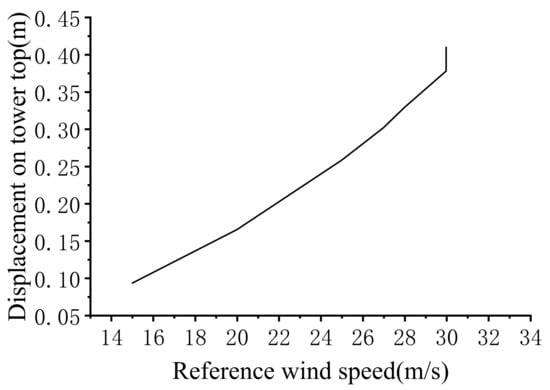
Figure 8.
The variation curve of transmission tower top displacement with wind speed.
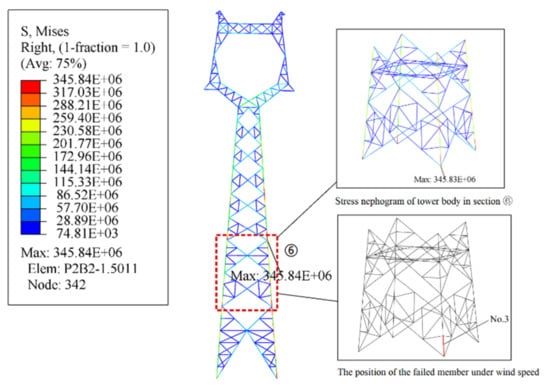
Figure 9.
Stress nephogram of the failure member (V10 = 30 m/s).
The stress–wind speed variation curve of a failure member is shown in Figure 10. After entering the plastic stage, the stress of failed member is not increased significantly but remains near the limit of yielding. As the leading load-bearing component, the buckling of the leg member could lead the whole tower to be in the failure mode, which contributes to the redistribution of structural internal forces. As the wind load continues to be applied, load paths of the leg member would be destroyed due to the buckling of its surrounding members one after another, resulting in an escalation in strain and a sharp decrease in load-carrying capacity and eventually collapse of the transmission tower. The failure mode of the transmission tower is shown in Figure 11.
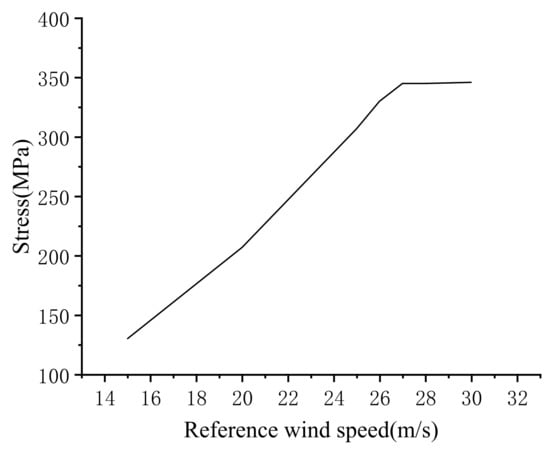
Figure 10.
Stress–wind speed variation curve of buckling member.
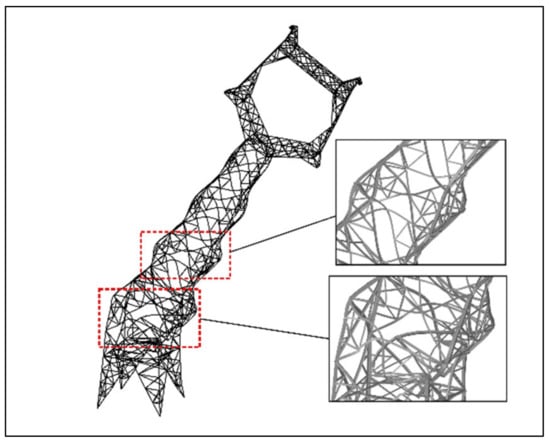
Figure 11.
Failure mode of transmission tower under strong wind.
3. Analysis of Wind-Induced Response of Tower-Line System
Composed by transmission towers and conductors, ground wires, and metal fittings, high-voltage transmission lines are long-span and tail-flexible structural systems, which are susceptible to wind-induced dynamic excitation. Although the wind vibration coefficient and wind load adjustment factor are introduced in current codes to calculate the wind vibration response of transmission towers by equating the wind load into static load, it is still difficult to accurately reflect the time and amplification effect of the fluctuating wind. Therefore, it is especially important to analyze the wind vibration response of the tower-line system under the fluctuating wind. In order to precisely calculate the dynamic response of transmission towers under fluctuating wind loads, three towers and four transmission lines is modeled by the ABAQUS software for wind vibration response analysis based on the 1.1 project background as an example.
3.1. Finite Element Model of Tower-Line System
The transmission tower is in accordance with the same material properties and modeling approach as the single tower described above. To ensure the accuracy of the results, the initial configuration of conductors and ground wires is acquired by Equation (10), and the precise geometry for its normal operation is determined using an iterative form finding method. The form finding of conductors and ground lines is shown in Figure 12.
where is the horizontal stress of the overhead line; is the specific loading, is the horizontal coordinate of conductors and ground lines; is the longitudinal coordinate of conductors and ground lines.
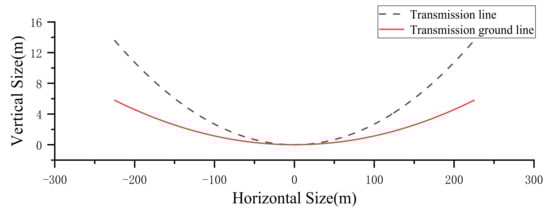
Figure 12.
Form finding of conductor and ground line.
Due to only sustain axial tensile stress, the transmission line should be simulated using truss elements and ignoring the elements’ compression. The conductors could be hinged to the insulators as same as the transmission tower and wire connection method. The FEM model of tower-line system is shown in Figure 13.
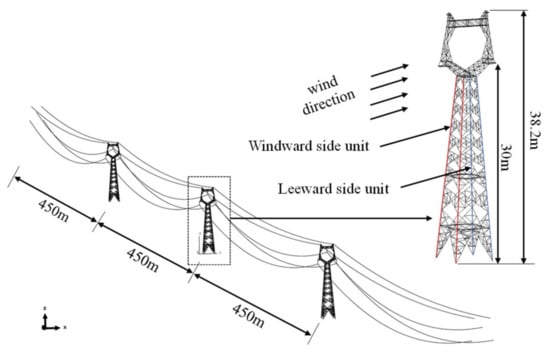
Figure 13.
FEM model of tower-line system.
3.2. Simulation of Wind Load
The simulation of fluctuating wind is the basis for the analysis of the dynamic characteristics of the tower-line coupled system. Through the simulation of fluctuating wind speed, the wind load applied to the tower-line system can be obtained, which can lay the solid the foundation for dynamic response analysis of this system.
The atmospheric boundary layer wind consists of mean wind and fluctuating wind, and the wind speed at t and z which is the moment and height respectively can be described as Equation (11).
where, is the mean wind speed, and
is the fluctuating wind speed. Remarkably, the mean wind speed is calculated according to the equation of the variation of wind speed with height described by the exponential function proposed by Davenport, as shown in Equation (12).
In this case, the mean wind speed is calculated according to the equation of the variation of wind speed with height described by the exponential function proposed by Davenport, as shown in Equation (12).
where z1 and z2 are heights; and are mean wind speeds; and a is the ground roughness index.
Fluctuating winds are then simulated using the Davenport wind speed spectrum, which is calculated as Equation (13).
In Equation (13), is the fluctuating wind speed frequency; is the Davenport power spectral density function; and is the flow shear velocity which are shown in , where is the mean speed at 10 m height, and is the constant coefficient associated with the geomorphology, taking 0.00215.
To consider the impact of spatial correlation, the fluctuating wind simulation is performed in MATLAB software by means of the harmonic synthesis method. The spatial correlation coefficient of fluctuating wind speed can be calculated by the following Equation (15).
In Equation (15), is the frequency of fluctuating wind; is the attenuation coefficient in the vertical direction at any two points in space; is the mean wind speed at i point; and symbolize the spatial coordinates of i point and j point in Z-axis direction.
In order to validate the accuracy of the time-history curves of the fluctuating wind, the highest and lowest points of the fluctuating wind speed power spectrum compared with the target spectrum are listed at 27 m/s the reference wind speed. Simultaneously, the time–history curves of wind speed are shown in Figure 14.
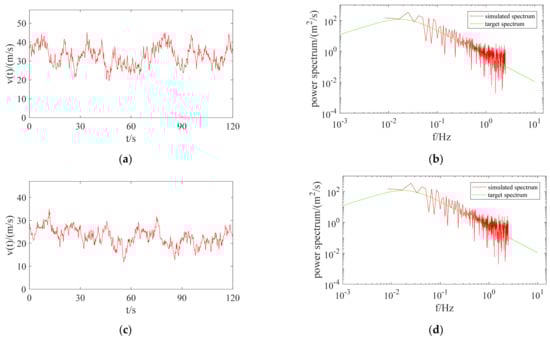
Figure 14.
Time-history and power spectrum curves of fluctuating wind. (a) Time-history curve of wind speed at the highest point, (b) power spectrum curve at the highest point, (c) time-history curve of wind speed at the lowest point, (d) power spectrum curve at the lowest point.
Figure 14 shows that the power spectrum of fluctuating wind speed agrees well with the target spectrum and can be utilized for numerical calculations. The time–history curve of wind speed is converted into a time–history curve of wind load according to the load code for the design of overhead transmission line [43]. The FEM analysis of the tower-line system is carried out in Abaqus software. Specifically, the dynamic wind load of each calculation panel is equally distributed to each loading point, where the wind load lasted for 120 s with a step size of 0.2 s and wind angle of 90° at which the direction is perpendicular to the line direction. The dynamic response analysis of the tower-line system under the wind load with different wind speeds can be achieved from the response of the tower line system at different moments.
Based on the aforementioned static study, when wind speed reaches to 26 m/s, the entire transmission tower is in an elastic state. When wind speed rises to 27 m/s, the stress maximum member, in lower part of the main on the compression side of the 6th panel, is carried into the plastic phase, revealing that it gradually withdraws from work with the increasing deformation. Therefore, in the dynamic analysis, the structural response at a reference wind speed value of 25 m/s is calculated first, and this reference wind speed value is gradually increased in the subsequent calculations.
3.3. Numerical Results of Wind-Induced Vibration Response
By analyzing the dynamic response of the tower-line system under the fluctuating wind load, the effect of wind-induced vibration of transmission towers is obtained under the impact of the tower-line system. The results show that the collapse possibility of transmission towers could be increased due to the coupling effect of tower-line system and randomness of fluctuating wind loads. Figure 15 and Figure 16 show the time–history curves of the maximum stress and top displacement of the transmission tower, respectively.
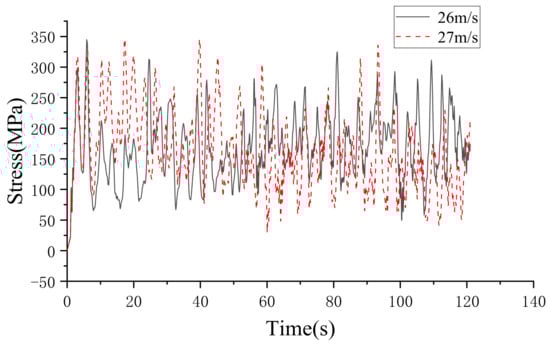
Figure 15.
The maximum stress–time curve of transmission tower.
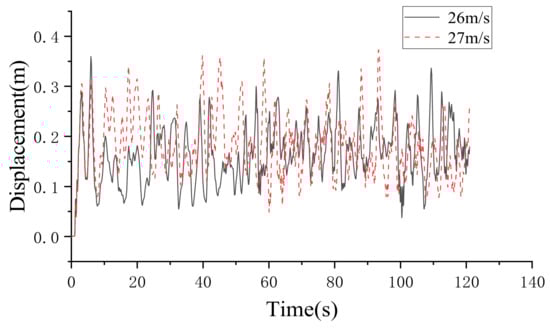
Figure 16.
The top displacement–time curve of transmission tower.
Based on the aforementioned analysis, it is found that the tower-line system is completely in elastic stage when wind speed rise to 25 m/s, and the maximum stress position is alternated at the bottom of the 5th and 6th panel. As shown in Figure 15, when wind speed increases to 26 m/s, each transmission tower is in normal working condition, and the load-carrying capacity is still relatively stable. However, the lower leg member of 6th panel reaches the yield strength at the moment of 5.8 s, while the other moments were still in the elastic stage. When wind speed is 27 m/s, the stress of the main member on compressed side of the 6th panel attaches to yield. When wind speed rise to 28 m/s, the leg member at bottom of the 6th panel reached the ultimate stress immediately, while the finite element calculation is not to satisfy the convergence condition, which indicates that the tower could collapse at this time.
Figure 16 is the displacement–time curve on top of the tower. Combined with the stress–time curve, it can be found that, when the displacement on top of the tower is 0.36 m, the transmission tower has parts into yield. When the displacement is 0.4 m, the FEM model is not convergent, which indicates collapse of the transmission tower. Hence, it can be found that the tower-line system would be in a safe and stable operation when wind speed is lower than 27 m/s. When the wind speed attaches to 27 m/s, the leg bracing on the pressure side of the 6th panel reaches yield strength. When the wind speed rises to 28 m/s, the leg bracing on the pressure side of the 6th panel attaches to the ultimate stress, which leads to the collapse of the tower. Meanwhile, it can be determined that the leg member on the pressure side of the 6th panel would be the vulnerable part of the tower to collapse and failure under the wind load with 90° wind angle.
Comparing the wind vibration response calculation results with those under static wind load, it can be found that there are few differences between the two in terms of failure mode, and yield wind speed would remain the same level. Compared with the static analysis, however, the collapse of transmission towers could be significantly earlier in the dynamic analysis.
Since the transmission tower is in the elastic stage under wind speed of 25 m/s, the dynamic initial wind load is calculated from the specific point when V10 = 25 m/s. The comparison of the response of the transmission tower under static and dynamic wind load is shown in Table 6.
Table 6.
Comparison of wind-induced response of transmission tower under static and dynamic wind load.
4. Conclusions
This paper presents the ultimate load-carrying capacity of a 220 kV transmission tower, collapse mechanism, and failure mode of this tower under strong wind. The static and dynamic FEM analyses of the tower-line system have been carried out in ABAQUS software. Specifically, dynamic analysis of the tower-line system is carried out to understand its dynamic response under fluctuating wind, which is once in contrast with the response beneath equal static wind load. Based on the numerical results obtained from the kind of transmission tower in this paper, the following conclusions can be summarized as follows:
- From the analysis of the single tower under equivalent static wind load, it is found that, when the wind speed is 27 m/s, the maximum stress bracing is once the leg member on the compression side of the 6th panel, at which this member has entered into the plastic stage. With the enlargement of deformation, the leg member in the 5th panel reaches yield strength. When the wind speed is higher than 30 m/s, the main leg in the 6th panel buckles, which in the end renders the transmission tower to collapse. The ultimate displacement on the pinnacle of the tower earlier than failure is 0.378 m.
- Combined with three towers and four lines, the tower-line system is modeled to analysis the dynamic time–history response under fluctuating wind. It is found that the maximum stress bracing of the center transmission tower in tower-line system be viewed as the leg member in the 6th panel on pressure side. When the wind speed rises to 27 m/s, the leg member of the 6th section on the pressure side reaches yield strength. When the wind speed attaches to 28 m/s, the aforementioned member has a large local deformation, which symbolizes the buckling failure of this member.
- By comparing the failure mode of transmission tower under static wind load with that under dynamic wind load, it is found that the yield wind speed of both condition is at the same level, the failure mode and collapse displacement are close to each other, indicating that the wind vibration factor according to the load code for the design of overhead transmission line [43] not only greatly reflect the stress response of the tower bracing in elastic stage under fluctuating wind but also accurately assess the collapse displacement of transmission tower. Compared with the dynamic analysis, however, in the dynamic analysis the maximum displacement on the top tower is significantly larger than that, and the collapse of the transmission tower is earlier, which reveals that the wind vibration coefficient cannot greatly reflect the increasing effect of the fluctuating wind on the displacement of the top of the tower. Remarkably, the static calculation results overestimated the load-carrying capacity of the transmission tower in the plastic stage. Therefore, the wind resistance design and retrofitting bracing and even maintenance of the transmission tower should take into account the increasing effect of the displacement which are caused by the fluctuating wind. The research results of this paper provide important reference value for the wind resistance design, reinforcement and maintenance of the same type of transmission tower.
Author Contributions
J.L.: conceptualization, project administration. F.G.: methodology, investigation. L.W.: investigation, resources. Y.R.: resources and data curation. C.L. (Chuncheng Liu): supervision, writing—review & editing. A.Y.: formal analysis. Z.Y.: software, visualization. T.J.: software, data curation. C.L. (Chengbo Li): writing—review & editing. All authors have read and agreed to the published version of the manuscript.
Funding
This research was funded by the National Natural Science Foundation of China (Grant No. 51278091) and the technology cost project of Hebei Huizhi Electric Power Engineering Design Co., Ltd. (Grant No. HZHTCG2021-09).
Data Availability Statement
Not applicable.
Acknowledgments
The authors gratefully acknowledge Hebei Huizhi Electric Power Engineering Design Co., Ltd. and School of Northeast Electric Power University that have contributed to the research results reported within this paper.
Conflicts of Interest
The authors declare that they have no known competing financial interests or personal relation-ships that could have appeared to influence the work reported in this paper.
References
- Lei, X.; Fu, X.; Xiao, K.; Wang, J.; Nie, M.; Li, H.N.; Xie, W.P. Failure Analysis of a Transmission Tower Subjected to Wind Load Using Uncertainty Method. Proc. CSEE 2018, 266–274. [Google Scholar] [CrossRef]
- Dempsey, D.; White, H. Winds wreak havoc on lines. Transm. Distrib. World 1996, 48, 32–37. [Google Scholar]
- Davenport, A.G. Gust loading factors. J. Struct. Div. 1967, 93, 11–34. [Google Scholar] [CrossRef]
- Ozono, S.; Maeda, J. In-plane dynamic interaction between a tower and conductors at lower frequencies. Eng. Struct. 1992, 14, 210–216. [Google Scholar] [CrossRef]
- Yasui, H.; Marukawa, H.; Momomura, Y.; Ohkuma, T. Analytical study on wind-induced vibration of power transmission towers. J. Wind Eng. Ind. Aerodyn. 1999, 83, 431–441. [Google Scholar] [CrossRef]
- Mara, T.G.; Hong, H.P. Effect of wind direction on the response and capacity surface of a transmission tower. Eng. Struct. 2013, 57, 493–501. [Google Scholar] [CrossRef]
- Battista, R.C.; Rodrigues, R.S.; Pfeil, M.S. Dynamic behavior and stability of transmission line towers under wind forces. J. Wind Eng. Ind. Aerodyn. 2003, 91, 1051–1067. [Google Scholar] [CrossRef]
- Desai, Y.M.; Yu, P.; Popplewell, N.; Shah, A.H. Finite element modelling of transmission line galloping. Comput. Struct. 1995, 57, 407–420. [Google Scholar] [CrossRef]
- Salawu, O. Detection of structural damage through changes in frequency: A review. Eng. Struct. 1997, 19, 718–723. [Google Scholar] [CrossRef]
- Carden, E.P.; Fanning, F. Vibration based condition monitoring: A review. Struct. Health Monit. 2004, 3, 355–377. [Google Scholar] [CrossRef]
- Lam, H.F.; Yuen, K.V.; Beck, J.L. Structural health monitoring via measured Ritz vectors utilizing artificial neural networks. Comput.-Aided Civ. Infrastruct. Eng. 2006, 21, 232–241. [Google Scholar] [CrossRef]
- Yuen, K.-V.; Lam, H.-F. On the complexity of artificial neural networks for smart structures monitoring. Eng. Struct. 2006, 28, 977–984. [Google Scholar] [CrossRef]
- Lam, H.F.; Ng, C.-T. The selection of pattern features for structural damage detection using an extended Bayesian ANN algorithm. Eng. Struct. 2008, 30, 2762–2770. [Google Scholar] [CrossRef]
- Kim, J.-T.; Ryu, Y.-S.; Cho, H.-M.; Stubbs, N. Damage identification in beam-type structures: Frequency-based method vs. mode-shape-based method. Eng. Struct. 2003, 25, 57–67. [Google Scholar] [CrossRef]
- Lam, H.; Lee, Y.; Sun, H.; Cheng, G.; Guo, X. Application of the spatial wavelet transform and Bayesian approach to the crack detection of a partially obstructed beam. Thin-Walled Struct. 2005, 43, 1–21. [Google Scholar] [CrossRef]
- Lam, H.; Ng, C.; Veidt, M. Experimental characterization of multiple cracks in a cantilever beam utilizing transient vibration data following a probabilistic approach. J. Sound Vib. 2007, 305, 34–49. [Google Scholar] [CrossRef]
- Lam, H.F.; Ng, C.-T. A probabilistic method for the detection of obstructed cracks of beam-type structures using spatial wavelet transform. Probabilistic Eng. Mech. 2008, 23, 237–245. [Google Scholar] [CrossRef]
- Lam, H.F.; Ng, C.T.; Leung, A.Y. Multicrack Detection on Semirigidly Connected Beams Utilizing Dynamic Data. J. Eng. Mech. 2008, 134, 90–99. [Google Scholar] [CrossRef][Green Version]
- Yam, L.; Li, Y.; Wong, W. Sensitivity studies of parameters for damage detection of plate-like structures using static and dynamic approaches. Eng. Struct. 2002, 24, 1465–1475. [Google Scholar] [CrossRef]
- Loutridis, S.; Douka, E.; Hadjileontiadis, L.; Trochidis, A. A two-dimensional wavelet transform for detection of cracks in plates. Eng. Struct. 2005, 27, 1327–1338. [Google Scholar] [CrossRef]
- Yin, T.; Lam, H.-F.; Chow, H.-M. A Bayesian Probabilistic Approach for Crack Characterization in Plate Structures. Comput. Civ. Infrastruct. Eng. 2010, 25, 375–386. [Google Scholar] [CrossRef]
- Lam, H.F.; Yin, T. Statistical detection of multiple cracks on thin plates utilizing measured dynamic response. Eng. Struct. 2010, 32, 3145–3152. [Google Scholar] [CrossRef]
- Alminhana, F.; Mason, M.; Albermani, F. A compact nonlinear dynamic analysis technique for transmission line cascades. Eng. Struct. 2018, 158, 164–174. [Google Scholar] [CrossRef]
- Loredo-Souza, A.; Davenport, A. A novel approach for wind tunnel modelling of transmission lines. J. Wind Eng. Ind. Aerodyn. 2001, 89, 1017–1029. [Google Scholar] [CrossRef]
- Deng, H.Z.; Xu, H.J.; Duan, C.Y. Experimental and numerical study on the responses of a transmission tower to skew incident winds. J. Wind Eng. Ind. Aerodyn. 2016, 157, 171–188. [Google Scholar] [CrossRef]
- Wenjuan, L.; Bingnan, S.; Jinchun, T. Wind test and numerical computation on wind-induced vibration for tall lattice tower. J. Vib. Eng. 1996, 9, 318–322. [Google Scholar]
- Zhao, S.; Yan, Z.T.; Li, Z.L.; Dong, J.Y.; Zhong, Y.L. Investigation on wind tunnel tests of an aeroelastic model of 1000 kV Sutong long span transmission tower-line system. Proc. CSEE 2018, 38, 5257–5265. [Google Scholar]
- Yong, G.; Bing, N.S.; Yin, Y. Time-domain analysis on wind-induced dynamic response of long span power transmission line system. China Civ. Eng. J. 2006, 39, 12–17. [Google Scholar]
- Zhang, J.; Xie, Q. Failure analysis of transmission tower subjected to strong wind load. J. Constr. Steel Res. 2019, 160, 271–279. [Google Scholar] [CrossRef]
- Cheng, Z.J.; Fu, G.; Lou, W. Research for the wind force on high-rise latticed tower. J. Exp. Mech. 2000, 15, 51–55. [Google Scholar]
- Li, X.; Zhang, W.; Niu, H.; Wu, Z.Y. Probabilistic capacity assessment of single circuit transmission tower-line system subjected to strong winds. Eng. Struct. 2018, 175, 517–530. [Google Scholar] [CrossRef]
- An, L.; Wu, J.; Zhang, Z.; Zhang, R. Failure analysis of a lattice transmission tower collapse due to the super typhoon Rammasun in July 2014 in Hainan Province, China. J. Wind Eng. Ind. Aerodyn. 2018, 182, 295–307. [Google Scholar] [CrossRef]
- Wen-zhe, B.I.; Li, T. Study on the collapse failure of transmission tower-line system under downburst. Eng. Mech. 2022, 39, 1–6. [Google Scholar]
- Xu, Y.-L.; Qu, W.L.; Chen, Z.H. Control of Wind-Excited Truss Tower Using Semiactive Friction Damper. J. Struct. Eng. 2001, 127, 861–868. [Google Scholar] [CrossRef]
- Qu, W.; Chen, Z.; Xu, Y. Dynamic analysis of wind-excited truss tower with friction dampers. Comput. Struct. 2001, 79, 2817–2831. [Google Scholar] [CrossRef]
- Markiewitz, M. Optimum dynamic characteristics of stock bridge dampers for dead-end spans. J. Sound Vib. 1995, 188, 243–256. [Google Scholar] [CrossRef]
- Tesar, A.; Kuglerova, J. Tuned vibration control of overhead line conductors. Int. J. Numer. Methods Eng. 2000, 48, 1215–1239. [Google Scholar] [CrossRef]
- Diana, G.; Cigada, A.; Belloli, M.; Vanali, M. Stockbridge-type damper effectiveness evaluation: Part i-comparison between tests on span and on the shaker. IEEE Trans. Power Deliv. 2003, 18, 1462–1469. [Google Scholar] [CrossRef]
- Diana, G.; Manenti, A.; Pirotta, C.; Zuin, A. Stockbridge-type damper effectiveness evaluation: Part II-the influence of the impedance matrix terms on the energy dissipated. IEEE Trans. Power Deliv. 2003, 18, 1470–1477. [Google Scholar] [CrossRef]
- Li, Z.; Han, Y.; Liu, C. A Study on the Bearing Capacity of the Transmission Tower-Leg with Semi-rigid Joints. Prog. Steel Build. Struct. 2021, 23, 25–31. [Google Scholar]
- Qian, C.; Shen, G.; Guo, Y.; Xing, Y.L. Influence of semi-rigid connections on wind-induced responses of transmission towers. J. Zhejiang Univ. (Eng. Sci.) 2017, 51, 1082–1089. [Google Scholar]
- Jiao, A.; Li, Z.; Liu, H. Study on ultimate strength of semi-rigid K-type joints in UHV transmission tower. J. Build. Struct. 2014, 35, 53–60. [Google Scholar]
- DL/T 5551-2018; Power Industry Standards of the People’s Republic of China. Load Code for the Design of Overhead Transmission Line. China Planning Press: Beijing, China, 2018.
Publisher’s Note: MDPI stays neutral with regard to jurisdictional claims in published maps and institutional affiliations. |
© 2022 by the authors. Licensee MDPI, Basel, Switzerland. This article is an open access article distributed under the terms and conditions of the Creative Commons Attribution (CC BY) license (https://creativecommons.org/licenses/by/4.0/).