Article

The Influence of Co-Fermentation of Agri-Food Waste with Primary Sludge on Biogas Production and Composition of the Liquid Fraction of Digestate

by
Anna Wilinska-Lisowska
,
Monika Ossowska
and
Krzysztof Czerwionka
*
Faculty of Civil and Environmental Engineering, Gdansk University of Technology, 80-233 Gdansk, Poland
*
Author to whom correspondence should be addressed.
Energies 2021, 14(7), 1907; https://doi.org/10.3390/en14071907
Submission received: 10 March 2021 / Revised: 23 March 2021 / Accepted: 27 March 2021 / Published: 30 March 2021
(This article belongs to the Special Issue Advanced Wastewater Treatment and Biomass Energy)

Abstract

:
Energy self-sufficiency is a current trend in wastewater treatment plants. This effect can be achieved by increasing the production of electricity from biogas and by reducing energy consumption for technological processes. One idea, in line with the circular economy concept, is the use of waste rich in organic matter as co-substrates for the fermentation process. The aim of this study was to determine the effect of waste co-fermentation on biogas production and nitrogen concentration in the reject water. A co-fermentation process with flotate or flotate and vegetables increased biogas production compared to primary sludge by 162 and 180%, respectively. During the tests, there was no inhibition of the fermentation process. Hydrolysis of organic compounds contained in flotate and vegetables resulted in a significant increase in ammonium nitrogen (by 80–100%) and dissolved organic nitrogen concentration (by 170–180%). The biogas and methane production rate as well as the ammonium and total nitrogen release rate were calculated. An energy balance was made, which took into account the variable amount of electric energy production depending on the efficiency of the cogeneration systems and energy consumption for supplying oxygen necessary to remove nitrogen contained in the reject water. A positive energy balance was obtained for all analyses.

1. Introduction

On 2 December 2015, the European Commission adopted a policy of implementing a circular economy (CE) [1]. The CE model is an alternative to the linear economy, which was guided by the “produce, use, discard” approach. The last stage of the product life cycle is its disposal. The concept of circular economy planning is to keep products, materials, and resources in use as long as possible, minimizing the production of by-products (waste). This idea is to be included at all stages of the product cycle, from design, production, and consumption to waste management. The CE therefore focuses on minimizing the environmental impact in the process of manufacturing products. By-products generated during production are not to be just the last link in the production chain but are to be used further—for example, by material (resources) or energy recovery [2,3,4].
A good example of CE is biogas plants, which utilize waste during the production of biogas. Biogas is produced in the process of methane fermentation of raw materials derived from plant biomass, animal feces, organic waste (e.g., from the food industry), slaughterhouse waste, or sludge generated during wastewater treatment. The resulting biogas is a mixture of methane (approx. 50–85%), carbon dioxide (15–50%), and other gases produced in trace amounts. During fermentation, only a part of the substrate used as input is converted to biogas. The part remaining as a digestate requires final management, e.g., as a fertilizer [5,6]. Depending on the type of organic matter used, we distinguish biogas plants in landfills, agricultural biogas plants, or biogas plants at a wastewater treatment plant [7,8,9].
The CE concept can be successfully applied in biogas plants located near wastewater treatment plants (WWTPs), operating anaerobic digesters (with final digestate management). The basic raw material for the fermentation chambers in WWTP is sewage sludge in the form of primary sludge or waste-activated sludge. The great advantage of locating a biogas plant in such a location is that they have stable, all-year-round availability of the raw material. However, the main limitation in this respect is the availability of sludge, particularly the primary sludge, due to the need to ensure the required amount of organic matter to remove biological nitrogen and phosphorus. The primary sludge may contain heavy metals, which, under anaerobic conditions, and at low pH, transform into a soluble form, which may be toxic to the bacteria involved in the methane fermentation process [10]. Despite these limitations and risks, methane fermentation is an effective method of energy recovery from sewage sludge produced during municipal wastewater treatment processes. It is possible to increase the production of biogas by using other waste as a feedstock, e.g., of agricultural, industrial, or municipal origin. This is possible due to the co-fermentation of sewage sludge with other organic waste in the co-fermentation process [11,12]. The co-fermentation of several products can be an effective way to increase the biogas’ efficiency, and hence the energy effect, in relation to the monofermentation of a given product. The substrates that are fermented together interact, supplying each other with the nutrients necessary for the bacteria. In addition, this is a means of managing many waste products in line with the current trends in water and wastewater management. The co-fermentation process makes it possible to achieve energy self-sufficiency for many large and medium-sized wastewater treatment plants; hence, the number of biogas plants in WWTPs is constantly increasing. Organic waste, which is characterized by a rapid growth in biogas production in the co-fermentation process, can also constitute a form of a specific “energy reserve”. It is used in periods of increased demand for electricity or in the case of a significant decrease in the productivity of fermentation chambers. A properly selected composition of co-substrates enables the generation of energy sufficient not only to cover the plant’s own needs but also to sell it. Despite the many advantages of the co-fermentation process, its implementation requires maintaining a specific environmental regime and maintaining many parameters at the optimal level for the microorganisms carrying out the process [13,14,15].
The potential problem associated with the use of co-fermentation is the increase in the concentration of pollutants, particularly biogenic compounds, in the reject water from the digestate dewatering. This is especially relevant in the case of nitrogen, which is recycled to the main line of WWTPs, increasing the load on the bioreactors. It is estimated that these reject waters increase the nitrogen load introduced to the main wastewater treatment stream by as much as 15–20% [16]. Total nitrogen in the leachate contains mainly ammonium nitrogen and, to a lesser extent, organic nitrogen. This increased load at the same time leads to significant growth in energy consumption for aeration, which lowers or even eliminates the positive energy effect associated with increased biogas production [17]. Moreover, the co-fermentation reject water may elevate the concentrations of organic nitrogen, which may cause an increase in its concentration in the treated wastewater and thus amplify the problem of maintaining the required quality parameters. Separation of the reject water stream and its independent pretreatment can reduce the nitrogen content by 85–90%, thus reducing the load on biological reactors in the wastewater treatment plant [16].
The aim of the study is to determine the effect of the co-fermentation of selected wastes from the agri-food industry on the increase in biogas production, taking into account changes in nitrogen concentration, including the organic nitrogen fraction, in the reject water from digestate dewatering.

2. Materials and Methods

2.1. Research Material

The study of the co-fermentation process was carried out in laboratory conditions. Four feedstock tests were performed, which differed in the share of the analyzed waste in the reactor charge (Table 1). The input material used was: (1) primary sludge from the Swarzewo WWTP, (2) flotate from the wastewater treatment plant at fish product production plants (sludge produced in the coagulation process with iron (III) sulphate and separated in the process of flotation assisted by air saturation), and (3) self-prepared shredded mixture of vegetables (fresh white cabbage, cooked white beans, and fresh onion in a ratio of 1:1:1). The basic characteristics of the feedstocks are presented in Table 2. The inoculum used was the sludge from closed fermentation chambers of the Swarzewo WWTP taken from the circulation system to the external heat exchanger. The WWTP in Swarzewo is located in Northern Poland an in attractive tourist area. It serves approximately 40,000 population equivalents (PE) from the Puck Agglomeration (off-season) and around 150,000 PE (in summer), mainly from people temporarily staying in the town for tourist purposes. Wastewater is treated biologically in sequencing batch reactors (SBR). The sludge management is based on methane fermentation with recovery of electric and heat energy and the final composting process of the solid fraction of the digestate. For years, the process of co-fermentation of sewage sludge with other organic waste has been carried out there.

2.2. Research Stand

The tests were carried out on a laboratory-scale stand, including two anaerobic digestion (AD) reactors operating in a feedstock (non-flow) system (Figure 1). The stainless steel reactor’s capacity was 10 dm3 (active 8 dm3). The reactor chamber was stirred with the use of paddle-type mixers, and the temperature was kept at the assumed level (35–36 °C) by means of a water jacket. Continuous temperature measurements were carried out in the reactors. The volume of produced biogas was measured with use of graduated measuring tubes. Periodically, the composition of biogas in the tubes was measured (in the range of CH4, CO2, O2, NH3, H2S) using the Geotech GA5000 meter (Geotechnical Instruments (UK)).

2.3. Methodology of Digestate Analysis

Four feedstock tests were carried out, aimed at checking the influence of individual input components in the co-fermentation process on the increase in biogas production and on the composition of reject water. In the first test (test I), the basic parameters (background) related to the fermentation process of the organic matter contained in the inoculum were determined. In subsequent tests, individual analyzed substrates were added to the inoculum, i.e., primary sludge (test II), primary sludge and flotate (test III), as well as primary sludge, flotate and vegetable waste (test IV). To facilitate the comparison of the effects of the individual substrates, their entered volume (mass) was the same. In accordance with the methodology used in the research using the Automatic Methane Potential Test System (AMPTS) method, the share of inoculum co-fermentation was approximately 80% (by volume). The primary sludge was always 20% (vol.) of the inoculum, while the amount of the flotate dose, based on the preliminary inhibition studies of the process, was assumed to be 10% of the primary sludge volume. Vegetable waste constituted approx. 33% in relation to the flotate (wet mass).
Each test was carried out for 28 days, which corresponded to the typical value of the hydraulic retention time in the anaerobic fermentation chambers at Swarzewo WWTP (15–30 days). According to Imhoff and Imhoff [10], the recommended time for sewage sludge mesophilic fermentation is less than 27 days. Similar fermentation times were also used in the research carried out by Koch et al. [18] (25 days) and Sosnowski et al. [19] (23–40 days). During the test, the amount of biogas produced was measured daily and its quality was checked periodically (daily at the beginning of the test and once every two days at the end of the test). At specified intervals, samples of the digestate were taken for detailed analysis using a drain valve (the volume of the taken sample was included in the balance of biogas production). The pH of this sample was determined, as well as the content of TS and VS. Part of the sample taken post-fermentation was homogenized for 2 min using a H500 homogenizer. Then, total nitrogen (TN) was determined in the sample. The remaining part of the sample was subjected to mechanical separation in which the solid and liquid phases were separated. Mechanical separation was carried out using a Jouan C3i laboratory centrifuge (Thermo Electron Corporation). In accordance with previous research, the assumed spin speed was 4000 rpm and the centrifugation time was 30 min [20]. The supernatant was further analyzed. The research focused on determining the forms of total nitrogen occurrence in the reject water. It comprised ammonium nitrogen (NH4-N) and organic nitrogen (ON). The concentrations of COD and total nitrogen (TNRW) in the reject water sample were determined. To determine the individual organic nitrogen fractions, the supernatant was filtered through Millipore nitrocellulose filters (Billerica, MA) with pores of 0.1, 0.45, and 1.2 µm. For selected filtrates, total nitrogen (TN0.1 and TN1.2) was also determined with the use of a TOC analyzer with a TN determination adapter (SHIMADZU Corporation, Japan). In addition, the concentrations of NH4-N, volatile fatty acids (VFAs), and COD were determined in the filtrate created by filtration through a filter with a pore size of 0.45 μm using the DR20000 spectrophotometer.
The analytical methodology used by Hach Lange (Germany) and SHIMA-DZU (Japan) was based on the Standard Methods for Examination of Water and Wastewater [21].

2.4. Organic Nitrogen Sequencing

To assess the changes that organic nitrogen undergoes during the co-fermentation process, its fractionation was performed. Organic nitrogen, due to its physical state, can be divided into (Figure 2) [22]:
  • dissolved organic nitrogen (DON);
  • colloidal organic nitrogen (CON);
  • particulate organic nitrogen (PON).
In accordance with the recommended standards, filters with different pore sizes were used to separate the individual fractions of organic nitrogen. The filtrate from the filter with a pore size of 0.1 μm was treated as the dissolved fraction and the suspension on the filter 1.2 μm as the fraction in suspension [22]. On the basis of the analysis results, the concentrations of organic nitrogen fractions were calculated using the following formulas:
PON = TNRW − TN1.2
CON = TN1.2 − TN0.1
DON = TN0.1 − NH4-N

2.5. Energy Balance

The energy balance included a comparison of the amount of electricity produced from the biogas combined heat and power (CHP) unit and the amount of energy used for aeration to remove nitrogen separated from the feedstock to the reject water from digestate dewatering. The amount of energy produced (in CHP units) was calculated using the following formula:
EEl,CHP = ƞCHP · MPR · MCR (kWh/kg VSadded)
where: ƞCHP—energy recovery efficiency in CHP; MPR—methane production rate (m3 CH4/kg VSadded); MCV—methane calorific value (kWh/m3 CH4).
Electric energy consumption for aeration was calculated using following formula:
EEl,AER = ANRR (TNRR) · ƞPN/A · EPN/A + ANRR (TNRR) · (1 − ƞPN/A) · ENit (kWh/kg VSadded)
where: ANRR—ammonium nitrogen release rate (kg N/kg VSadded); TNRR—total nitrogen release rate (kg N/kg VSadded); ƞPN/A—ammonia nitrogen removal efficiency (total nitrogen) in partial nitritation/anammox (PN/A) process; EPN/A—electric energy demand for aeration in PN/A process (kWh/kgNremoved); ENit—electric energy demand for aeration in the process of conventional nitrification (kWh/kgNremoved).

3. Results and Discussion

3.1. Production and Composition of Biogas

The level of energy benefits connected with the co-fermentation process is evidenced by biogas production growth and an increase in the share of methane in it. In the presented research, biogas production was especially high in the initial period. The control test (test I) showed that the inoculum still contained organic matter susceptible to anaerobic degradation, but its level was not high. The daily production of biogas decreased from 1.5 dm3/d to approx. 0.5 dm3/d after 5 days and below 0.2 dm3/d from the 15th day of the test (Figure 3A). These values were four times lower for the daily production of biogas from sewage sludge. Luostarinen et al. [23] obtained values between 1.74 and 2.8 dm3/d in their study of sewage sludge fermentation. The addition of primary sludge to the fermentation increased the biogas production more than seven times in the first two days of the experiment. The majority of the organic substrate available in the sludge was exhausted after approx. 8 days, when the daily increase in biogas production decreased to twice relative to test I (Figure 3B). For tests III and IV, the higher initial increase in biogas production was observed; that in relation to test I reached a 10-times-higher value and around 1.5-times-higher than for the primary sludge (after the first 2 days) (
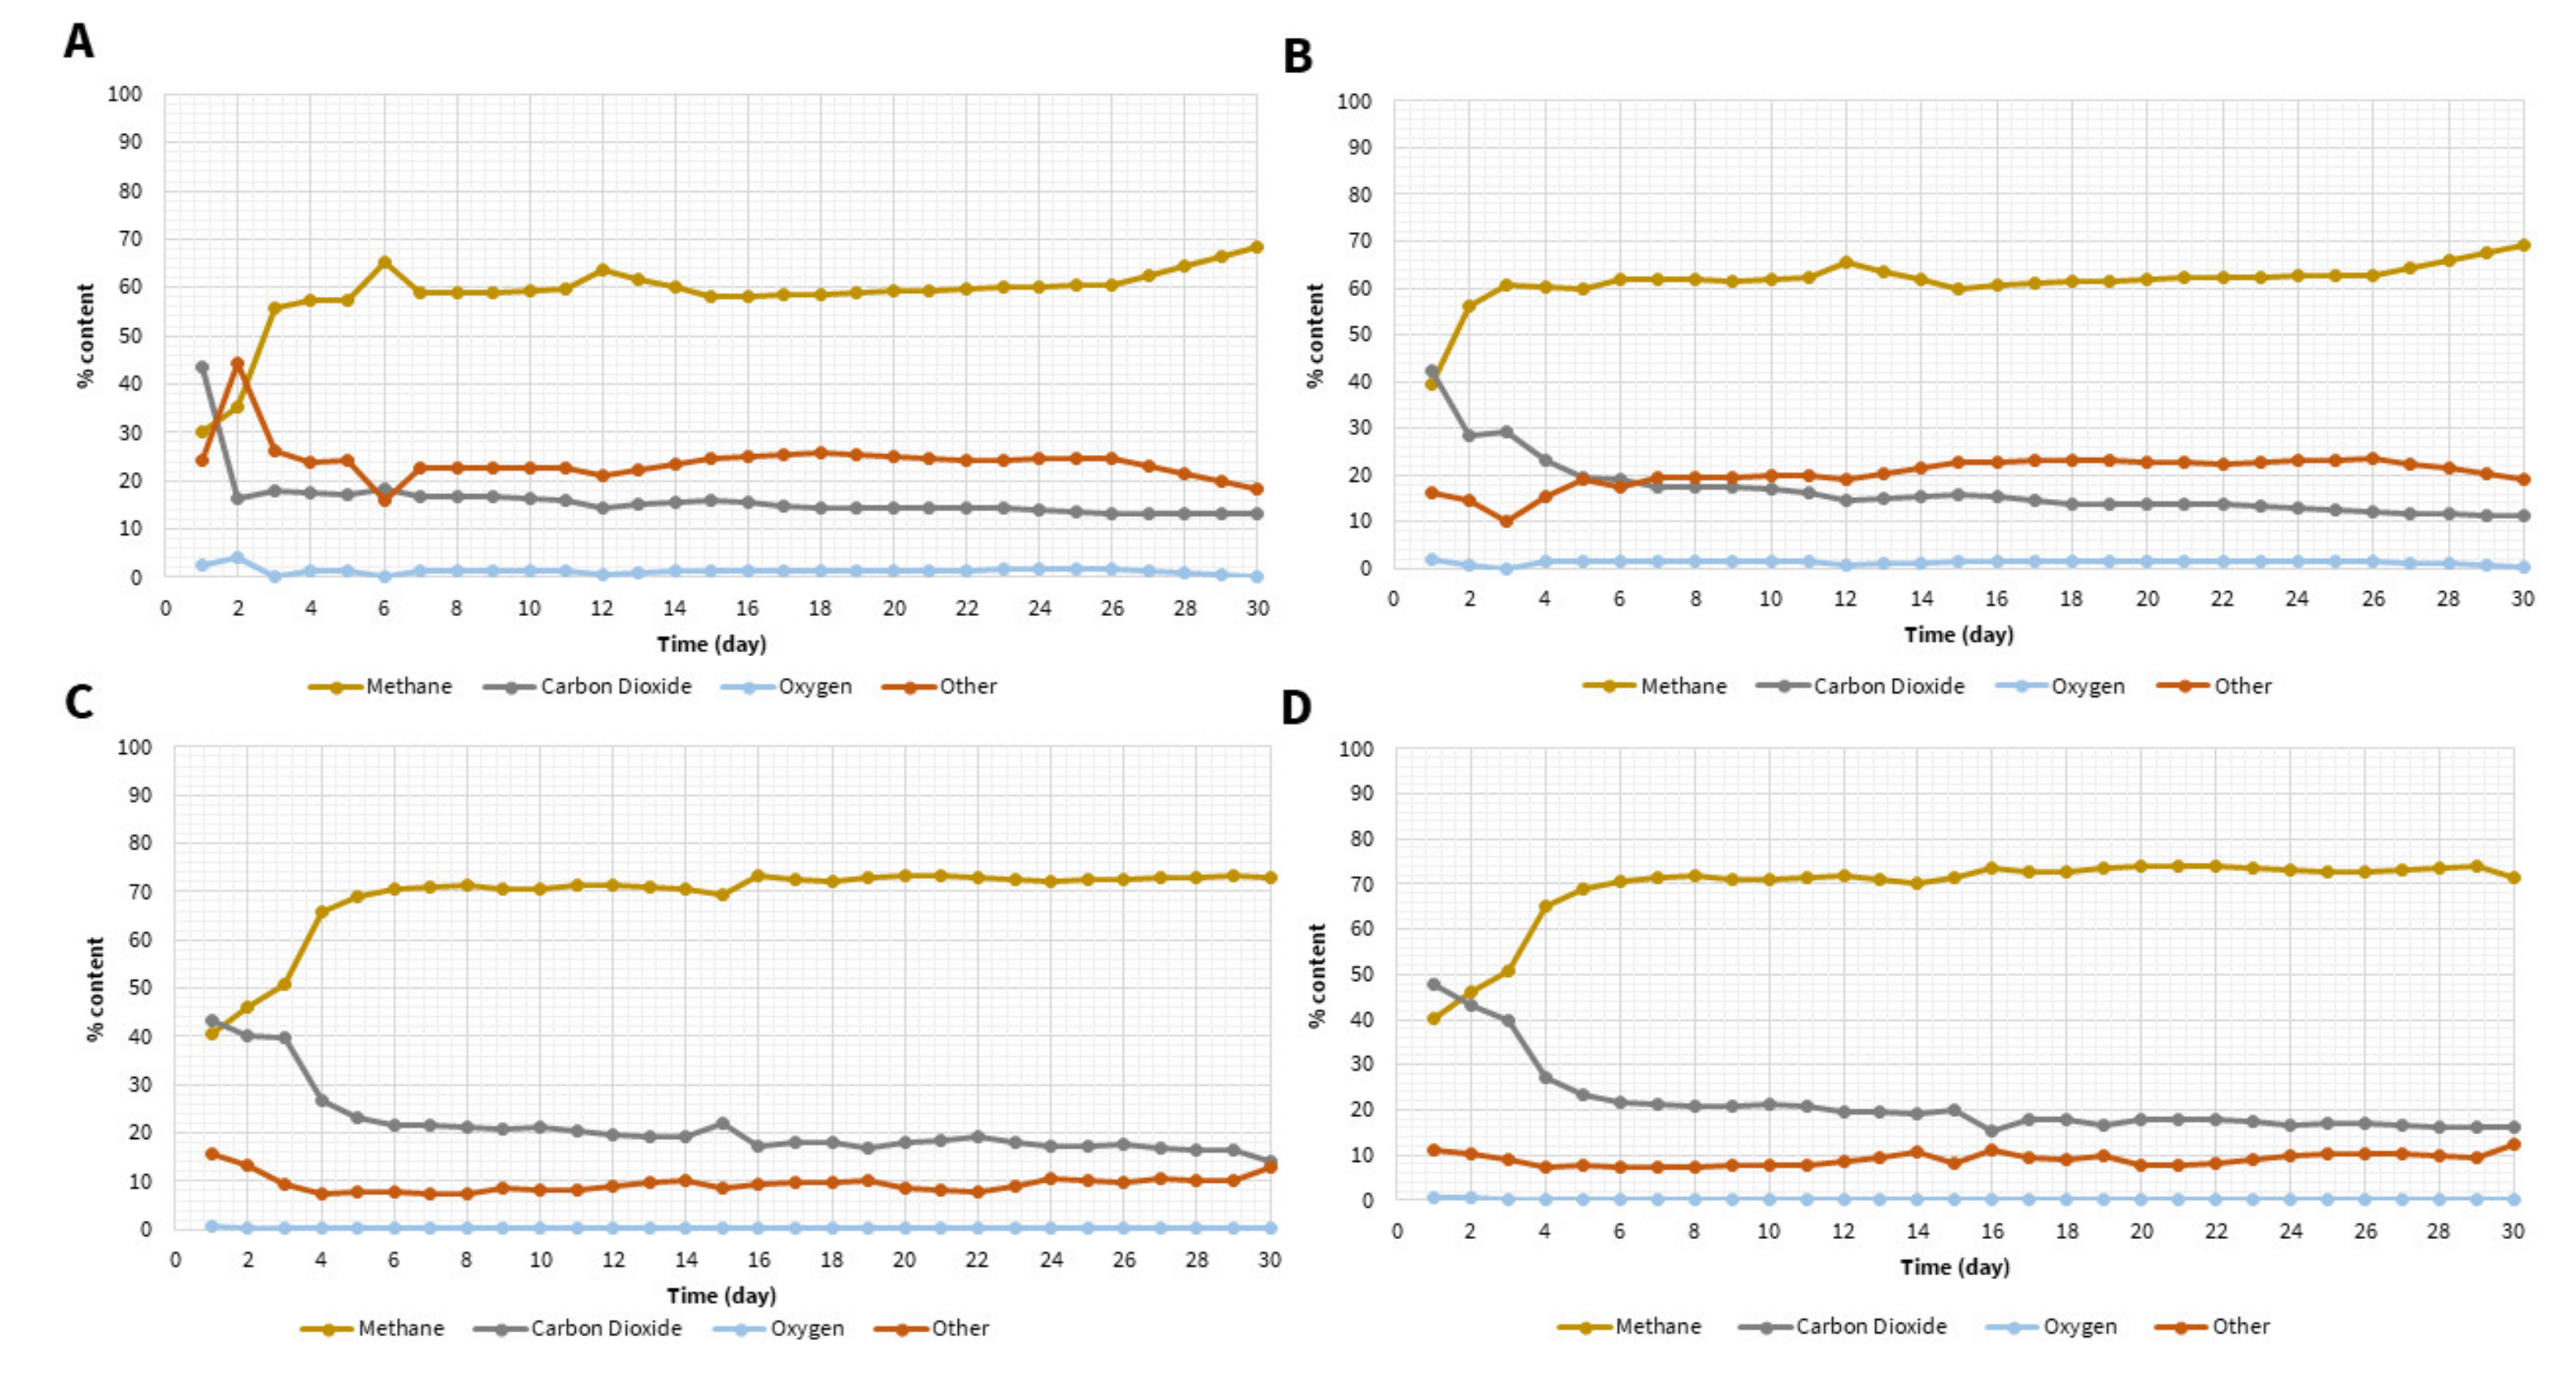
Figure 3C,D). At the same time, the high production of biogas for a much longer period of time can be observed, along with the consumption of substrates in tests I and II resulting in the maximum daily increase in biogas exceeding 1600% (in relation to test I) and 600% (in relation to test II). The results show that the high amount of organic substances in the flotate and in vegetables promotes an increase in biogas production. In tests I and II, the methane content in the biogas remained at approx. 60–64% (Figure 4A,B). The addition of flotate as well as flotate and vegetables significantly affected the composition of biogas. The share of methane increased to approx. 70–73% (Figure 4C,D). The enhanced amount of methane in biogas for these tests may be due to the fact that the feedstock was rich in organic compounds, mainly in the form of fats present in the flotate. Studies presented in the literature show that the content of methane in biogas during the co-fermentation of sewage sludge and fat waste is in the range of 58–69% [23,24,25]. In the presented studies, the share of methane for co-fermentation with the addition of flotate exceeded these values, which may be due to the differences in the composition of the feedstock used. With regard to the daily production of methane (except for the control test), an initial period of growth can be observed, ranging from 1 (test II) to 5 days (tests III and IV) (Figure 3B). The reason for this increase for tests III and IV may be the gradual use of fatty substances contained in the flotate, which are characterized by a high methane potential, much higher compared to other substrates (e.g., proteins or carbohydrates) [25].
Based on the results of the produced biogas quantity and quality measurements, curves of biogas and methane accumulation were drawn up for the test duration from 0 to 30 days (Figure 3C,D). The efficiency of biogas production in co-fermentation was the highest after 7–8 days. In this time, approximately 80% of the total biogas production was produced during the tests. At the same time, for tests II–IV, after 15 days, over 95% of the total production was measured. The process was therefore most efficient for half of the test duration and the subsequent production was very low due to the exhaustion of the substrates. Similar research results in terms of the rate of biogas production in co-fermentation were obtained by Sosnowski et al. [19]. In tests with sewage sludge, the biogas production process was faster (15 days), and the tests with the addition of food waste took longer, but more biogas was produced (by approx. 25%). In the presented research, the increase in biogas production in the co-fermentation process with the participation of flotate as well as flotate and vegetables in relation to the primary sludge alone was significantly higher, by 162 and 180%, respectively.
The obtained unit values of biogas and methane production for individual tests are presented in Table 3. The value obtained for the feedstock including inoculum and primary sludge (in the proportion 80:20% by volume) was 306.1 dm3/kg VSadded. It is a value similar to those presented in the literature: 300 dm3/kg VSadded [25]; 271 dm3/kg VSadded [24]; 304 dm3/kg VSadded [26], and 294 dm3/kg VSadded [27]. Co-fermentation of flotate with sewage sludge (test III) increased the unit biogas production by over 70% (from 306.11 to 530.93 dm3/kg VSadded). On the other hand, the addition of vegetables (share of 33.3% of wet mass and approx. 13% as TS and VS in relation to flotate) slightly improved the production of biogas (by approx. 2%).
The methodology of carrying out the research in individual tests made it possible to calculate the biogas production rate (BPR) and MPR for individual components of the feedstock in the co-fermentation process (Table 3). The calculations were based on the mass balance, taking into account the fact that, in subsequent tests, the share of the earlier components was the same:
BPRi (MPRi) = (VB(M),iVB, i-1)/VSadded,i (L/g)
where: i—test number (co-substrate), for i = 2, 3 and 4 (i = 1 is the fermentation of the inoculum alone); VB,i—total volume of biogas produced during test no. i, (dm3); VSadded,i—VS of a given (for a given i) co-substrate introduced into the reactor (kg VSadded).
On the basis of the performed analysis, it was found that the best feedstock, due to the unit size of biogas production, is the flotate. In total, 0.97 m3 of biogas was produced from each kilogram of TS the flotate. Luostarinen S. et al. [23] showed that the methane potential for the flotate is 0.918 m3 CH4/kg VSadded, while Svärd, Å. et al. [28] obtained values in the order of 0.845–0.928 m3 CH4/kg VSadded. The values obtained for the III test are slightly higher and may result from the types of fats used. For primary sludge, this value is slightly lower (0.88 m3 CH4/kg VSadded), while the lowest values were obtained for the vegetable mixture (0.811 m3 CH4/kg VSadded). Moreover, in terms of methane production potential (MPR), the best substance turned out to be flotate (0.62 m3 CH4/kg VSadded), while significantly lower values were obtained for sewage sludge (0.46 m3 CH4/kg VSadded). Barber W.P.F and Lancaster R. [29] showed that the methane potential for vegetables and fruit is between 0.41 and 0.52 m3 CH4/kg VSadded. Davidsson et al. [24], in turn, showed in their research a vegetable potential at the level of 0.399 m3 CH4/kg VSadded. The obtained values for the IV test are in the upper level of this range.
In test III, for the feedstock that consisted of inoculum, primary sludge, and flotate (with a proportion of 3:1:2 VSadded.), the methane production volume was 0.32 m3 CH4/kg VSadded. Davidsson et al. [24] obtained a slightly higher methane yield for the sludge to flotate ratio of 90:10, i.e., 0.36 m3 CH4/kg VSadded, and for the 95:5 ratio, the value of 0.295 m3 CH4/kg VSadded. The results of other studies for the co-fermentation of sewage sludge and flotate ranged from 0.456 to 0.546 (Table 4). The differences in the production of methane may result from, among others, the origin of fats and sewage sludge (and their type). From the review of the publications on the monofermentation of sewage sludge, the amount of produced methane is 0.138–0.32 (Table 4); therefore, the fish production flotate used in the research significantly increased the methane yield in relation to the literature values. The addition of vegetables also had a positive effect on methane production; the result was 0.329 m3 CH4/kg VSadded. This value is close to the value given, among others, by Koch K. et al. [18], who obtained results in the range of 0.33 to 0.36 m3 CH4/kg VSadded for the study of sewage sludge with food waste. Meanwhile, Grosser A. et al. [25] obtained higher MPR values exceeding 0.547 m3/kg VSadded. It is possible that the low share of vegetable waste (8.1% VS) in relation to the flotate (61.5% VS) in the feedstock contributed to the lower result of methane production in the presented research.
An important parameter indicating the metabolite activity of microorganisms conducting the methane fermentation process is the amount of VS removed. In the case of the conducted process with the feedstock in the form of sewage sludge, the literature provides information on the amount of VS removed, ranging from 30 to even 52% [23,24,25,27]. In the case of the control test, around 19% of the VS was removed during the 30-day fermentation. When sewage sludge was added, the result was around 27%. At the same time, based on the mass balance, it was possible to determine the VS removal efficiency with respect to individual feedstock components. A value of 53% was obtained for the primary sludge. This indicates a high content of organic matter susceptible to anaerobic decomposition. In the case of studies on the co-fermentation of primary sludge with flotate, the amount of removed VS is approx. 45.6%, and, after adding vegetable waste, the value was maintained at the same level (45.4%) (Figure 5). Similar results were obtained by Davidsson et al. [24], Noutsopoulos et al. [27], Luostarinen et al. [23], and Grosser A. et al. [25] during the co-fermentation of the fatty substance with sewage sludge, where the removal of VS at the levels of 58, 59, 46, and 52%, respectively, was achieved. In addition, Grosser A. et al. [25] carried out a study by adding food waste to the feedstock and the removal of VS was at the level of 65%. In the presented research, the effectiveness of the inoculum and other co-substrates was taken into account when calculating the percentage of VS removal from the analyzed co-substrate. For this purpose, the equation used by Bai et al. [32] was adopted. Based on the mass balance calculations, it was shown that the degree of mineralization of VS was 78 and 65% for the flotate and vegetable mixture, respectively.

3.2. Conditions for the Fermentation Process

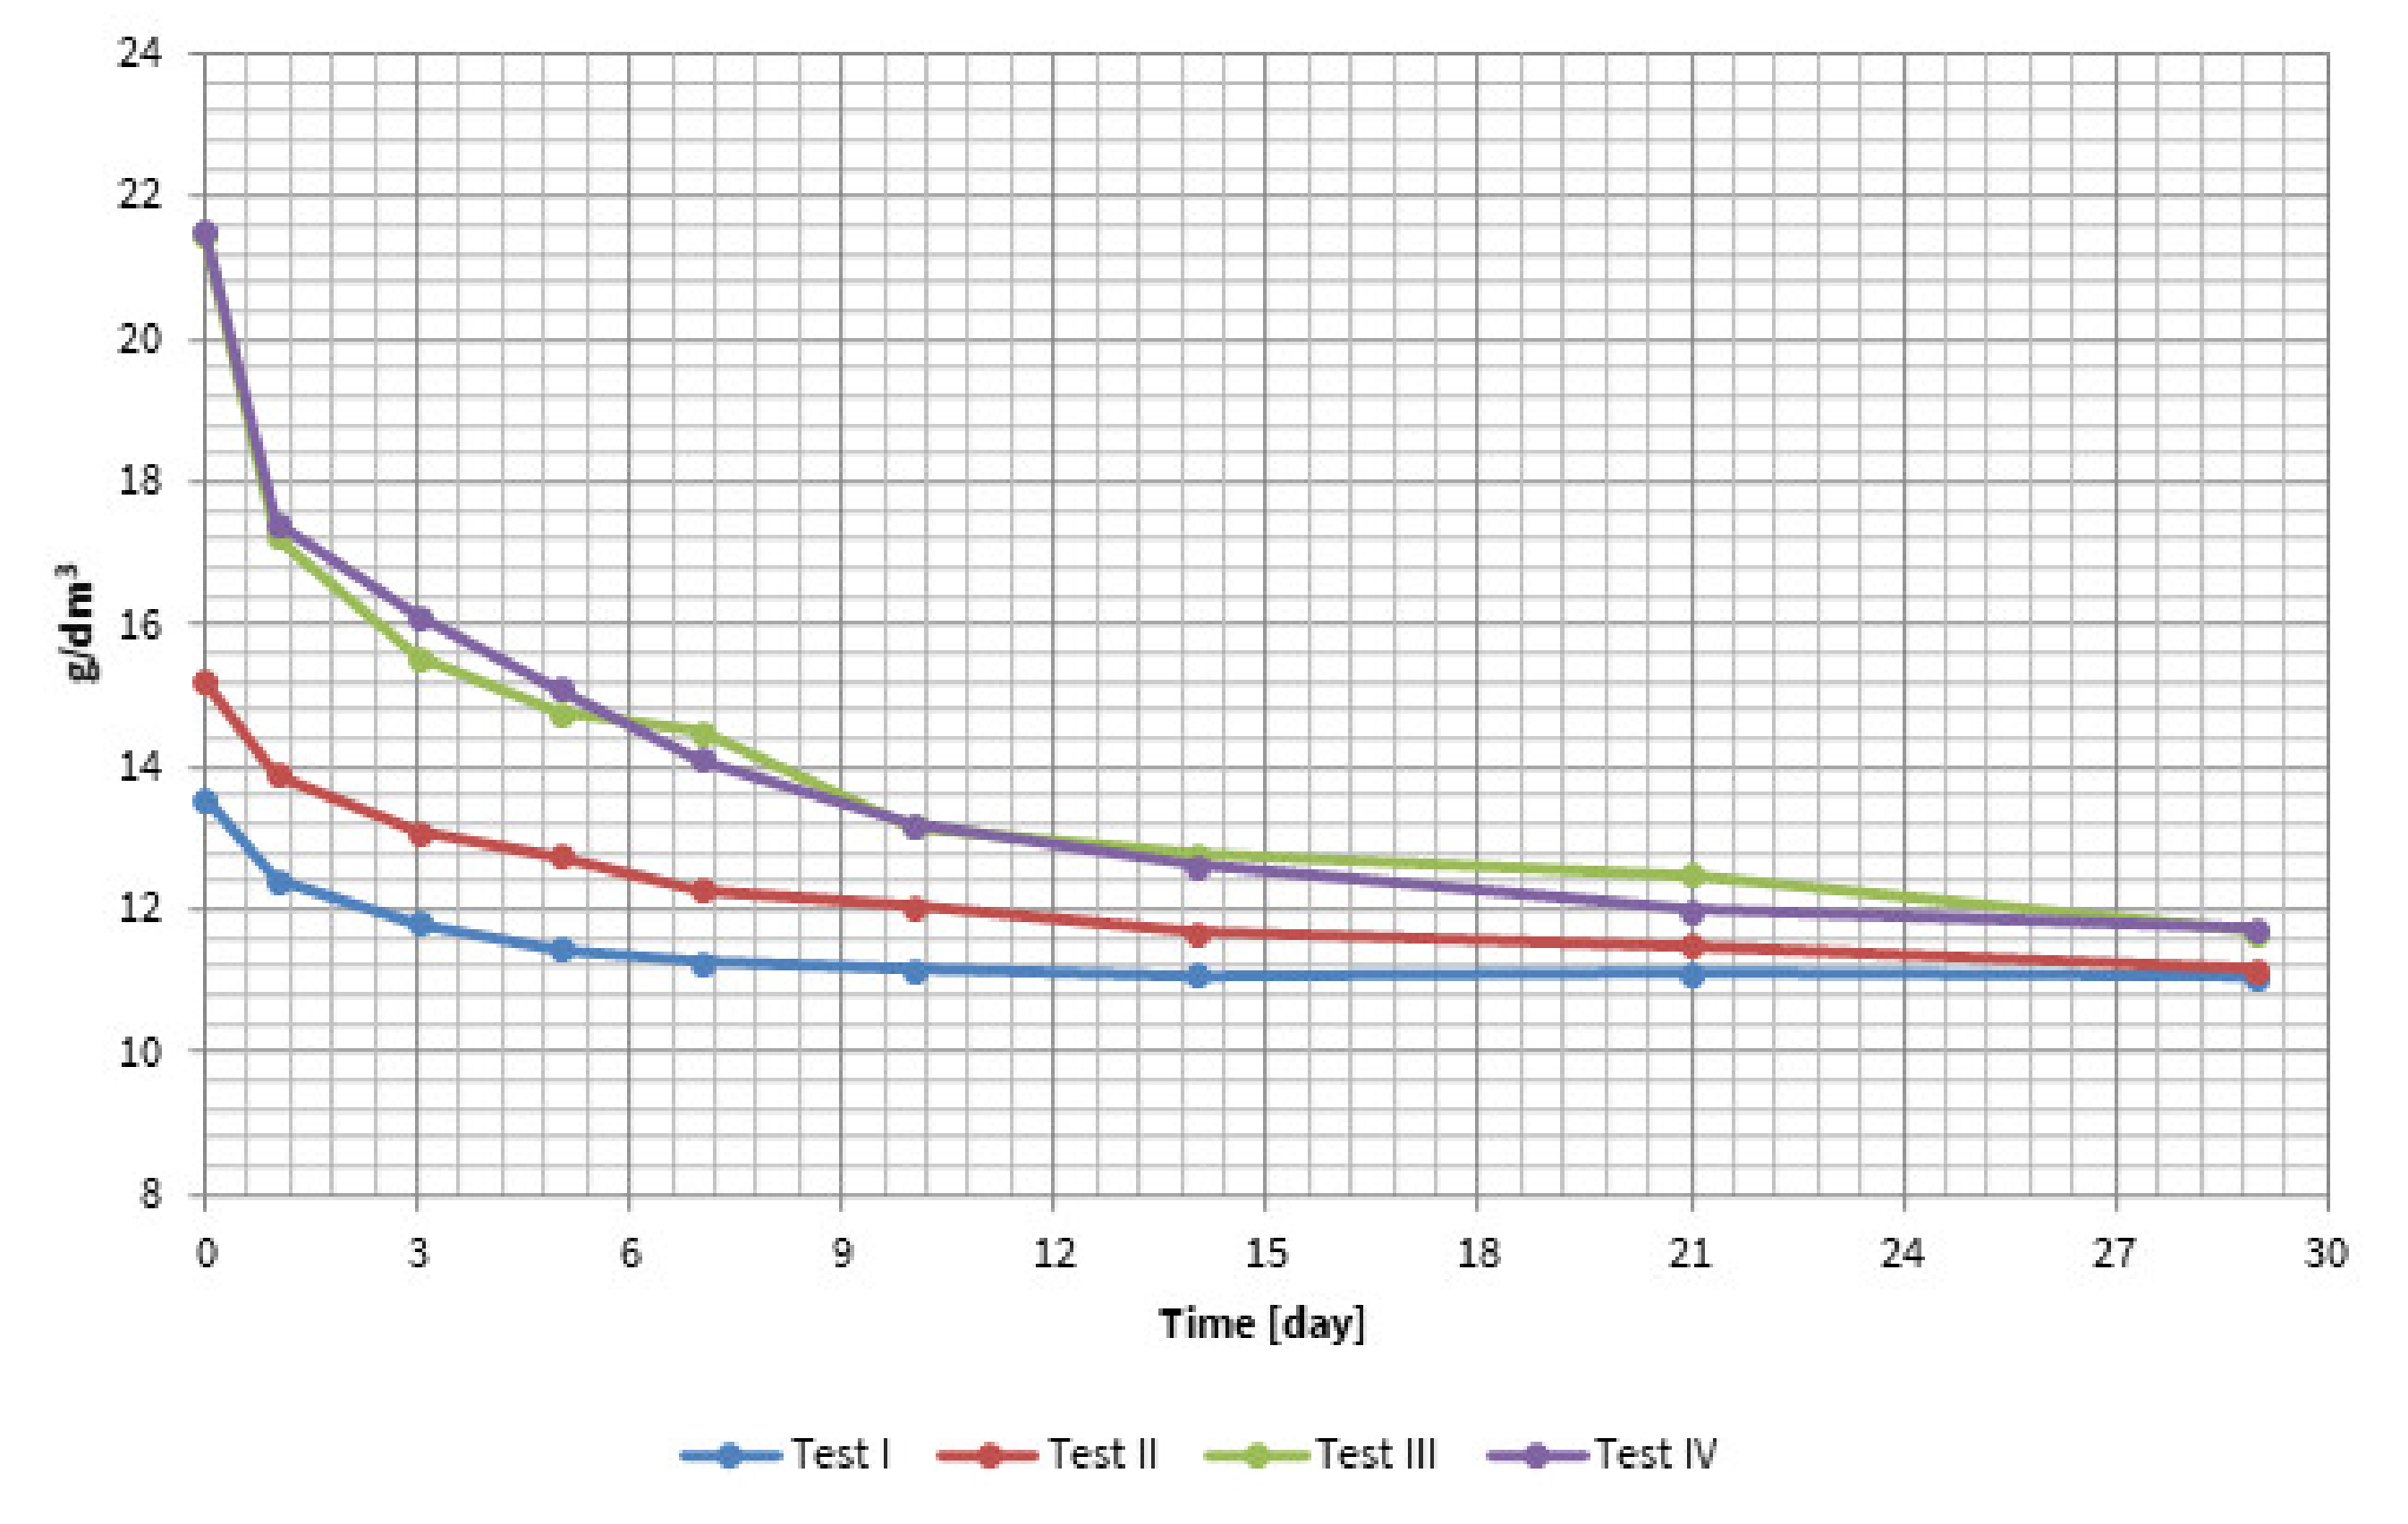
The parameter used to indicate the stability of the methane fermentation process is the concentration of VFAs [33]. An excessive concentration of VFAs acidifies the process and causes the pH to decrease to a level that may slow or even inhibit the process [30,34]. Initially, in each of the co-fermentation tests, an increase in the value of the production of VFAs was observed (Figure 6A). After this period, their rapid concentration decrease is noted. Such a trend line is related to the intensive production of VFAs from the substrate in the acitogenesis phase, and its use for the production of methane in methanogenesis, which is confirmed by the methane production diagram (Figure 4B,D). On the basis of the comparison of these two graphs, it can be found that in the initial period (especially for tests III and IV), the production of VFAs prevails over their weight. The stabilization of the values occurs in the range optimal for the fermentation process. The curve is flattened, and the production of VFAs is compensated for by consuming them. Interestingly, in tests in which a significant amount of fatty substances was present in the feedstock (in the form of flotate) in the first phase of fermentation, the increase in VFAs was much higher than in the test for sewage sludge alone. This confirms the hypothesis that the flotate is a source for the rapid production of VFAs and therefore for a significant increase in methane production.
The optimal pH range for the fermentation process should be within 5 to 8. A pH below 5 may interfere with the activity of methane-forming bacteria and stop methane production [35]. The pH was within the recommended range during all tests (Figure 6C). However, during the first days of the process, pH values were lower (especially for tests III and IV). This could have been caused by the high production of VFAs during this period. A similar phenomenon was observed by Azarmanesh R. et al. [30] in their research.
In the analyzed studies, the alkalinity values did not fall within the optimal range presented in the literature for a typical properly functioning fermentation chamber, i.e., 40–80 mval/L [36,37]. It should be noted that due to the much higher than optimal alkalinity values, with a simultaneous high accumulation of VFAs, such high alkalinity made it possible to compensate for the adverse effect on the pH value. Therefore, it should be recognized that despite high alkalinity values, there is no negative impact on the course of the process, and despite the buffer that this alkalinity creates, it has a beneficial effect. This is evidenced by the ratio of volatile fatty acids to alkalinity [30]. According to the literature data, the optimal range of the VFAs: alkalinity ratio is 0.1–0.35 [38], and in some publications, it is recommended that this value should be less than 0.4. [39,40]. Figure 6D shows the VFAs: alkalinity. Values in all four tests were within the recommended literature values. In the first 3–5 days of tests III and IV, these values are close to the limits; however, the alkalinity level ensures adequate buffering of the produced VFAs. As a result, no inhibition of the methane fermentation process was found in these two tests. In the initial period of these two tests, a pH decrease may also be observed. However, due to its buffering properties, it did not fall below the optimal values for biogas production. The commonly reported optimal range is 6.5–7.5 [41]. This parameter showed an upward trend, especially for tests III and IV. At the end of tests II, III, and IV, with the depletion of the substrate and a significant increase in ammonium nitrogen concentration, the reaction becomes or even exceeds the optimal range.

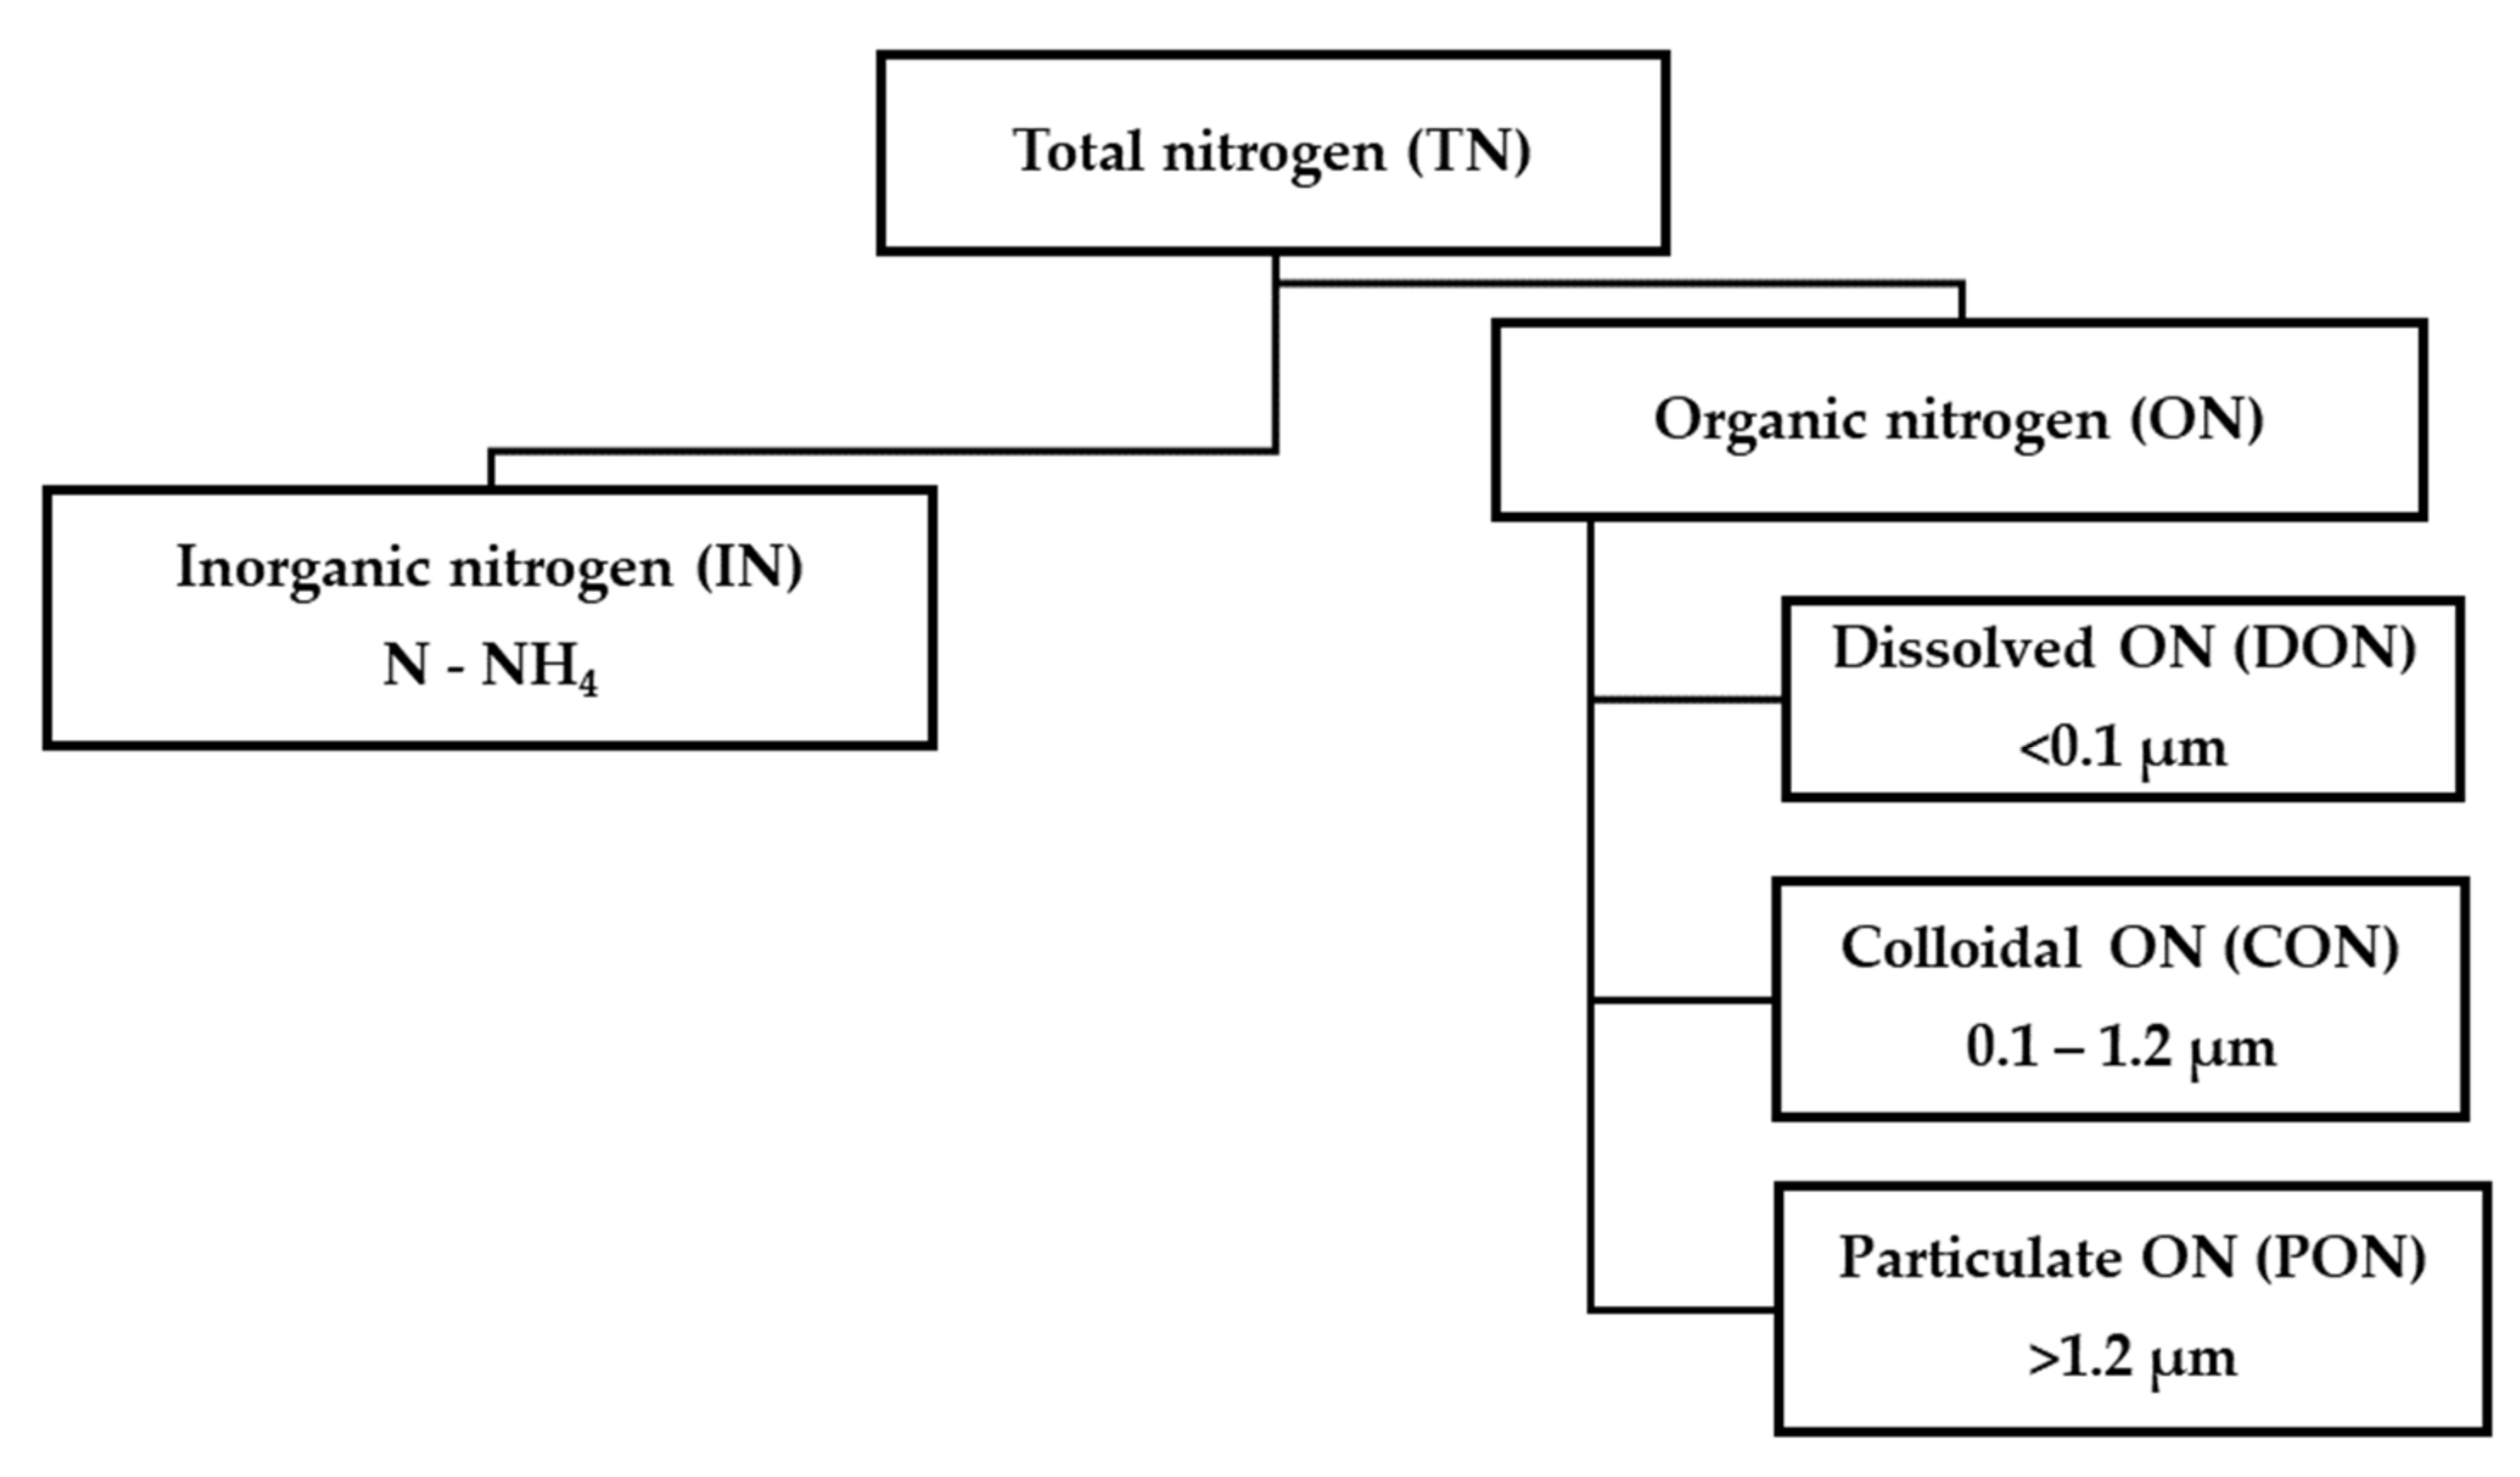
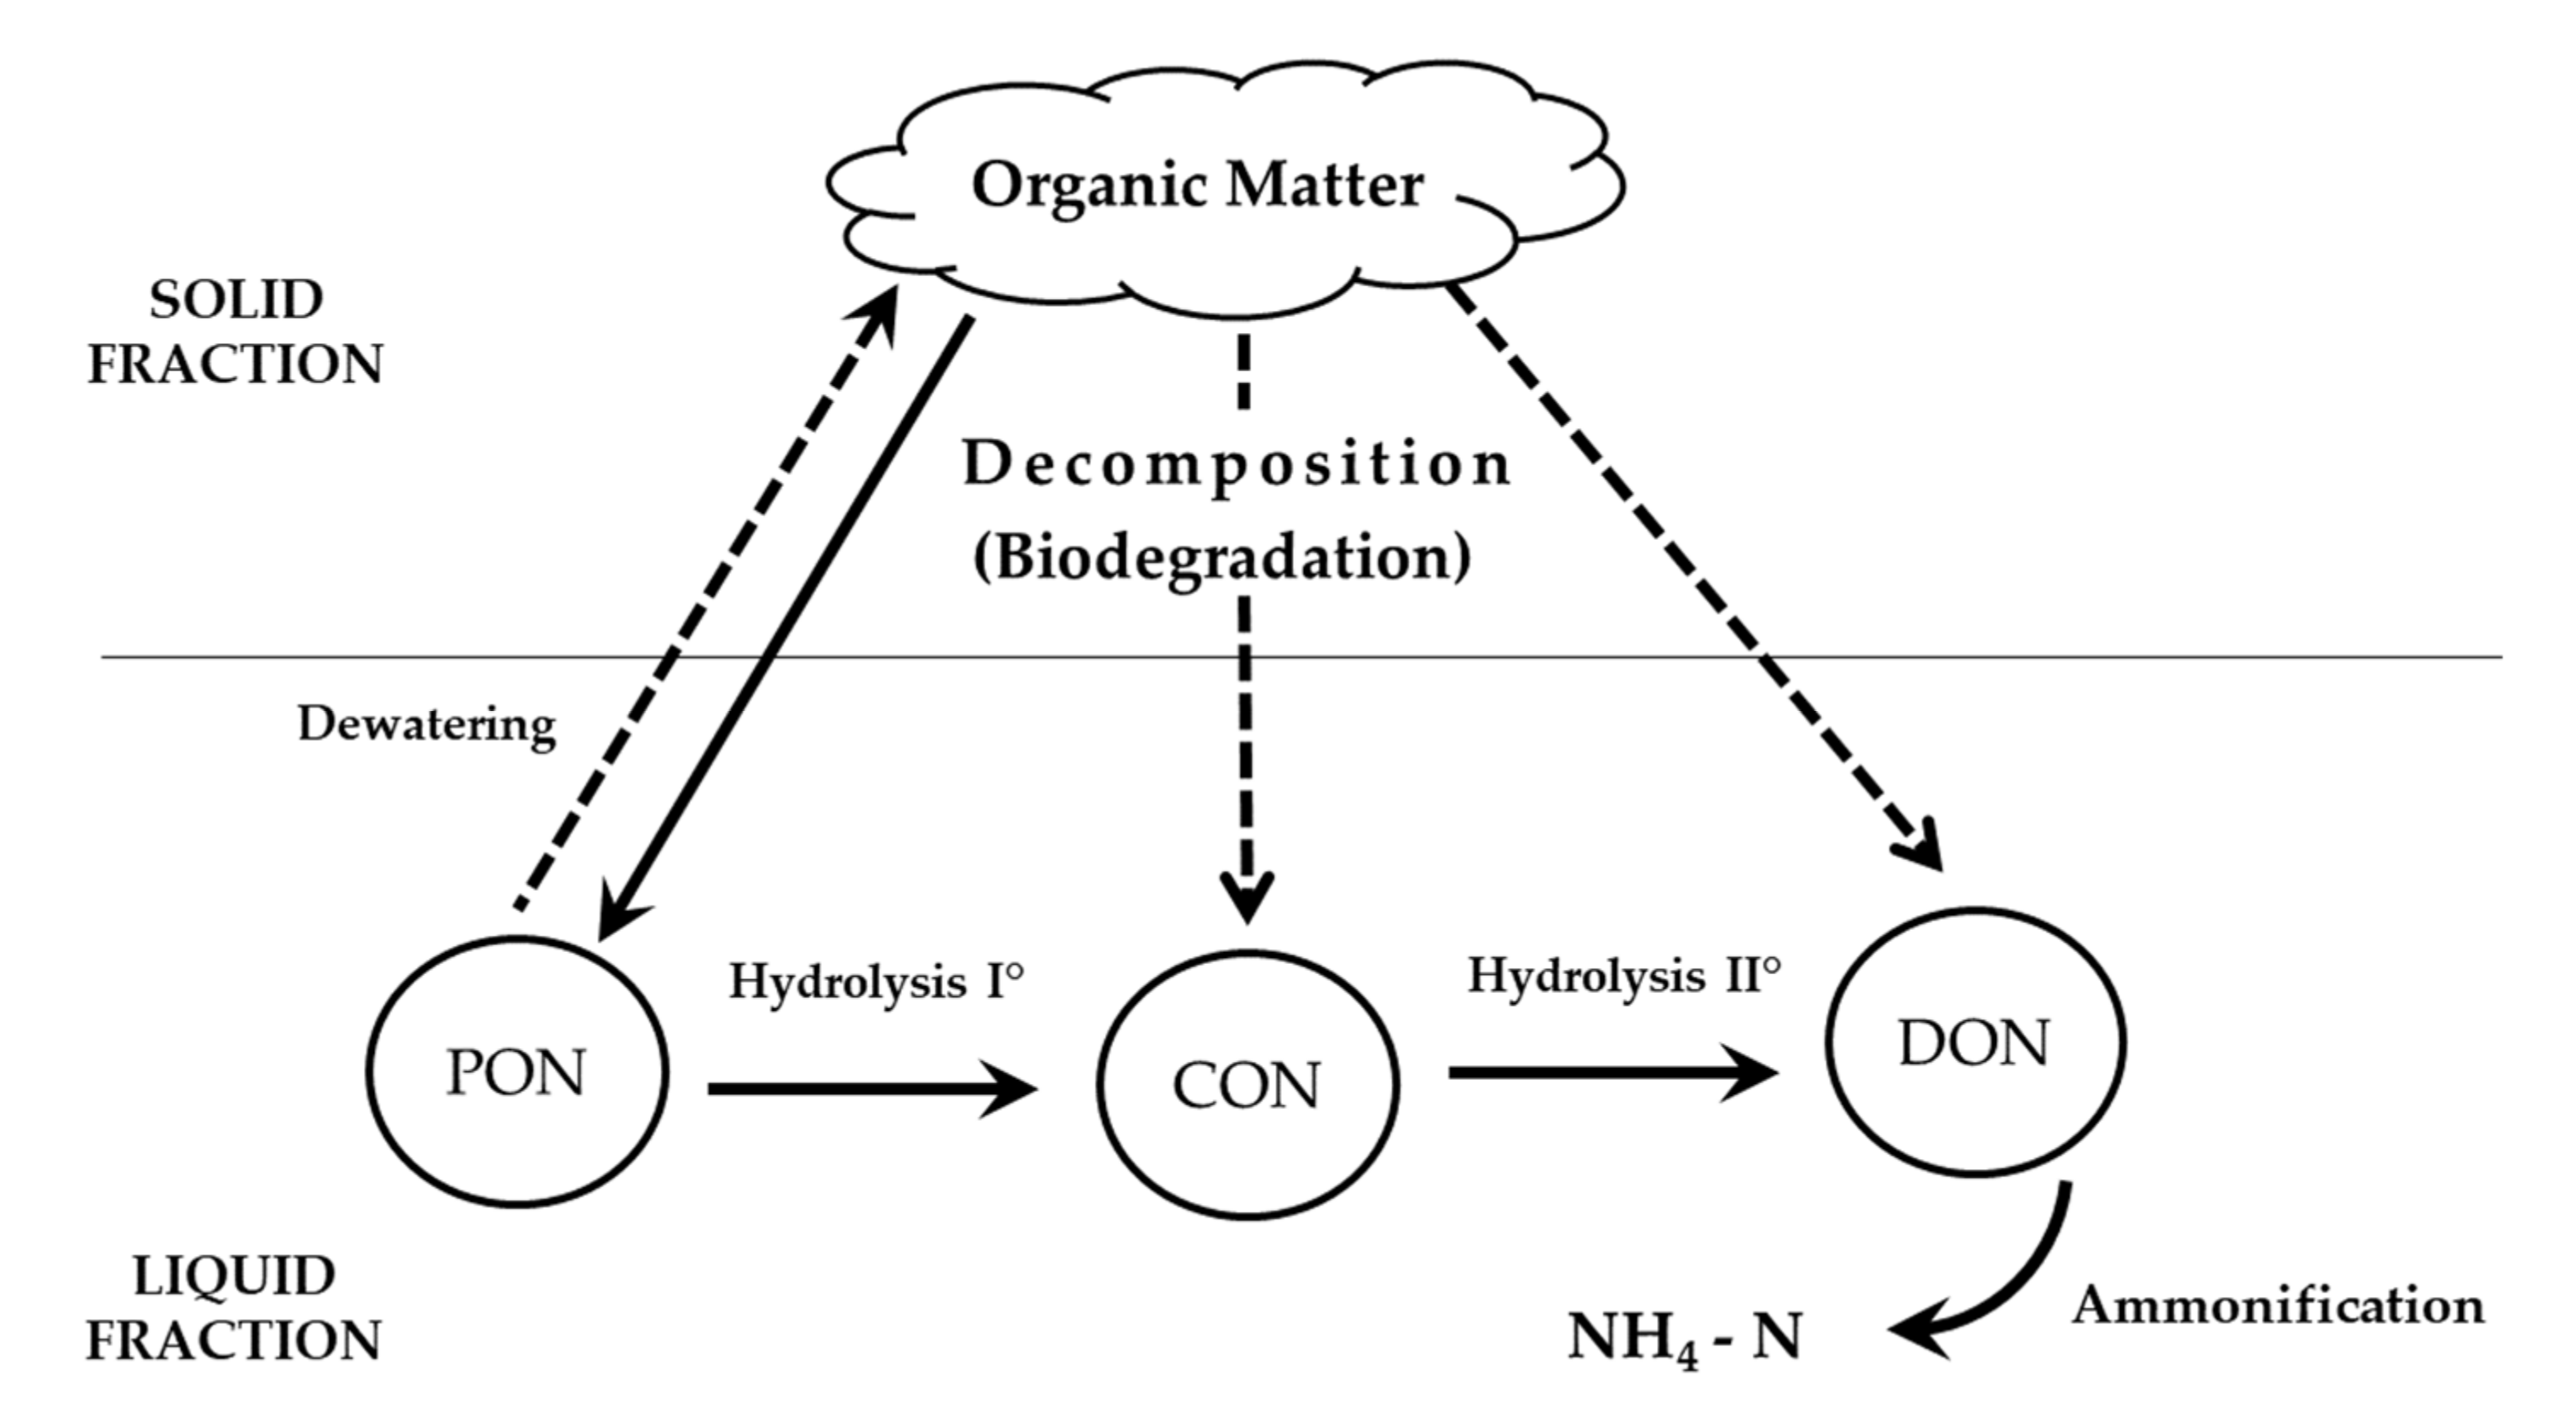
3.3. Nitrogen Transformations

Nitrogen in the substrate subjected to methane fermentation in the fermentation chambers is present in the form of organic matter with various dispersions (mainly in the form of large suspensions and solid particles), and as ammonia nitrogen (ammonium ion or free (unionized) ammonia dissolved in the liquid according to the equilibrium state dependent on pH). As a result of the processes taking place during the fermentation, organic matter is biodegraded into particles of lower mass and ultimately is converted mainly into methane and carbon dioxide. In the range of the hydrolysis process, nitrogen-containing organic compounds (proteins and urea) are also decomposed. As a result, the organic nitrogen contained in the feedstock material goes to the liquid fraction, where, depending on the size, it can be classified as PON, CON, and DON. Eventually, in the ammonification process, it is decomposed with the release of ammonium ion. A diagram of nitrogen transformation during fermentation is shown in Figure 7.
In the publications on co-fermentation, most often, there is no information about nitrogen transformations, or they are limited only to indicating the concentrations of ammonia nitrogen. The course of changes in the concentration of ammonia nitrogen during the analyzed tests is shown in Figure 8. The increase in the concentration of this form of nitrogen in test I is related to the final hydrolysis of organic compounds contained in the inoculum. In the Swarzewo WWTP, it is mainly a mixture of primary sludge and waste-activated sludge produced in this WWTP and waste sludge from other biological WWTPs operated by this facility. The initial value (862 mgNH4-N/dm3) is the highest compared to other tests, which is related to the significant level of feedstock ammonification. At the same time, it is a value more than four times higher than the value for inoculum from the fermentation chambers of the Penn State University WWTP [32]. The co-substrates introduced into the reactors are characterized by a lower concentration of ammonia nitrogen, which results in lowering its initial concentration in the remaining tests. At the same time, the organic matter of these co-substrates is subjected to hydrolysis during the tests, which increases the concentration of ammonia nitrogen. The final concentrations of ammonia nitrogen in test II, with the addition of primary sludge (1037 mgNH4-N/dm3), are higher than the values presented for the reject water from the digestate dewatering in two large WWTPs in Northern Poland, i.e., 647.0 and 888.8 37 mgNH4-N/dm3 for Gdynia and Gdansk WWTP, respectively [19]. Lower concentrations (approx. 500 mgNH4-N/dm3) were observed during laboratory studies on the fermentation of sewage sludge [42]. Similar concentrations of ammonia nitrogen (1045 and 1184 mgNH4-N/dm3) were observed in the reject water from sewage sludge dewatering (a mixture of waste-activated sludge and primary sludge) subjected to methane fermentation [43]. However, much lower concentrations (approx. 400 mgNH4-N/dm3) were obtained during the co-fermentation of sewage sludge and acid cheese whey [44].
Regarding tests III and IV, an initial period of 5–7 days can be observed during which the ammonium nitrogen concentration remains relatively stable. After this period, the shape of the ammonia nitrogen concentration change curve is similar to the test with the addition of primary sludge; however, the final ammonia nitrogen concentration stabilizes after 21 days of the test at a much higher level (approx. 1250–1300 mgNH4-N/dm3). This initial low increase in the ammonia nitrogen concentration may be related to the high availability of VFAs generated from the flotate, as shown by the course of changes in the VFA concentration presented in Figure 6D. The very high concentrations of VFAs observed during the first three days could also affect the rate of hydrolysis of other organic compounds, including proteins. Only after the consumption of the easily hydrolysable fraction of fatty substances load contained in the flotate, the process of remaining organic matter decomposition contributed to an increase in the ammonia nitrogen concentration. The much higher final concentration of ammonia nitrogen in tests III and IV (an increase of 80–100% compared to test II) indicates that the flotate contained not only fatty substances but also other contaminants present in the fish production wastewater, including proteins. In a study on the co-fermentation of sewage sludge and food waste, Azarmanesh et al. [30] obtained much higher final total ammonia nitrogen concentrations (ranging from 1900 to 3500 mgN/dm3). At the same time, the authors indicated that an increase in the concentration of ammonia nitrogen also increases the alkalinity, which has a positive effect on buffering organic acids produced in the fermentation process.
Table 5 summarizes the ANRR values for individual tests. At the same time, based on the mass balance, calculations of the productivity of co-substrates were performed in relation to this form of nitrogen.
Figure 9 shows the course of changes in the individual forms of organic nitrogen concentration in the liquid fraction of the digestate.
The analysis of the organic nitrogen fraction concentration changes in the liquid fraction of the digestate shows that during the first 3–7 days, their increase can be observed in all the tests performed. However, there are significant differences between the values in tests I and II as well as tests III and IV. In relation to the inoculum, the maximum increases were for DON 116 and 190% (after 3 days), for CON 352 and 291% (after 5 days), and for PON 219 and 257% (after 3 days), respectively, for tests III and IV. Such a significant initial increase in ON fractions proves the high efficiency of the organic matter hydrolysis processes in the feedstock. This mainly concerns the flotate, which was liquefied before being introduced into the reactor by an inoculum heated to a temperature of 36 °C. Such preparation of the feedstock ensures good contact between organic matter and microorganisms, which enables the effective course of the hydrolysis process. At the same time, the inhibition of the ammonification process (demonstrated on the basis of ammonia nitrogen concentration changes in tests with the flotate) caused the concentration of organic nitrogen in the liquid fraction of the digestate. With the efficiency of ammonification increase, the concentrations of organic nitrogen fraction decrease and remain at a stable level from day 20 to 25.
Final organic nitrogen fraction concentrations for test I were 44.0, 75.0, and 49.3 mgN/dm3, for DON, CON, and PON, respectively. The addition of primary sludge (in the proportion of 80:20% by volume) contributed only to a slight increase in the final concentrations of ON fractions by 8, 17, and 12 mgN/L, for DON, CON, and PON, respectively. Moreover, for the reject water from the digested sludge dewatering in two large WWTPs in Northern Poland, significantly higher CON values were observed in relation to DON, but their concentrations were almost two times lower than the values obtained in test II (24.0–29.5 mg DON/dm3 and 33.7–38.5 mg CON/dm3, respectively) [19].
Moreover, a study presented by Abel-Denee et al. [45] indicated lower DON concentrations (28.8 mgN/dm3 on average) in reject water from the fermentation of mixed sewage sludge. On the other hand, Galvagno et al. [43] showed a much higher concentration of DON (204 mg N/L on average) in the reject water from the dewatering of methane fermented mixture of primary sludge and waste-activated sludge compared to the values obtained in test II.
The addition of flotate and flotate with vegetables resulted in slightly higher final concentrations of CON (by 23 and 26 mgN/dm3) and PON (approx. 14 mgN/dm3). On the other hand, a significantly higher increase in concentration was observed for DON: 96.5 mgN/dm3 and 106.8 mgN/dm3, respectively, for tests III and IV. In relation to the final value determined in the test with primary sludge, this represents an increase by 170 and 190% (for tests III and IV, respectively). Even higher values (on average 331.0 mgCON/dm3 and 200.6 mgDON/dm3) were obtained by Tuszyńska et al. [17] during fruit and vegetable waste fermentation. Research on the DON properties contained in treated wastewater has shown that approx. 25–35% of DON is still biodegradable, and approx. 20% is bioavailable for Selenastrum capricornutum algae [46]. Therefore, with such high concentrations of DON, it is necessary to perform tests on the biodegradation of organic nitrogen contained in reject water from digestate dewatering in activated sludge chambers of municipal WWTPs.
As a result of the processes taking place during the methane fermentation with the use of the feedstock in the form of primary sludge and flotate, there was a significant increase in total nitrogen concentration in the reject water from digestate dewatering. In relation to the feedstock in the form of primary sludge, it was over 26% (increased by 327.8 mgN/dm3). The addition of the vegetable mixture contributed to a further increase in total nitrogen concentration (in total up to 360.8 mgN/dm3 compared to test II, i.e., by almost 30%). Table 6 summarizes the total nitrogen release rate (TNRR) values calculated on the basis of mass balances for individual co-substrates. Such a significant increase in nitrogen concentration in the reject water from digestate dewatering may have a significant impact on the amount of energy consumption associated with its removal.

3.4. Energy Balance

The use of co-substrates in the methane fermentation process increases the production of biogas and often increases the share of methane in it. At the same time, during the fermentation process, nitrogen is released into the liquid fraction, which is separated from the post-ferment as reject water. This additional nitrogen load requires removal in the main WWTP line by conventional nitrification/denitrification (N/D) processes, which requires electrical energy for aeration. In biological nutrient removal WWTPs, energy consumption for aeration can be, depending on the type of installation, from 45 to 75% of the total electric energy consumption of a given treatment plant [47].
To reduce the energy consumption, the reject water treatment in a side stream along with PN/A processes can be used (defined as deammonification). This allows a reduction in the oxygen demand by around 60%, with a complete lack of organic compound demand (necessary in the conventional process of denitrification).
The energy balance analysis was performed for the three tested co-substrates, primary sludge, flotate, and vegetable mixture. For the calculation of the electric energy production volume, the unit production of methane during methane fermentation values from Table 3 were adopted. The amount of energy that can be generated from 1 m3 of methane was assumed as 10.4 kWh [48]. The efficiency of cogeneration systems (CHP) ranging from 0.3 (for older devices) to almost 0.5 (for the newest devices available on the market) was also taken into account.
The unit demand for electric energy needed to remove nitrogen in the conventional nitrification process is estimated at approx. 4.0 kWh/kgNremoved [49]. Much lower values, close to 2.4 kWh/kgNremoved, were presented in the studies of Figueroa et al. [50] and Shourjeh et al. [51]. On the other hand, the amount of energy demand for nitrogen removal in the PN/A process depends on the configuration of the reactors. With the use of SBR reactors using single-stage PN/A technology, the energy demand takes values in a wide range from 0.2 to approx. 2.0 kWh/kgN [49]. The literature also provides results of energy consumption analyses falling within the same range: 1.0 kWh/kgN [49,50] and 1.2 kWh/kgN [52]. Higher specific energy consumption was demonstrated for the two-stage PN/A technology, ranging from 1.05 to 1.86 kWh/kgN [50].
The higher of the presented values, i.e., 4.0 kWh/kgNremoved for the N/D process and 1.6 kWh/kgNremoved for the PN/A process (which corresponds to 40% of consumption for the N/D process), were adopted for the amount of the energy consumption calculation.
The calculations were made for two scenarios. In scenario I, the energy consumption was compared only to the ammonia nitrogen released in the fermentation process, in accordance with the values presented in Table 5. However, scenario II took into account the increase in total nitrogen concentration in reject water (according to the values from Table 6). With regard to the efficiency of ammonia nitrogen removal in the PN/A process, values from 0% (i.e., without reject water treatment in the side stream) to 90% were adopted. It was also assumed that the rest of the ammonia nitrogen and all of the organic nitrogen would be removed in the N/D processes.
Figure 10 shows the results of the energy balance calculations in relation to 1 kg VSadded. The highest value of the electric energy generated (Figure 10C) was obtained for flotate and, depending on the efficiency of the CHP system, ranged from 1.9 to 2.3 kWh/kgVSadded. The use of a vegetable mixture for co-fermentation made it possible to generate approx. 18% less electric energy and, with the use of primary sludge, by over 26%. The amount of energy required for the removal of ammonia nitrogen (Figure 10A) in the main line in the N/D process was 0.27, 0.14, and 0.11 kWh/kgVSadded, for primary sludge, flotate, and vegetables, respectively. The removal of 90% of the ammonia nitrogen in the PN/A process reduced the energy demand by 54%. The necessity of removing all the ammonia nitrogen and organic nitrogen present in the reject water from the digestate dewatering (Figure 10B) in the N/D process increased the energy consumption to 0.35, 0.19, and 0.18 kWh/kgVSadded, for primary sludge, flotate, and vegetables, respectively. The highest increase in energy consumption, involving the removal of organic nitrogen (by approx. 35%), was identified for the feedstock in the form of the vegetable mixture. Due to the need to remove organic nitrogen in the main line of WWTP, the decrease in energy consumption related to the removal of 90% of the ammonia nitrogen in the side-line was lower and was 42%, 39%, and 35% for primary sludge, flotate, and vegetables, respectively. For all analyzed variants, a positive result was obtained in the balance of electric energy production and its consumption for nitrogen removal (Figure 10D). The net production for scenario I ranged from 1.16 (for primary sludge) to 3.19 (for the flotate) kWh/kgVSadded, while for scenario II, it decreased to 1.08 and 3.14 kWh/kgVSadded, respectively. A positive analysis result of the energy consumption and energy production balance for co-fermentation with the dosing of swine slurry was also obtained by Figueroa et al. [50].

4. Conclusions

Analyses concerning the possibility of achieving energy self-sufficiency are the current trend in WWTPs. This effect can be achieved by increasing the production of electric energy from biogas in CHP systems, and by reducing energy consumption for technological processes. One of the directions of the research, in line with the CE concept, is the use of waste rich in organic matter as co-substrates for the methane fermentation process carried out in anaerobic chambers located at WWTPs. In such an assessment, all aspects influencing the energy balance should be taken into account, including, in particular, nitrogen release, the removal of which is one of the most energy-consuming processes carried out during wastewater treatment.
In this study, the effect of the co-fermentation of two selected wastes (flotate from the wastewater treatment plant at fish product production plants and a mixture of vegetables) on the increase in biogas production and their impact on changes in nitrogen concentration in the reject water from digestate dewatering were examined. As part of the presented research, co-fermentation tests were carried out with the use of primary sludge from a large municipal WWTP and a control test with the inoculum alone. In all tests, biogas production was most efficient up to the 15th day of the batch test. The waste used in the tests contributed to a significant increase in the production of biogas, as well as to a significant increase in the share of methane in it (approx. 70–73%). On the basis of the mass balance, the BPR and MPR values related to 1 kg VSadded of a given co-substrate were determined, and the degree of VS mineralization was determined, which was 78 and 65% for the flotate and vegetable mixture, respectively.
With the proportion of inoculum, primary sludge, and flotate equal to 3:1:2 (as a VSadded), and also after the addition of a vegetable mixture (in a proportion of 0.25), there was no inhibition of the methane fermentation process. Moreover, the hydrolysis of nitrogen-containing organic compounds contained in the feedstock to the PON, CON, and DON fractions proceeded without significant disturbances. This indicates a significant increase in the concentrations of these fractions during the first 3–5 days in relation to the fermentation of the primary sludge alone (from over 100 to almost 300%). On the other hand, an inhibition of the ammonification process was observed, which resulted in a stable level of ammonia nitrogen concentrations during the first 5–7 days of the process. The ANRR and TNRR values were determined in relation to 1 kg VSadded, which is a novelty of the presented research. The addition of flotate as well as the mixture of vegetables had no significant effect on the final concentrations of PON and CON fractions. On the other hand, the DON fraction increased by 170–190% in relation to the test with the addition of primary sludge. This may be considered as an adverse effect and it may have a negative impact on the biological part of the WWTP due to the additional load of organic nitrogen.
In order to assess the impact of the application of the analyzed co-substrates on the energy effect achieved by the entire WWTP, energy balance calculations were performed. Variable amounts of electric energy production depending on the efficiency of CHP systems (in the range from 30 to 50%) were included. The energy consumption for supplying the oxygen necessary to remove the nitrogen contained in the reject water from digestate dewatering was also taken into account. In this part of the calculations, two scenarios were considered: the first one related to ammonia nitrogen only, and the second one considered the sum of ammonia nitrogen and organic nitrogen. In addition, the option of nitrogen removal only in the conventional N/D process was analyzed, as well as the use of the PN/A process in the side-line with variable ammonia nitrogen removal efficiency (up to a maximum of 90%). For all the calculation variants performed, a positive energy balance was obtained, referring to 1 kg VSadded. The minimum energy profit for the flotate was approx. 60% higher in relation to the primary sludge, while for the vegetable mixture, it was approx. 30%.
The performed tests confirmed the advisability of using the flotate from the WWTP from fish factories and a vegetable mixture as a co-substrate in the fermentation process carried out in municipal biogas plants located at WWTPs.

Author Contributions

Conceptualization, A.W.-L. and K.C.; methodology, K.C.; visualization, A.W.-L.; formal analysis and data curation, K.C.; investigation, A.W.-L. and M.O.; writing—original draft preparation, A.W.-L., M.O., K.C.; writing—review and editing, A.W.-L. and K.C.; project administration and funding acquisition, K.C. All authors have read and agreed to the published version of the manuscript.

Funding

This study was financially supported by the European Regional Development Fund within the framework of the Smart Growth Operational Programme 2014–2020 under project no. POIR.04.01.02-00-0022/17.

Institutional Review Board Statement

Not applicable.

Informed Consent Statement

Not applicable.

Acknowledgments

The authors would like to thank the staff of the “Swarzewo” Water and Wastewater Company for their kind cooperation in measuring and sharing routine operational data.

Conflicts of Interest

The authors declare no conflict of interest.

Abbreviations

ANRRammonium nitrogen release rate
ADanaerobic digestion
AMPTSAutomatic Methane Potential Test System
BPRbiogas production rate
CEcircular economy
CHP combined heat and power
COD chemical oxygen demand
CON colloidal organic nitrogen
DON dissolved organic nitrogen
IN inorganic nitrogen
MPR methane production rate
N/D conventional nitrification/denitrification processes
NH4-N ammonium nitrogen
ON organic nitrogen
PE population equivalent
PON particulate organic nitrogen
TNtotal nitrogen
TNRRtotal nitrogen release rate
TS total solids
VFAs volatile fatty acids
VS volatile solids
WWTPs wastewater treatment plants

References

  1. The European Commission. Closing the Loop—An EU Action Plan for the Circular Economy; Communication from the Commission to the European Parliament, the Council, the European Economic and Social Committee and the Committee of the Regions; European Commission: Brussels, Belgium, 2015. [Google Scholar]
  2. Neczaj, E.; Grosser, A. Circular Economy in Wastewater Treatment Plant–Challenges and Barriers. Proceedings 2018, 2, 614. [Google Scholar] [CrossRef] [Green Version]
  3. Bianco, M. Circular Economy and WWTPs: Water Reuse and Biogas Production. In The Italian Water Industry; Metzler, J.B., Ed.; Springer: Berlin/Heidelberg, Germany, 2018; pp. 237–257. [Google Scholar]
  4. Sfez, S.; De Meester, S.; Vlaeminck, S.E.; Dewulf, J. Improving the resource footprint evaluation of products recovered from wastewater: A discussion on appropriate allocation in the context of circular economy. Resour. Conserv. Recycl. 2019, 148, 132–144. [Google Scholar] [CrossRef]
  5. Atelge, M.R.; Krisa, D.; Kumar, G.; Eskicioglu, C.; Nguyen, D.D.; Chang, S.W.; Atabani, A.E.; Al-Muhtaseb, A.H.; Unalan, S. Biogas Production from Organic Waste: Recent Progress and Perspectives. Waste Biomass Valorization 2018, 11, 1019–1040. [Google Scholar] [CrossRef]
  6. Tabatabaei, M.; Ghanavati, H. (Eds.) Biogas: Fundamentals, Process and Operation; Springer: Berlin/Heidelberg, Germany, 2018; Volume 6. [Google Scholar]
  7. Van Foreest, F. Perspectives for Biogas in Europe Publisher: Oxford Institute for Energy Studies; Oxford Institute for Energy Studies: Oxford, UK, 2012; pp. 9–21. [Google Scholar]
  8. Torrijos, M. State of Development of Biogas Production in Europe. Procedia Environ. Sci. 2016, 35, 881–889. [Google Scholar] [CrossRef]
  9. Alburquerque, J.A.; de la Fuente, C.; Ferrer-Costa, A.; Carrasco, L.; Cegarra, J.; Abad, M.; Bernal, M.P. Assessment of the fertiliser potential of digestates from farm and agroindustrial residues. Biomass Bioenergy 2012, 40, 181–189. [Google Scholar] [CrossRef]
  10. Imhoff, K.; Imhoff, K.R. Taschenbuch der Stadtentwässerung, 3rd ed.; Oldenbourg Industrieverlag: München, Germany; Wien, Vienna, 1976. [Google Scholar]
  11. Masłoń, A. An Analysis of Sewage Sludge and Biogas Production at the Zamość WWTP. Lect. Notes Civ. Eng. 2020, 7, 291–298. [Google Scholar] [CrossRef]
  12. Mata-Alvarez, J.; Dosta, J.; Romero-Güiza, M.; Fonoll, X.; Peces, M.; Astals, S. A critical review on anaerobic co-digestion achievements between 2010 and 2013. Renew. Sustain. Energy Rev. 2014, 36, 412–427. [Google Scholar] [CrossRef]
  13. Mata-Alvarez, J.; Macé, S.; Llabrés, P. Anaerobic digestion of organic solid wastes. An overview of research achievements and perspectives. Bioresour. Technol. 2000, 74, 3–16. [Google Scholar] [CrossRef]
  14. Metzler, J.B. (Ed.) Sustainable Rice Straw Management; Springer: Berlin/Heidelberg, Germany, 2020; pp. 65–92. [Google Scholar]
  15. Chow, W.L.; Chong, S.; Lim, J.W.; Chan, Y.J.; Chong, M.F.; Tiong, T.J.; Chin, J.K.; Pan, G.-T. Anaerobic Co-Digestion of Wastewater Sludge: A Review of Potential Co-Substrates and Operating Factors for Improved Methane Yield. Processes 2020, 8, 39. [Google Scholar] [CrossRef] [Green Version]
  16. Fux, C.; Siegrist, H. Nitrogen removal from sludge digester liquids by nitrification/denitrification or partial nitritation/anammox: Environmental and Economical considerations. Water Sci. Technol. 2004, 50, 19–26. [Google Scholar] [CrossRef] [PubMed]
  17. Zaborowska, E.; Czerwionka, K.; Makinia, J. Strategies for achieving energy neutrality in biological nutrient removal systems—A case study of the Slupsk WWTP (Northern Poland). Water Sci. Technol. 2016, 75, 727–740. [Google Scholar] [CrossRef]
  18. Koch, K.; Plabst, M.; Schmidt, A.; Helmreich, B.; Drewes, J.E. Co-digestion of food waste in a municipal wastewater treatment plant: Comparison of batch tests and full-scale experiences. Waste Manag. 2016, 47, 28–33. [Google Scholar] [CrossRef]
  19. Sosnowski, P.; Klepacz-Smolka, A.; Kaczorek, K.; Ledakowicz, S. Kinetic investigations of methane co-fermentation of sewage sludge and organic fraction of municipal solid wastes. Bioresour. Technol. 2008, 99, 5731–5737. [Google Scholar] [CrossRef]
  20. Tuszynska, A.; Wilinska, A.; Czerwionka, K. Phosphorus and nitrogen forms in liquid fraction of digestates from agricultural biogas plants. Environ. Technol. 2020, 1–13. [Google Scholar] [CrossRef]
  21. APHA. Standard Methods for the Examination of Water and Wastewater, 21st ed.; American Public Health Association: Washington, DC, USA, 2005. [Google Scholar]
  22. Czerwionka, K.; Makinia, J. Dissolved and colloidal organic nitrogen removal from wastewater treatment plants effluents and reject waters using physical—Chemical processes. Water Sci. Technol. 2014, 70, 561–568. [Google Scholar] [CrossRef]
  23. Luostarinen, S.; Luste, S.; Sillanpää, M. Increased biogas production at wastewater treatment plants through co-digestion of sewage sludge with grease trap sludge from a meat processing plant. Bioresour. Technol. 2009, 100, 79–85. [Google Scholar] [CrossRef] [PubMed]
  24. Davidsson, Å.; Lövstedt, C.; Jansen, J.L.C.; Gruvberger, C.; Aspegren, H. Co-digestion of grease trap sludge and sewage sludge. Waste Manag. 2008, 28, 986–992. [Google Scholar] [CrossRef] [PubMed]
  25. Grosser, A.; Neczaj, E.; Singh, B.; Almås, Å.R.; Brattebø, H.; Kacprzak, M. Anaerobic digestion of sewage sludge with grease trap sludge and municipal solid waste as co-substrates. Environ. Res. 2017, 155, 249–260. [Google Scholar] [CrossRef] [PubMed]
  26. Girault, R.; Bridoux, G.; Nauleau, F.; Poullain, C.; Buffet, J.; Peu, P.; Sadowski, A.; Béline, F. Anaerobic co-digestion of waste activated sludge and greasy sludge from flotation process: Batch versus CSTR experiments to investigate optimal design. Bioresour. Technol. 2012, 105, 1–8. [Google Scholar] [CrossRef] [PubMed] [Green Version]
  27. Noutsopoulos, C.; Mamais, D.; Antoniou, K.; Avramides, C.; Oikonomopoulos, P.; Fountoulakis, I. Anaerobic co-digestion of grease sludge and sewage sludge: The effect of organic loading and grease sludge content. Bioresour. Technol. 2013, 131, 452–459. [Google Scholar] [CrossRef] [PubMed]
  28. Svärd, Å.; Gruvberger, C.; Aspegren, H.; Jansen, J.L.C.; Christensen, T.H. Pilot scale digestion of source-sorted household waste as a tool for evaluation of different pre-sorting and pre-treatment strategies. In Proceedings of the 3rd International Symposium: Anaerobic Digestion of Solid Wastes, Munich, Germany, 18–20 September 2002. Theme 2 Institute of Water Quality Control and Waste Management, Technical University of Munich. [Google Scholar]
  29. Barber, W.P.F.; Lancaster, R. Quantifying the impacts of co-digestion of waste streams with sewage sludge. In Proceedings of the 14th European Biosolids and Organic Resources Conference and Exhibition, Leeds, UK, 9–11 November 2009. [Google Scholar]
  30. Azarmanesh, R.; Zonoozi, M.H.; Ghiasinejad, H. Characterization of food waste and sewage sludge mesophilic anaerobic co-digestion under different mixing ratios of primary sludge, secondary sludge and food waste. Biomass Bioenergy 2020, 139, 105610. [Google Scholar] [CrossRef]
  31. Ahn, Y.; Lee, W.; Kang, S.; Kim, S.-H. Enhancement of Sewage Sludge Digestion by Co-digestion with Food Waste and Swine Waste. Waste Biomass- Valorization 2019, 11, 2421–2430. [Google Scholar] [CrossRef]
  32. Bai, X.; Chen, Y.-C. Synergistic effect and supernatant nitrogen reduction from anaerobic co-digestion of sewage sludge and pig manure. Bioresour. Technol. Rep. 2020, 10, 100424. [Google Scholar] [CrossRef]
  33. Ahring, B.K.; Sandberg, M.; Angelidaki, I. Volatile fatty acids as indicators of process imbalance in anaerobic digestors. Appl. Microbiol. Biotechnol. 1995, 43, 559–565. [Google Scholar] [CrossRef]
  34. Rajagopal, R.; Massé, D.I.; Singh, G. A critical review on inhibition of anaerobic digestion process by excess ammonia. Bioresour. Technol. 2013, 143, 632–641. [Google Scholar] [CrossRef]
  35. Sambo, A.; Garba, B.; Danshehu, B. Effect of some operating parameters on biogas production rate. Renew. Energy 1995, 6, 343–344. [Google Scholar] [CrossRef]
  36. Chen, Y.; Cheng, J.J.; Creamer, K.S. Inhibition of anaerobic digestion process: A review. Bioresour. Technol. 2008, 99, 4044–4064. [Google Scholar] [CrossRef] [PubMed]
  37. Sharma, V.; Testa, C.; Lastella, G.; Cornacchia, G.; Comparato, M. Inclined-plug-flow type reactor for anaerobic digestion of semi-solid waste. Appl. Energy 2000, 65, 173–185. [Google Scholar] [CrossRef]
  38. Switzenbaum, M.S.; Giraldo-Gomez, E.; Hickey, R.F. Monitoring of the anaerobic methane fermentation process. Enzym. Microb. Technol. 1990, 12, 722–730. [Google Scholar] [CrossRef]
  39. Borowski, S.; Boniecki, P.; Kubacki, P.; Czyżowska, A. Food waste co-digestion with slaughterhouse waste and sewage sludge: Digestate conditioning and supernatant quality. Waste Manag. 2018, 74, 158–167. [Google Scholar] [CrossRef]
  40. Liu, C.; Li, H.; Zhang, Y.; Liu, C. Improve biogas production from low-organic-content sludge through high-solids anaerobic co-digestion with food waste. Bioresour. Technol. 2016, 219, 252–260. [Google Scholar] [CrossRef]
  41. Koupaie, E.H.; Leiva, M.B.; Eskicioglu, C.; Dutil, C. Mesophilic batch anaerobic co-digestion of fruit-juice industrial waste and municipal waste sludge: Process and cost-benefit analysis. Bioresour. Technol. 2014, 152, 66–73. [Google Scholar] [CrossRef]
  42. Montusiewicz, A.; Lebiocka, M.; Szaja, A. Variability of nutrients in co-digestion of sewage sludge and old landfill leachate. In Environmental Engineering IV, 2nd ed.; Pawłowski, A., Dudzińska, M.R., Pawłowski, L., Eds.; CRC Press: London, UK, 2013. [Google Scholar]
  43. Galvagno, G.; Eskicioglu, C.; Abel-Denee, M. Biodegradation and chemical precipitation of dissolved nutrients in anaerobically digested sludge dewatering centrate. Water Res. 2016, 96, 84–93. [Google Scholar] [CrossRef]
  44. Bis, M. Effect of Acid Whey Addition for Sewage Sludge Co-Digestion on the Nitrogen and Phosphorus Release. J. Ecol. Eng. 2020, 21, 13–21. [Google Scholar] [CrossRef]
  45. Abel-Denee, M.; Abbott, T.; Eskicioglu, C. Using mass struvite precipitation to remove recalcitrant nutrients and micropollutants from anaerobic digestion dewatering centrate. Water Res. 2018, 132, 292–300. [Google Scholar] [CrossRef]
  46. Czerwionka, K. Influence of dissolved organic nitrogen on surface waters. Oceanologia 2016, 58, 39–45. [Google Scholar] [CrossRef] [Green Version]
  47. Drewnowski, J.; Remiszewska-Skwarek, A.; Duda, S.; Łagód, G. Aeration Process in Bioreactors as the Main Energy Consumer in a Wastewater Treatment Plant. Review of Solutions and Methods of Process Optimization. Processes 2019, 7, 311. [Google Scholar] [CrossRef] [Green Version]
  48. Davidsson, Å.; Jansen, J.L.C.; Appelqvist, B.; Gruvberger, C.; Hallmer, M. Anaerobic digestion potential of urban organic waste: A case study in Malmö. Waste Manag. Res. 2007, 25, 162–169. [Google Scholar] [CrossRef] [PubMed]
  49. Lackner, S.; Gilbert, E.M.; Vlaeminck, S.E.; Joss, A.; Horn, H.; van Loosdrecht, M.C. Full-scale partial nitritation/anammox experiences—An application survey. Water Res. 2014, 55, 292–303. [Google Scholar] [CrossRef]
  50. Figueroa, M.; Vázquez-Padín, J.R.; Mosquera-Corral, A.; Campos, J.L.; Méndez, R. Is the CANON reactor an alternative for nitrogen removal from pre-treated swine slurry? Biochem. Eng. J. 2012, 65, 23–29. [Google Scholar] [CrossRef]
  51. Shourjeh, M.S.; Kowal, P.; Drewnowski, J.; Szeląg, B.; Szaja, A.; Łagód, G. Mutual Interaction between Temperature and DO Set Point on AOB and NOB Activity during Shortcut Nitrification in a Sequencing Batch Reactor in Terms of Energy Consumption Optimization. Energies 2020, 13, 5808. [Google Scholar] [CrossRef]
  52. Wett, B.; Hell, M.; Nyhuis, G.; Puempel, T.; Takacs, I.; Murthy, S. Syntrophy of aerobic and anaerobic ammonia oxidisers. Water Sci. Technol. 2010, 61, 1915–1922. [Google Scholar] [CrossRef] [PubMed]
Figure 1. Laboratory AD reactors: A—mechanical stirrer, B—sampling point, C—tubes for measuring the volume of produced biogas, D—temperature probe, E—biogas composition meter, F—temperature meter, G—control system, H—water jacket.
Energies 14 01907 g001
Figure 2. Scheme of nitrogen fractionation for the liquid fraction of the digestate.
Energies 14 01907 g002
Figure 3. Daily production of: (A) biogas; (B) methane and accumulation curves of: (C) biogas; (D) methane production.
Energies 14 01907 g003
Figure 4. Percentage composition of produced biogas in relation to methane, carbon dioxide, oxygen, and other gases for: (A) Test I; (B) Test II; (C) Test III; (D) Test IV.
Energies 14 01907 g004
Figure 5. The course of changes in the content of VS during co-fermentation.
Energies 14 01907 g005
Figure 6. Changes in the value of: (A) pH; (B) alkalinity; (C) VFA: alkalinity; (D) VFAs for the analyzed tests.
Energies 14 01907 g006
Figure 7. Nitrogen transformation during methane fermentation.
Energies 14 01907 g007
Figure 8. Changes in ammonia nitrogen concentration during co-fermentation tests.
Energies 14 01907 g008
Figure 9. Changes in organic nitrogen concentration in the liquid fraction of digestate during co-fermentation tests: (A) DON; (B) CON; (C) PON; (D) ON.
Energies 14 01907 g009
Figure 10. Electric energy balance for the three co-substrates in relation to 1 kg VSadded: (A) energy consumption for nitrogen removal for scenario I; (B) energy consumption for nitrogen removal for scenario II; (C) the amount of energy production in the CHP systems; (D) energy profit.
Energies 14 01907 g010
Table 1. The feedstock composition in the reactors for individual tests.
FeedstockTest ITest IITest IIITest IV
Inoculum6.4 dm36.4 dm36.4 dm36.4 dm3
Primary sludge-1.6 dm31.6 dm31.6 dm3
Flotate--160g160 g
Vegetables---53 g
Table 2. Feedstock characteristics.
FeedstockTotal Solids (TS)Volatile Solids (VS)
Inoculum22.704 ± 0.20 gTS/dm313.966 ± 0.16 g VS/dm3
Primary sludge25.551 ± 0.26 gTS/dm319.963 ± 0.17 g VS/dm3
Flotate0.406 ± 0.005 gTS/g0.379 ± 0.005 g VS/g
Vegetables0.159 ± 0.002 gTS/g0.151 ± 0.001 g VS/g
Table 3. Unit production of biogas and methane during methane fermentation (T = 36 °C, t = 30 days).
InputTest ITest IITest IIITest IV
BPR, dm3/kg VSadded
All added substrates124.4306.1530.9542.9
Primary sludge-844.9--
Flotate--971.1-
Vegetables---811.3
MPR, dm3 CH4/kg VSadded
All added substrates66.1165.5321.0329.1
Primary sludge-459.9--
Flotate--625.4-
Vegetables---511.5
Table 4. The literature review of biogas and methane production for various feedstock in the co-fermentation process.
l.p.Composition of Co-FermentationValueUnitReferences
1.In + SS (2:1)0.32m3 CH4/kg VS[18]
2.In + SS (2:1)672.2cm3biogas/g VSadded[30]
3.In + SS0.138m3 CH4/kg VS[31]
4.SS263m3 CH4/kg VSadded[23]
5.SS300dm3/kg VSadded[25]
6.In + FW (2:1)0.45m3 CH4/kg VS[18]
7.In + FW (2:1)1016cm3biogas/g VSadded[30]
8.In + FW270cm3 CH4/g VS[31]
9.In + SS (2:1) + FW (5–30%)0.33–0.36m3 CH4/kg VS[18]
10.SS + fatW + FW547m3/Mg VSadded[25]
11.SS + fatW (90:10 VS)360m3 CH4/Mg VSadded[24]
12.SS + fatW (95:5 VS)295m3 CH4/Mg VSadded[24]
13.SS + fatW546m3/Mg VSadded[26]
14.SS + fatW490m3/Mg VSadded[27]
15.SS + fatW463m3/Mg VSadded[23]
16.SS + fatW456m3/Mg VSadded[25]
SS—sewage sludge, In—inoculum, fatW—fat waste, FW—food waste.
Table 5. Unit value of ammonia nitrogen release rate during methane fermentation (T = 36 °C, HRT = 29 days).
FeedstockTest ITest IITest IIITest IV
mg NH4-N/g TSadded
All substrates4.3112.5217.3718.68
Primary sludge-53.64--
Flotate--32.05-
Vegetables---27.34
mg NH4-N/g VSadded
All substrates7.1719.6124.2925.86
Primary sludge-68.66--
Flotate--34.36-
Vegetables---28.89
Table 6. Unit value of total nitrogen release rate to the liquid fraction during methane fermentation (T = 36 °C, HRT = 29 d).
Feedstock Test ITest IITest IIITest IV
mg N/g TSadded
Inoculum1.38---
Primary sludge-68.35--
Flotate--44.21-
Vegetables---41.81
mg N/g VSadded
Inoculum2.29---
Primary sludge-87.48--
Flotate--47.39-
Vegetables---44.19
Publisher’s Note: MDPI stays neutral with regard to jurisdictional claims in published maps and institutional affiliations.

