Abstract
Load flexibility management is a promising approach to face the problem of balancing generation and demand in electrical grids. This problem is becoming increasingly difficult due to the variability of renewable energies. Thermostatically-controlled loads can be aggregated and managed by a virtual battery, and they provide a cost-effective and efficient alternative to physical storage systems to mitigate the inherent variability of renewable energy sources. However virtual batteries require that an accurate control system is capable of tracking frequency regulation signals with minimal error. A real-time control system allowing virtual batteries to accurately track frequency or power signals is developed. The performance of this controller is validated for a virtual battery composed of 1000 thermostatically-controlled loads. Using virtual batteries equipped with the developed controller, a study focused on residential thermostatically-controlled loads in Spain is performed. The results of the study quantify the potential of this technology in a country with different climate areas and provides insight about the feasibility of virtual batteries as enablers of electrical systems with high levels of penetration of renewable energy sources.
1. Introduction
A sustainable and environmentally-friendly electric system requires increasing the generation of energy coming from renewable sources, such as solar and wind energy. The higher penetration of renewable energy sources in the electric system reduces emissions of greenhouse gases and pollutants. However, this type of energy is uncertain and intermittent, and therefore not completely predictable. Consequently, the task of balancing electricity demand and generation is becoming more complicated. As the penetration of renewable energy sources grows, more advanced and efficient regulation strategies are required to balance the power of the system. In this scenario, flexibility management (FM) could become a suitable cost-effective alternative to overcome these technical difficulties.
Nowadays, an increasing number of houses have electric appliances that exploit their own thermal inertia, or that of the home, for their operation. These appliances are called “thermostatically controlled loads” (TCLs), and they are important FM resources. Their operation can be controlled in order to provide frequency regulation to the electrical grid, while respecting their own physical constraints and the user requirements. TCLs are also available in many industrial processes. Some examples are cold rooms and certain chemical reactors. In order to promote their operation as balancing resources for distribution system operators, TCLs can be aggregated into virtual batteries (VBs). Likewise to conventional batteries, they are defined in terms of global quantities such as capacity, state of charge (SOC), and power, but with some differences, as is explained later in this paper. Several studies characterize VBs involving homogeneous or heterogeneous TCLs [1,2,3,4,5,6]. The last one is closer to the real world, and has a greater significance and broader application possibilities.
The main contribution of this paper is two-fold. Firstly, a new VB controller for a population of TCLs is developed. Secondly, a study about the potential of VBs enabled by residential TCLs in Spain is accomplished using VBs that are equipped with the new controller. Similar studies have been carried out in other countries and regions, such as Denmark [7], Germany [8], Great Britain [9], Switzerland [10], California [11], and Sardinia [12]. But, to the best of our knowledge, this is the first one applied to Spain. In all the abovementioned studies, authors found that TCLs can provide huge potential to mitigate the negative effects of the increase in renewable energy sources in the electrical system. The current study for the Spanish case considers three different climate areas [13], featuring different prevalent weather conditions that may affect the renewable energy generation potential and TCLs performance. Crucial to this study is the use of an accurate real-time VB control system. The improved performance of the new controller allows us to fully understand the potential impact of the VBs in Spain with a strong level of confidence in the results. The performance of the new developed real-time VB control system has been validated by extensive simulation. The control set-point is settled by the grid operator, who determines the power required at every time instant based on the grid status.
Flexible loads, such as electrical vehicles (EVs) or TCLs, have been extensively studied as elements that could be aggregated to act as a virtual battery [14,15,16]. A theoretical characterization of the aggregate power and energy capacities for a collection of TCLs is reported in [3], as well as a priority-stack-based control strategy for frequency regulation using TCLs. A generalized battery model that can be directly controlled by an aggregator is introduced in [17]. The two abovementioned papers establish a TCL behaviour model and a VB control system. A study that experimentally models VBs is reported in [18], where a first-order model is adjusted using binary search algorithms. The operating reserve provided by an aggregation of heterogeneous TCLs can also be modeled probabilistically, as explained in [19,20,21,22,23], using Markov chains, as in [24,25,26], or applying model predictive control [27,28]. Several of these papers do not take into account the real short-term instantaneous status of TCLs, and some of them are focused on changing the set-point temperature of the devices, which could imply reducing users’ comfort. In [29], a stochastic battery model along with a control system which performs TCLs monitoring tasks is proposed, although frequent data acquisition is performed, the system does not accurately fit the grid requirements.
In [30], the technical viability of frequency regulation by TCLs is analysed, and it is proved that the load contribution can be significant. These thermal devices can also be applied to voltage control [31]. TCLs are useful in microgrids, as explained in [32], and in virtual energy storage systems (VESS) [33], where their capability to provide ancillary services is studied. Another use of TCLs is the management of intraday wholesale energy market prices [34].
The remainder of this paper is organised as follows. In Section 2, models of an individual TCL and a VB are introduced. These models are used to develop a new VB control system that improves the accuracy in power delivery as compared to previously designed control systems. In Section 3, our control systems are used to study the capabilities of VBs as a cost-effective solution to balance power generation and consumption in electric systems with a large penetration of renewable energy sources. The study is carried out for residential TCLs in Spain. Section 4 shows and discuss the results of the study. Previously, the performance of the new VB control system is validated through simulated experiments. Finally, the conclusion is given in Section 5.
2. The Virtual Battery
A VB is defined as an aggregated collection of TCLs operated by a suitable control system to provide power and frequency regulation to the electrical grid. VBs are combined with adequate regulation policies to increase penetration of renewable energy generation sources in the grid by balancing power demand and generation in a cost-effective manner.
A new real-time VB control system, which accurately follows the operator signal, is developed in this section. The control strategy complies with users and device constraints, such as TCL temperature bounds or short-cycling prevention. The goal is achieved by anticipating variations imposed by the abovementioned constraints. Our control strategy is an improvement of that reported in [35].
The models of TCL and VB used to develop the new control system are explained below. They quantify the stored energy and the maximum power the VB may provide. The models are represented in discrete-time and the sampling time is denoted by h. The nomenclature used in the models of the TCLs, VBs, and the control system is summarised in Nomenclature.
2.1. The TCL Model
A model allows the controller to predict the behaviour of each TCL and estimate its stored energy. For a set of N TCLs, the nameplate power of the i-th TCL is a positive quantity in cooling devices and negative in heating devices. Reversible heat pumps are classified into two different types: “Reversible heat pumps (heat)” and “reversible heat pumps (cold)”. The motivation for this classification is that some reversible heat pumps are only used for heating or cooling, not for both tasks. Besides, they have a different operation mode in the VB control algorithm.
Several discrete-time models of a TCL have been proposed in the literature [3,29]. Here, we use the model given in [29] because it is more realistic with a small cost of increasing complexity. In this model, the temperature of each TCL i is calculated for every time instant k using the following equation:
where
Each TCL has a set-point temperature (), which is set by the user, and a temperature dead-band () determined by the design of the TCL or by the user. Both parameters define the comfort band, whose bounds are . The temperature must always be inside this comfort band.
Consequently, the control system aims to maintain the temperature in the comfort band. The average power to get the objective () is given by:
In order to maintain the temperature in the comfort band, each load can be switched on and off by the control system depending on the temperature and its own status.
Each device is characterised by four binary-valued variables: Device type (), status (), availability (), and total availability (). The device type is 0 for a cooling TCL and 1 for a heating TCL. The device status is 1 when it is working, i.e., the motor is on with fixed power consumption , and 0 when off, with zero power consumption. The device availability is 1 when the TCL is available for the control system and 0 otherwise. A TCL is available when lies within the comfort band, and the time elapsed after its last change of status is large enough to avoid short-cycling. The full availability of the device is 0 when the ambient forecast temperature is lower (in cooling devices) or higher (in heating devices) than any TCL temperature bound. This last parameter indicates whether the TCL is ready to operate or not.
Short-cycling has harmful effects for electrical TCL systems. It causes damage in the electromechanical components, decreases their expected lifetime, and can also significantly drive up energy consumption. In order to avoid short-cycling, a minimum cycle elapsed time is defined. Let be the elapsed time after the last status change, then the TCL device is available if and .
The time to reach the temperature bound () is the time that a TCL can be off without reaching that bound. It is calculated by simulating the evolution of over time using the TCL dynamic model given by (1). If the TCL is not available, i.e., if , then also equals 0.
2.2. The VB Model
The VB model is an abstraction that represents a large number of TCLs with a reduced number of parameters. It allows the grid operator to make decisions in order to efficiently manage the grid.
The capacity of the VB is represented by two different parameters, and , to model the lack of symmetry in the dynamics of the charging and discharging processes of a TCL. In one case, the temperature change is forced by mechanical or electrical components (increasing in heating devices or reducing it in cooling ones), and in the other case it is not. Likewise, the state of charge ( and ), the maximum power ( and ), and the maximum available power ( and ) are also duplicated.
The charging capacity () is the maximum energy that can be used from every TCL whose status is 1. If the VB is charging, then the charging state of charge () is the current energy reserve of the VB for charging. Likewise, the discharging capacity () and the discharging state of charge () represent the maximum energy that can be used for discharging and the current energy reserve for discharging. The capacities and are calculated by using the models to obtain the time that total available TCLs (i.e., ) take to evolve from one temperature bound to the other. The states of charge and also use the TCL models, but operating from the actual temperature to the corresponding temperature bound. The algorithms developed for computing the capacities and states of charge require long-term temperature forecasts to produce accurate results. Accurate forecasts are assumed to be available in this paper.
The maximum charging power () is the maximum power a VB can provide for charging, assuming that all TCLs are available ( is 1):
The maximum available charging power () is the maximum power that a VB can provide in the following instant, considering only the available TCLs. It is calculated by excluding the TCLs that are unavailable for charging:
where is the sum of power of the TCLs which are unavailable for charging. TCLs are unavailable for charging when their status cannot be on in the next time instant.
The maximum available discharging power () is the same as , but for the discharging process:
The maximum available discharging power () excludes the power of the TCLs which are unavailable:
where is the sum of power of TCLs that are unavailable for discharging. TCLs are unavailable for discharging when their status cannot be off in the following instant.
The maximum powers , , , and are calculated considering only TCLs that are totally available ( is 1).
2.3. The VB Controller
The real-time VB control algorithm is composed of three blocks: Check of TCLs, Aggregation, and Priority Control. The first block is executed individually by each TCL, while the others are managed by a centralised controller. The communication between TCLs and the aggregator is done by using the method explained in [36], which requires an internet connection. An accurate long-term weather forecast is required to obtain reliable results. Figure 1 shows the complete controller structure where the interconnection of the three blocks is displayed.
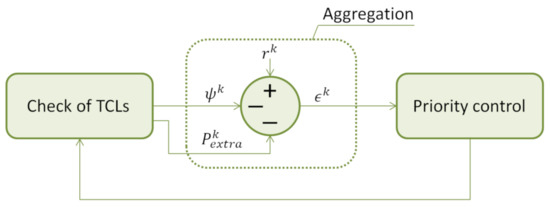
Figure 1.
Structure of the virtual battery (VB) controller.
2.3.1. Checking of TCL
The objective of this block is to compute the variables of a TCL at the next time instant and to avoid its temperature from leaving the comfort band. The process that a TCL i executes is detailed in Algorithm A1, see Appendix A. In this algorithm, a TCL with variables that are close to violating their constraints are identified and marked, which means that and/or become 1. The powers , , and the extra power () are calculated as well. is the VB total power that will be switched on or off at the next time instant in order to avoid violating the TCLs constraints.
The computed variables of each TCL should be automatically communicated to the centralised controller every time instant h. If the length of the sampling time interval h is too small, then the communication system would require a high bandwidth and very expensive hardware due to the high volume of data. Notwithstanding, the variables must be sent as often as possible, so the controller may quickly correct any power deviation. In our studies, we have used s.
2.3.2. Aggregation
In this controller block, the data obtained from each device are aggregated and compared to the system operator signal (r). This value is the amount of power that the grid operator wants to be provided. It can be either positive or negative, and has been previously determined by the grid operator using the current grid status and information about the VB capacity, state of charge, and maximum power. If r is positive, then the VB is ordered to absorb energy. It could be caused by an excess in renewable energy production or a strong power demand fall. However, if r is negative, then the VB has to stop consuming energy. This case corresponds to a higher power demand or lower electric generation than expected.
System deviation () is the difference between the current power consumed by the VB, and its base power. The system deviation is obtained as:
where,
As a result of the aggregation process, the regulation signal () is given by:
This variable will be used at the Priority Control block, and it determines the power that finally has to be provided. The aggregation block is implemented in Algorithm A2, see Appendix A.
2.3.3. Priority Control
The last block of the control system decides which TCLs change their status variables in such a way that the output VB power tracks the system operator signal r. The selected TCLs must be available and its temperature be far enough from the temperature bounds. The decision making process has been implemented in Algorithm A3, see Appendix A. The variable p tracks the total power obtained during the execution of the algorithm. The process stops when the absolute value of p exceeds the absolute value of or when every TCL has been assessed. When a TCL changes its status , then the cycle elapsed time is reset. The algorithm only works properly when the requirements of the grid operator are between the previously calculated capacities and the maximum available power. In that case, the maximum error between and r is the greatest in the aggregation of TCLs.
3. Residential Virtual Battery Potential in Spain
The model of a VB and its control system developed in Section 2 are used here to perform studies about the implementation of residential VBs and their capabilities. The study focuses on Spain for several reasons: Its great potential for renewable energy penetration in the electric grid, the presence of different climate areas, and the availability of data. The main source of information about residential TCLs in Spain is the SECH-SPAHOUSEC project [13]. It was developed by IDAE (Instituto para la Diversificación y Ahorro de la Energía), and it estimates the penetration per house of heat pumps, cold pumps, electric water heaters, and refrigerators in the different climate areas of the country in 2010. A summary of that information is shown in Table 1. According to [13], Spain is geographically classified in three different climate areas: North Atlantic, Continental, and Mediterranean, see Figure 2. In order to update the current number of TCLs in Spain, shown in Table 2, the variation in the number of houses between 2010 and 2019 at each climate area is considered. This information is obtained from the ECH survey (Encuesta Continua de Hogares) [37], developed by the Spanish INE (Instituto Nacional de Estadística).

Table 1.
TCLs penetration (%) in Spain in 2010 according to [13].
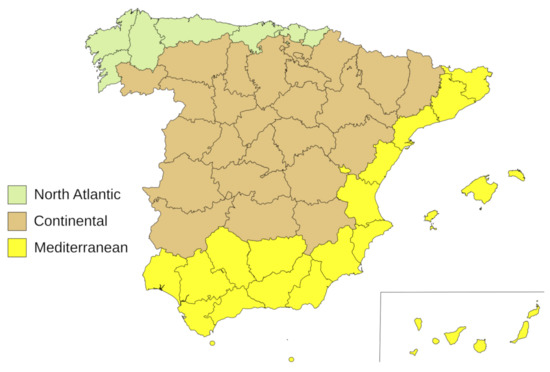
Figure 2.
Geographic distribution of climatic zones in Spain.
Table 2.
Number (#) of TCLs per climate area in 2019.
In the North Atlantic climate area, the deployment of cold pumps and reversible heat pumps for air conditioning is very reduced. The reason is that the temperature is not so hot in summer as in other climate areas.
Unfortunately, to the best of our knowledge, there does not exist publicly available databases concerning thermal and electrical characteristics of TCLs in Spain. Thus, the study has been performed by sampling random data from Table 3. The range of values for the parameters shown in this table has been obtained from [38].
Table 3.
Range of values for the parameters of residential TCLs.
4. Results and Discussion
In this section, two case studies are performed and the obtained results are discussed. In the first case study, the VB operation of the controller is analysed. This study demonstrates the accurate behaviour of the controller. Later, in a second case study, the residential VB charging capacity, discharging capacity, maximum charging power, and maximum discharging power of each Spain climate area are obtained along a natural year, concluding maximum power ratios and TCL contribution percentages. For this study, a VB controlled by the new developed controller has been used.
4.1. Case Study: VB Controller Operation
The control system developed in Section 2 was implemented in MATLAB [39] and its performance is studied for a VB of 1000 TCLs classified as follows: 125 reversible heat pumps (cold), 125 cold pumps, 125 reversible heat pumps (heat), 125 non-reversible heat pumps, 250 refrigerators, and 250 electric water heaters. The parameters of each TCL have been randomly selected by using a Gaussian probability distribution centered on the mean values given in Table 3 and a standard deviation of . The simulation covers 200 time instants with a sampling interval h of 10 s, which amounts to a total of 2000 s. The minimum cycle elapsed time, , is given a value of 60 s. No disturbance has been considered, i.e., . The initial status of each TCL has also been conveniently randomised using a binary probability distribution. The estimated ambient temperature is fixed at 20 C in case of refrigerators and electric water heaters. For the remaining TCLs, is a variable.
The results are shown in Figure 3 and Table 4 and are summarised as follows. The system deviation accurately tracks the system operator power signal, r, most of the time. The exception is the time interval between 510 and 750 s, where the maximum stays at the value given by , the maximum available charging power. The reason is that the grid operator established a value of r that the VB is not capable of producing as it is outside the range previously defined by and . This situation should be avoided by taking into account the capability, SOC, and power information of the VB. When the signal r changes, several TCLs change their status, which means that they become unavailable for 1 min. This explains the peaks and valleys in and when r is modified. The absolute error is lower than 6 kW in absolute value whenever r is between and . Otherwise, the VB cannot follow the system operator signal and the absolute error is either or . The charging/discharging capacities / and the maximum charging/discharging powers / appear to be constant in Figure 3a,d,e. In fact, they evolve with time but the changes are very small because the simulation time is not large enough to notice great changes in the ambient temperatures. The greatest values of these variables are given in Table 4. The charging capacity is about 6.5 times greater than the discharging capacity at every time instant. The reason is the lack of symmetry in the charging and discharging process, as the TCL takes more time to change its temperature when it is not forced to by electromechanical components, i.e., when it is switched off (). Regarding the maximum charging/discharging power, is about twice as large as , since the sum of the nameplate powers doubles the sum of the average powers for every TCL .
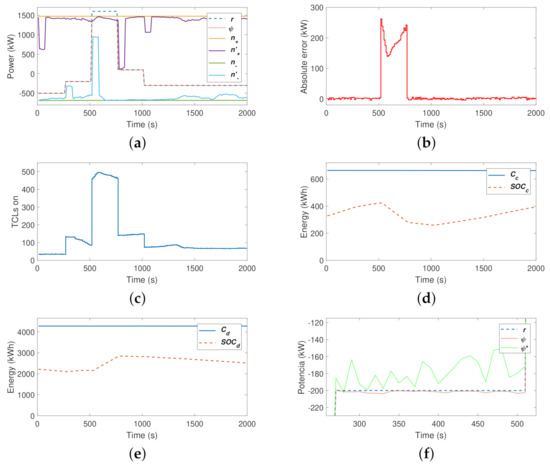
Figure 3.
Results of the VB controller operation: (a) System operator signal and system deviation, (b) absolute error following operator signal, (c) number of TCLs on, (d) charging capacity and charging state of charge, (e) discharging capacity and discharging state of charge, and (f) system deviation comparison during instants between seconds 270–510.
Table 4.
Greatest capacities and maximum powers.
The improvement achieved by the new controller proposed in this paper is depicted in Figure 3f. In this figure, is compared to between the seconds 270 and 510, which is the system deviation signal when the anticipation to the variations imposed by TCLs constraints is not included in the controller. As mentioned above, follows r with an absolute error not greater than an individual TCL nameplate power, while is several times greater, as it depends on how many TCLs have to change their status forced by any of their inner constraints, which is almost random. Specifically, in this case, the maximum absolute error becomes around 15 times higher than the maximum absolute error , in absolute value.
Besides performing short-duration regulation, the VB is able to maintain a system deviation of −300 kW for more than 15 min, as can be seen from time 1010 to 2000 s. This means that this VB can provide ancillary services to the grid similar to the usual primary and secondary regulation, according to the current definition given by the Spanish normative [40], which is followed by the grid operator of the country, Red Eléctrica de España. Using European Network of Transmission System Operators (ENTSO-E) terminology [41], this VB could supply regulation similar to Frequency Containment Reserves (FCR) and Frequency Restoration Reserves (FRR) services. The main difference between the regulation provided by the VB and the primary and secondary regulation is that the first acts on the demand side, whereas the others act on the generation side. As a general rule, the VB will fail to follow signal r earlier if the amount of power requested is larger.
4.2. Case Study: VB Potential in Spain
The results of the study of the VB potential in Spain are reported here. Every existing TCL at each of the three climate areas of this country are assumed to be part of the corresponding VB. The charging capacity, discharging capacity, maximum charging power, and maximum discharging power of each climate area of Spain throughout a natural year are shown in Figure 4 and Figure 5. The ratios of greatest capacity and maximum power per home are shown in Table 5. Information about the contribution of each residential type of TCL to the VB potential of each climate region is collected in Table 6, Table 7, Table 8 and Table 9. The average values from Table 3 for the parameters of each type of TCL have been used in the study, along with the ambient temperature of each climate area, obtained from the hourly temperature model [42] of the most populated cities at each climate area during 2019: Bilbao (North Atlantic), Madrid (Continental), and Barcelona (Mediterranean). In the case of refrigerators and electric water heaters, the ambient temperature is assumed to be constant and equal to 20 C.
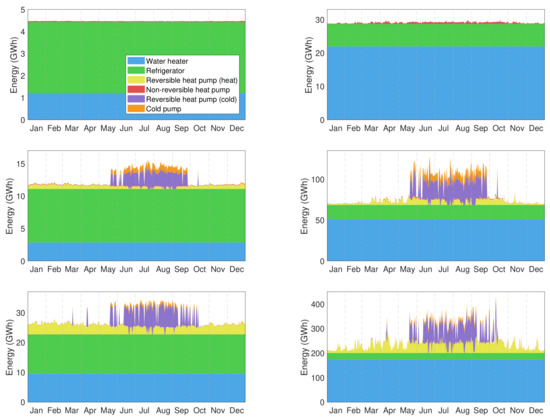
Figure 4.
Charging capacity (left) and discharging capacity (right) in North Atlantic, Continental, and Mediterranean climate areas in 2019.
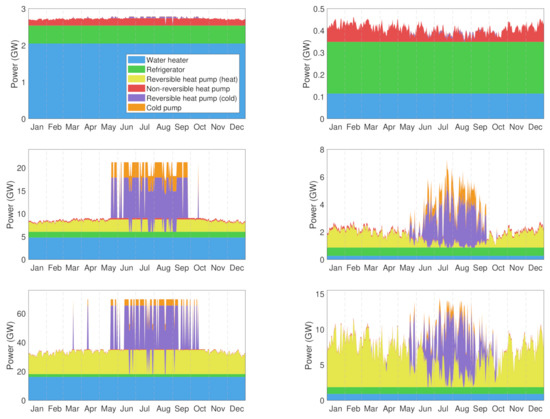
Figure 5.
Maximum charging power (left) and maximum discharging power (right) in North Atlantic, Continental, and Mediterranean climate areas in 2019.
Table 5.
Greatest capacity and power ratios per climate area in 2019.
Table 6.
Contribution percentage of each type of TCL to charging capacity per climate area in 2019.
Table 7.
Contribution percentage of each type of TCL to discharging capacity per climate area in 2019.
Table 8.
Contribution percentage of each type of TCL to maximum charging power per climate area in 2019.
Table 9.
Contribution percentage of each type of TCL to maximum discharging power per climate area in 2019.
Some interesting results should be highlighted. The Mediterranean is the climate area with the highest VB potential, while the North Atlantic has the lowest. Electric water heaters and refrigerators have the highest contribution to the charging and discharging capacity in three climate areas. Moreover, this contribution is constant during the year, as it can be checked in Figure 4 and Figure 5. The reason is that the home ambient temperature is considered constant and equal to 20 C. Refrigerators have more charging capacity in every climate area, while water heaters have more discharging capacity, see Figure 4. These constant capacities can be used for demand management at any time of the year. The remaining devices have a variable capacity contribution, as can be easily seen by the numerous peaks and valleys appearing in Figure 4 and Figure 5. This is a consequence of the variability of the temperature along different days and seasons. The capacity and maximum power of heat and cold pumps depend on the weather. In general, heat pumps can only be used on cold days and most of them are in winter. In contrast, cold pumps are mostly used on hot days, typically during summer. Reversible heat pumps and cold pumps have a greater contribution in Continental and Mediterranean areas than in the North Atlantic area. The reason is the greater number of them in these areas, see Table 2. Consequently, the variability in capacity and maximum power potential is more important in those climatic areas, see Figure 4 and Figure 5. Some summer days, the contribution of pumps to maximum charging and discharging power exceeds 50%, as can be easily checked by visual inspection in Figure 5. During these days, most of the cold pumps are working. Thus, VBs with efficient controllers could exploit this variability to improve national electric systems. Finally, the lack of symmetry in the charging and discharging process, explained in Section 4.1, clearly manifests here as a greater discharging capacity than charging capacity, as well as a greater maximum charging power than maximum discharging power, both for every climate area.
4.3. Discussion
A huge amount of energy and power flexibility of TCLs can be efficiently managed at real-time in a cost-effective way using a virtual battery. The control method proposed in this article to perform power regulation, control, and communication between TCLs and the aggregator improves the accuracy in tracking the system operator command power signal and does not require great investments in hardware or electronics because most of them are already installed, including the TCLs, thermal sensors, and Internet connection. This is an efficient and cost-effective alternative to conventional batteries or fossil fuel solutions that require complete new installations. Furthermore, VB potential is expected to increase in the next few years due to the progressive electrification of heating devices.
Another important benefit that VBs provide is the decentralisation and empowerment of consumers in the goal of balancing the grid. They become potential participants in balancing markets. Although these markets are not currently completely developed in Europe, the European Union has launched Regulation 2019/943 [43] and Directive 2019/944 [44], where balancing markets are considered. As mentioned in [43], these markets can either be individually accessed or be part of an aggregation, ensuring non-discriminatory access to all participants and respecting the need to adapt to the increasing share of variable generation and increased demand responsiveness. VBs fit properly with these requirements.
In the case of Spain, net balancing energy amounted to approximately 1209 GWh in 2019 [45]. This means an average power of 138 MW. However, positive and negative hourly peaks of more than 4000 MW are produced [46]. The study performed in this paper shows that taking advantage of FM trough VBs clearly helps to achieve power regulation goals in Spain, especially in extreme situations. The remuneration for participating in balancing markets must be important to encourage TCL owners to become contributors. Although the Mediterranean climate area has the highest residential power and capacity potential in Spain, VBs management should be profitable in any climate region if the economic profit is sufficient.
5. Conclusions
The capacity and maximum power provided by the aggregation of TCLs in Spain were analysed in this paper. The different regions of Spain were classified into three different climate areas and a VB including an improved real-time control was used for this study. The obtained results show the flexibility potential of the different climate areas of the country, which should encourage power system actors to develop and implement VBs technology. In addition, a new control system for improving the operation of BV was developed. Its performance showed excellent levels of accuracy in tracking the command signals provided by the system operator when VB constraints were fulfilled.
The results prove that VBs could be very useful in providing regulation support to electrical grids. If the communication between TCLs and aggregators is sufficiently fast, VBs become a cost-effective and efficient short-term energy storage alternative which, in combination with other existing ones (SMES, flywheels, etc.), greatly facilitates renewable energy penetration. VBs are a powerful instrument for implementing demand side management programs. Their utility is closely related to the speed and reliability of communication networks, the quality of TCLs models, and the prediction of the ambient temperature. The detailed study of the global impact of VBs on the Spanish grid requires precise electrical models of distribution networks, but it is expected that they will attenuate the effects of the intermittency of renewable energy sources. The development of new flexibility markets may promote the use of virtual batteries and consequently, a higher penetration of renewable energy in the national electric grids with reduced impact in its loss of controllability. Improving these aspects is driving our future research work.
Author Contributions
Conceptualisation, A.M.-C., S.S.-R. and E.B.; methodology, A.M.-C. and S.S.-R.; software, A.M.-C.; validation, A.M.-C., S.S.-R. and E.B.; formal analysis, A.M.-C.; investigation, A.M.-C. and S.S.-R.; resources, A.M.-C. and S.S.-R.; data curation, A.M.-C.; writing—original draft preparation, A.M.-C.; writing—review and editing, A.M.-C., S.S.-R. and E.B.; visualisation, A.M.-C. and E.B.; supervision, S.S.-R. and E.B.; project administration, S.S.-R.; funding acquisition, S.S.-R. All authors have read and agreed to the published version of the manuscript.
Funding
This research has been partially supported by the European Union ERDF (European Regional Development Fund) and the Junta de Castilla y León through ICE (Instituto para la Competitividad Empresarial) to improve innovation, technological development, and research, dossier no. CCTT1/17/VA/0005.
Data Availability Statement
Not applicable.
Conflicts of Interest
The authors declare no conflict of interest.
Nomenclature
| Symbol | Meaning |
| Thermostatically controlled load (TCL) temperature () | |
| Forecast ambient temperature () | |
| Set point temperature () | |
| Temperature dead-band () | |
| Perturbation () | |
| Thermal resistance (/kW) | |
| Thermal capacity (kWh/) | |
| P | Nameplate power (kW) |
| Mean power (kW) | |
| Coefficient of performance | |
| Kind of device | |
| u | Status |
| Availability | |
| Full availability | |
| Time to reach bound temperature (h) | |
| Cycle elapsed time (h) | |
| Minimum cycle elapsed time (h) | |
| Set of TCLs with cardinality N | |
| / | Charging/Discharging capacity (kWh) |
| / | Charging/Discharging state of charge (kWh) |
| / | Maximum charging/discharging power (kW) |
| / | Maximum available charging/discharging power (kW) |
| Extra power (kW) | |
| r | System operator signal (kW) |
| Aggregated power (kW) | |
| Base power (kW) | |
| System deviation (kW) | |
| Regulation signal (kW) | |
| p | Power switched (kW) |
| i | Subindex denoting individual TCL |
| k | Subindex denoting time instant |
Appendix A. Control Algorithms
| Algorithm A1 Check of TCLs |
{Total availability}
{Forecast ambient temperature}
{TCL temperature}
{Cycled passed time}
|
| Algorithm A2 Aggregation |
{Capacity}
{State of charge}
{Maximum power}
{Regulation signal}
|
| Algorithm A3 Priority Control |
{Disaggregation}
|
References
- Callaway, D.S.; Hiskens, I.A. Achieving Controllability of Electric Loads. Proc. IEEE 2011, 99, 184–199. [Google Scholar] [CrossRef]
- Koch, S.; Mathieu, J.L.; Callaway, D.S. Modeling and Control of Aggregated Heterogeneous Thermostatically Controlled Loads for Ancillary Services. In Proceedings of the 17th Power Systems Computation Conference (PSCC’11), Stockholm, Sweden, 22–26 August 2011. [Google Scholar]
- Hao, H.; Sanandaji, B.M.; Poolla, K.; Vincent, T.L. A generalized battery model of a collection of Thermostatically Controlled Loads for providing ancillary service. In Proceedings of the 2013 51st Annual Allerton Conference on Communication, Control, and Computing (Allerton), Monticello, IL, USA, 2–4 October 2013; pp. 551–558. [Google Scholar] [CrossRef]
- Acharya, S.; El Moursi, M.S.; Al-Hinai, A. Coordinated frequency control strategy for an islanded microgrid with demand side management capability. IEEE Trans. Energy Convers. 2017, 33, 639–651. [Google Scholar] [CrossRef]
- Tindemans, S.H.; Trovato, V.; Strbac, G. Decentralized control of thermostatic loads for flexible demand response. IEEE Trans. Control Syst. Technol. 2015, 23, 1685–1700. [Google Scholar] [CrossRef]
- Wang, P.; Wu, D.; Kalsi, K. Flexibility Estimation and Control of Thermostatically Controlled Loads with Lock Time for Regulation Service. IEEE Trans. Smart Grid 2020, 11, 3221–3230. [Google Scholar] [CrossRef]
- Mathieu, J.L.; Rasmussen, T.B.; Sørensen, M.; Jòhannsson, H.; Andersson, G. Technical resource potential of non-disruptive residential demand response in Denmark. In Proceedings of the 2014 IEEE PES General Meeting, Conference Exposition, National Harbor, MD, USA, 27–31 July 2014; pp. 1–5. [Google Scholar] [CrossRef]
- Gils, H.C. Economic potential for future demand response in Germany—Modeling approach and case study. Appl. Energy 2016, 162, 401–415. [Google Scholar] [CrossRef]
- Trovato, V.; Sanz, I.M.; Chaudhuri, B.; Strbac, G. Advanced control of thermostatic loads for rapid frequency response in Great Britain. IEEE Trans. Power Syst. 2016, 32, 2106–2117. [Google Scholar] [CrossRef]
- Kamgarpour, M.; Vrettos, E.; Andersson, G.; Lygeros, J. Population of Thermostatically Controlled Loads for the Swiss Ancillary Service Market. In Proceedings of the COLEB 2014 Workshop Computational Optimisation of Low-Energy Buildings, Zürich, Switzeland, 6–7 March 2014; pp. 49–50. [Google Scholar]
- Hao, H.; Sanandaji, B.M.; Poolla, K.; Vincent, T.L. Potentials and economics of residential thermal loads providing regulation reserve. Energy Policy 2015, 79, 115–126. [Google Scholar] [CrossRef]
- Conte, F.; Massucco, S.; Silvestro, F.; Ciapessoni, E.; Cirio, D. Stochastic modelling of aggregated thermal loads for impact analysis of demand side frequency regulation in the case of Sardinia in 2020. Int. J. Electr. Power Energy Syst. 2017, 93, 291–307. [Google Scholar] [CrossRef]
- Instituto para la Diversificación y ahorro de la Energía. Proyecto SHEC-SPAHOUSEC. Análisis del Consumo Energético del Sector Residencial en España. Informe Final. 2011. Available online: http://www.idae.es/uploads/documentos/documentos_Informe_SPAHOUSEC_ACC_f68291a3.pdf (accessed on 19 February 2021).
- Han, S.; Han, S.; Sezaki, K. Estimation of achievable power capacity from plug-in electric vehicles for V2G frequency regulation: Case studies for market participation. IEEE Trans. Smart Grid 2011, 2, 632–641. [Google Scholar] [CrossRef]
- Liu, H.; Hu, Z.; Song, Y.; Lin, J. Decentralized vehicle-to-grid control for primary frequency regulation considering charging demands. IEEE Trans. Power Syst. 2013, 28, 3480–3489. [Google Scholar] [CrossRef]
- Kempton, W.; Udo, V.; Huber, K.; Komara, K.; Letendre, S.; Baker, S.; Brunner, D.; Pearre, N. A test of vehicle-to-grid (V2G) for energy storage and frequency regulation in the PJM system. Results Ind. Univ. Res. Partnersh. 2008, 32, 1–32. [Google Scholar]
- Hao, H.; Sanandaji, B.M.; Poolla, K.; Vincent, T.L. Aggregate Flexibility of Thermostatically Controlled Loads. IEEE Trans. Power Syst. 2015, 30, 189–198. [Google Scholar] [CrossRef]
- Nandanoori, S.P.; Chakraborty, I.; Ramachandran, T.; Kundu, S. Identification and Validation of Virtual Battery Model for Heterogeneous Devices. In Proceedings of the IEEE Power & Energy Society General Meeting (PESGM 2019), Atlanta, GA, USA, 4–8 August 2019; pp. 1–5. [Google Scholar] [CrossRef][Green Version]
- Ding, Y.; Cui, W.; Zhang, S.; Hui, H.; Qiu, Y.; Song, Y. Multi-state operating reserve model of aggregate thermostatically-controlled-loads for power system short-term reliability evaluation. Appl. Energy 2019, 241, 46–58. [Google Scholar] [CrossRef]
- Lu, N.; Chassin, D.P.; Widergren, S.E. Modeling uncertainties in aggregated thermostatically controlled loads using a state queueing model. IEEE Trans. Power Syst. 2005, 20, 725–733. [Google Scholar] [CrossRef]
- Zhang, W.; Kalsi, K.; Fuller, J.; Elizondo, M.; Chassin, D. Aggregate model for heterogeneous thermostatically controlled loads with demand response. In Proceedings of the 2012 IEEE Power and Energy Society General Meeting, San Diego, CA, USA, 22–26 July 2012; pp. 1–8. [Google Scholar]
- Perfumo, C.; Kofman, E.; Braslavsky, J.H.; Ward, J.K. Load management: Model-based control of aggregate power for populations of thermostatically controlled loads. Energy Convers. Manag. 2012, 55, 36–48. [Google Scholar] [CrossRef]
- Kundu, S.; Sinitsyn, N.; Backhaus, S.; Hiskens, I. Modeling and control of thermostatically controlled loads. arXiv 2011, arXiv:1101.2157. [Google Scholar]
- Radaideh, A.; Vaidya, U.; Ajjarapu, V. Sequential Set-Point Control for Heterogeneous Thermostatically Controlled Loads Through an Extended Markov Chain Abstraction. IEEE Trans. Smart Grid 2019, 10, 116–127. [Google Scholar] [CrossRef]
- Mathieu, J.L.; Callaway, D.S. State estimation and control of heterogeneous thermostatically controlled loads for load following. In Proceedings of the 2012 45th Hawaii International Conference on System Sciences, Maui, HI, USA, 4–7 January 2012; pp. 2002–2011. [Google Scholar]
- Xia, M.; Song, Y.; Chen, Q. Hierarchical control of thermostatically controlled loads oriented smart buildings. Appl. Energy 2019, 254, 113493. [Google Scholar] [CrossRef]
- Liu, M.; Shi, Y. Model predictive control of aggregated heterogeneous second-order thermostatically controlled loads for ancillary services. IEEE Trans. Power Syst. 2015, 31, 1963–1971. [Google Scholar] [CrossRef]
- Liu, M.; Peeters, S.; Callaway, D.S.; Claessens, B.J. Trajectory tracking with an aggregation of domestic hot water heaters: Combining model-based and model-free control in a commercial deployment. IEEE Trans. Smart Grid 2019, 10, 5686–5695. [Google Scholar] [CrossRef]
- Khan, S.; Shahzad, M.; Habib, U.; Gawlik, W.; Palensky, P. Stochastic battery model for aggregation of thermostatically controlled loads. In Proceedings of the 2016 IEEE International Conference on Industrial Technology (ICIT), Taipei, Taiwan, 14–17 March 2016; pp. 570–575. [Google Scholar] [CrossRef]
- Conte, F.; di Vergagni, M.C.; Massucco, S.; Silvestro, F.; Ciappessoni, E.; Cirio, D. Frequency Regulation by Thermostatically Controlled Loads: A Technical and Economic Analysis. In Proceedings of the 2018 IEEE Power Energy Society General Meeting (PESGM), Portland, OR, USA, 5–10 August 2018; pp. 1–5. [Google Scholar] [CrossRef]
- Bogodorova, T.; Vanfretti, L.; Turitsyn, K. Voltage control-based ancillary service using thermostatically controlled loads. In Proceedings of the 2016 IEEE Power and Energy Society General Meeting (PESGM), Boston, MA, USA, 17–21 July 2016; pp. 1–5. [Google Scholar]
- Wang, Y.; Tang, Y.; Xu, Y.; Xu, Y. A Distributed Control Scheme of Thermostatically Controlled Loads for the Building-Microgrid Community. IEEE Trans. Sustain. Energy 2019, 11, 350–360. [Google Scholar] [CrossRef]
- Cheng, M.; Sami, S.S.; Wu, J. Benefits of using virtual energy storage system for power system frequency response. Appl. Energy 2017, 194, 376–385. [Google Scholar] [CrossRef]
- Mathieu, J.L.; Kamgarpour, M.; Lygeros, J.; Andersson, G.; Callaway, D.S. Arbitraging intraday wholesale energy market prices with aggregations of thermostatic loads. IEEE Trans. Power Syst. 2014, 30, 763–772. [Google Scholar] [CrossRef]
- Martín Crespo, A.; Saludes Rodil, S. Uso de la flexibilidad de cargas eléctricas con inercia térmica mediante una batería virtual para la regulación de red. In Proceedings of the V Congreso Smart Grids: Libro de Comunicaciones, Madrid, Spain, 13 December 2018. [Google Scholar]
- Lakshmanan, V.; Marinelli, M.; Kosek, A.M.; Nørgård, P.B.; Bindner, H.W. Impact of thermostatically controlled loads’ demand response activation on aggregated power: A field experiment. Energy 2016, 94, 705–714. [Google Scholar] [CrossRef]
- Instituto Nacional de Estadística. Número de Hogares por Provincias Según Tipo de Hogar y Número de Habitaciones de la Vivienda. Available online: http://www.ine.es/jaxi/Tabla.htm?path=/t20/p274/serie/def/p03/l0/&file=03003.px&L=0 (accessed on 19 February 2021).
- Mathieu, J.L. Modeling, Analysis, and Control of Demand Response Resources. Ph.D. Thesis, UC Berkeley, Berkeley, CA, USA, 2012. [Google Scholar]
- The Mathworks, Inc. MATLAB Version 2019b; The Mathworks, Inc.: Natick, MA, USA, 2019. [Google Scholar]
- España. Resolución de 13 de julio de 2006, de la Secretaría General de Energía, por la que se aprueba el procedimiento de operación 1.5 «Establecimiento de la reserva para la regulación frecuencia-potencia». In Boletín Oficial del Estado; Ministerio de Industria, Turismo y Comercio: Madrid, Spain, 2016; Volume 173, pp. 27473–27474. [Google Scholar]
- Smart Energy Demand Coalition. Explicit Demand Response In Europe—Mapping the Markets. 2017. Available online: https://www.smarten.eu/wp-content/uploads/2017/04/SEDC-Explicit-Demand-Response-in-Europe-Mapping-the-Markets-2017.pdf (accessed on 19 February 2021).
- España. Documento Básico HE Ahorro de Energía; Código Técnico de la Edificación: Madrid, Spain, 2017. [Google Scholar]
- European Union. Regulation (EU) 2019/943 of the European Parliament and of the Council of 5 June 2019 on the internal market for electricity. Off. J. Eur. Union 2019, L 158/154. Available online: http://data.europa.eu/eli/reg/2019/943/oj (accessed on 19 February 2021).
- European Union. Directive (EU) 2019/944 of the European Parliament and of the Council of 5 June 2019 on common rules for the internal market for electricity and amending Directive 2012/27/EU. Off. J. Eur. Union 2019, L 158/125. Available online: http://data.europa.eu/eli/dir/2019/944/oj (accessed on 19 February 2021).
- Red Eléctrica de España. Net Balancing Energy. Available online: https://www.esios.ree.es/en/analysis/762?vis=1&start_date=01-01-2019T00%3A00&end_date=31-12-2019T23%3A50&compare_start_date=01-01-2018T00%3A00&groupby=year (accessed on 19 February 2021).
- Red Eléctrica de España. Net Balancing Energy. Available online: https://www.esios.ree.es/en/analysis/762?vis=1&start_date=01-01-2019T00%3A00&end_date=31-12-2019T23%3A50&compare_start_date=01-01-2018T00%3A00&groupby=hour (accessed on 19 February 2021).
Publisher’s Note: MDPI stays neutral with regard to jurisdictional claims in published maps and institutional affiliations. |
© 2021 by the authors. Licensee MDPI, Basel, Switzerland. This article is an open access article distributed under the terms and conditions of the Creative Commons Attribution (CC BY) license (http://creativecommons.org/licenses/by/4.0/).