Abstract
Brazil is currently undergoing changes to regulations on distributed generation (DG), specifically for solar energy micro-generation. The changes proposed by the Brazilian Regulatory Agency suggest that only the cost of energy be compensated to investors. The service costs and other charges related to energy tariffs must be divided among consumers. Investors with existing installations and class entities have contested these proposals, calling them “sun-fees”. To date, no scientific papers have been published discussing these changes. The new regulations propose an end to cross subsidies, where all consumers (even those who do not have DG) pay for the transmission and distribution systems. This study compares the economic feasibility of micro-generation before and after implementing the new standards proposed by the regulatory agency. We used data on average electrical energy demand, energy price, and solar radiation in different regions. The national averages were used as a base comparison with other scenarios. The results show that projects are viable for all analyzed scenarios, however, after implementing the proposed changes, the discounted payback time is extended. This, however, does not make projects unfeasible.
1. Introduction
Fossil fuels are still predominant in energy grids worldwide, and countries have sought out other solutions, to help abate the environmental impacts arising from using fossil fuels; solutions that are more sustainable and energy efficient [1]. Data from the International Energy Agency (IEA) show that renewable energy sources account for only 25% of the total energy consumed worldwide, while fossil fuel and nuclear energy consumption account for 65 and 10%, respectively [2]. Hydroelectric energy corresponds to almost 65% of all energy produced from renewable resources. This justifies inquiry into studying and developing other renewable alternatives.
Information from the European Photovoltaic Industry Association (EPIA) [3], shows that solar photovoltaic energy (PV) and all the technology involved in its generation has progressed and is expected to become the most widely used renewable energy source. Given the positive outlook for solar-PV energy, governments have moved to developing mechanisms, regulations and public policies to encourage investment in this energy source [4].
Until recently, PV energy was used almost exclusively in small islanded systems in Brazil, e.g., on-road applications, or in difficult to access or remote regions. The Brazilian electrical grid does not reach some remote areas since installation lines cannot be installed for both financial and technical reasons.
The National Electric Energy Agency (ANEEL) published a Normative Resolution (REN) N° 482, which determines the appropriate access conditions for micro-generation and mini-generation systems connected to the electrical distribution grid. This resolution was published in July 2012 and defines micro-generation as installations generating up to 75 kW of power, and mini-generation as generating between 75 kW and 1 MW [5]. Additionally, this resolution created an electrical compensation system. ANEEL REN N° 687/2015 [5] provided other advantages to micro and mini generators.
Following REN N° 482, ANEEL launched studies in 2017 to improve this standard, and in 2018 held the first public hearing to gather public opinion on how to improve the standard [5]. In 2019, Public Hearing N° 001/2019 was held to collect subsidies from the Regulatory Impact Analysis (RIA) of the proposed changes [5]. At the end of 2019, Public Hearing N° 025/2019 was held, seeking contributions from society for developing a new REN [5], which was to be published in mid-2020.
Energy tariffs are set considering many factors, such as sectorial charges, energy transportation tariffs, and even electrical losses. These factors have fixed costs regardless of the price of energy and are passed on proportionally according to the consumption levels of all consumers.
According to REN N° 482, consumers who invest in distributed generation (DG) were exempt from charges related to factors such as re-injecting their energy into the network, as this would then later be compensated for. Thus, consumers who did not have DG systems, were financially responsible for bearing the services and charge costs of others. Ideally, these costs should be extended to all consumers [5]. Therefore, ANEEL proposed that only the cost of energy should be compensated for DG investors.
Some authors have shown that increased interest in micro-generation technology is appealing, due to energy savings and cost reductions [6]. Furthermore, it is known that consumers who invest in DG have less expensive energy bills and a positive return on their investment, however, this requires more precise and sophisticated calculations [7]. Micro-generation is also beneficial because it can reduce electrical losses and prevent transmission blockages [8].
Recently, researchers analyzed the risk in investing in renewable energy generation projects (small-scale) using Monte Carlo Simulations (MCS) [9,10,11,12]. Indicators and criteria that test financial viability have been used to assess project performance. Net present value (NPV), the internal rate of return (IRR), and the payback period (PB) have all been key points of interest [13]. The literature shows that several studies have been presented to discuss the viability of PV systems [14,15,16,17].
This study compares the economic feasibility of micro-installations before and after the implementation of ANEEL’s proposed changes. Furthermore, this study also contributes to evaluating the financial impacts caused by proposed regulatory changes. This is important, since changes can make investments economically unfeasible, and discourage new investments in solar PV micro-generation. The proposed changes are scheduled to take effect in 2021, and to the best of our knowledge, there are no studies that have analyzed the impact of these regulatory changes on DG investors.
We have taken average electricity demand, energy prices, and solar radiation data from regions all across Brazil to draw comparisons and to analyze each case considering a national average. Stochastic analysis was conducted using MCS, using the uncertainty variable of installed power for micro-installations to identify the maximum size of a viable plant. Finally, a sensitivity analysis was conducted to identify the economically viable rate of return for PV micro-generation investments.
2. Materials and Method
First, we conducted exploratory research and produced an extensive literature review that focused specifically on normative resolutions from topics and documents obtained from ANEEL, consultations, and public hearings. We then obtained more detailed and accurate information, such as how demand is classified, how costs and prices are determined, the number of solar panels needed, the frequency of the inverters, and all other items needed for installing a micro-central power generation plant.
2.1. Proposed Standard Changes
REN N° 482, published in 2012, created an electric energy compensation system that allowed consumer units invested in micro or mini generation to re-inject surplus generated energy back into the concessionaire’s network, and then later discount the equivalent value from monthly consumption.
The current model in effect allows injected energy to be fully discounted from consumed energy, and thus, all tariff components are considered. Therefore, the energy injected into the network by micro and mini-generation investors ends up being valued by an electricity tariff that is defined for all consumers.
Nowadays, several alternative discussions have been presented on how to make energy injected into the electric grid viable. At the same time, some consumers and concessionaires believe that the current compensation model does not provide remuneration for using the distribution network, thus transferring costs to all users, including those who do not have DG installations. Another point of view states that the current model is necessary to attract consumers interested in micro and mini generation using PV systems, in light of the societal benefits of these systems. One such discussion is found in CP 025/2019 [5].
On the other hand, Normative Resolution N° 482/2012, proposes reducing small renewable installation barriers. The regulations are designed to make this type of investment viable beyond adapting the connection rules. The ultimate goal is to achieve societal benefits for the electricity sector. Alternative 5 in Figure 1 shows the changes proposed by ANEEL. One can see that only 43% of the energy injected back into the grid will be compensated for.
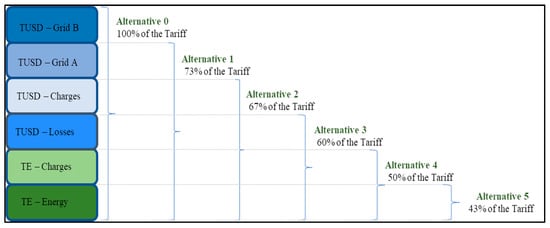
Figure 1.
Tariff alternatives proposed by National Electric Energy Agency (ANEEL). Source: Adapted from CP 025/2019 [5] and Doyle et al. [18].
Where, the TUSD-Grid A and TUSD-Grid B are the unmanaged and directly managed distribution system usage tariffs from the concessionaire company, respectively. TUSD-Charges refer to electrical sector charges, excluding fees and taxes. TUSD-Losses refer to electric and not-electric losses. TE is the electric energy tariff.
2.2. Main Input Variables
(a) Solar Radiation: National Renewable Energy Laboratory (NREL) [19] forecasts increased investments in these energy sources in Brazil due to the large land area of the country, and the high incidence levels of both solar and wind energy. The annual average daily total global solar irradiation reaching Brazil is adequate for generating electric energy [20]. Global radiation in the country is uniform, despite the diverse climatic characteristics found throughout Brazil. The minimum and maximum solar radiation values are 4.25 and 6.5 kWh/m2 per day, respectively. In Brazil, the annual average solar radiation (1500–2500 kWh/m2) in any region is higher than most European countries, where solar resources are better used and implemented with the help of government incentives and policies.
(b) Residential demand: residential demand considers average monthly household consumption, which can also be extrapolated for small businesses or small industries [21]. In this study, these values were obtained based on the average residential demands of different regions in Brazil [5]. A 3.8% per year constant growth level was adopted [22].
(c) Installed power capacity: Studies indicate that mono and polycrystalline silicon panels have the best performance [23]. In this study, a 250 W nominal power unit was used, with a 15.85% efficiency rating and 1.6 m2 of area. The useful life span of the product is 30 years, with a 0.7% efficiency loss per year, as suggested by the manufacturer [24].
One must correctly estimate average consumer demand and average local radiation, and the technical characteristics of PV panels to estimate the necessary power of a PV micro-plant [5]. Nominal power is set so that the unit generates the equivalent of the average annual consumer energy demand. Equation (1) calculates the minimum required area:
where:
AT is the total area of the solar panel set (in m2);
Dm is the average annual demand (in kWh);
Rm is the average annual radiation (in kWh/m2);
ε is the efficiency of the solar panels.
The nominal power of the micro-central unit (Pn) is calculated for each simulation (values in kilowatts). Pn will be the next integer value, calculated using Equation (2).
(d) Electricity consumption tariff: In Brazil, ANEEL is the government agency responsible for calculating and approving electricity tariffs. The tariffs are obtained using variables such as the energy price, the distribution and transmission costs, and sectorial taxes and charges. The values used in this study were collected from historical data from ANEEL [5].
(e) The discount rate (r) is the interest rate that meets investor expectations. We used 8% per year as recommended by Empresa de Pesquisa Energetica (EPE) [25]. MCSs were used to perform a stochastic analysis [26] to analyze the general Brazilian scenario, varying the discount rate by 0.5% per month. The minimum and maximum values used for the discount rate were 6.5 and 20% per year, respectively. The first value came from the savings interest rate in Brazil, while the second value reflects the returns of a high-risk investment in Brazil.
2.3. Initial Investment and Costs
The initial investment was calculated based on a price survey with five retailers that included 51 sizes and types of mini photovoltaic installations from different manufacturers. The estimated investment cost for photovoltaic panels was USD 1630.00 per kilowatt installed. This was done for the frequency inverters, and 20 budgets were provided from the same suppliers. Frequency inverters cost approximately USD 875.00 per kilowatt and constitute about 50% of the total cost of the entire PV plant.
The main equipment and accessory installation generate other costs beyond the initial investment. These are defined in the Homologatory Resolution (REH) 758/2009 [5] issued by ANEEL to approve the Reference Price Bank (BPR).
Equipment maintenance should be carried out every 5 years for cleaning the panels, and every 15 years for changing the stabilizers (SPD) [24]. In this study, we set the maintenance and operational costs at 1% of the initial investment [27].
2.4. Economic Criteria and Indicators
The economic feasibility study seeks to assist in the decision making process for investments [28]. Deterministic economic indicators or criteria are found in several surveys to assist in assessing economic viability.
Deterministic input values such as solar radiation, residential demand, electricity price, the discount rate and nominal power, the result of which will be to estimate NPV, IRR, and the payback (DPB), are all considered in the first analysis of this study. Next, stochastic analysis is implemented, varying the nominal potential and the discount rate (r).
NPV is the most highly recommended indicator or tool for decision making in economic feasibility studies [29]. NPV calculates the present value of future cash flows, considering the difference between input and output cashflows, discounted at a given interest rate. This is shown in Equation (3) [30]:
where:
I is the investment;
C1 to Cn represent the annual cash flows;
n is the number of periods;
r is the discount rate.
NPV must be positive if the investment is to be viable [31].
The internal rate of return (IRR) is found when NPV is equal to zero, as shown in Equation (4) [15]. The IRR must be compared to the interest or discount rate. When the IRR is higher than the reference rate, the investment is viable. Otherwise, if the IRR is less than the discount rate, the investment is unfeasible.
The payback period is another commonly used indicator. The payback period is defined as the time (in years) when cumulative cash flows go positive [16]. We used discounted payback (DPB) in this study, which differs from the traditional method in that future cash flows are brought to date 0, and then compared to the initial in-vestment, as presented in Equations (5) and (6) [32,33]. The purpose is to obtain a shorter return period.
Based on the concept of discounted cash flow (DCF),
Cn is the cash flow in period n;
r indicates the discount rate;
L is the last period with a negative discounted cumulative cash flow;
B is the absolute value of discounted cumulative cash flows at the end of period L;
A is the discounted cash flow during the period after L.
3. Results and Discussion
Brazil is a very large country, ranging from parallel 5.27° north to 33.75° south, and meridian 43.79° to 73.98° west. Furthermore, Brazil has very diverse climatic conditions and human occupations. National electricity demand is divided into 30% residential demand, 35% industrial demand, 19% commercial demand, and 16% other consumer demands [34]. The country has been historically and culturally divided into five geographic regions, as shown in Figure 2 [35]. There are different photovoltaic profiles in Brazil, indicating that the location of a DG solar PV project is essential for ensuring optimal use [36].
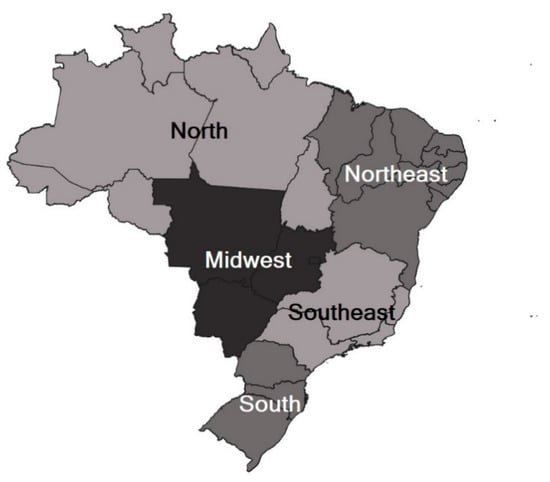
Figure 2.
Brazilian geographic regions.
The north region (NO) is the largest region in Brazil, occupying 45% of the national territory, 90% of which is covered by the Amazon Rainforest. There are two large cities in this region, Manaus and Belém. The region accounts for 6.9% of the national electricity demand, not including islanded systems that supply small cities and villages inside the rainforest (about 3% of national demand). The local demand profile is 29% residential, 41% industrial, and 16% commercial [34,35].
The north-eastern region (NE) is an arid but highly populated region, blessed with good winds and the highest levels of solar radiation in Brazil. It is composed of nine states, and the electricity demand of the region accounts for 17.3% of the national demand. The local demand profile is 35% residential, 27% industrial, and 18% commercial [34,35].
The mid-western (CW) region has an economy predominantly based on agrobusiness. It is the second largest region in Brazil, but is the least populated region. The largest city is Brasília, the capital of Brazil. The electrical demand of the region is 8% of the national demand. The local demand profile is 33% residential, 25% industrial, and 20% commercial [34,35].
The south-eastern (SE) region contains the large cities São Paulo, Rio de Janeiro, and Belo Horizonte, and is the most developed and most populous region in Brazil. This region alone is responsible for almost half (49.4%) of the national electricity demand. The local demand profile is 29% residential, 35% industrial, and 20% commercial [34,35].
The south region (SO) is the smallest region in the country, but is very populous and well developed. It has the second largest electricity demand, 18.4% of the total national demand. The local demand profile is 26% residential, 38% industrial, and 17% commercial [34,35].
Using current regulation and starting in 2019, this discussion begins with a deterministic analysis of each of the five Brazilian geographic regions. The 2019 regulations state that all energy produced and injected into the grid will be fully offset (100%). It is understood then that each 1 kWh injected into the grid is equal to 1 kWh consumed. Table 1 presents the base results for each of the five regions, followed by the national case (BR). In Table 1, AR is the average solar radiation (kWh/m2), AD is the average demand (kWh), and ET is the electricity tariff (USD).

Table 1.
Deterministic results before the change proposed by ANEEL.
If ANEEL’s new proposal is approved and enforced, one must remember that only the cost of energy will be compensated for, i.e., 43% of the tariff. Thus, the calculations are more complex and require more attention, since one must consider the energy generated and consumed by the investor, without considering the energy injected into the grid. The 43% value only includes energy that is subsequently injected and consumed, i.e., using the distribution grid.
Figure 3 was elaborated on using data obtained from ANEEL [5]. The highlighted area “A” in the Figure represents the annual average of electric energy produced and consumed. The concept of a “prosumer” (producer–consumer) was not widespread at that time in the Brazilian electric sector (2019), and so we used the average annual demand.
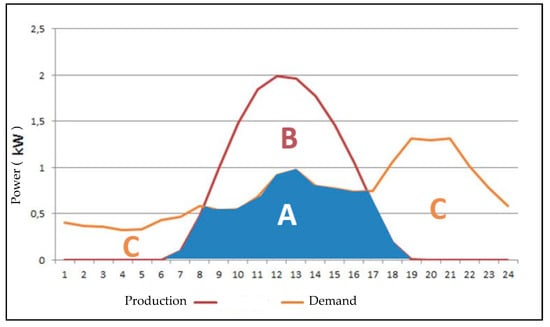
Figure 3.
Average generation and consumption curves (in days) for the Brazilian scenario. Source: CP 025/2019 [5].
Only area “B” was considered for the economic feasibility study (see Figure 3), i.e., 43% of the amount injected into the network, and subsequently compensated for. According to REN 482/2012 [5], area “C” represents the network consumption, which can be offset by the electric energy produced and injected into the distribution grid. The availability cost (CA) in area “C” must be subtracted.
The CA is the minimum value of the regulatory charge (take-or-pay), equivalent to 30 kWh/month of consumption [5]. Table 2 shows three different situations that must be treated differently (either with or without reductions of 43%). In this table, credits refer to energy credits obtained in previous periods, while the other variables have already been presented in Figure 3.

Table 2.
Hypothesis with and without reductions to 43%, as proposed by ANEEL.
The integral of area “A” in Figure 3 corresponds to 42.86% consumption and 54.33% electricity generation. Area “C” corresponds to 57.14% consumption. Finally, area “B” corresponds to 45.67% of the total energy generated by PV installations. Considering the national production and demand average, 36.03% consumption will be offset by surplus production, and 21.11% will be consumed by other utilities connected to the grid.
Table 2 presents the third hypothesis for the cases based on this information and the proposed changes by ANEEL (subsidy reduction to 43%). Table 3 presents the deterministic results for the scenario after implementing the proposed changes.

Table 3.
Deterministic results after the change proposed by ANEEL.
The results presented in Table 1 and Table 3 were obtained using NPV and IRR, and indicate that micro or mini distributed generation is viable for all Brazilian regions. However, the DPB indicates that more time is needed to re-cover the investment, and this may discourage DG investors.
It is important to note that the investment recoup time goes from 8 to 12 years with the 43% reduction (change to regulation) for the entire Brazilian scenario (BR). Another fact worth highlighting is that the DPB time is very close to when operation and maintenance (O&M) costs kick in, requiring new investments, because the inverters must be changed.
We conducted stochastic feasibility studies assuming that there are different consumption profiles and that investors can seek financial returns generating more or less energy than their individual consumption. We used MCSs performed in the Crystal Ball® tool. This analysis studied the hypotheses presented in Table 2 and verified how much the relationship between generation and consumption in the distribution network can be increased or decreased, seeking to obtain a viable investment.
Determining the probability density function (PDF) for the entry of the random variable model is an essential step in the MSC [9]. The PDF of a project is given via Equation (7) [37,38]:
where:
PNPV characterizes the accumulated probability of NPVs;
pdf (NPV) represents the PDF of NPV in some proposition (NPV);
Pn is the random variable.
In this study, the PDFs were linear functions, changing energy production from 0.5 to 2 times the national average, varying the discount rate from 6.5 to 20%.
Figure 4, Figure 5, Figure 6, Figure 7, Figure 8 and Figure 9 show the results of the stochastic analysis for economic viability. The probability of NPV viability is found when subjected to a variation 0.5 to 2 times the generation capacity studied in the deterministic analysis (variation in the relationship between generation and consumption from 40 to 160%). We highlight that the extremes can become unviable, since the costs for micro-generation (small-scale) can result in a negative NPV, and excess produced energy is not compensated by large-scale PV plants. This is because remote generation and consumption were not evaluated in this study. When considering remote consumption, as outlined by REN N° 687/2015, the attractiveness of the projects reduces, as this type of consumption increases. This can be addressed by future studies.
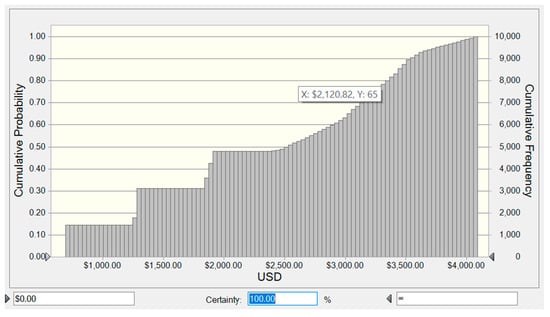
Figure 4.
Stochastic results of net present value (NPV) in the NO region.
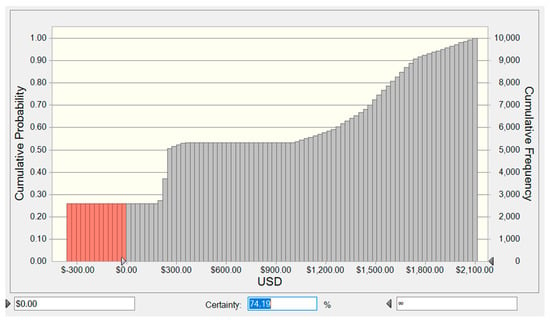
Figure 5.
Stochastic results of NPV in the NE region.
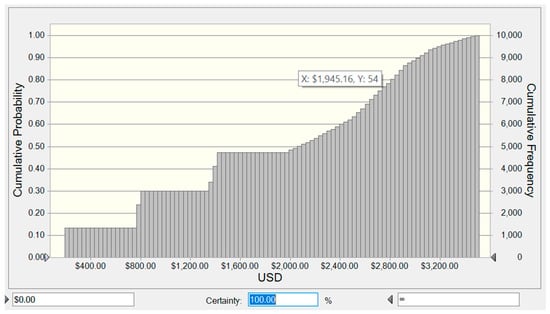
Figure 6.
Stochastic results of NPV in the CW region.
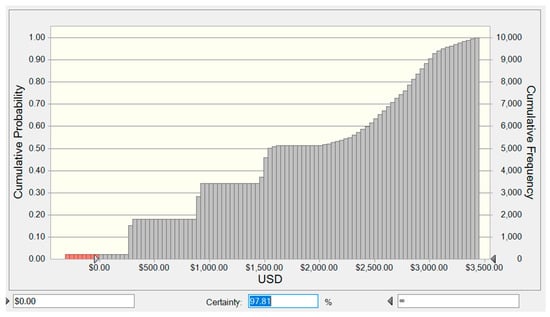
Figure 7.
Stochastic results of NPV in the SE region.
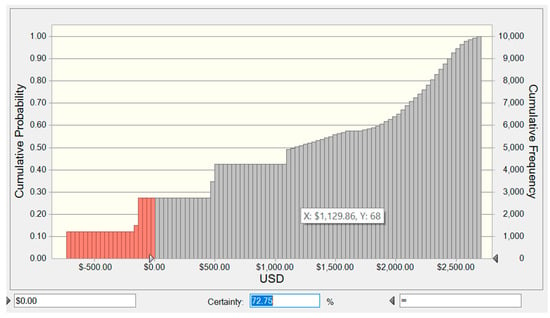
Figure 8.
Stochastic results of NPV in the SO region.
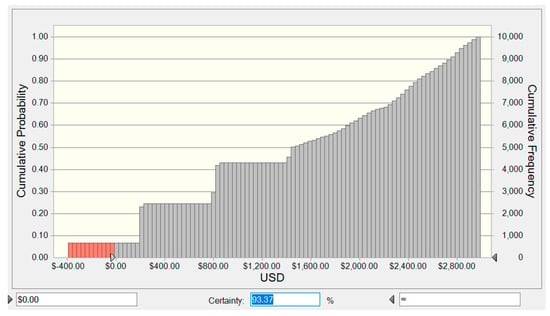
Figure 9.
Stochastic results of NPV for the Brazilian scenario.
The results indicate that the northern (NO) is the best region for investing in residential micro-generation, even though this region has the lowest radiation averages in the country. This is mainly due to the high demand and price paid for electricity in this region. However, it is known that these variables are not stable over time, since they depend on governmental policies and consumer behavior. The results indicate that investments in residential PV micro-generation are less attractive in the north-eastern (NE) region where there is low demand and prices, despite the high incidence of solar radiation there.
Another stochastic analysis was carried out, varying the discount rate between 6.5 to 20% for the Brazilian scenario (BR) characterized by average prices, solar radiation, and demand in the country. The objective of the study was to carry out a sensitivity analysis and to identify the range of the rate of return in which investments in PV micro-generation are still viable. Figure 10 presents the results of this simulation. The probability of viability is 77.48%.
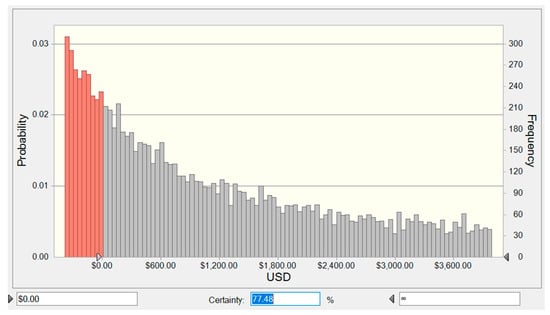
Figure 10.
Stochastic results of NPV for a variation of the discount rate in the Brazilian scenario.
It is clear that the changes proposed by ANEEL seek to promote greater tariff equality, since whoever accesses the electric grid should pay for using it. We believe that regional and state governments should consider other ways to subsidize this energy source, by drawing on the experience of other countries that have already subsidized RES. This should be done to provide a framework for sustainable growth and development in the Brazilian electrical sector.
4. Conclusions
This article sought to conduct economic feasibility studies for different Brazilian geographic regions, in light of changes proposed by ANEEL. The before and after scenarios were evaluated via deterministic analyses using NPV, IRR and DPB. Subsequently, stochastic studies were carried out for each of the Brazilian regions using the MCSs. Finally, the Brazilian national scenario was studied by varying the discount rate.
The NPV results indicate that micro or mini distributed generation is viable for all Brazilian regions. However, other criteria and indicators were used, such as IRR and DPB. The results are viable when evaluating using IRR. The results for DPB show that there will be longer investment recoup times after regulatory changes.
If the changes proposed by the regulatory agency are approved, we believe there will be a significant reduction in the attractiveness of residential PV micro-generation. The results show that the increased payback time discourages investors seeking investments with faster returns, even though the investments are still feasible, and despite the fact that each real case has its own particularities, and each case must be carefully analyzed.
Varying the installed power from 50% to 2Xs, the relationship between demand and generation varies from 0.4 to 1.6. Thus, the project is not attractive at both extremes. The fixed micro-generation investment costs can result in a negative NPV and surplus generation, which are not compensated for at a large-scale plant.
The sensitivity analysis varying the discount rate shows that there is a greater than 77% probability for positive NPVs, but we understand that only extremely conservative investors may stay out of the PV micro-generation market in Brazil.
The results of this study show that ANEEL can implement these regulatory changes, designed to prevent cross-subsidies, by equally taxing all users of the grid and promoting greater tariff equality. However, this must be done in a way that does not discourage investments in DG solar PV.
Author Contributions
Conceptualization, G.N.D.d.D., P.R.J., P.F.G.C. and R.S.P.; methodology, G.N.D.d.D., P.F.G.C., R.S.P. and L.C.S.R.; software, G.N.D.d.D., P.F.G.C. and R.S.P.; validation, G.N.D.d.D. and G.A.; formal analysis, G.N.D.d.D., P.R.J. and P.F.G.C.; investigation, G.N.D.d.D., and P.F.G.C.; resources, P.R.J.; data curation, G.N.D.d.D. and P.F.G.C.; writing—original draft preparation, G.N.D.d.D., P.R.J. and G.A.; writing—review and editing L.C.S.R., K.J. and G.A.; visualization, G.N.D.d.D. and P.R.J.; supervision, P.R.J., R.S.P., L.C.S.R. and K.J.; project administration, G.N.D.d.D., P.R.J. and L.C.S.R.; funding acquisition, P.R.J. and K.J. All authors have read and agreed to the published version of the manuscript.
Funding
The APC was funded by the Faculty of Finance and Accounting of Prague University of Economics and Business—Czech Republic.
Data Availability Statement
Not applicable.
Acknowledgments
The authors would like to thank the Czech Science Foundation—Czech Republic (grant number 19-26812X) for the financial support and research incentive. The authors also thank the Coordination for the Improvement of Higher Education Personnel—Capes Brazil (Process PVEX-88881.337019/2019-01), the Brazilian National Council for Scientific and Technological Development—CNPq Brazil (Processes 406769/2018-4, 308021/2019-3, 302751/2020-3, and 303909/2020-0), and the National School of Public Administration—ENAP Brazil (Process 04600.003102/2020-21).
Conflicts of Interest
The authors declare that there are no conflicts of interest regarding the publication of this paper.
References
- Wesseh, P.K.; Lin, B. A real options valuation of Chinese wind energy technologies for power generation: Do benefits from the feed-in tariffs outweigh costs? J. Clean. Prod. 2016, 112, 1591–1599. [Google Scholar] [CrossRef]
- International Energy Agency. IEA Energy Atlas; International Energy Agency: Paris, France, 2018. [Google Scholar]
- EPIA—European Photovoltaic Industry Association. Global Market Outlook for Photovoltaics Util; EPIA: El Paso, TX, USA, 2016. [Google Scholar]
- Duman, A.C.; Güler, Ö. Economic analysis of grid-connected residential rooftop PV systems in Turkey. Renew. Energy 2020, 148, 697–711. [Google Scholar] [CrossRef]
- ANEEL-National Electricity Agency. Available online: http://www.aneel.gov.br (accessed on 1 August 2020).
- Rocha, L.C.S.; Aquila, G.; Junior, P.R.; de Paiva, A.P.; de Oliveira Pamplona, E.; Balestrassi, P.P. A stochastic economic viability analysis of residential wind power generation in Brazil. Renew. Sustain. Energy Rev. 2018, 90, 412–419. [Google Scholar] [CrossRef]
- Walters, R.; Walsh, P.R. Examining the financial performance of micro-generation wind projects and the subsidy effect of feed-in tariffs for urban locations in the United Kingdom. Energy Policy 2011, 39, 5167–5181. [Google Scholar] [CrossRef]
- Bayod-Rújula, A.A. Future development of the electricity systems with distributed generation. Energy 2009, 34, 377–383. [Google Scholar] [CrossRef]
- Arnold, U.; Yildiz, Ö. Economic risk analysis of decentralized renewable energy infrastructures-A Monte Carlo Simulation approach. Renew. Energy 2015, 77, 227–239. [Google Scholar] [CrossRef]
- Tudisca, S.; Di Trapani, A.M.; Sgroi, F.; Testa, R.; Squatrito, R. Economic analysis of PV systems on buildings in Sicilian farms. Renew. Sustain. Energy Rev. 2013, 28, 691–701. [Google Scholar] [CrossRef]
- Aquila, G.; de Queiroz, A.R.; Balestrassi, P.P.; Rotella Junior, P.; Rocha, L.C.S.; Pamplona, E.O.; Nakamura, W.T. Wind energy investments facing uncertainties in the Brazilian electricity spot market: A real options approach. Sustain. Energy Technol. Assess. 2020, 42, 100876. [Google Scholar] [CrossRef]
- Rotela Junior, P.; Fischetti, E.; Araújo, V.G.; Peruchi, R.S.; Aquila, G.; Rocha, L.C.S.; Lacerda, L.S. Wind power economic feasibility under uncertainty and the application of ANN in sensitivity analysis. Energies 2019, 12, 2281. [Google Scholar] [CrossRef]
- Hawawini, G.; Viallet, C. Finanças Para Executivos: Gestão Para Criação de Valor, 3rd ed.; Cengage: São Paulo, Brazil, 2010. [Google Scholar]
- Thevenard, D.; Pelland, S. Estimating the uncertainty in long-term photovoltaic yield predictions. Sol. Energy 2013, 91, 432–445. [Google Scholar] [CrossRef]
- Rodrigues, S.; Chen, X.; Morgado-Dias, F. Economic analysis of photovoltaic systems for the residential market under China’s new regulation. Energy Policy 2017, 101, 467–472. [Google Scholar] [CrossRef]
- Tao, J.Y.; Finenko, A. Moving beyond LCOE: Impact of various financing methods on PV profitability for SIDS. Energy Policy 2016, 98, 749–758. [Google Scholar] [CrossRef]
- Bendato, I.; Cassettari, L.; Mosca, R.; Williams, E.; Mosca, M. A stochastic methodology to evaluate the optimal multi-site investment solution for photovoltaic plants. J. Clean. Prod. 2017, 151, 526–536. [Google Scholar] [CrossRef]
- De Doile, G.N.D.; Junior, P.R.; Carneiro, P.F.G.; Peruchi, R.S. Economic Feasibility of Photovoltaic Micro-Plants Connected to the Brazilian Distribution Grid Facing the Regulation Changes Proposed. In Proceedings of the 2020 55th International Universities Power Engineering Conference, Torino, Italy, 1–4 September 2020. [Google Scholar] [CrossRef]
- National Renewable Energy Laboratory NREL. SWERA Project; NREL: Golden, CO, USA, 2014. [Google Scholar]
- Pereira, E.B.; Martins, F.R.; De Abreu, S.L.; Rüther, R. Brazilian Atlas of Solar Energy; INPE: São José dos Campos, SP, Brazil, 2006. [Google Scholar]
- Silva, N.; Feres, J.G.; Lírio, V. Análise da Estrutura da Demanda de Energia Elétrica Residencial segundo os Quantis de Consumo. Radar Tecnologia Produção e Comércio Exterior 2012, 22, 57–63. [Google Scholar]
- EPE-Empresa de Pesquisa Energetica. Estudos da Demanda: Ano base 2017. NOTA TÉCNICA DEA 001/2017-Projeção da Demanda de Energia Elétrica; Empresa de Pesquisa Energetica: Rio de Janeiro, Brazil, 2017. [Google Scholar]
- de Azevedo Dias, C.L.; Branco, D.A.C.; Arouca, M.C.; Legey, L.F.L. Performance estimation of photovoltaic technologies in Brazil. Renew. Energy 2017, 114, 367–375. [Google Scholar] [CrossRef]
- de Oliveira Azevêdo, R.; Rotela Junior, P.; Rocha, L.C.S.; Chicco, G.; Aquila, G.; Peruchi, R.S. Identification and Analysis of Impact Factors on the Economic Feasibility of Photovoltaic Energy Investments. Sustainability 2020, 12, 7173. [Google Scholar] [CrossRef]
- EPE-Empresa de Pesquisa Energetica. NOTA TÉCNICA DEA 016/2019-Modelo de Mercado da Micro e Minigeração Distribuída (4MD): Metodologia–Versão PDE 2029; Empresa de Pesquisa Energetica: Rio de Janeiro, Brazil, 2019. [Google Scholar]
- Fonseca, M.N.; de Oliveira Pamplona, E.; de Mello Valerio, V.E.; Aquila, G.; Rocha, L.C.S.; Junior, P.R. Oil price volatility: A real option valuation approach in an African oil field. J. Pet. Sci. Eng. 2017, 150, 297–304. [Google Scholar] [CrossRef]
- de Oliveira Azevêdo, R.; Rotela Junior, P.; Chicco, G.; Aquila, G.; Souza Rocha, L.C.; Santana Peruchi, R. Identification and analysis of impact factors on the economic feasibility of wind energy investments. Int. J. Energy Res. 2021, 45, 3671–3697. [Google Scholar] [CrossRef]
- Rocha, L.C.S.; Aquila, G.; de Oliveira Pamplona, E.; de Paiva, A.P.; Chieregatti, B.G.; Lima, J.D.S.B. Photovoltaic electricity production in Brazil: A stochastic economic viability analysis for small systems in the face of net metering and tax incentives. J. Clean. Prod. 2017, 168, 1448–1462. [Google Scholar] [CrossRef]
- Li, C.B.; Lu, G.S.; Wu, S. The investment risk analysis of wind power project in China. Renew. Energy 2013, 50, 481–487. [Google Scholar] [CrossRef]
- Lacerda, L.S.; Junior, P.R.; Peruchi, R.S.; Chicco, G.; Rocha, L.C.S.; Aquila, G.; Junior, L.M.C. Microgeneration of Wind Energy for Micro and Small Businesses: Application of ANN in Sensitivity Analysis for Stochastic Economic Feasibility. IEEE Access 2020, 8, 73931–73946. [Google Scholar] [CrossRef]
- Koutroulis, E.; Kolokotsa, D.; Stravrakakis, G. Optimal design and economic evaluation of a battery energy storage system for the maximization of the energy generated by wind farms in isolated electric grids. Wind Eng. 2009, 33, 55–81. [Google Scholar] [CrossRef]
- Fathima, H.; Palanisamy, K. Optimized Sizing, Selection, and Economic Analysis of Battery Energy Storage for Grid-Connected Wind-PV Hybrid System. Model. Simul. Eng. 2015, 2015. [Google Scholar] [CrossRef]
- Li, M.-J.; Zhao, W.; Chen, X.; Tao, W.-Q. Economic analysis of a new class of vanadium redox-flow battery for medium- and large-scale energy storage in commercial applications with renewable energy. Appl. Therm. Eng. 2017, 114, 802–814. [Google Scholar] [CrossRef]
- EPE. Empresa de Pesquisa Energetica Statistical Yearbook of Electricity 2019 Baseline Year. 2020. Available online: http://shinyepe.brazilsouth.cloudapp.azure.com:3838/anuario/ (accessed on 1 August 2020).
- IBGE. Instituto Brasileiro de Geografia e Estatística Brazilian Institute of Geography and Statistics. 2021. Available online: https://www.ibge.gov.br/ (accessed on 1 August 2020).
- Aquila, G.; Souza Rocha, L.C.; de Oliveira Pamplona, E.; de Queiroz, A.R.; Rotela Junior, P.; Balestrassi, P.P.; Fonseca, M.N. Proposed method for contracting of wind-photovoltaic projects connected to the Brazilian electric system using multiobjective programming. Renew. Sustain. Energy Rev. 2018, 97, 377–389. [Google Scholar] [CrossRef]
- Aquila, G.; de Queiroz, A.R.; Junior, P.R.; Rocha, L.C.S.; de Oliveira Pamplona, E.; Balestrassi, P.P. Contribution for bidding of wind-photovoltaic on grid farms based on NBI-EFA-SNR method. Sustain. Energy Technol. Assess. 2020, 40, 100754. [Google Scholar] [CrossRef]
- Aquila, G.; Rotela Junior, P.; de Oliveira Pamplona, E.; de Queiroz, A.R. Wind power feasibility analysis under uncertainty in the Brazilian electricity market. Energy Econ. 2017, 65, 127–136. [Google Scholar] [CrossRef]
Publisher’s Note: MDPI stays neutral with regard to jurisdictional claims in published maps and institutional affiliations. |
© 2021 by the authors. Licensee MDPI, Basel, Switzerland. This article is an open access article distributed under the terms and conditions of the Creative Commons Attribution (CC BY) license (http://creativecommons.org/licenses/by/4.0/).