Abstract
In this paper, a digital hydraulic variable control method based on multi-way valve spool displacement feedback is proposed, which combines the advantages of low cost and high reliability of the loader fixed displacement pump hydraulic system, and the distinguished energy saving effect of the loader variable pump hydraulic system. Based on the principle of hydraulic resistance, the mathematical model of flow-pressure of multi-way valve was established. Meanwhile, the theoretical structure of a valve spool suitable for digital hydraulic system was deduced. On this basis, an improvement scheme of the valve spool was proposed in combination with machining feasibility. The simulation model of multi-way valve was established, the correctness of which was verified by experiment with the significance test method, and the valve port parameters of the multi-way valve were optimized by genetic algorithm. The simulation model before and after optimization was analyzed by AMESim software. The simulation results showed that the digital hydraulic system can basically realize the function of a variable system, and the energy consumption was significantly reduced compared with the fixed displacement pump hydraulic system. The optimized valve spool structure of the digital hydraulic system had more stable load characteristics than the fixed displacement pump system and a larger speed range. The increase range accounts for about 27% of the total stroke.
1. Introduction
Compared to passenger vehicles, construction machinery is commercial operation equipment that is much more concerned with system cost and energy saving than performance and comfort. Therefore, researchers at home and abroad have focused more on system configuration and energy saving characteristics [1].
The construction machinery hydraulic system control methods such as fixed displacement pump systems or multi-way valve hydraulic systems occupy a certain market with its cost advantage [2], however, due to the inevitable massive throttling and overflow losses, it does not meet the trend of energy saving and will eventually be eliminated. The cost of the load sensing system, positive flow system, and negative flow system is more than five times higher than that of a fixed displacement pump system. At the same time, the complex system and high maintenance difficulty also limit its application fields and application models.
The digital hydraulic system is a new technology to obtain system variable output through real-time control of discrete hydraulic components [3]. Compared with traditional hydraulic variable control technology, the digital hydraulic system has the advantages of low cost, high response, easy control, high efficiency, and high reliability [4,5,6]. In recent years, it has been of wide interest to the hydraulic industry [7,8], and has gradually began to be applied to large equipment such as loaders [9] and excavators [10,11].The parallel digital hydraulic technology uses the logical combination of hydraulic components to control, which has lower requirements for system hardware, better energy saving effect, and higher reliability. Linjama et al. [12] carried out the digital transformation on the hydraulic system of a wheel excavator working device, compared with the original load sensing system with the digital valve control hydraulic cylinder system of inlet and outlet regulation. The experiment showed that under the specific cycle conditions, the energy input of the digital valve control system could be reduced by 36%. Danfoss has launched a digital hydraulic pump with independent control of the piston chamber [13,14], but the pressure and flow fluctuate greatly when the displacement is small. Liu Xin-hui et al. used several gear pumps and on–off valves to form a pump control system, which could achieve torque and flow control [15]. This shows that a group of parallel digital pumps can realize multi-load collaborative control within a certain range, which has great application potential in construction machinery [16].
Considering the system cost and control characteristics, a digital variable control method based on multi-way valve spool displacement feedback was proposed by combining the multi-way valve system with a parallel digital pump. As the multi-way valve of a fixed displacement pump system is based on the control principle of liquid resistance shunt, only when the flow is stable can the sufficient working pressure be established and the flow distribution be realized. Therefore, it is necessary to change the liquid resistance characteristics of the multi-way valve spool. The performance of the valve can be improved by properly changing the opening of the valve port and the geometry of the throttling groove [17,18]. Yue Hong et al. [19] established a static mathematical model of a multi-way valve, which provides theoretical guidance for further research on the characteristics of a multi-way valve. Zhang Ji-Huan [20] analyzed the specific structural parameters of the multi-way valve and established a simulation model of the multi-way valve to study the influence of the spool displacement of a multi-way valve on the speed characteristics of the actuator. Chen Jin-shi [21] carried out research on several typical throttle port structures, deduced calculation formulas of several typical throttle orifice areas, and elaborated the influence of different types of valve ports on the dynamic performance of the system to provide certain reference for the reasonable selection of throttle port. Amirante R. et al. [22] studied and analyzed the valve port area of the open middle multi-way valve, and gave the theoretical calculation formula. According to computational fluid dynamics, Ramesh M. D. et al. [23] improved the multi-way valve based on computational fluid dynamics. Hopf H. J. et al. [24] introduced a multi-way valve with a special structure and its manufacturing method. Jia Xue-feng [25] optimized the matching characteristics of a multi-way valve and pilot valve by changing the structural parameters of a multi-way valve spool. However, the trial and error method of changing a single parameter was not conducive to improving work efficiency and optimization accuracy. Traditional methods are becoming less and less able to meet the requirements. It has become a trend to use more scientific and efficient intelligent optimization algorithms for research. Hu Shu-wei [26] used MATLAB script files to optimize the parameters of the multi-way valve, which broadened the matching interval between the pilot valve and the multi-way valve. For the purpose of precise pressure control, Li Wei [27] used genetic algorithm to optimize the design of the pressure regulator with multiple parameters, and obtained the optimal structural parameters. Li Jing et al. [28,29] used the APSO (adaptive weight particle swarm optimization) algorithm to optimize the structure of the traditional on–off valve, which improved the controllable range of the on–off valve. Li Sheng-yong [30] improved the pressure-flow characteristics of the check valve through NLPQL (sequential quadratic programming algorithm) optimization. These studies provide references for the improvement of the multi-way valve.
Compared with existing research literature, the main contributions of this study are as follows. (1) Combined with the advantages of low cost and high reliability of the loader fixed displacement pump hydraulic system, and the distinguished energy saving effect of the loader variable pump hydraulic system, a digital hydraulic variable control method based on a multi-way valve spool displacement feedback was proposed. (2) Based on the principle of liquid resistance, the flow pressure mathematical model of a multi-way valve was established, and the theoretical structure of the valve spool suitable for a digital hydraulic system was deduced. On this basis, combined with the machining feasibility, the improvement scheme of valve spool was proposed. (3) The simulation model of a multi-way valve was established, the correctness of which was proved by experiments with the significance test method, and the valve port parameters of the multi-way valve were optimized by genetic algorithm. AMESim software was used to analyze the simulation model before and after optimization. The rest of this paper is arranged as follows. Section 2 briefly introduces the working principle of the system and analyzes the liquid resistance of the valve port. Section 3 builds the simulation model and carries out the experimental verification. Section 4 optimizes the valve port structural parameters. Section 5 carries out the simulation of the comparative analysis on the results before and after optimization. Section 6 presents some conclusions.
2. Structure of Digital Hydraulic System
2.1. Working Principle of the Digital Hydraulic System
The configuration of the digital hydraulic system is shown in Figure 1. The main body includes the digital pump and control valve groups. The digital pump was composed of a plurality of gear pumps in coaxial series. The control valve groups were composed of a check valve group and an electromagnetic unloading valve group. The outlet of each gear pump is in parallel with a check valve and an electromagnetic unloading valve. When the electromagnetic unloading valve at the pump outlet loses power, the corresponding pump is connected to the system through the check valve, and the working state is “1”. Otherwise, the working status is “0”. By controlling the different combination states of the electromagnetic unloading valve to control the combination of hydraulic pumps participating in the working of the system to achieve digital change in displacement.
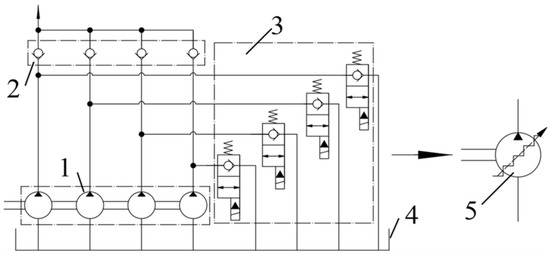
Figure 1.
Configuration of digital hydraulic system; 1—Digital pump; 2—Check valve block; 3—Electromagnetic unloading valve block; 4—Tank; 5—Contracted notation of digital pump.
The displacement of the digital pump at each level is expressed as Di, then the displacement of the digital pump unit and the combined displacement of the digital pump can be expressed as:
where Di is the displacement of digital pump at each level, mL/r; D represents the combined displacement, mL/r; n is the combination series; ai represents the working state of the digital pump, which is ai = 1 when working as pump, or ai = 0 when idle rotating; and bi is the control mode coefficient. In order to keep the variable fitting resolution constant, the control mode coefficient is bi = 2, then there is Di+1 = 2Di (i.e., Dn = D12n−1). The effective displacement of the system can be taken within the range from 0~ (2n − 1) D1 with the step distance D1 and the variable series 2n.
The number of stages of the digital pump in this prototype is taken as 4, then the combined displacement of the digital pump is D = a1D1 + a2D2 + a3D3 + a4D4, where there are 16 combinations of displacements, according to the system speed requirements and combined with the engine speed to match the required digital pump displacement of the system. The combination form of pump displacement and its control matrix are as follows:
2.2. Working Principle of Loader Digital Hydraulic System
Figure 2 shows the hydraulic schematic diagram of the digital hydraulic working device of the loader, mainly including the digital pump, multi-way valve, hydraulic cylinder, etc. The driver’s operating handle changes the oil circuit of the pilot valve, and then changes the position of the multi-way valve spool. The digital pump changes the flow output according to the valve spool displacement to supply oil for the boom hydraulic cylinder or rotary bucket hydraulic cylinder. When the working device does not work, the digital pump flows back to the oil tank through the electromagnetic unloading valve block. When the outlet pressure of the pump reaches the safety pressure, the minimum displacement is adjusted in the digital pump to maintain the system pressure, and the overflow loss is less.
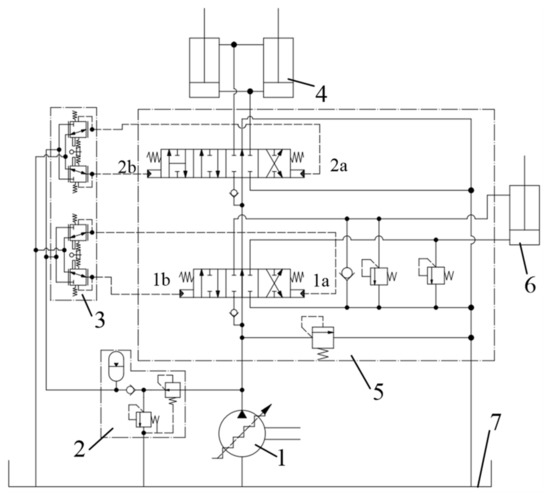
Figure 2.
Digital hydraulic schematic diagram of working device of loader; 1—Digital pump; 2—Oil source valve; 3—Pilot valve; 4—Boom cylinder; 5—Multi-way valve; 6—Bucket cylinder; 7—Tank.
2.3. Structure and Principle of Multi-Way Valve
Multi-way valve is the key component of flow control in a hydraulic system of the working device of the loader. Figure 2 shows a typical double multi-way valve from Port P to Port T, which is the bucket linkage and boom linkage. The boom linkage controls the lifting, falling, and floating of the loader boom, and the bucket linkage controls the turnover of the bucket. The mathematical model of the multi-way valve is established by neglecting the factors that have little influence on the system performance such as pipeline loss, internal leakage, and friction. The force balance equation of a multi-way valve spool is as follows:
where is the pilot pressure, MPa; denotes the spool diameter, mm; represents the spring stiffness, N/mm; is spool displacement, mm; represents the spring pre-compression, mm; and denotes flow force, N.
The relationship between the pilot pressure and spool displacement of the multi-way valve is obtained by (2):
The system flow is:
where denotes the flow of the pump; is the speed; represents the leakage factor; is the pump outlet pressure; denotes the volume of the pump high pressure oil chamber; and represents the volume elasticity modulus of oil.
In order to further analyze the characteristics of the system, taking the boom rising as an example, the schematic diagram of equivalent damping as shown in Figure 3 was obtained according to the structure and working principle of the multi-way valve. When the multi-way valve is in the speed regulation section, Port P is connected with Port A and Port T at the same time. The principle of speed regulation is by-pass throttling. The system flow is distributed according to the liquid resistance ratio of PA and PT channels through the Port P of the multi-way valve, and the liquid resistance of the PA, PT, and BT channels is a linkage relationship.
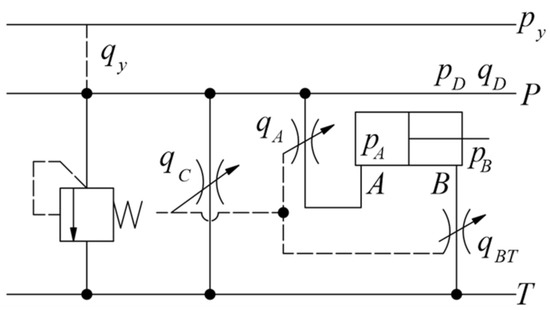
Figure 3.
Schematic diagram of equivalent damping.
The pressure and flow equations of the flow through the PA and PT channels are as follows:
Ideally, the flow satisfies the flow continuity equation:
By differentiating the two ends of Equations (5) and (6), the liquid resistance of PA and PT channels can be obtained as follows:
where is the flow from A port of the multi-way valve; is the middle return oil flow of the multi-way valve; is the flow area of PA; is the flow area of PT; is the hydraulic oil density; is the load pressure; is the middle return oil back pressure, here the value is 0; is the flow coefficient; is the liquid resistance of PA; and is the liquid resistance of PT.
Based on the above formulas, the flow through Port A of the multi-way valve can be expressed as:
It can be seen that the output of the system is affected by , but x is determined by the pilot pressure of the pilot handle, and is determined by the load. Therefore, the flow area of the multi-way valve port and the system flow are the key factors affecting the output.
As the main part of the working device of a loader, the energy loss of a multi-way valve is the main part of system energy consumption. The main valve spool is equivalent to a variable throttle in engineering, and the power loss is mainly throttling loss. The throttling loss can be expressed as:
where is the throttling loss, kW.
In the fixed displacement pump hydraulic system, when the system pressure reaches the relief pressure of the safety valve, there is overflow loss, which can be expressed as follows:
where is overflow loss, kW; is the relief pressure of the safety valve, MPa; and is overflow flow, .
When the outlet pressure of the pump reaches the safety pressure, the minimum displacement is adjusted in the digital pump to maintain the system pressure, and the overflow loss is less. The analysis showed that when the main valve is in the speed regulation stage, under the premise of satisfying the system operation, the energy-saving direction is to reduce the system oil supply as far as possible, reduce the by-pass return oil, and increase the flow into the working chamber under the premise of meeting the system work.
2.4. Flow Distribution and Liquid Resistance Analysis
In order to make the loader distribute the flow of the digital pump reasonably under the condition of variable speed and load, and achieve the purpose of energy saving and consumption reduction, it is necessary to dynamically match the displacement range of the multi-valve spool and the flow of the digital pump. In order to facilitate the follow-up study, 16, 25, 40, and 80 mL/r in the actual combination unit were analyzed. Take the boom rising as an example, that is, the valve spool moves to the left, and the effective displacement of the valve spool is 4.5–15 mm. According to the effective combination of digital pump units, the valve spool displacement can be divided into 12 sections for matching. As shown in Figure 4, the ordinate is the digital pump flow, and the abscissa is the spool displacement. It is assumed that the driver’s operation intention corresponds to the spool displacement, that is, small displacement with small flow, and large displacement with large flow. As the multi-way valve is based on the control principle of liquid resistance shunt, only when the flow is stable can the sufficient working pressure be established and the flow distribution can be realized. When the digital pump displacement is small, the load pressure will be difficult to establish. Therefore, it is necessary to change the liquid resistance characteristics of the multi-way valve spool.
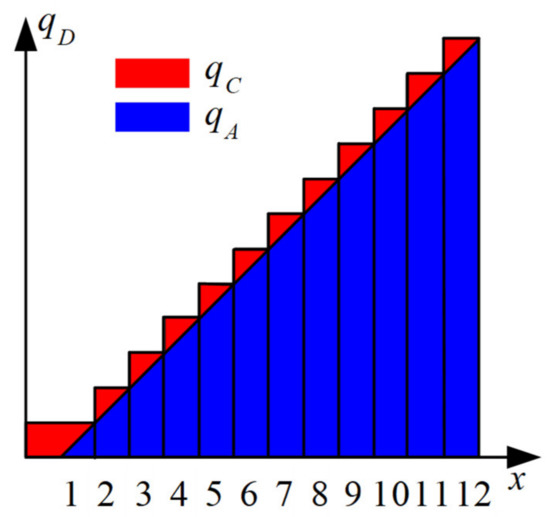
Figure 4.
Flow distribution diagram.
The minimum necessary conditions for the system to establish pressure are as follows:
Equation (12) can be transformed into (13) and (14).
It can be seen from Equations (13) and (14) that properly reducing the flow area of can not only improve the load capacity of the system, but also increase the throttling pressure loss of the by-pass.
The output flow of the pump jumps once at the beginning of each displacement. When the displacement of the valve spool is within the dead zone, the liquid resistance at the PT port is small, and the pump outlet flow is all returned to the oil tank through the PT port. When the valve spool displacement enters the speed regulation section, in order to make the speed regulation process smoother, the multi-way valve output flow should be closer to the continuous variable. According to the flow continuity in Equation (7), the PT port flow should be strengthened. The ideal distribution mode is shown in the red and blue histogram in Figure 4. The flow of the PT port is the maximum at the beginning of each section of displacement and the minimum at the end of each section. The flow distribution is affected by liquid resistance and pressure, which gives the trend of the continuous increase in pump outlet pressure. Substituting into Equation (6) shows that the curve variation trend of ideal flow area is zigzag, that is, the area changes from large to small in the same displacement section, and the starting point of the next displacement section is slightly higher than the end of the previous displacement section, and the overall trend decreases slowly. On this basis, combined with the feasibility of machining and ignoring the slight increase in the flow area during the switching process of the displacement section, the change trend of the area is approximately regarded as a slow decrease in the whole stroke.
Based on the above analysis, it can be concluded that: In the range of speed regulation, properly reducing the flow area of PT and making it decline smoothly in the stroke is conducive to improving the load capacity, reducing energy consumption, and the smoothness of speed regulation, that is, reducing the area gradient of the PT valve port and changing the structure of the throttle groove of the valve spool. At present, the most widely used valve ports are triangular groove, U-shaped, trapezoidal, L-shaped, etc. The flow parameters of the triangular groove valve port change smoothly, the flow is easy to adjust, and the speed of the executive end of the control hydraulic system is stable [31,32]. The front end of the U-shaped groove is semicircular groove, and the rear end is rectangular. In a certain flow range, the flow gain is relatively stable and the linearity is good, which can reduce the hydraulic impact and vibration of the slide valve when reversing. The L-shaped valve port is formed by transverse milling the shoulder of the valve spool with a small cylinder. The flow area of the valve spool is the part of the cylinder area enclosed by the intersection line of the cylinder and the valve seat edge on the cylindrical surface of the valve spool [33]. This kind of throttling groove has large flow area change rate, sensitive speed change, and short response time. The processing technology of a trapezoidal throttle port is complex. In this paper, triangular groove, L-shaped, and U-shaped throttling groove were applied to the PT valve port respectively, the parameters of the throttling groove were optimized, and the optimal scheme was selected by comparison.
3. Simulation Model Building and Model Validation
Since the throttle area of a valve spool is not only affected by the form of orifice, but also related to many factors such as the matching of the shaft and port and flow channel. It is very difficult to calculate in detail. At present, an empirical formula is widely used to simplify the calculation process. Some international companies even regard it as a technical secret, so it is difficult to obtain accurate performance parameters before and after improvement. Therefore, the accuracy of the model needs to be verified by some practical tests. Through structural mapping, the structural size of the valve spool is drawn, and the flow area formula of each valve port and the initial parameters of spring at the control end are calculated. An AMESim HCD (Hydraulic Component Design) simulation model was built, as shown in Figure 5. The relief valve was used to simulate the load pressure. The main parameters of each element in the simulation model were mainly set according to the actual structure mapping. Some key parameters are shown in Table 1.
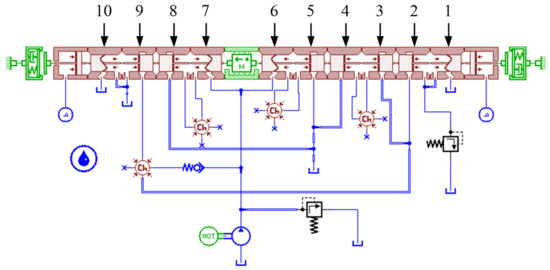
Figure 5.
Simulation model.

Table 1.
Main parameters of the multi-way valve simulation model.
In order to verify the correctness of the simulation model, as shown in Figure 6, the loader test prototype was used as the carrier to test the flow characteristics of the multi-way valve. In order to avoid changing the original vehicle structure, the displacement sensor was used to measure the displacement of the boom cylinder and indirectly convert the load port flow to replace the flow sensor. The pressure measuring point was added at the boom pilot oil port and the pressure sensor was installed to collect the filtered stable pressure. The voltage signals output by the pressure sensor and displacement sensor were collected by the DEWETRON data acquisition instrument.
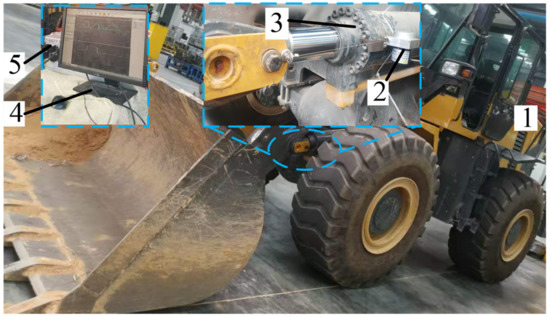
Figure 6.
Loader test prototype. 1—Test prototype; 2—Displacement sensor; 3—Boom cylinder; 4—Monitor; 5—DEWETRON data acquisition instrument.
Setting the same working conditions for simulation and experiment: Parking, no steering, no load, controlling the engine speed at 1500 rpm, and pulling the handle to the maximum position at a constant speed to lift the boom. The test results showed that there was a maximum pressure of about 3.3 MPa under the dead weight of the boom with no load, so the pressure under the no-load condition was set to 3.3 MPa in the simulation. The simulation and experimental curves of the multi-way valve output flow and pilot pressure were processed and drawn as shown in Figure 7 based on the experimental data. There were large fluctuations in the test compared to the simulation, mainly due to the fluctuation of engine speed during the test, and the error of the displacement sensor of the boom cylinder. Next, the mathematical statistics method was used to verify the correctness of the model.
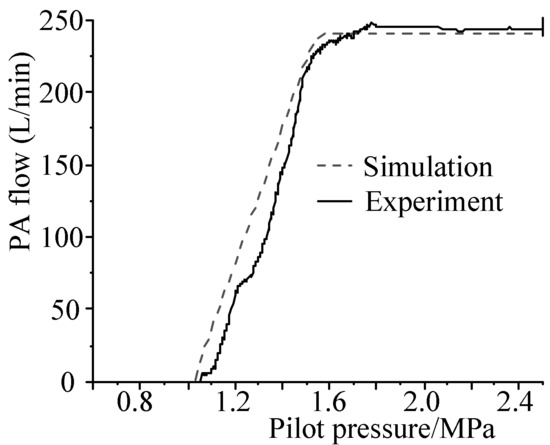
Figure 7.
Output flow-pilot pressure simulation and test curves.
Significance Test
A significance test [34] is used to make a hypothesis on the overall parameters or the overall distribution form in advance, and then the sample information is used to judge whether this hypothesis (alternative hypothesis) is reasonable, that is, to judge whether there is a significant difference between the real situation and the original hypothesis. The significance test is a method used for whether there is a difference between the effects of the experimental treatment group and the control group or two different treatments, and whether this difference is significant. Therefore, this method is used to test whether there is a significant difference between the simulation data and the experimental data.
Step 1: Set original hypothesis H0: There is no significant difference between the simulation and the experimental data; Alternative hypothesis H1: There is a significant difference between the simulation and experiment results.
Step 2: Calculate the simulation and experimental data to get the basic statistics, as shown in Table 2.
Table 2.
Calculation results of the basic statistics of the simulation group and test group.
Step 3: Calculate the sum of squared deviations.
The total square deviation SST reflects the degree of total variation between all samples. The formula for calculating the sum of squared deviations is:
where is the data element of flow; i represents the data group, simulation group, or experiment group; j indicates the ordinal number in the group where the data is located; and is the total average of the samples.
Sum of squared deviations within a group:
where is the average value of the data group.
Sum of squared deviations between groups:
Step 4: Determine the degree of freedom, df. Based on the theory of mathematical statistics, the first degree of freedom is df1 = n1 − 1, n1 is the number of groups, here taken as 2 to represent the simulation and experiment, therefore, df1 = 1. The second degree of freedom is df2 = n − m − 1, n is the total number of data. m is the number of independent variables.
Step 5: Calculate the average of the sum of squared deviations, MS. The calculation formula of MS is:
where MSA is the average of squared mean deviations between groups; MSE is the sum of squared deviations within the group.
Step 6: Calculate test statistics F. F is the ratio of MSA and MSE, as the ratio of the average sum of squared deviations between groups to the average sum of squared deviations within groups, namely . Usually, the significance level can be 0.1, 0.05, and 0.01. Here, we chose the significance level , the standard value is obtained according to the F check table.
The calculation results are shown in Table 3.
Table 3.
Variance analysis.
Since the calculated statistic F was less than the standard value, there was a 95% confidence that there was no significant difference between the simulation data and the test data. That is to say, the simulation data can predict the relationship between the flow rate through the PA port of the improved multi-way valve and the pilot pressure. At the same time, the actual test data also verifies the rationality and correctness of the simulation results, which can well reflect the actual characteristics and provide a basis for analysis.
4. Optimization of Valve Port Structure Parameters
4.1. Multi-Objective Optimization
4.1.1. Optimization Problem Formulation
According to the analysis of the working state of a multi-way valve, there are three evaluation indexes of the performance of a multi-way valve: (1) The energy consumption of the system can be used to evaluate the energy-saving effect of the digital hydraulic system; (2) The effective working range of the valve spool can be used to evaluate the accuracy of flow control of the multi-way valve; and (3) Flow regulation performance: in the process of spool displacement change, the larger the flow regulation bad point value, the worse the regulation performance. The point that the flow changes in a way not meeting the flow regulation performance requirements is the flow regulation bad point. Whether the flow change in a way meets the requirements is mainly reflected in the rate of flow change, too small (close to 0) is not conducive to fretting, and too large is likely to cause sudden changes in flow and detrimental to stability. In this research, fretting takes a larger proportion than stability in the optimization process. Three optimization schemes of a multi-way valve spool structure are shown in Figure 8, where (1) is a triangular throttling groove, (2) is an L-shaped throttling groove, and (3) is a U-shaped throttling groove. Taking the triangular groove as an example, the length a, the width b, and the depth h that can be modified easily in the valve port parameters were defined as the design variables. The value range is shown in Table 4. The length of the triangular groove can indirectly reflect the underlap corresponding to zero displacement.
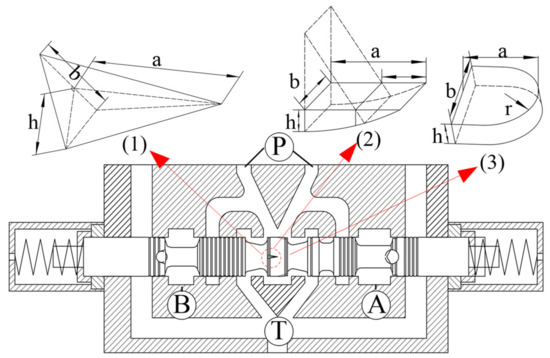
Figure 8.
Structure optimization scheme of a multi-way valve boom spool.
Table 4.
Variable parameters and the value range of the valve port design.
Considering all the performance indexes, the optimization objectives of the system were as follows: (1) Minimum energy consumption; (2) maximum effective working range of valve spool; and (3) minimum the flow regulation bad point value. The optimization model was established as follows:
The logarithmic function was used to transform the sub-objective function to the same order of magnitude, and then the linear weighting method was used to transform the multi-objective optimization problem into the single- objective optimization problem and then solve the function:
where represents the comprehensive performance index of multi-way valve; denotes the system energy consumption; is the effective working range of valve spool; and represents the flow regulation bad point value. , , are the weight coefficient, and their value depends on the importance of each single objective function. The digital hydraulic system has already significantly reduced energy consumption compared to the original system, so broadening the speed range and optimizing flow control performance were the primary objectives of this paper. Take , , . The smaller the comprehensive performance index, the better the performance. In order to improve the performance of the multi-way valve as much as possible, optimization is carried out at an intermediate pressure of 12 MPa.
The optimization design of the parameters of the valve spool throttling groove has the characteristics of being multi-constraint, multi-objective, and nonlinear. Therefore, it is indispensable to select an algorithm with universal applicability and strong global search ability.
4.1.2. Optimization Method Selection
At present, there are many intelligent algorithms for parameter optimization such as the SAA (simulated annealing algorithm), GA (genetic algorithm), NN (neural network) algorithm, and PSO (particle swarm optimization) algorithm, each with their own advantages and disadvantages. The SAA has a sound theory and high optimization quality that are easy to implement, but the optimization time is long, and the efficiency is low. The NN algorithm has a self-learning function, high optimization efficiency, fast solving speed, and is suitable for nonlinear relationship optimization, but it is easy to cause information loss during the optimization process and requires a large amount of data. The optimization speed of the PSO is fast, however, the local optimization ability is poor, and it has the problem of falling into the local optimum. In comparison, GA can process multiple individuals in a group at the same time, that is, evaluate multiple solutions in the search space, reducing the risk of falling into a local optimal solution. Due to the use of the overall search strategy and optimized search method, it does not rely on gradient information or other auxiliary knowledge when calculating, but only needs the objective function that affects the search direction and the corresponding fitness function. It provides a general framework for solving complex system problems, which does not depend on the specific field of the problem, has strong robustness to the type of problem, simple operation, good optimization effect, and strong adaptability. Therefore, GA optimization was used in this research [35].
GA is an optimization method that simulates natural selection and genetic mechanisms in the biological world. Since it was proposed in 1975, it has been widely used in the field of optimization algorithms because of its simplicity, group solving, and no demand-oriented advantages. When solving the problem, the initial population composed of a certain number of individuals starts, and the individuals are copied through the selection strategy based on individual fitness, and the crossover and mutation operators are used to generate a new generation of population through continuous iteration and evolution until the optimal solution of the problem after N generations is obtained.
The steps to implement GA are as follows:
Step 1: Initialize the population and generate N individuals;
Step 2: Calculate the fitness of each individuals;
Step 3: Select individuals who enter offspring based on individual fitness;
Step 4: Crossover operation with probability ;
Step 5: Mutation operation with probability ;
Step 6: If the termination conditions are not met, turn to Step 2, otherwise continue; and
Step 7: Output the optimal solution to the problem.
The flow chart is shown in Figure 9.
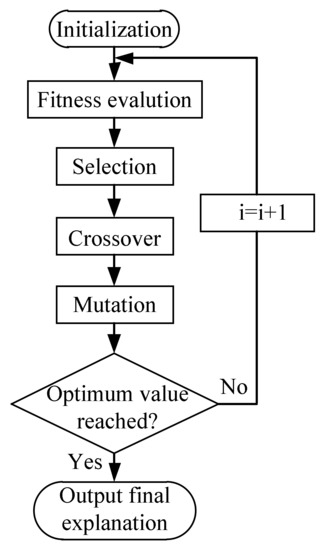
Figure 9.
Flow chart of the genetic algorithm (GA).
Based on the mathematical model of a multi-way valve, by minimizing the integrated performance index of the multi-way valve as the objective, the design variables and optimization objectives were set in AMESim. Since the focus of this research is on the multi-way valve and in order to improve the calculation speed, a simplified model is used for the pump, that is, a variable pump model with step variables is used instead of a digital pump model. The genetic algorithm was used for multi-objective optimization. The population size was 50, the reproduction ratio was 50%, the max number of generation was 100, the mutation probability was 0.01, and the mutation amplitude was 0.2. The optimization process is shown in Figure 10.
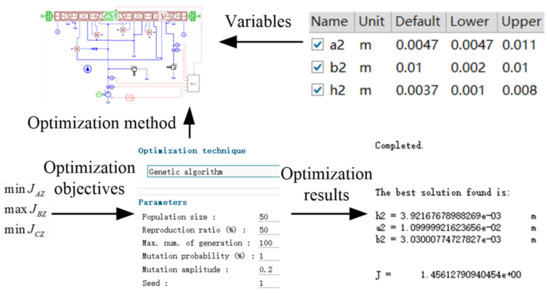
Figure 10.
The optimization process.
4.2. Optimization Results
As shown in Figure 11, after 2500 iterations, the result of the triangular groove model basically converged. The ordinate is the value of the corresponding objective function, and the abscissa represents the iteration number. The optimal solution of the triangular groove valve port was a = 11 mm, b = 3.03 mm, h = 3.92 mm, and the underlap corresponding to zero displacement was 14 mm. Similarly, the optimal results of the U-shaped groove valve port were a = 8.9 mm, b = 2.24 mm, h = 1.22 mm, and the underlap corresponding to zero displacement was 11.9 mm. The optimization results of the L-shaped groove port were a = 9.6 mm, b = 2.23 mm, h = 1.02 mm, and the valve opening was 12.6 mm. A comparison table of the valve port parameters before and after optimization is shown in Table 5. The performance of the multi-way valve had obviously been improved.
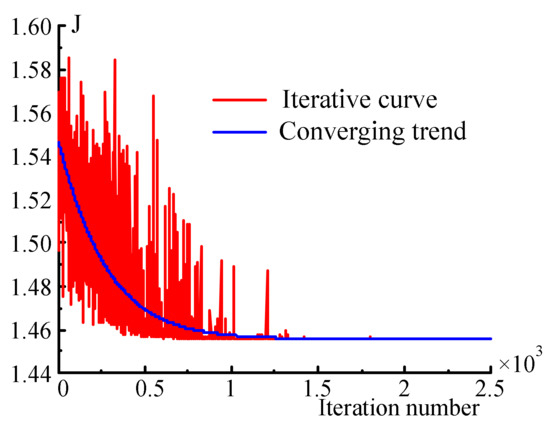
Figure 11.
Convergence process of objective function.
Table 5.
Comparison table of the valve port parameters before and after optimization.
5. Simulation Analysis
The fixed displacement pump multi-way valve system and digital pump multi-way valve system were simulated under the same load conditions (no load, medium load, and heavy load), and the power loss of two systems was compared. The test results showed that the boom pressure under no load is not 0 because its own weight, and the maximum is about 3.3 MPa. 17 MPa was the maximum pressure of the system, so the pressure under no-load, medium-load, and heavy-load were respectively set to 3.3 MPa, 12 MPa, and 17 MPa. Figure 12a–c manifests the comparison of power loss of the fixed displacement pump multi-way valve system and digital pump multi-way valve system under the three kinds of working conditions. It can be seen that the power loss of the digital pump system was obviously smaller than that of the fixed displacement pump system.
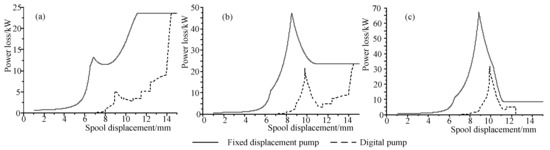
Figure 12.
Power loss comparison between the fixed displacement pump and digital pump. (a) No load (3.3 MPa); (b) Medium load (12 MPa); (c) Heavy load (17 MPa).
The optimized valve port parameters were input into the simulation model to compare the simulation effect before and after the optimization of a multi-way valve port. Before and after optimization, the curves between the flow area of the PT valve port and the displacement of the valve spool are shown in Figure 13. After optimization, the flow area of the PT port was greatly reduced, and a dead zone of about 3 mm was reserved to prevent the driver from mis-operation. Next, the three curves are explained separately. The triangular throttling groove valve port: with the increase of the spool displacement, the PT valve port flow area decreased slowly, so it was easy to adjust the flow and was beneficial to the stability of the control system. The L-shaped throttling groove valve port: the flow area changed slightly at the initial position of the spool displacement, at about 3~6 mm, which is beneficial to the stability of the flow at the execution end. With the increase in the spool displacement, the change rate of the flow area was large, which is conducive to the rapid response of the system. The U-shaped throttling groove valve port: when the spool displacement was in the position where the opening of the valve port was greater than the arc radius at the top of the throttling groove, about at 3–10.78 mm, the flow area changed smoothly and tended to be a constant value. As the spool displacement increased until the position where the opening of the valve port was greater than the arc radius at the top of the throttling groove, about at 10.78–11.9 mm, the gradient of the flow area change was larger than the others.
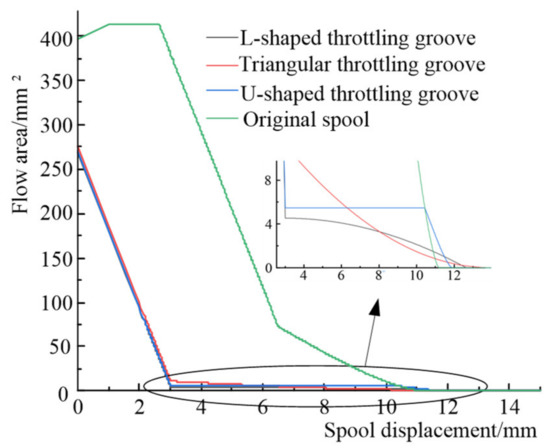
Figure 13.
Curves of the PT flow area with respect to the spool displacement.
5.1. Flow Control Characteristics
According to the matching method of digital pump flow and valve spool displacement introduced in Section 2.4, the simulation parameters were set. By controlling the pilot pressure, the valve spool displacement was controlled from the middle position to the left limit position, and three working conditions of no load, medium load, and heavy load were analyzed respectively.
Figure 14a shows the simulation curve under the minimum boom working pressure. It can be seen from the figure that the small displacement of the original valve spool was an invalid control section. When the valve spool has a large displacement, the PA channel has flow. The speed regulation range was 9 mm to 15 mm, and the small flow of the pump did not play a role. The flow range was 96–240 L/min, but the actual flow range of flow through the PA channel was only 0–240 L/min, with a large throttling loss. After modifying the structure of the valve port, the flow of almost the whole opening range worked except for the dead zone, and there was only a small amount of flow loss. The valve spool of the triangular groove structure rose smoothly in the process of pressure establishment. The flow of the triangular groove was closer to the continuous variable, and the flow regulation characteristics were better. When the spool moved to a position where the middle oil return port was completely covered, the flow and pressure characteristics of the optimized valve spool structure and the original valve structure were the same.
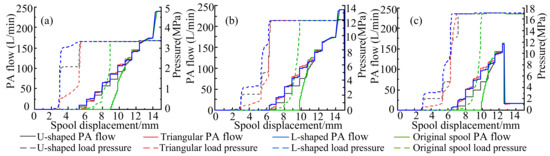
Figure 14.
Curves of PA flow with respect to the spool displacement. (a) No load (3.3 MPa); (b) Medium load (12 MPa); (c) Heavy load (17 MPa).
Similarly, as shown in Figure 14b, when the load pressure was 12 MPa, it can be seen that the speed regulation range of the original valve spool was 10 mm to 15 mm, and there was a large throttling loss. After adjusting the structure, the starting point of the speed control was advanced to almost 6 mm, the throttling loss was greatly reduced, and the pressure of the valve spool of the triangular groove structure was relatively stable at the initial stage, while the L-shaped groove was the second.
Figure 14c shows the situation when the load pressure reached the set safety pressure of 17 MPa, which can reflect the maximum load capacity under different valve underlap. The load channel damping of the multi-way valve in the fixed displacement pump system was small, and the load characteristics were soft, consequently, high pressure cannot be established at a small displacement. However, the load channel damping of the multi-way valve in the reformed digital pump system was increased, and a greater pressure can be established at small displacement. At the same time, since the output flow of the digital pump corresponded to the spool displacement, the increase in the damping will not cause excessive throttling loss.
5.2. Comparison of Energy Loss
The power loss with respect to the spool displacement curves of the optimized spool structure and the original valve structure under three fixed load pressure conditions are presented in Figure 15a–c.

Figure 15.
Curves of power loss with respect to the spool displacement. (a) No load (3.3 MPa); (b) Medium load (12 MPa); (c) Heavy load (17 MPa).
Since the load pressure was not established before the spool displacement reached about 9 mm, the system flow and pressure were small. Therefore, the power loss value was small, but even a small power loss was also a waste because the system did not work normally. Then, with the increase in the valve spool displacement, the flow of PA channel was always small, while the system oil supply and system pressure increased, so the power loss increased. When the loss increased to the maximum, the displacement of the valve spool continued to increase, the flow of PA channel increased, and the power loss decreased, but it was always higher than that of the optimized scheme. When the spool moved to a position where the middle oil return port was completely covered, the power loss of the optimized valve spool structure was the same as that of the original valve structure.
We compared the three cases to analyze the power loss of the optimized scheme. When the pressure is not established in the system, thanks to the principle of “small displacement with small flow”, the displacement of the digital pump connected to the system was small at this time, so the power loss was small and almost negligible. After 6 mm, before the spool moved to the position where the oil return port was completely covered, the overall trend of power loss was approximately positively correlated with the flow area of the PT port, and the power loss of the triangular groove was almost equivalent to that of the L-shaped, and the U-shaped was the largest.
Comprehensive analysis of flow, pressure characteristics, and energy-saving conditions in the optimization system with the optimized valve spool structure showed that the pump participated in the work with a small flow when the displacement was small, and the flow changed in steps. Compared with the original structure, the speed regulation range was widened. Among the three kinds of throttling grooves, the triangular groove had the best effect, and more stable pressure rise during the pressure build-up process. In addition, the flow change was closer to the continuous variable and the flow regulation characteristics were better, the L-shaped ranked second, and the effect of the U-shaped groove was relatively poor because while the flow area changed little over a long period of displacement, the flow in the ladder did not increase.
6. Conclusions
In this paper, the digital hydraulic system configuration of loaders based on multi-way valve spool displacement feedback was proposed, and the valve spool theoretical structure suitable for the digital hydraulic system was deduced. The simulation model of a multi-way valve was established by using AMESim software, the correctness of which was verified by experiment with the significance test. The valve port parameters of the multi-way valve were optimized by GA. Compared with the original structure, the optimized structure widened the speed regulation range by about 4 mm, accounting for 27% of the total stroke, and had more stable load characteristics and much less power loss. In the comparison of the three kinds of throttling grooves, the effect of the triangular groove valve port was the best. Meanwhile, the pressure of the triangular groove was established more smoothly, the flow change was closer to continuous variable, and the flow regulation characteristics were better. The L-shaped groove ranked second, and U-shaped groove had a relatively poor effect.
The great value of this research is to enable the stepped variable of the digital hydraulic pump with the method of partial throttling to obtain a more stable variable output, which is of great significance for solving the contradiction between the digital variable and the smooth output and improving the control quality of the digital hydraulic system. It also provides a new idea for the future development direction of energy-saving technology for loaders.
Author Contributions
Methodology, X.L. and X.W.; Software, C.L. and J.C.; Formal analysis, C.L. and Y.W.; Funding acquisition, X.L. and X.W.; Writing—original draft, X.W. and C.L.; Writing—review and editing, C.L., X.L., X.W., J.C., and Y.W. All authors have read and agreed to the published version of the manuscript.
Funding
This research was funded by the National Natural Science Foundation of China, grant number 51405183.
Conflicts of Interest
The authors declare no conflict of interest.
References
- Qin, S.C. Thinking on the technical progress of domestic loader. Constr. Mach. 2010, 41, 48–50. [Google Scholar]
- Wang, Y.; Fan, W.D.; Jia, S.T.; Liang, Z.G. Constant variable hydraulic system: The mainstream of loader in the future or the transition to full variable system. Constr. Mach. Technol. Manag. 2015, 28, 58–59. [Google Scholar]
- Linjama, M. Digital Fluid Power-State of the Art. In Proceedings of the Twelfth Scandinavian International Conference on Fluid Power, Tampere, Finland, 18–20 May 2011. [Google Scholar]
- Saeedzadeh, A.; Rezaei, S.M.; Zareinejad, M. Energy-efficient Position Control of an Actuator in a Digital Hydraulic System Using On/Off Valve. In Proceedings of the IEEE 2016 4th International Conference on Robotics and Mechatronics (ICROM), Tehran, Iran, 26–28 October 2016; pp. 34–45. [Google Scholar]
- Gan, Z.Y.; Fry, K.; Gillesoie, R.B.; Remy, C.D. A novel variable transmission with digital hydraulics. In Proceedings of the IEEE 2015 IEEE/RSJ International Conference on Intelligent Robots and Systems (IROS), Hamburg, Germany, 28 September–2 October 2015; pp. 5838–5843. [Google Scholar]
- Shen, W.; Mai, F.; Su, X.Y. A new electric hydraulic actuator adopted the variable displacement pump. Asian J. Control 2016, 18, 178–191. [Google Scholar] [CrossRef]
- Ehsan, M.; Rampen, W.H.S.; Salter, S.H. Modelling of Digital-Displacement Pump-Motors and Their Application as Hydraulic Drives for Nonuniform Loads. J. Dyn. Syst. Meas. Control 2000, 122, 210–215. [Google Scholar] [CrossRef]
- Song, F.; Lou, J.K.; Peng, L.K. Energy-saving improvement and simulation study on digital hydraulic system. In Proceedings of the 2015 International Conference on Advanced Mechatronic Systems (ICAMechS), Beijing, China, 22–24 August 2015. [Google Scholar]
- Wang, L.; Liu, X.H.; Wang, X.; Chen, J.S.; Liang, Y.J. Strategy of Digital Hydraulic Transmission System for Loaders. J. Jilin Univ. (Eng. Tech. Ed.) 2017, 47, 819–826. [Google Scholar]
- HeikkilÄ, M.; Linjama, M. Displacement control of a mobile crane using a digital hydraulic power management system. Mechatronics 2013, 23, 452–461. [Google Scholar] [CrossRef]
- Gong, J.; Zhang, D.; Liu, C.; Zhao, Y.; Hu, P. Power control strategy and performance evaluation of a novel electro-hydraulic energy-saving system. Appl. Energy 2019, 233–234, 724–734. [Google Scholar] [CrossRef]
- Ketonen, M.; Linjama, M. Digital hydraulic IMV system in an excavator—First results. In Proceedings of the Sixteenth Scandinavian International Conference on Fluid Power, Tampere, Finland, 22–24 May 2019. [Google Scholar]
- Budden, J.J.; Williamson, C. Danfoss Digital Displacement Excavator: Test Results and Analysis. In Proceedings of the ASME/BATH 2019 Symposium on Fluid Power and Motion Control, Longboat Key, FL, USA, 7–9 October 2019. [Google Scholar]
- Willianson, C.; Manring, N. A more accurate definition of mechanical and volumetric efficiencies for digital displacement pumps. In Proceedings of the ASME/BATH 2019 Symposium on Fluid Power and Motion Control FPMC2019, Sarasota, FL, USA, 7–9 October 2019; pp. 1–11. [Google Scholar]
- Liu, X.H.; Wang, T.J. Hierarchical Variable System of Multi Gear Pump. Chinese Patent No. 201110107578, 14 December 2011. [Google Scholar]
- Heitzig, S.; Sgro, S.; Theissen, H. Energy efficiency of hydraulic systems with shared digital pumps. Int. J. Fluid Power 2012, 13, 49–57. [Google Scholar] [CrossRef]
- Simic, M.; Herakovic, N. Reduction of the flow forces in a small hydraulic seat valve as alternative approach to improve the valve characteristics. Energy Convers. Manag. 2015, 89, 708–718. [Google Scholar] [CrossRef]
- Amirante, R.; Distaso, E.; Tamburrano, P. Sliding spool design for reducing the actuation forces in direct operated proportional directional valves: Experimental validation. Energy Convers. Manag. 2016, 119, 399–410. [Google Scholar] [CrossRef]
- Yue, H.; Tan, R.H.; Shi, Z.Q. Static mathematical model of multi way valve for 950B wheel loader. J. Hebei Inst. Technol. 1989, 2, 21–30. [Google Scholar]
- Zhang, J.H. Design of Multi Way Valve for Loader and Research on Opening Characteristics of Main Valve Core; Lanzhou University of Technology: Lanzhou, China, 2010. [Google Scholar]
- Chen, J.S. Research on Walking System of Skid Steer Loader; Jilin University: Changchun, China, 2012. [Google Scholar]
- Amirante, R.; Vescovo, G.D.; Lippolis, A. Evaluation of the flow forces on an open centre directional control valve by means of a computational fluid dynamic analysis. Energy Convers. Manag. 2006, 47, 1748–1760. [Google Scholar] [CrossRef]
- Ramesh, M.D.; Tan, Y.A.; Lan, X.K. Optimization of a Hydraulic Valve Design Using CFD Analysis. In Proceedings of the SAE Commercial Vehicle Engineering Conference, Chicago, IL, USA, 1–3 November 2005. [Google Scholar]
- Hopf, H.J.; Kassai, N.; Hopf, A. Multi-Way Valve and Method of Producing Same. U.S. Patent No. 20120103448, 3 May 2012. [Google Scholar]
- Jia, X.F. Research on Matching Characteristics of Pilot Valve and Multi Way Valve of Skid Steer Loader; Jilin University: Changchun, China, 2015. [Google Scholar]
- Hu, S.W. Matching Research on Multi Way Valve Pilot System of Bulldozer; Yanshan University: Qinhuangdao, China, 2016. [Google Scholar]
- Li, W. Simulation Analysis and Optimal Design of Vehicle Shift Regulator; University of Technology: Lanzhou, China, 2019. [Google Scholar]
- Li, J.; Ding, M.H.; Yong, W. Evaluation and optimization of the nonlinear flow controllability of switch valve in vehicle electro-hydraulic brake system. IEEE Access 2018, 6, 31281–31293. [Google Scholar] [CrossRef]
- Li, J.; Ding, M.H.; Huang, J.L.; Huang, L. Evaluation and optimization of the nonlinear flow controllability of on-off soleoid valve. J. Jilin Univ. (Eng. Tec. Ed.) 2019, 49, 325–335. [Google Scholar]
- LI, S.Y. Performance optimization of ball type check valve based on NLPQL. J. Mech. Electr. Eng. 2020, 37, 916–920. [Google Scholar]
- Na, C.L. Calculation of orifice area of triangular groove. J. Gansu Univ. Technol. 1993, 2, 45–48. [Google Scholar]
- Du, J.; Zhao, T.C. Analysis of throttle valve port structure and function. Hydraul. Pneum. 2010, 2, 52–54. [Google Scholar]
- Ji, H.; Zhang, J.H.; Wang, D.S.; Zhang, W.; Liu, X.P. Flow coefficient of rectangular orifice of slide valve. J. Lanzhou Univ. Technol. 2010, 36, 47–50. [Google Scholar]
- Remley, K.A.; Wang, J.; Williams, D. A Significance test for reverberation-chamber measurement uncertainty in total radiated power of wireless devices. IEEE Trans. Electromagn. Compat. 2016, 58, 207–219. [Google Scholar] [CrossRef]
- Aantoio, R.; Alarico, M. Multi-objective optimization of hydro-mechanical power split transmissions. Mech. Mach. Theory 2013, 62, 112–128. [Google Scholar]
Publisher’s Note: MDPI stays neutral with regard to jurisdictional claims in published maps and institutional affiliations. |
© 2021 by the authors. Licensee MDPI, Basel, Switzerland. This article is an open access article distributed under the terms and conditions of the Creative Commons Attribution (CC BY) license (http://creativecommons.org/licenses/by/4.0/).