1. Introduction
Energy management of buildings is one of the leading issues in the modern world. Constantly emerging new and more stringent regulations on greenhouse gas emissions, and the new technologies that go hand in hand with them, force a continuous modification of the accepted essentials in construction [
1,
2]. The construction sector in Europe contributes 30% of the world’s carbon dioxide emissions to the atmosphere, while in the United States of America alone, construction consumes over 40% of the energy produced there [
3,
4]. Numerous different factors affect the energy requirements of buildings. Different material and construction solutions may be required depending on a building’s location. Apart from location, technical parameters of buildings are very important, such as orientation towards the world, shape, and surface-to-volume ratio. All of the factors listed above can, independently, both improve and also deteriorate the energy performance of a building. Energy saving is a high priority in developed countries. For this reason, energy-efficient measures are being increasingly implemented in all sectors [
5]. Total energy use during the life cycle of a building is a growing research field. The embodied energy makes up a considerable part of the total energy use in low energy buildings [
6]. Research on the impact of location on the energy of buildings determines the subject of this assessment. In order to investigate this situation, as well as other investigations, the disclosure of rope data is part of the operational and mandatory activities in all cases. Contract studies for work-based services with work services and service-provisioning services provide hydrotechnical services that improve services throughout the cycle as well as strengthen energy demand throughout the cycle [
7,
8].
In recent years, there has been an increasing number of publications dealing with the subject of thermal–humidity phenomena and the energy of agricultural facilities. This research was based on field studies, which made it possible to conduct numerical analyzes. In 2014, Nawalany et al. [
9] conducted an analysis of soil temperature distribution under a single-bay greenhouse. The percentage share of land in the greenhouse energy economy was also estimated. Later, these studies were developed, and an analysis was carried out based on the numerical method of the influence of selected factors on the heat exchange with the ground [
10]. Baerdemaeker et al. [
11] and Delele et al. [
12] demonstrated the essence of applying numerical models to predict hygrothermal phenomena occurring in fruit and vegetable stores. The significant influence of ventilation on shaping the interior microclimate was demonstrated in the work of Verboven et al. [
13]. The subject of broiler houses was also discussed in recent years, when the results of the impact of the length of the technological break between production cycles on the energy of the building were developed [
14]. Martin and Canas [
15] analyzed the benefits of storing wine in recessed cellars. As an approach to assessing possible energy savings in underground cellars, an analytical model was used to calculate soil temperature.
Proper shaping of the interior conditions also has a significant impact on thermal comfort. Support for this analysis in this field can be obtained using building information modeling and building energy modeling, enabling the simulation of various modernization alternatives [
16,
17]. An important aspect is also the influence of moisture in building materials, which can significantly deteriorate their technical parameters and pose a biological risk [
18]. In order to improve the microclimate of the interior and optimize energy demand, modern methods of thermal insulation should be constantly sought; for example, through the use of aerogel [
19]. Maintaining proper interior conditions is also highly correlated with environmental pollutants, such as heavy metals, noise (in the case of humans and animals), or radiation [
20,
21].
It is estimated that about 24% of global GHG emissions come from the agricultural construction sector [
22]. Unfortunately, agricultural buildings for crop production, animal production, or storage buildings are not covered by detailed normative acts regulating the requirements for their energy performance. The age of structures and material degradation also play an important role [
23]. Undoubtedly, from this point of view, it is important to gradually implement developing technologies based on renewable energy sources [
24]. Buildings of this type are usually constructed based on typical material and construction solutions adopted by the designer in a given period. Nevertheless, it should be noted that, depending on the location of such a building, its energy consumption and energy performance can vary dramatically.
Therefore, this paper addresses the issue of how the location of an agricultural building (a large-scale broiler house) affects its energy management. The results of the analyses determined the effect of varying outdoor climate on selected building energy parameters and building–soil interactions.
2. Materials and Methods
2.1. Research Object
The experimental study was conducted in a large-scale broiler house located in the southern part of Poland (
Figure 1). The building was constructed using traditional brick technology and founded on concrete foundations with a foundation level of 1.00 m below the ground level. The floor construction was in layers, consisting of a 0.20 m-thick gravel and sand sub-base, a 15 cm-thick class C8/10 concrete sub-base, and a 10 cm-thick cement screed. The building floor had no thermal insulation. The external walls are made of double-layer technology. The construction material was 0.24 m-thick cellular concrete blocks (type 600). Thermal insulation of external walls was made with 0.10-m thick EPS facade foam. The ceiling construction consisted of 140 steel channels, with a layer of 0.10 mineral wool laid between them. The ceiling from below was finished with a galvanized steel sheet. The roof structure consisted of steel trusses made of 120 channel sections (top chord) and 100 channel sections (bottom chord). The entire structure was reinforced with cross-braces and 50 × 50 × 5 L–posts. The roofing was made of galvanized trapezoidal sheet metal.
The broiler house uses tubular, wall-mounted heating fed from the boiler room. The district heating hub was also supported by a biogas plant belonging to the entire complex of broiler house buildings. Four electric heaters, located on the exterior walls of the building, were also used to support the conventional heating system. The building was ventilated by exhaust fans. Fresh air was drawn in through vents equipped with jet dampers located on walls opposite to the fans. The broiler house was also equipped with a fogging system to allow fine-tuned control of the thermal and humidity conditions of its interior.
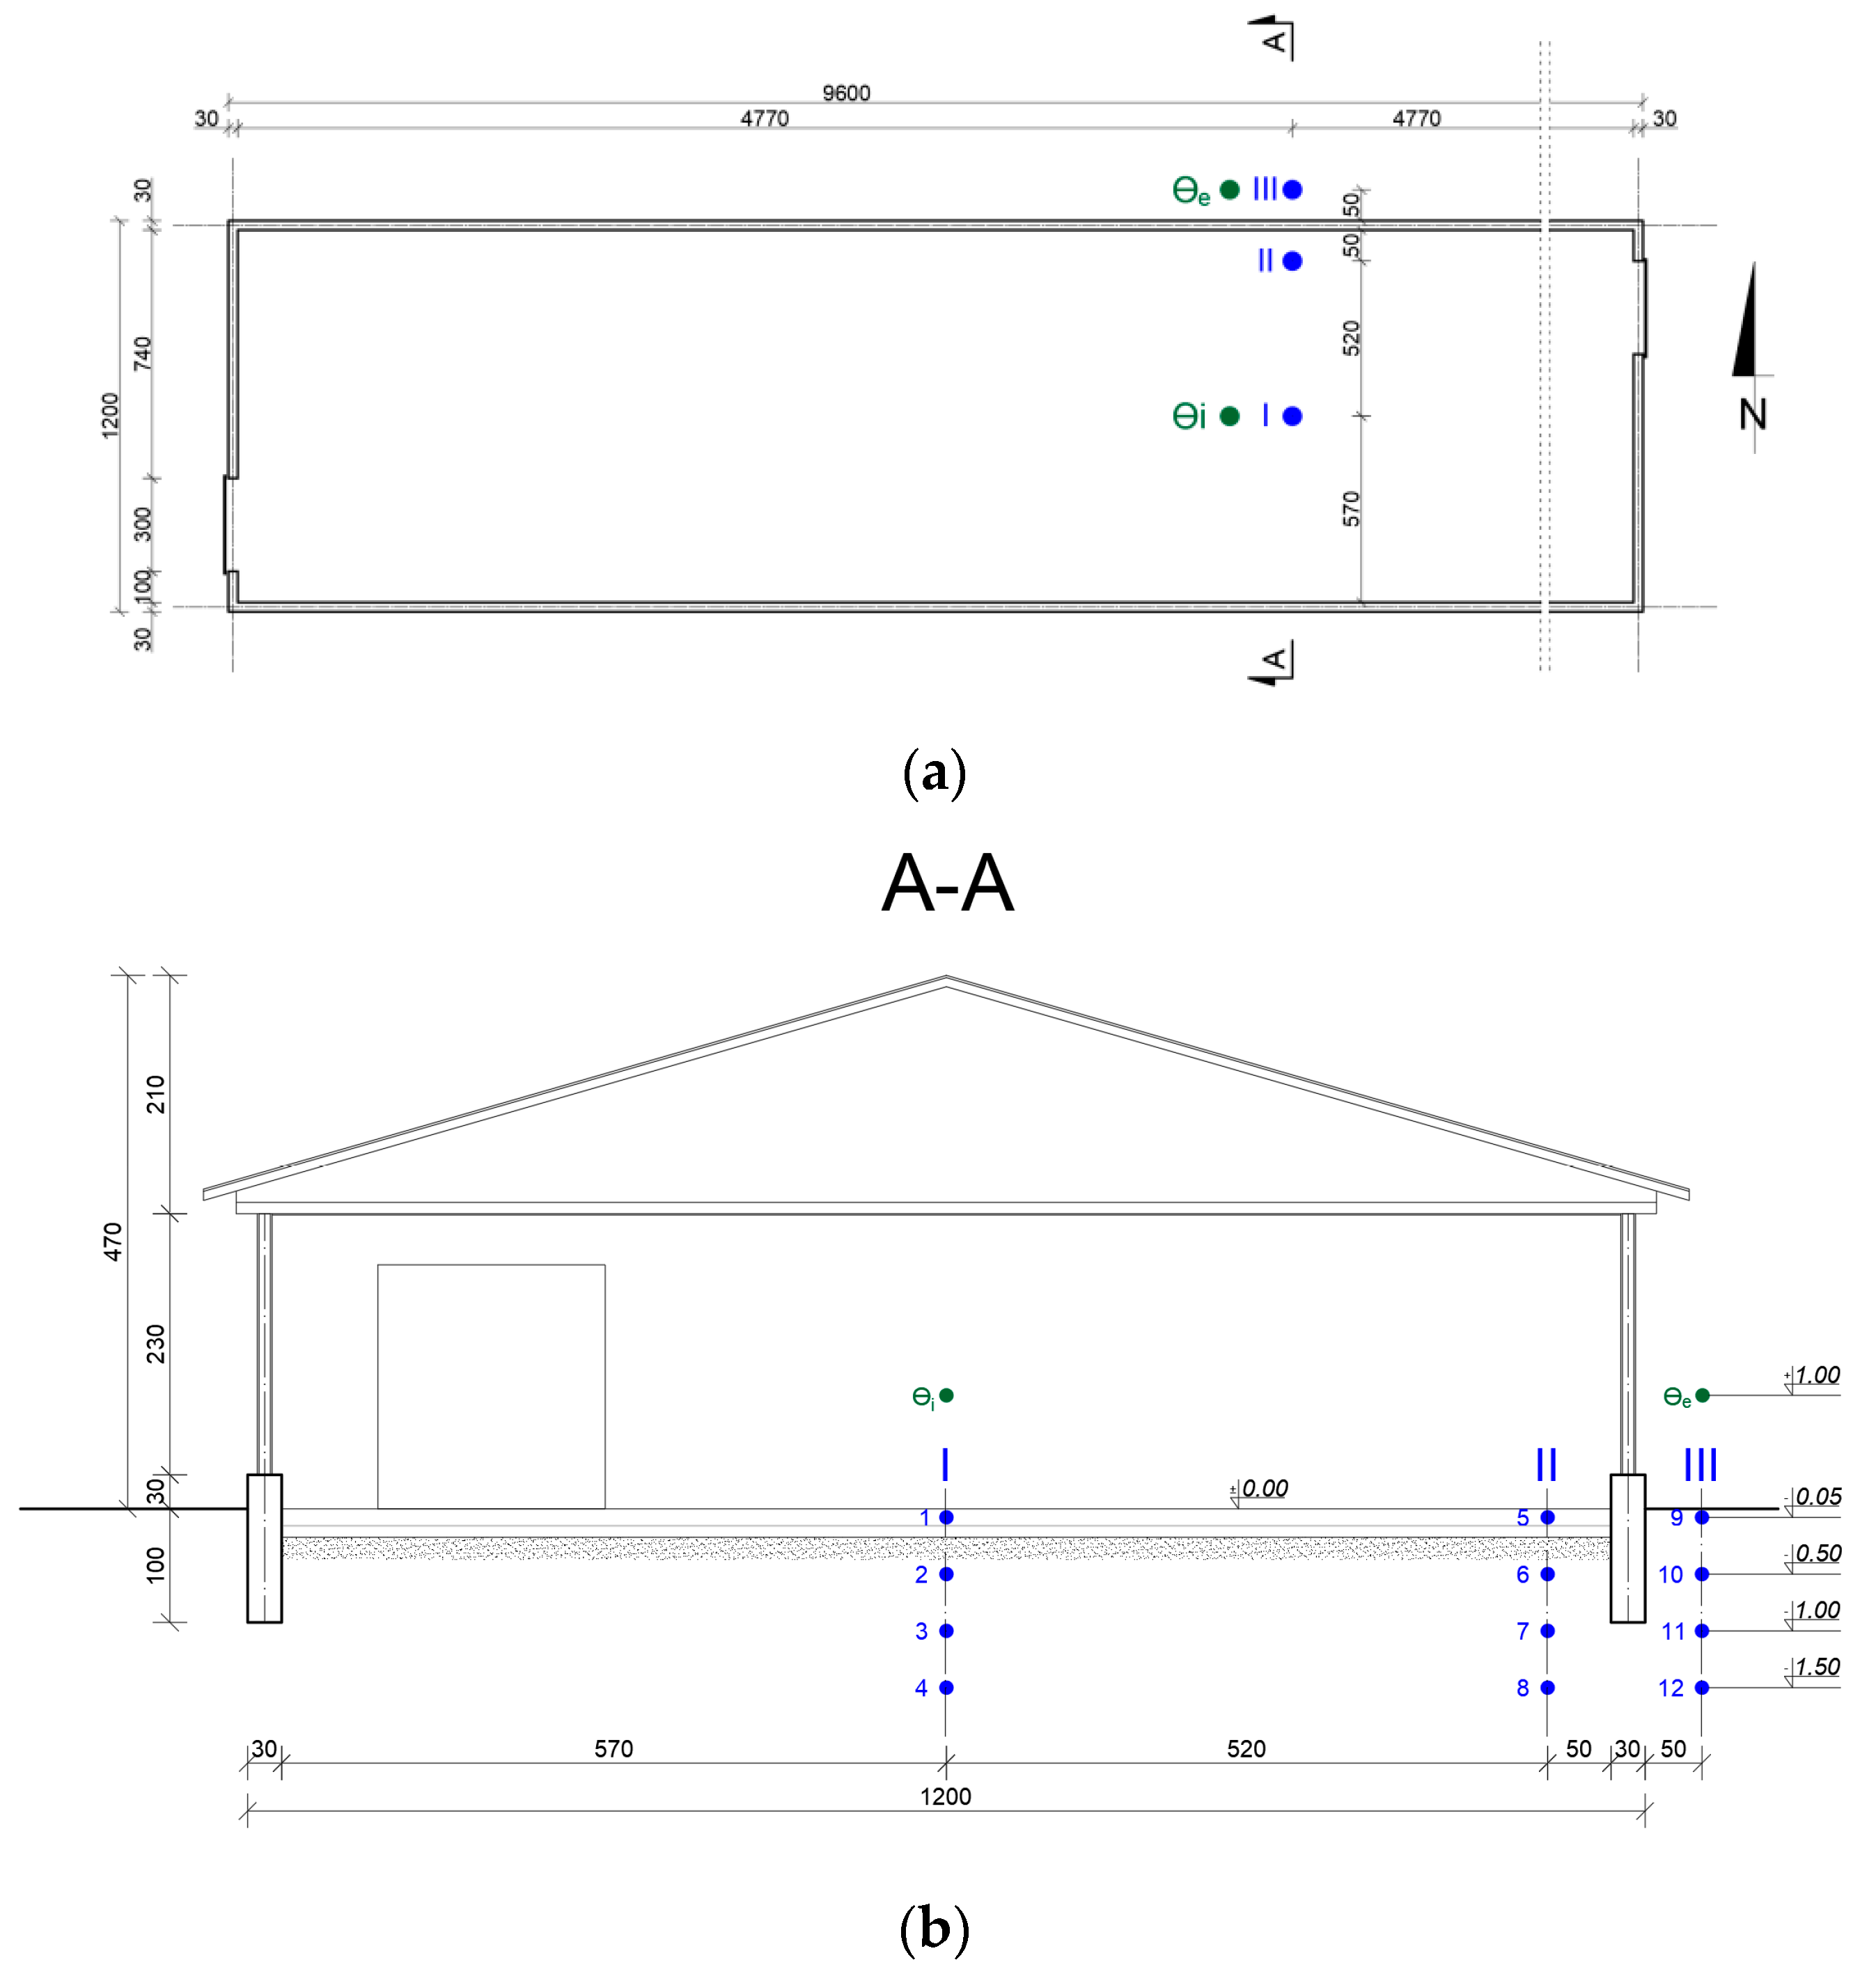
2.2. Measurement Apparatus and Location of Measurement Points
The area of the production hall located in the middle part of the building, between the longitudinal axis of the broiler house and its outer wall, was included in the study (
Figure 2).
Ground temperature measurement points were distributed in 3 measurement vertical sections. The set of measurement and control apparatus included a multi-channel recorder manufactured by HP and 14 PT-100 sensors with a resolution of 0.1 °C and a measurement error of ±0.1 °C (12 sensors for measuring ground temperature and 2 sensors for measuring outdoor and indoor air temperature).
The frequency of measurement was 1 h. The field measurements were conducted between 4 June 2020 and 3 June 2021. During the study period, no bacterial or viral diseases occurred in broiler chickens (Ross breed) that would significantly affect the course of rearing and production results. The study did not interfere with animal welfare and did not require the approval of the Veterinary Inspectorate.
2.3. Theoretical Calculations Using Numerical Methods
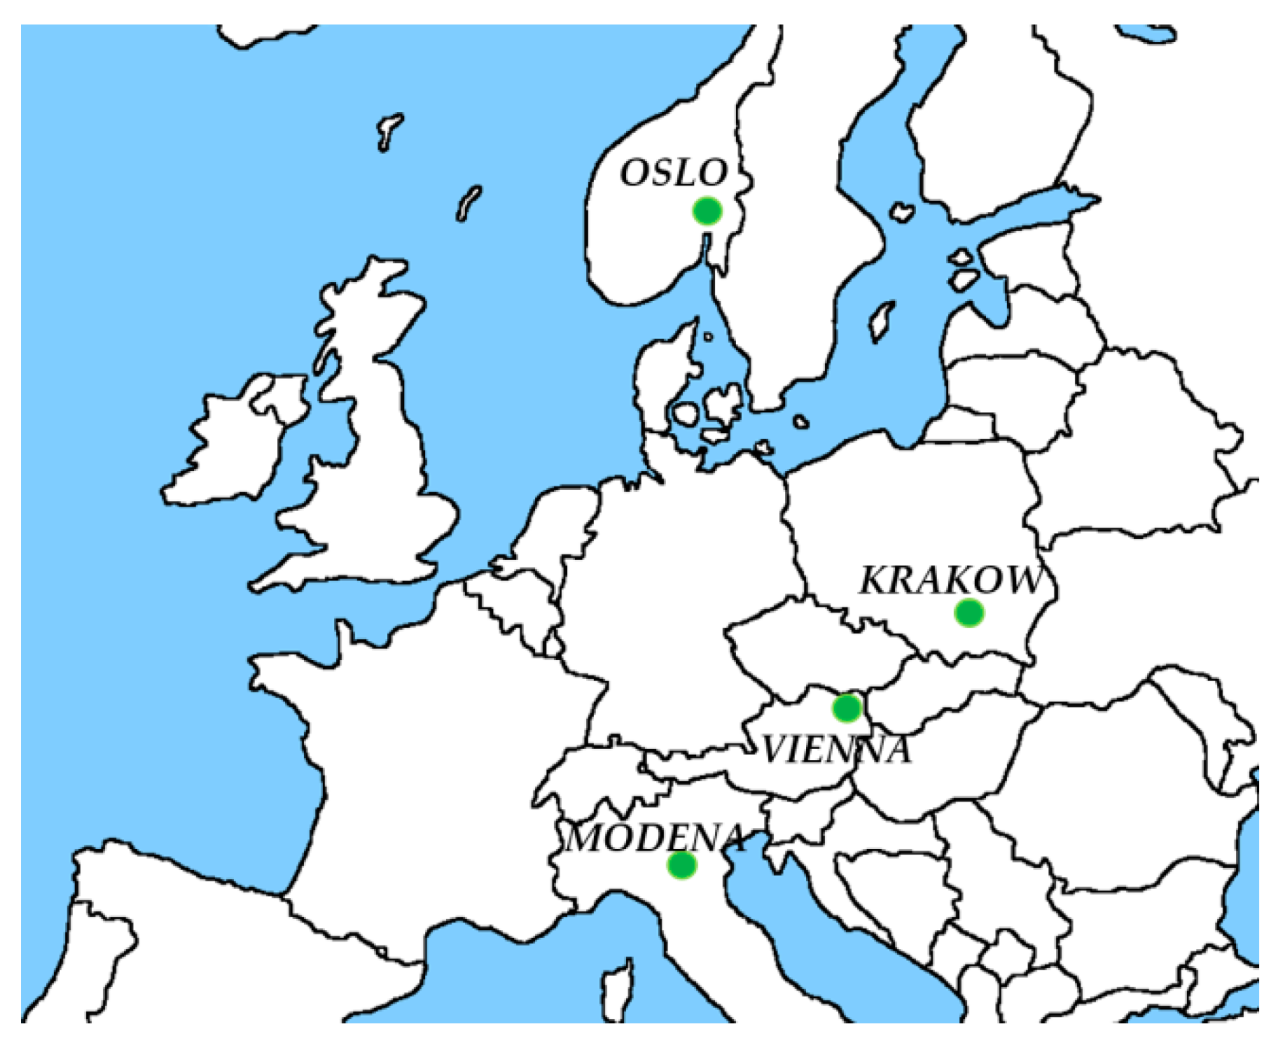
An analysis of the impact of the building location on its energy management and heat exchange with the ground was planned as a part of this study. Due to the pilot nature of the analysis, 4 locations were selected (
Figure 3): Krakow (Poland), Oslo (Norway), Vienna (Austria), and Modena (Italy).
For each of the locations, an analysis of the variability of thermal and humidity conditions inside the broiler house and the formation of ground temperature under the building and in its immediate vicinity was carried out. The results obtained were then used to calculate the energy demand of the building for heating and heat exchange with the ground. A computational analysis was performed based on the numerical method of elementary balances (MEB).
The idea of the elementary balance method is to divide a complex area into cuboidal balance–difference elements. This process is called model discretization. For each balance–difference element, energy and temperature balance calculations are performed assuming a time step. The heat flux flowing through the analyzed area is calculated in non-stationary terms assuming a time step Δτ (Equation (1)), where
i—element number, Φ
ixiyiz,…—heat flux (heat flows) flowing between elements
ix iy iz and neighboring elements [W].
The heat flux density, which is calculated based on Fourier’s law, is also included in the computational analysis. In the elementary balance method, the equation describing the heat flux can be used for each element adjacent to the center element. The thermal dependent on the direction of heat flow must be calculated for this purpose. In case of stationary heat flow through the balance–difference element, the heat balance ΔQ = 0. For non-stationary flow, consider a temperature rising with the heat gain phenomenon.
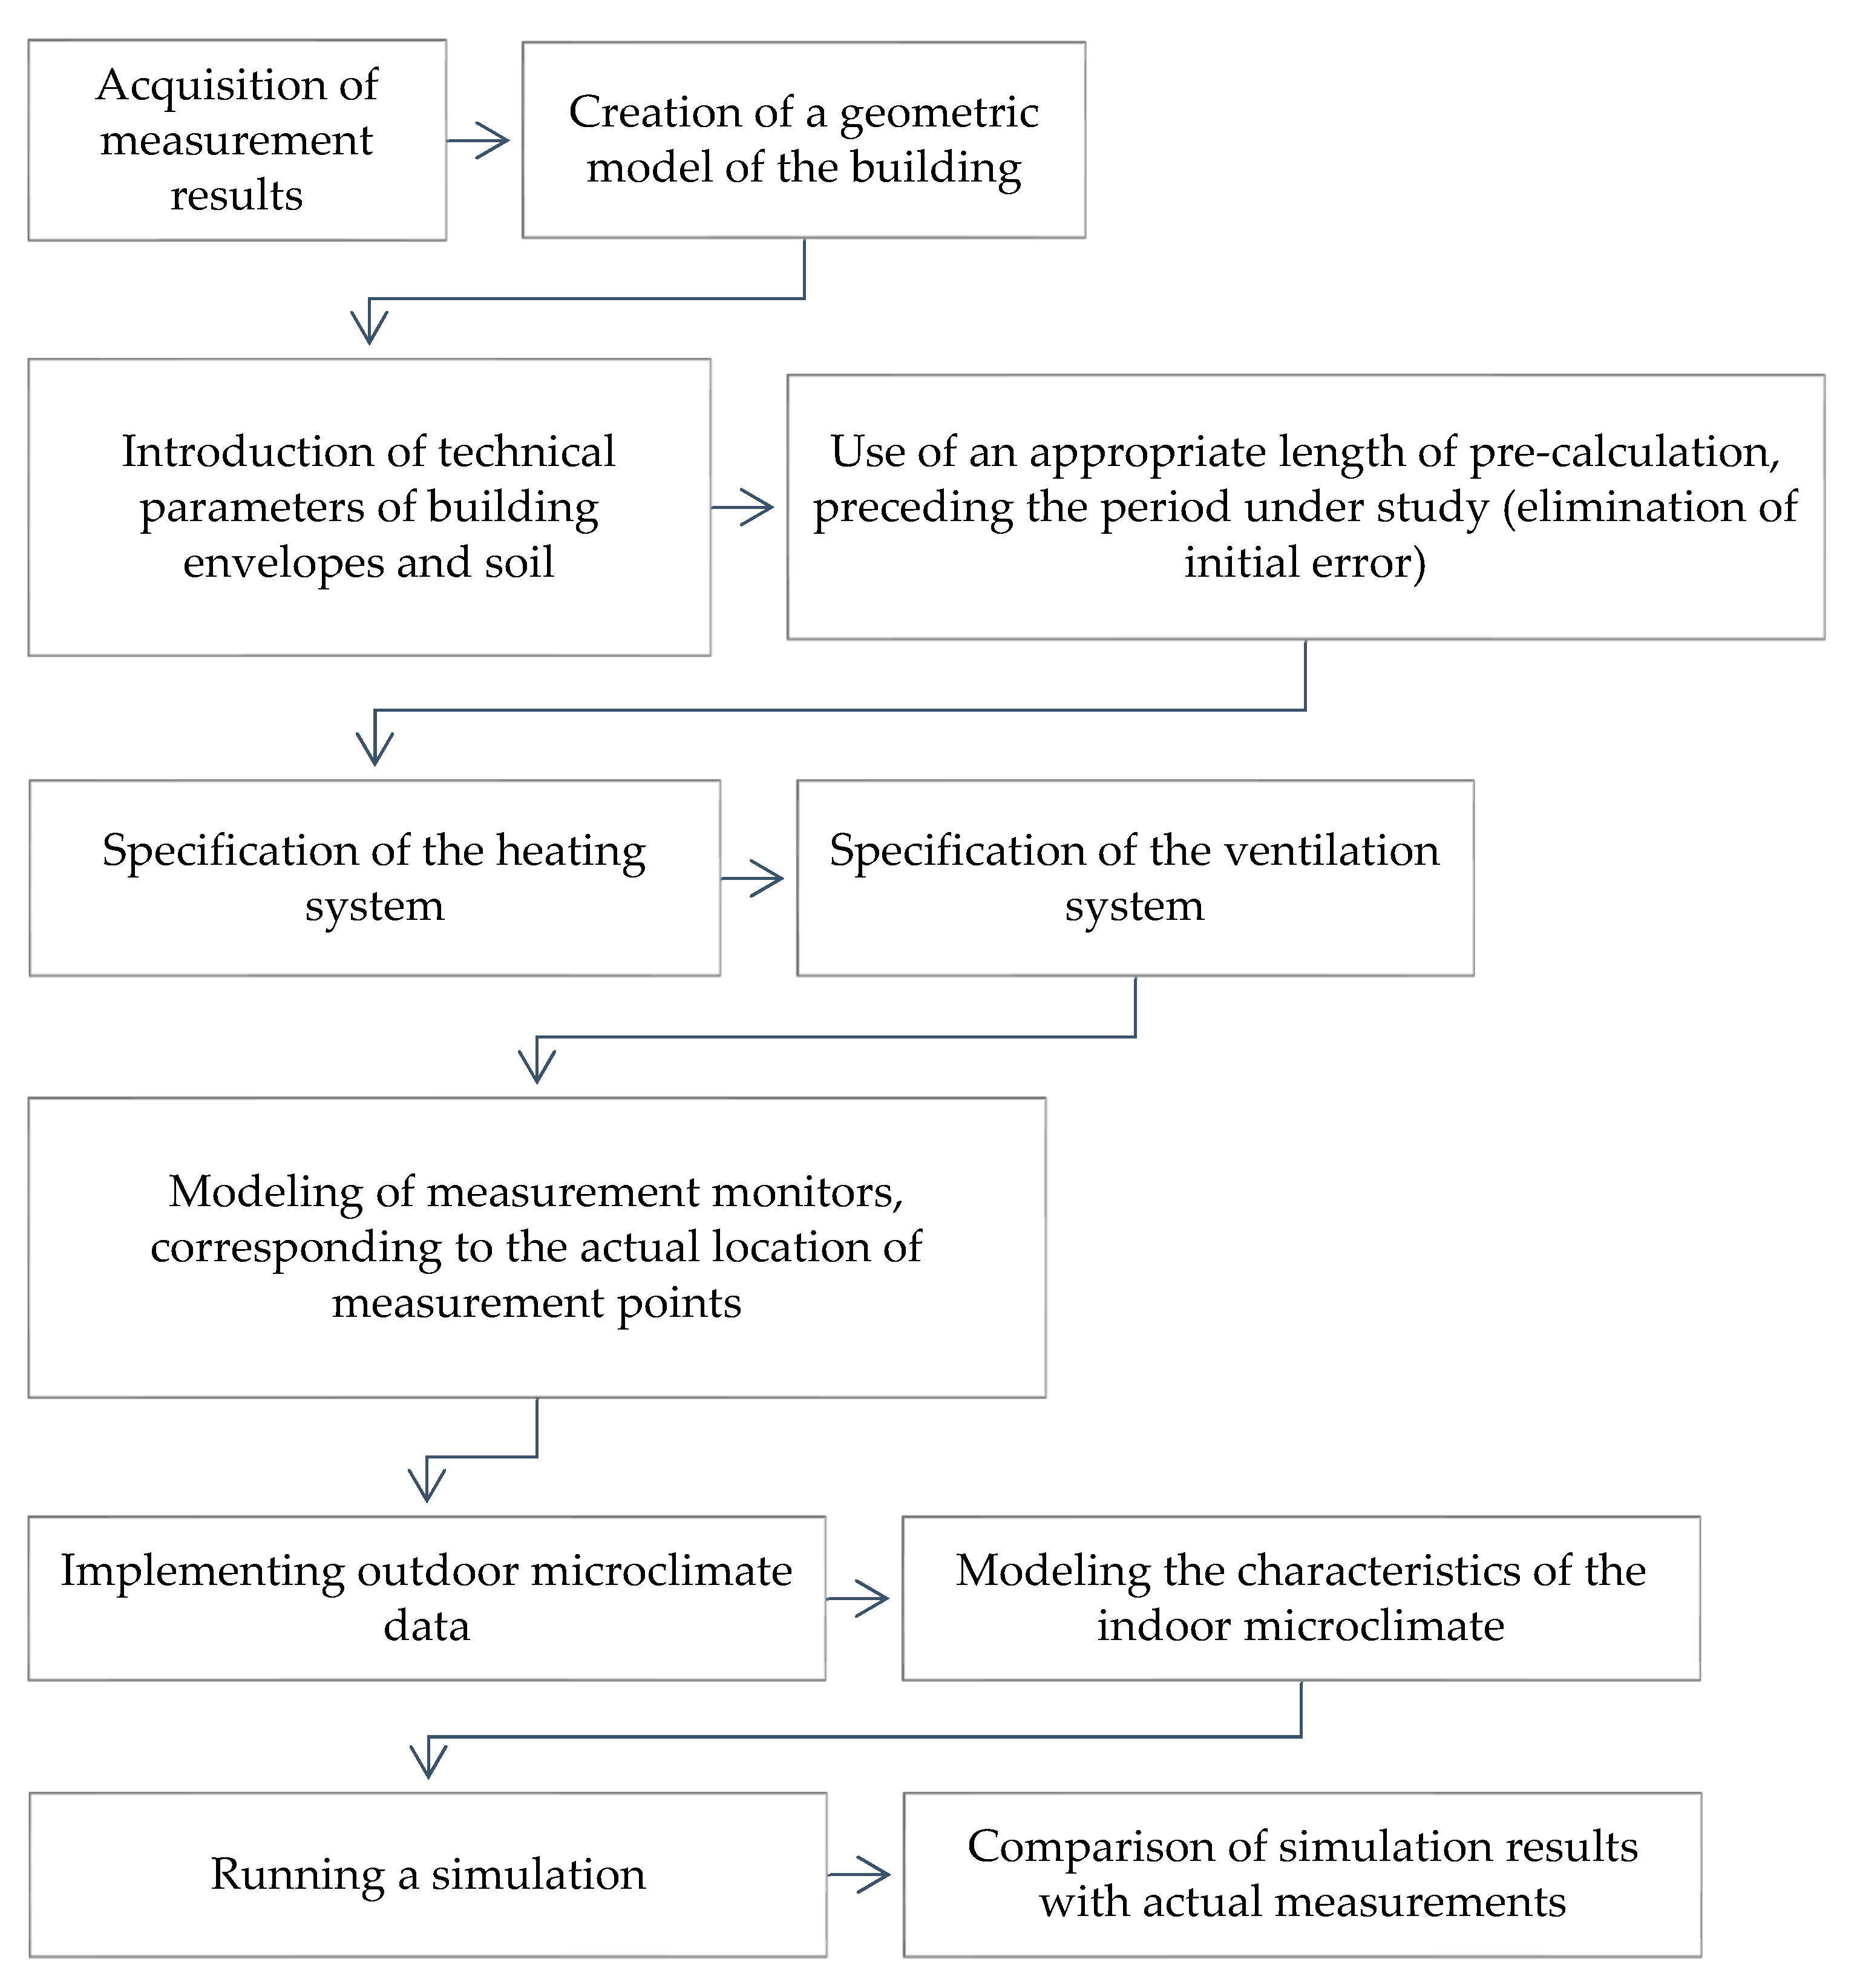
The WUFIplus
® computer software (Ver. 3.2.0.23, IBP Fraunhofer, Germany) was used in order to support the calculation process. The first step in the computational analysis was to validate the computational model. A schematic of the model validation process is shown in
Figure 4.
The geometric model of the study site and the results of field measurements were used in the process of validating the computational model. The external microclimate boundary condition was the reference meteorological year (test reference year—TRY) for Krakow (Poland). A minimum air exchange of 1.0 h−1 was adopted in order to meet the basic hygienic requirements of the interior of the modeled building. The indoor air temperature was maintained through a modeled heating system. The purpose of the heating system was to maintain a set indoor air temperature based on measured, actual data. The necessity of using real measurement data is due to the specifics of the building, where heating follows the course of production cycles. During process breaks, between production cycles, the heating is switched off, or its output is significantly reduced (during winter time). If the set indoor air temperature is exceeded, the model includes the ability to increase the ventilation rate to 5.0 h−1.
In order to perform the calculations, the technical parameters of the building envelope and the soil had to be taken into account (
Table 1). The computational model requires preliminary calculations, assuming an initial ground temperature. The initial ground temperature corresponded to the average annual outdoor air temperature for each of the study locations (Krakow, Vienna, Oslo, and Modena). The initial calculation period was assumed to be during the six months preceding the actual measurement series. This procedure eliminates the occurrence of an initial error of a significant discrepancy between the measurement results and the simulation results.
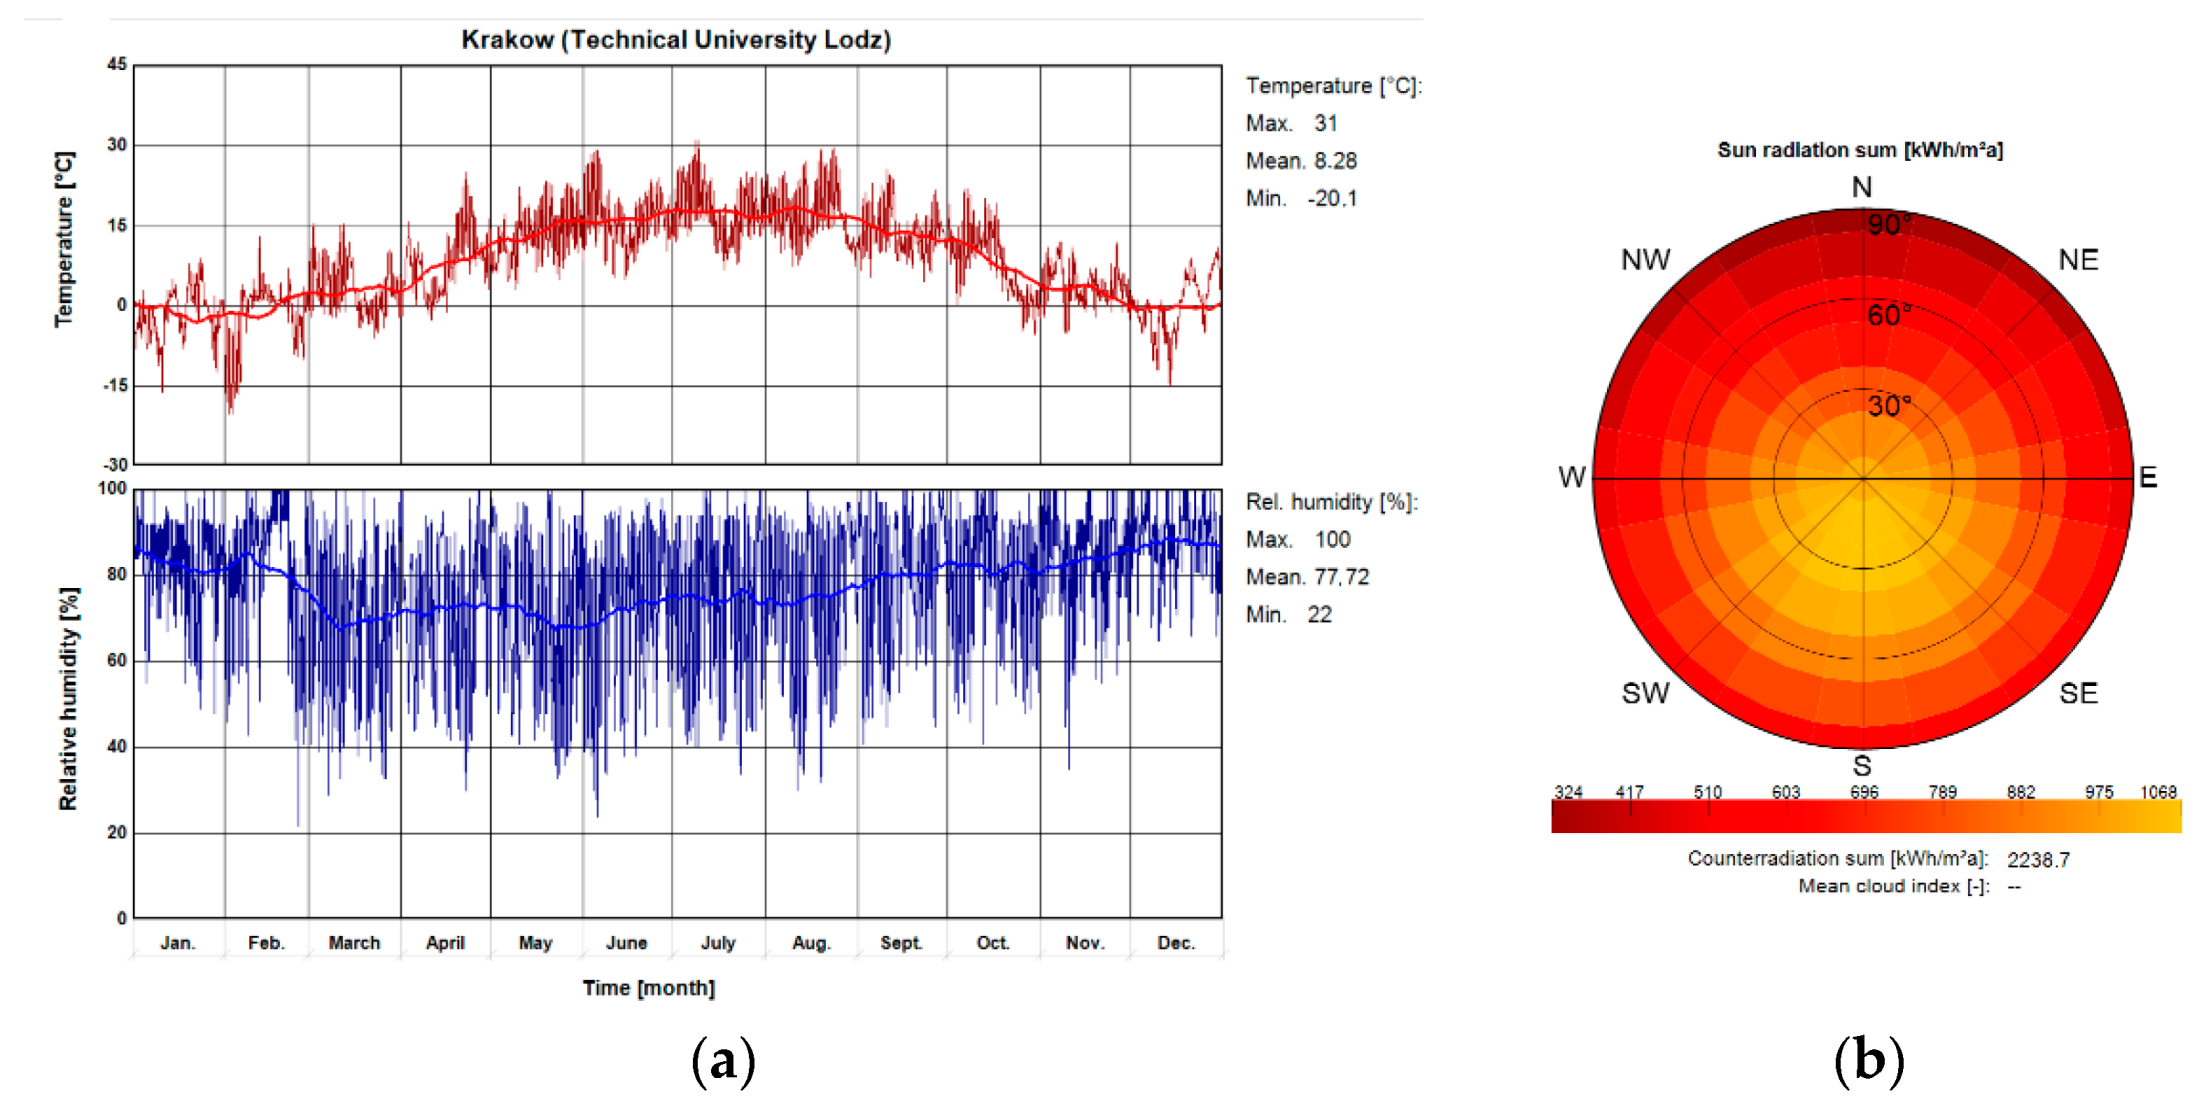
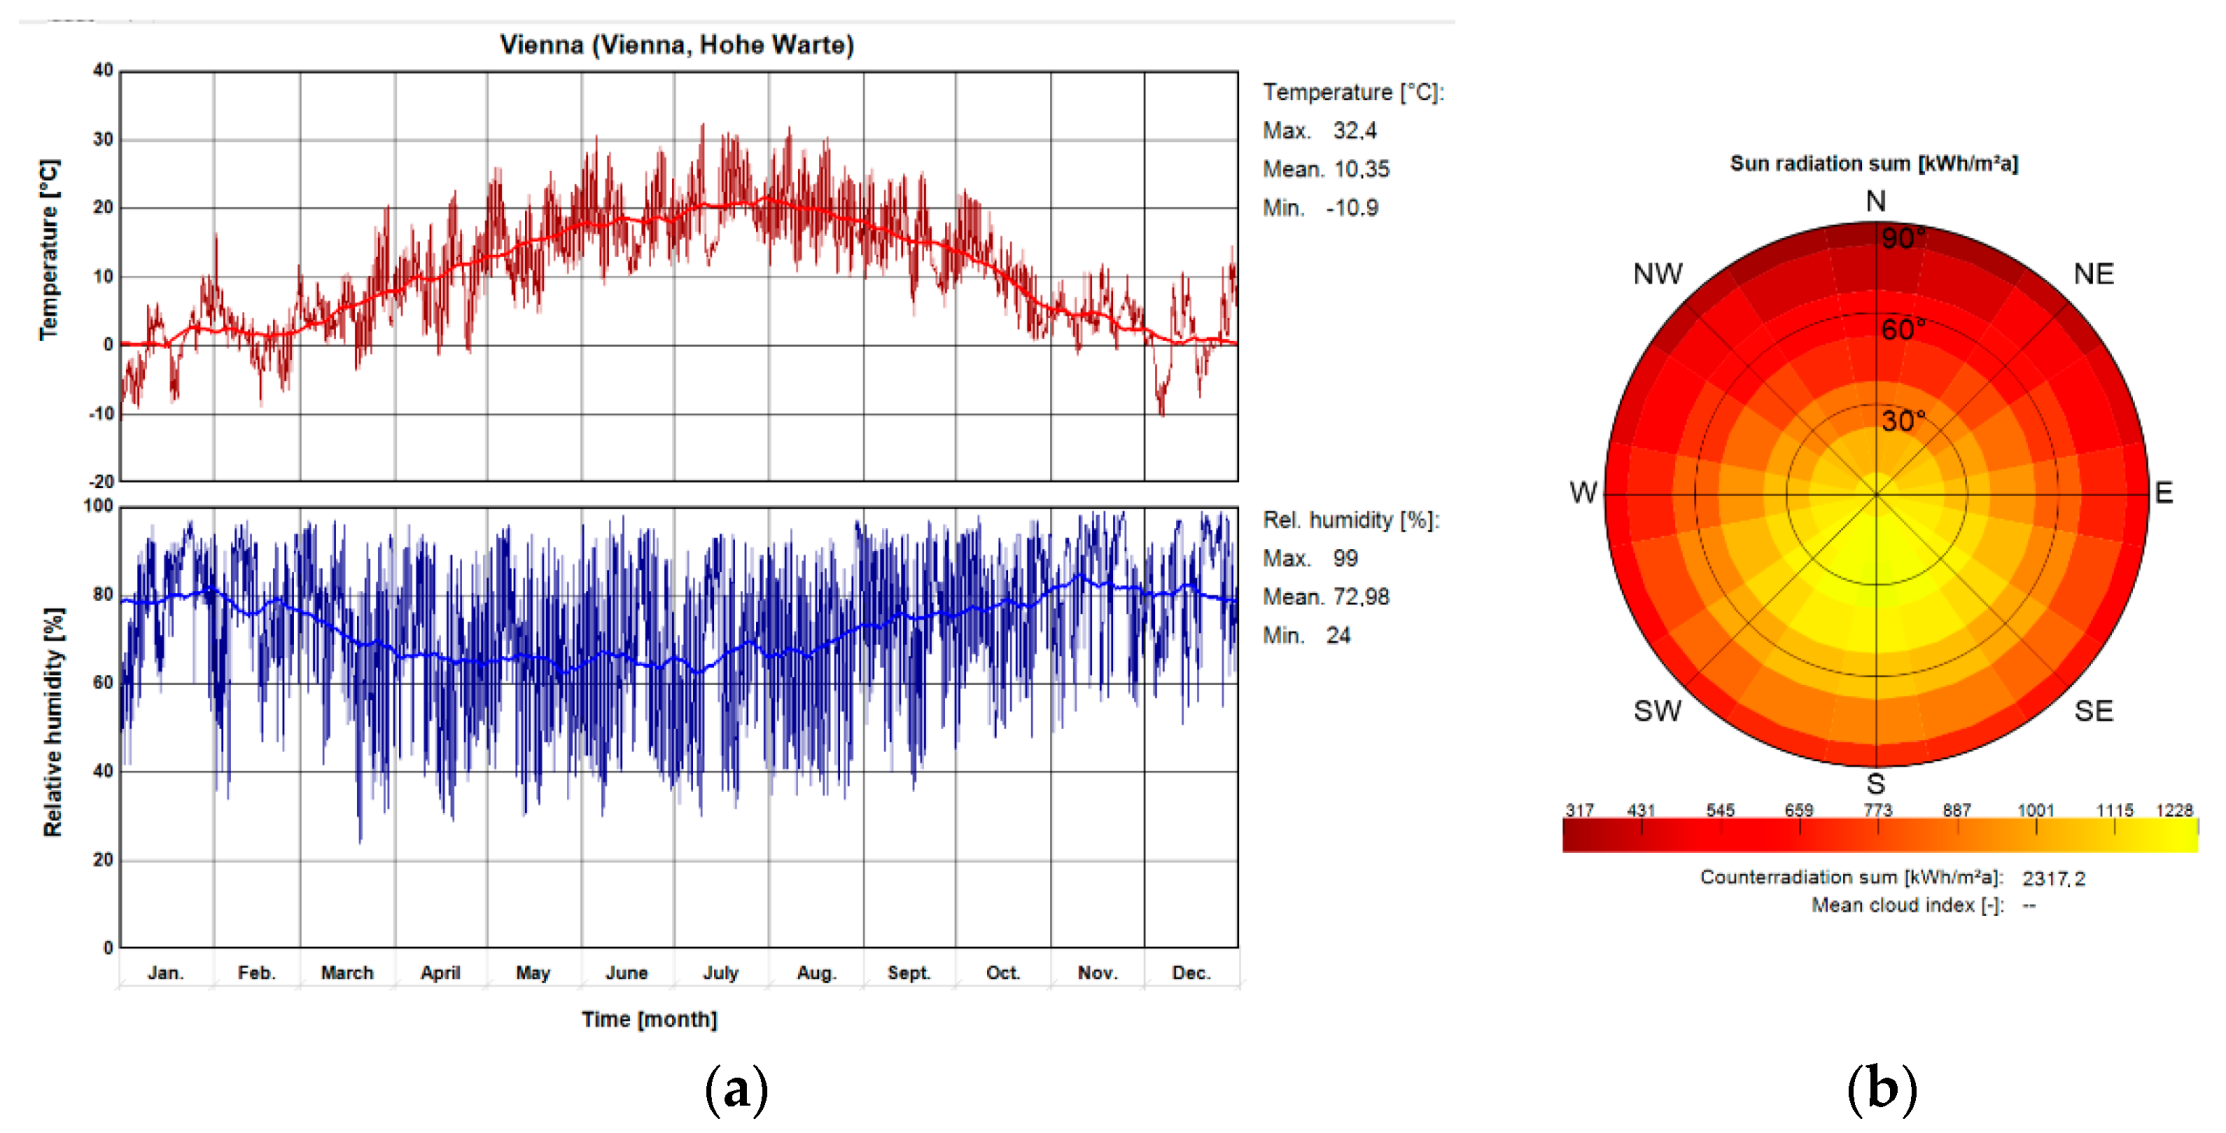
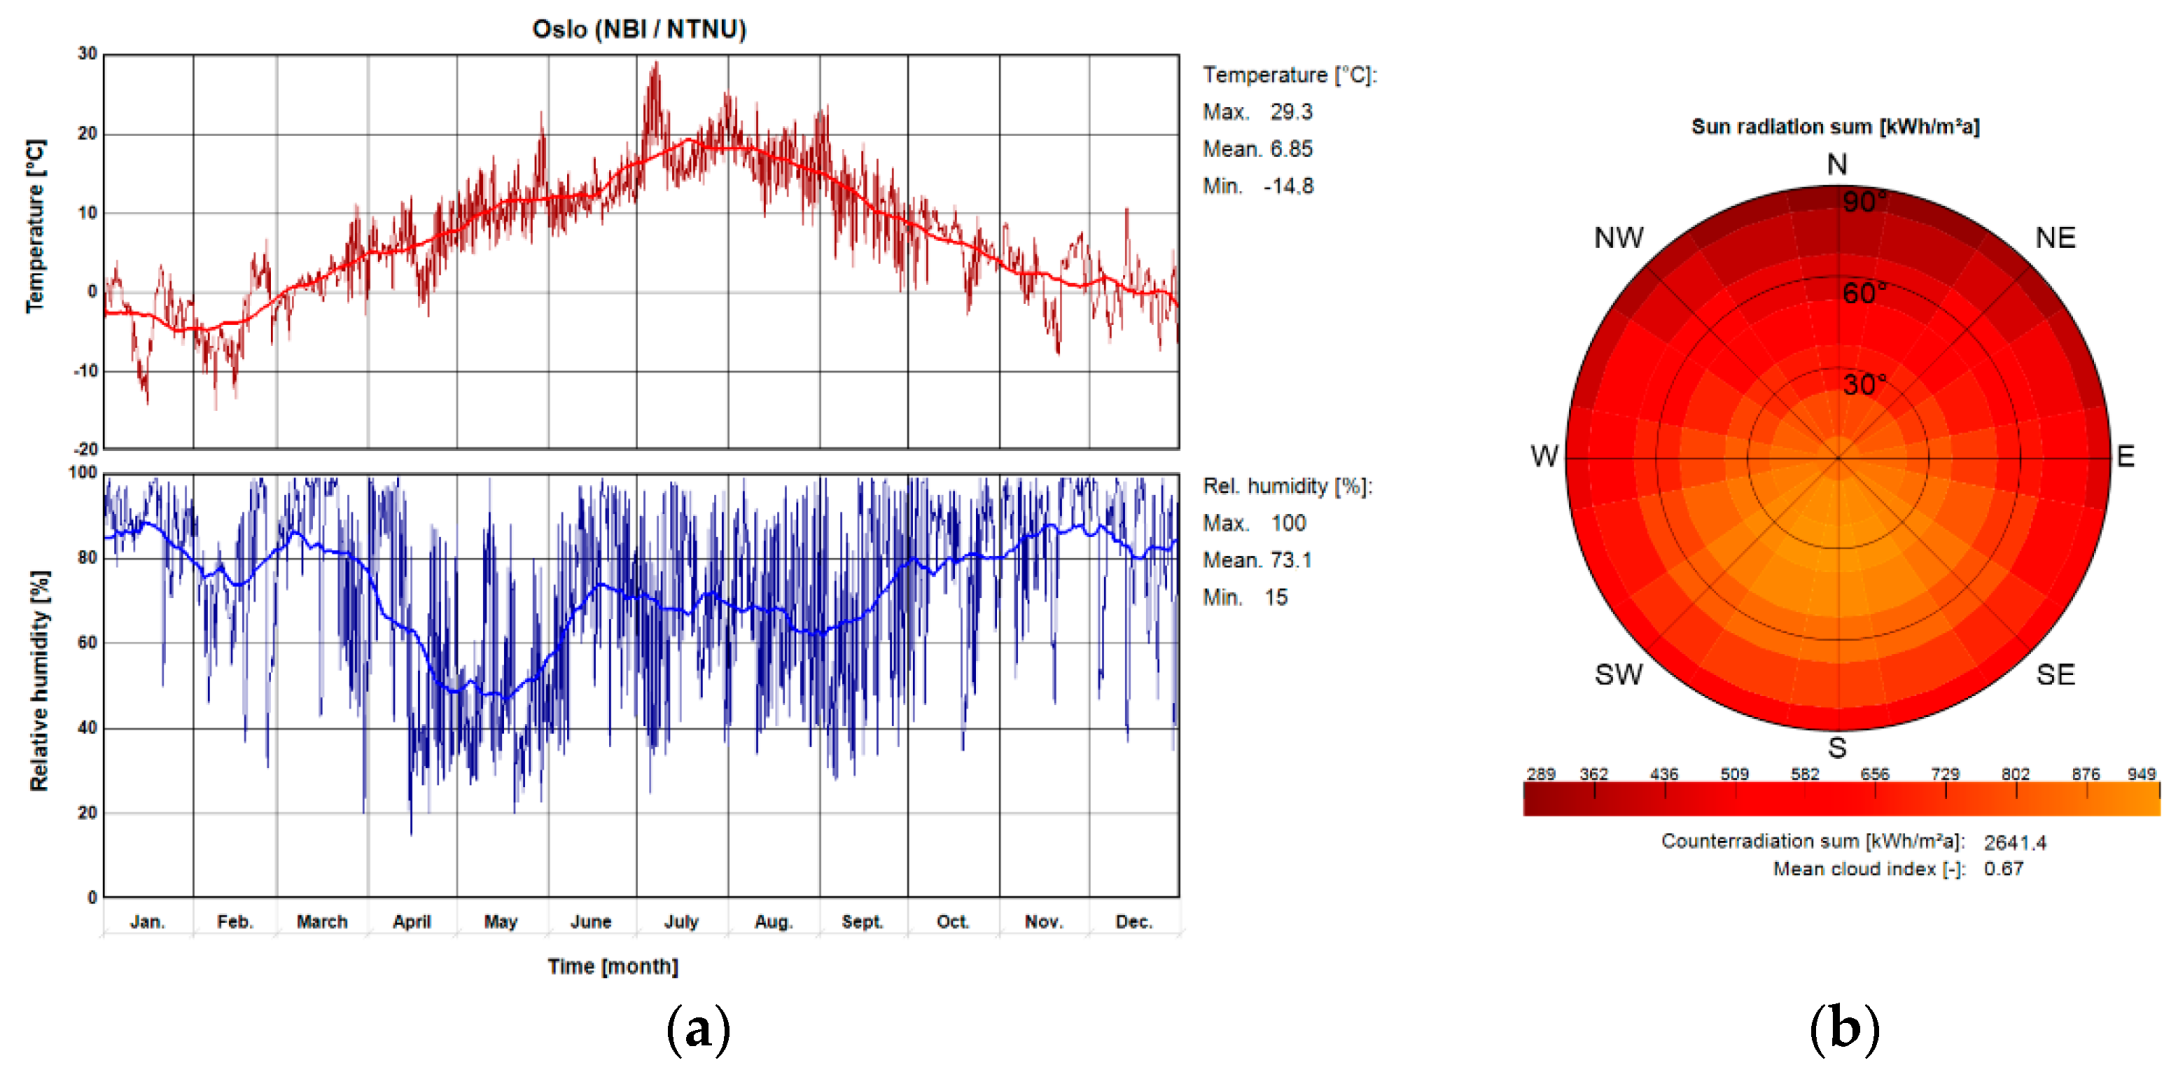
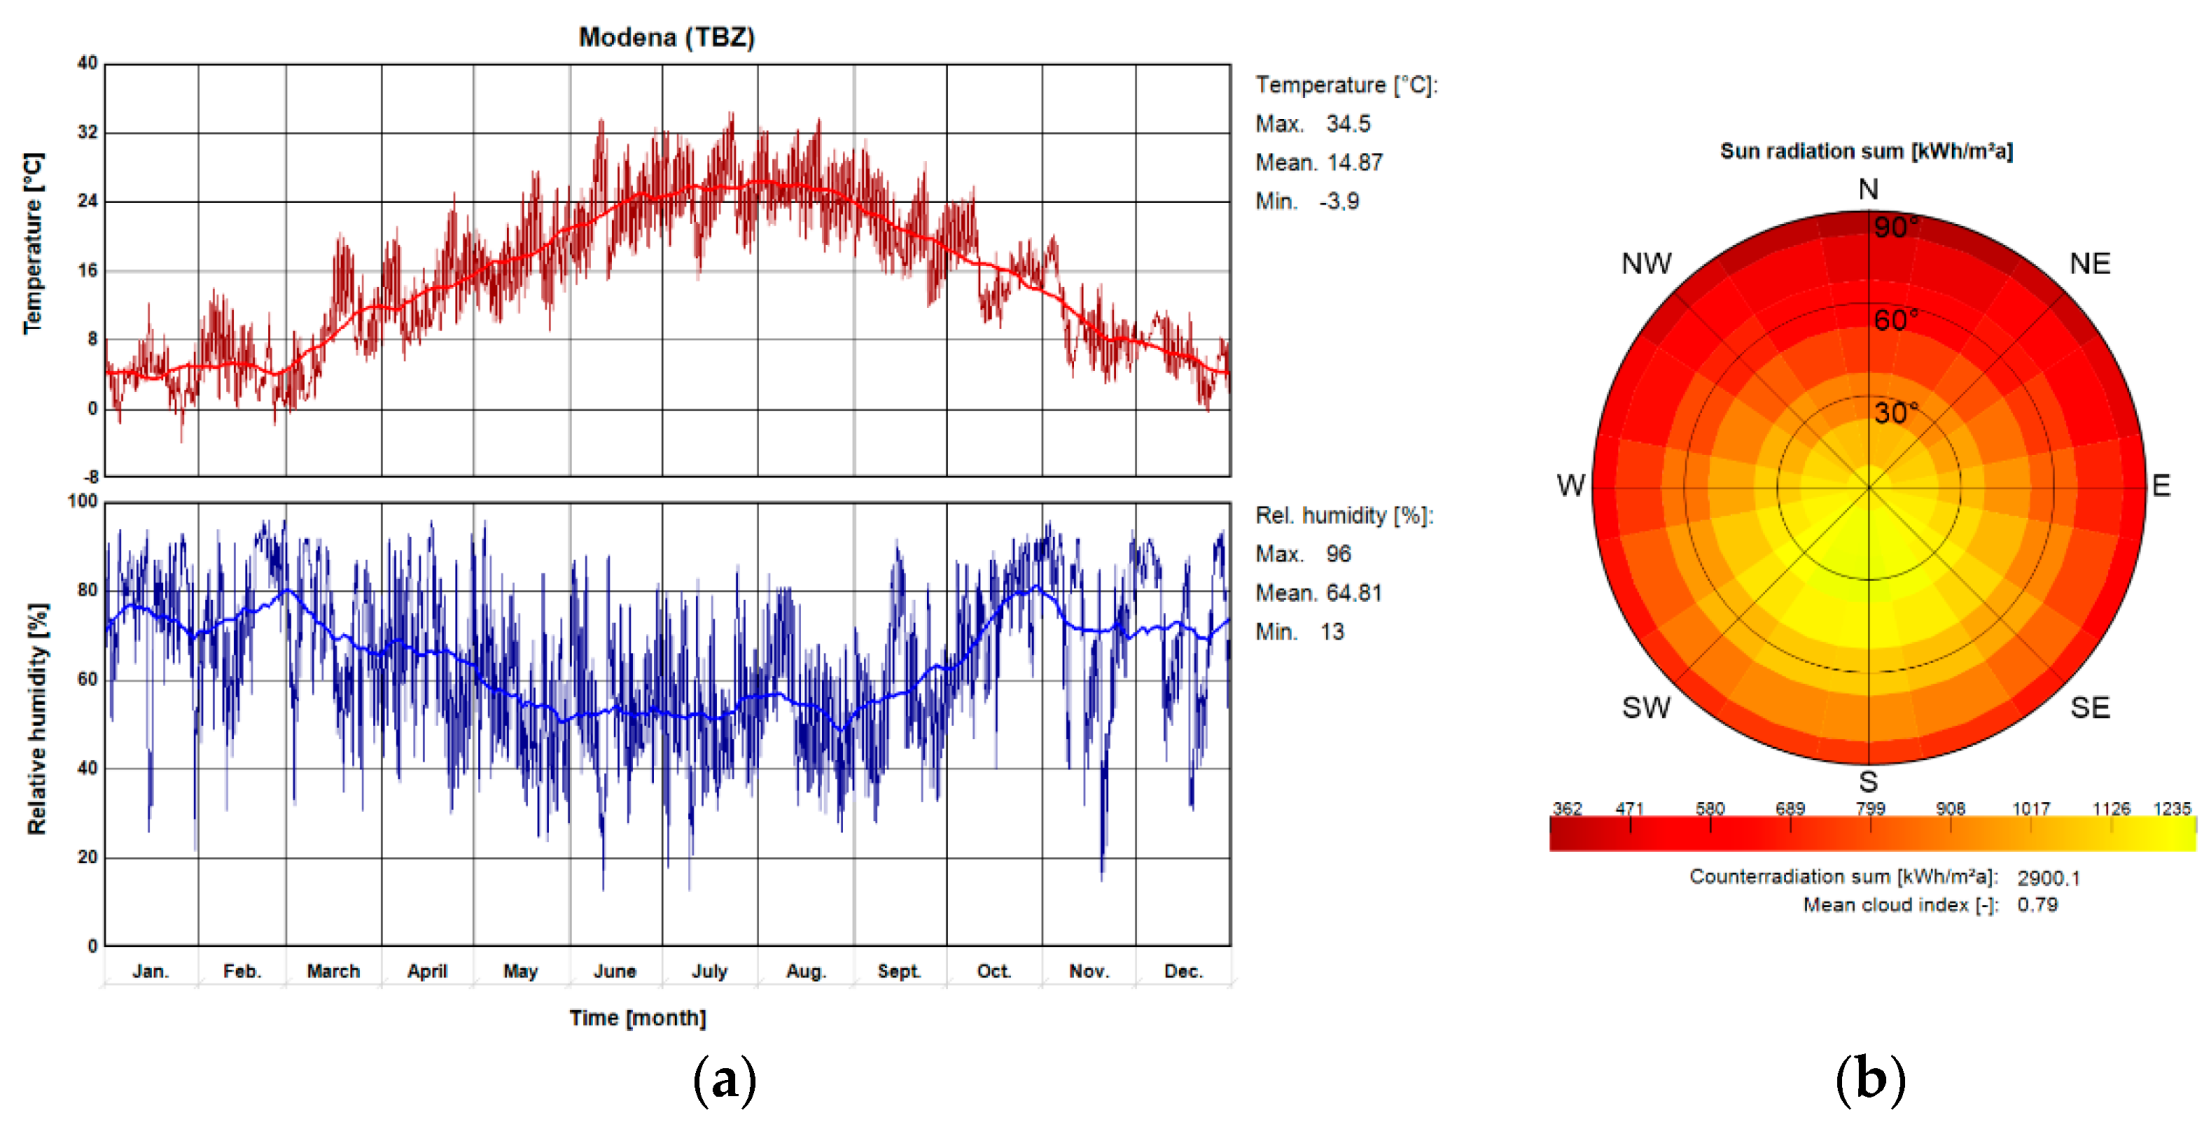
The validated computational model was used to calculate broiler house energy management and ground heat transfer for the previously mentioned four locations. The TRY for these locations should have been used for this purpose. Key climate parameters considered in the simulations, for each of the locations used, are presented in
Figure 5,
Figure 6,
Figure 7 and
Figure 8.
In order to enable clear presentation of the results in graphical form, each point was assigned an abbreviation of the location to which it refers, i.e., Krakow—KR, Oslo—OS, Vienna—VI, and Modena—MO. The heat exchange intensity was calculated based on Formula (2), where Θ
i—the indoor air temperature, [K], Θ
p—floor temperature, linearly interpolated between measurement points 1 and 5, [K],
λp floor thermal conductivity coefficient, assumed 2.30 W/mK, [EN ISO 6946], and
Rsi—penetration resistance from the internal side of the floor, assumed 0.14 m
2K/W.
Validation results and simulation results were statistically analyzed using basic statistics and Shapiro–Wilk test, Spearman’s Yang correlation, and Kruskal–Wallis significance of differences test (p ≤ 0.05).
3. Results
3.1. Validation of the Computational Model
A validation of the computational model was performed based on the measured data. Data verification showed no normality of distribution. The correlation of measured results and simulation results for points 4, 8, and 12 was very strong, with a coefficient of 0.94. For points located at a shallower depth, i.e., 1, 5, and 9, a very strong correlation of 0.87 was also found. Comparison of calculated and actual data showed no statistically significant (
p ≥ 0.05) differences.
Figure 9 shows the floor and ground temperature waveforms for selected measurement points.
3.2. The Impact of a Building’s Location on Its Energy Management
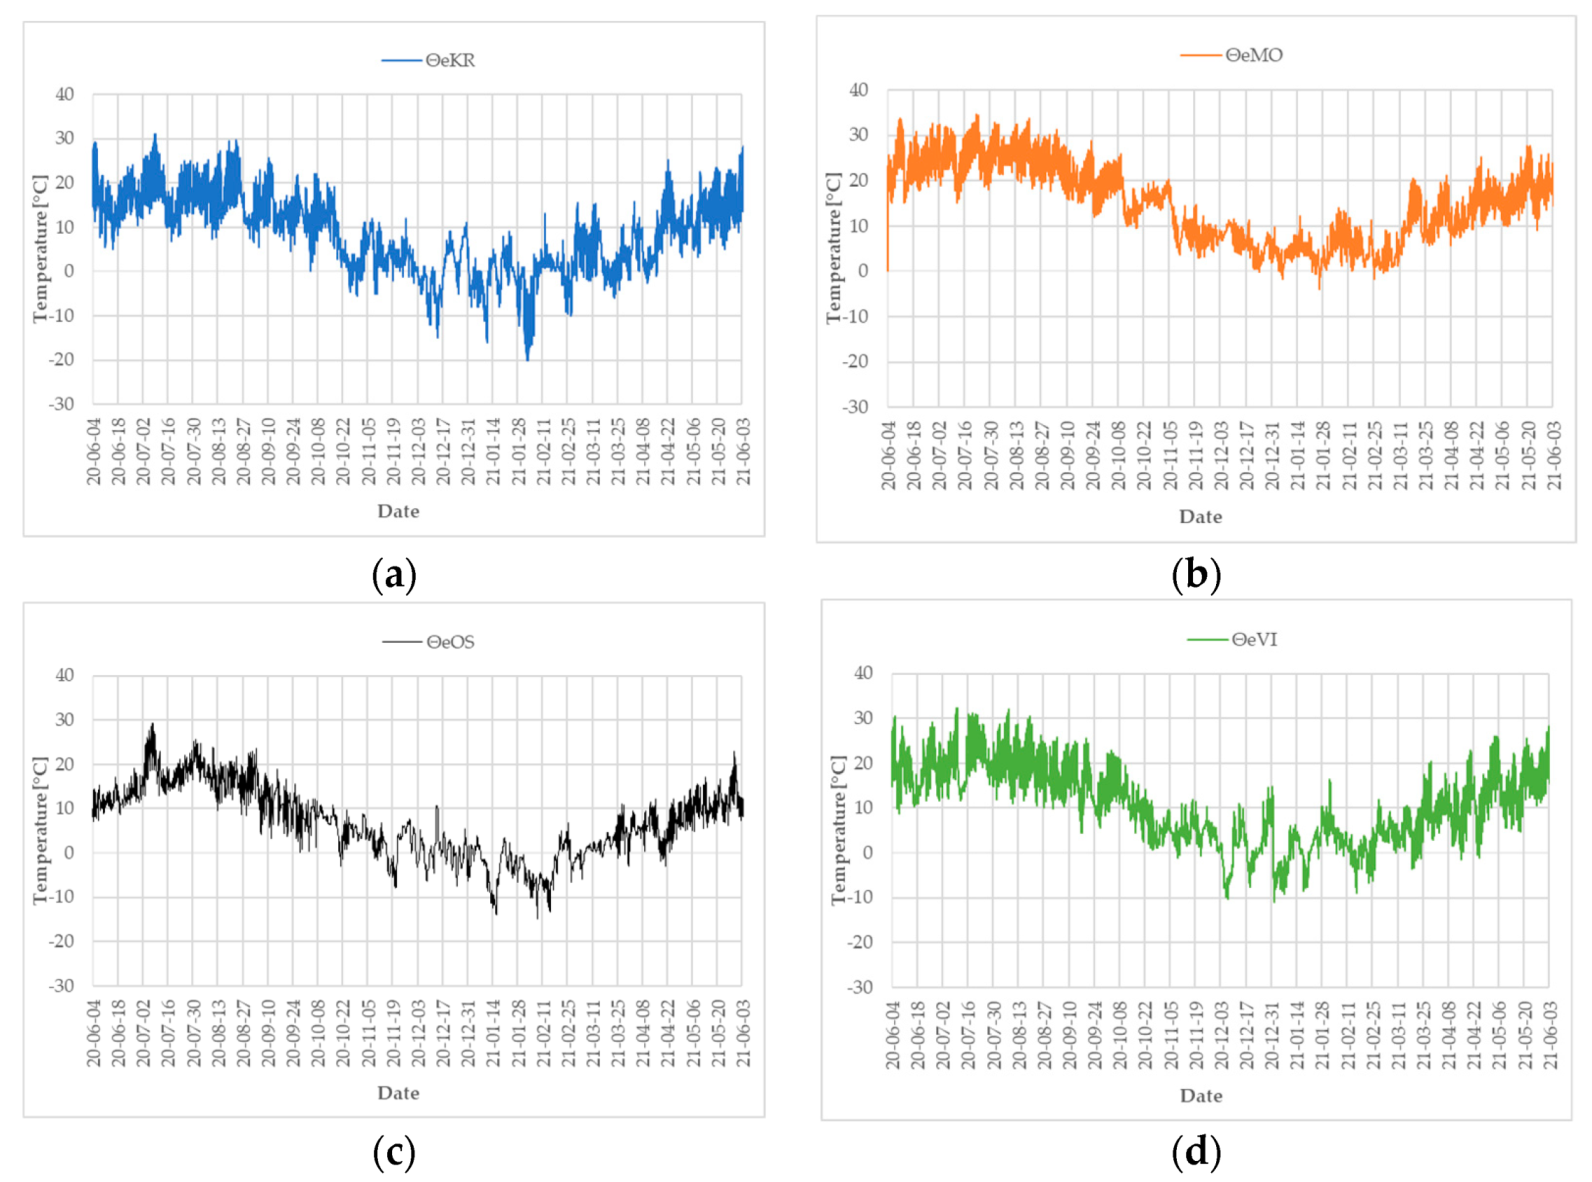
After validating the computational model, a series of simulations with TRY were conducted for Krakow (KR), Vienna (VI), Oslo (OS), and Modena (MO). Analysis of the outdoor air temperature waveforms at these locations (
Figure 10) revealed statistically significant (
p ≤ 0.05) differences. The highest maximum outdoor air temperature was found in Modena (34.5 °C), with 31.0 °C in Krakow, 32.4 °C in Vienna, and 29.3 °C in Oslo. The analysis also showed that the highest outdoor air temperature amplitude can be observed in Krakow (51.1 K), while the lowest was in Modena (38.4 K). In Oslo, the outdoor air temperature annual amplitude value was 44.1 K, and in Vienna it was 43.3 K.
The characteristics of a building’s heating needs are strongly correlated with the outdoor climate affecting the building. In particular, periods when the outside air temperature falls below 0.0 °C are important because the heating demand increases significantly under such conditions. The analysis of outdoor climate for the studied locations showed significant differences in the number of hours and days when outdoor air temperature is <0.0 °C. In Krakow, 1383 h (58 days) were recorded in which the outdoor air temperature fell below 0.0 °C. In Modena, this period was much shorter at 53 h (3 days), while in Vienna, it was 864 h (36 days). The longest period in which the outdoor air temperature value was below 0.0 °C was found in Oslo (1801 h, 75 days).
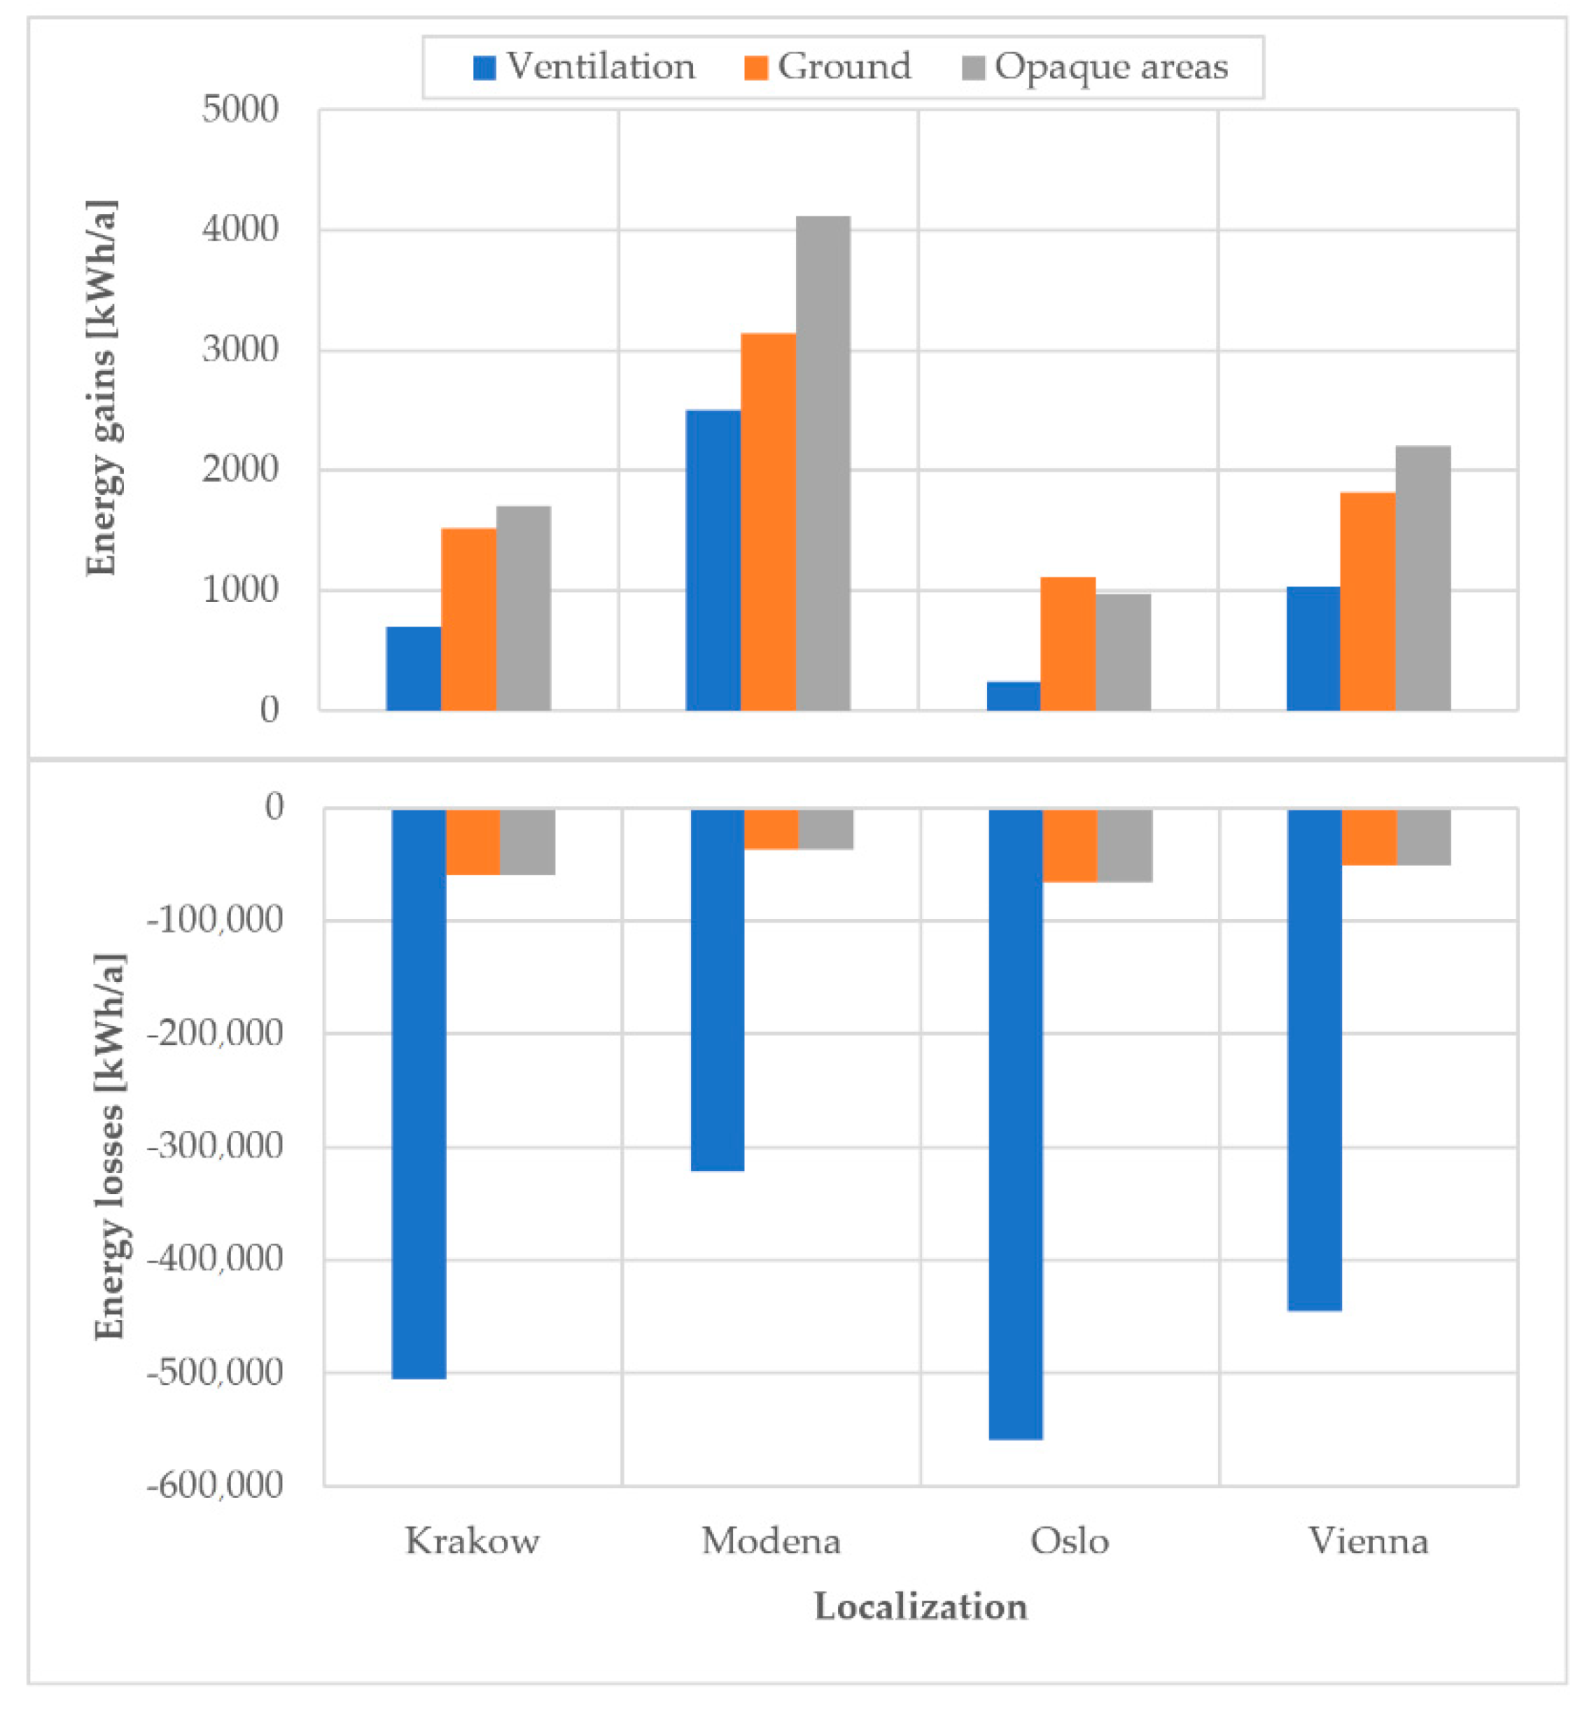
The variation in outdoor microclimate significantly affected the energy flow through the building envelope and ventilation system (
Figure 11).
The highest energy gains through non-transparent envelopes were found for the building located in Modena (4112.8 kWh/a). This was mainly due to the significantly higher solar irradiance, which was 2900.1 kWh/m2a at this location, compared to the other locations studied. The analysis of the results for Krakow and Vienna showed that the highest energy gains through external envelopes were about two times lower compared to the building located in Italy. The lowest values of energy gains from the external environment were recorded for the building located in Oslo. It should also be noted that, in this location, the best source of heat gain was the ground, which provided 135.7 kWh/a more energy to the building interior compared to the energy gains provided by the envelope. The issue of soil participation in heat transfer will be described in the next section. Due to the requirements to maintain the temperature in the building within certain ranges of values, depending on the rearing cycle week, the ventilation system was the largest contributor to energy losses. The highest energy loss through ventilation was found for the building located in Oslo (559,056.8 kWh/a).
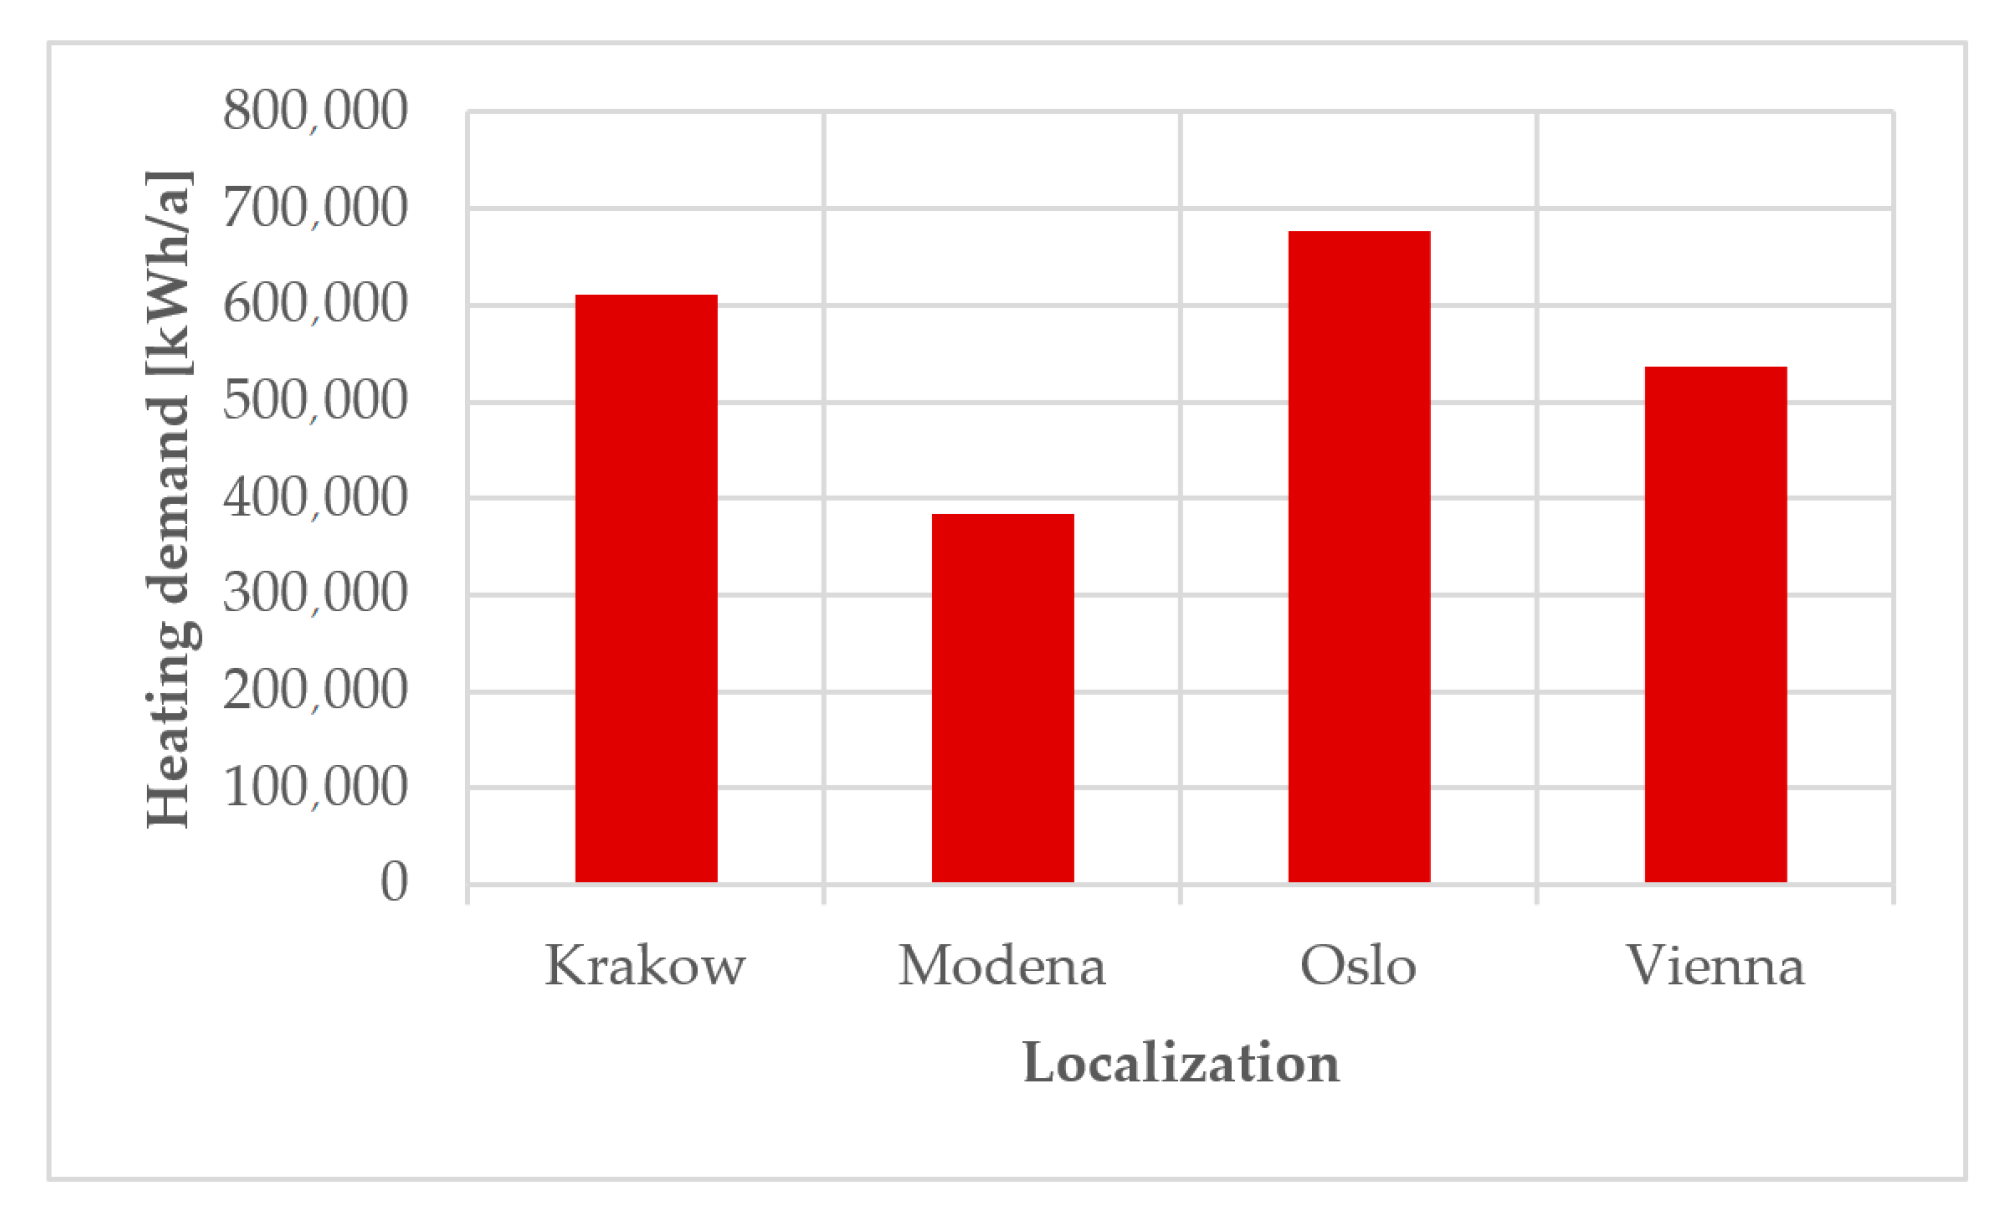
The effect of the location of the studied broiler house is also reflected in the year-round heat load (
Figure 12). Assuming the same technical parameters of the envelope and the same technological processes, it can be observed that the highest energy needs for heating were in Oslo (677,207.2 kWh/a). Relocating this site to Modena showed a decrease in heating energy demand by 292,613.7 kWh/a (43% lower demand).
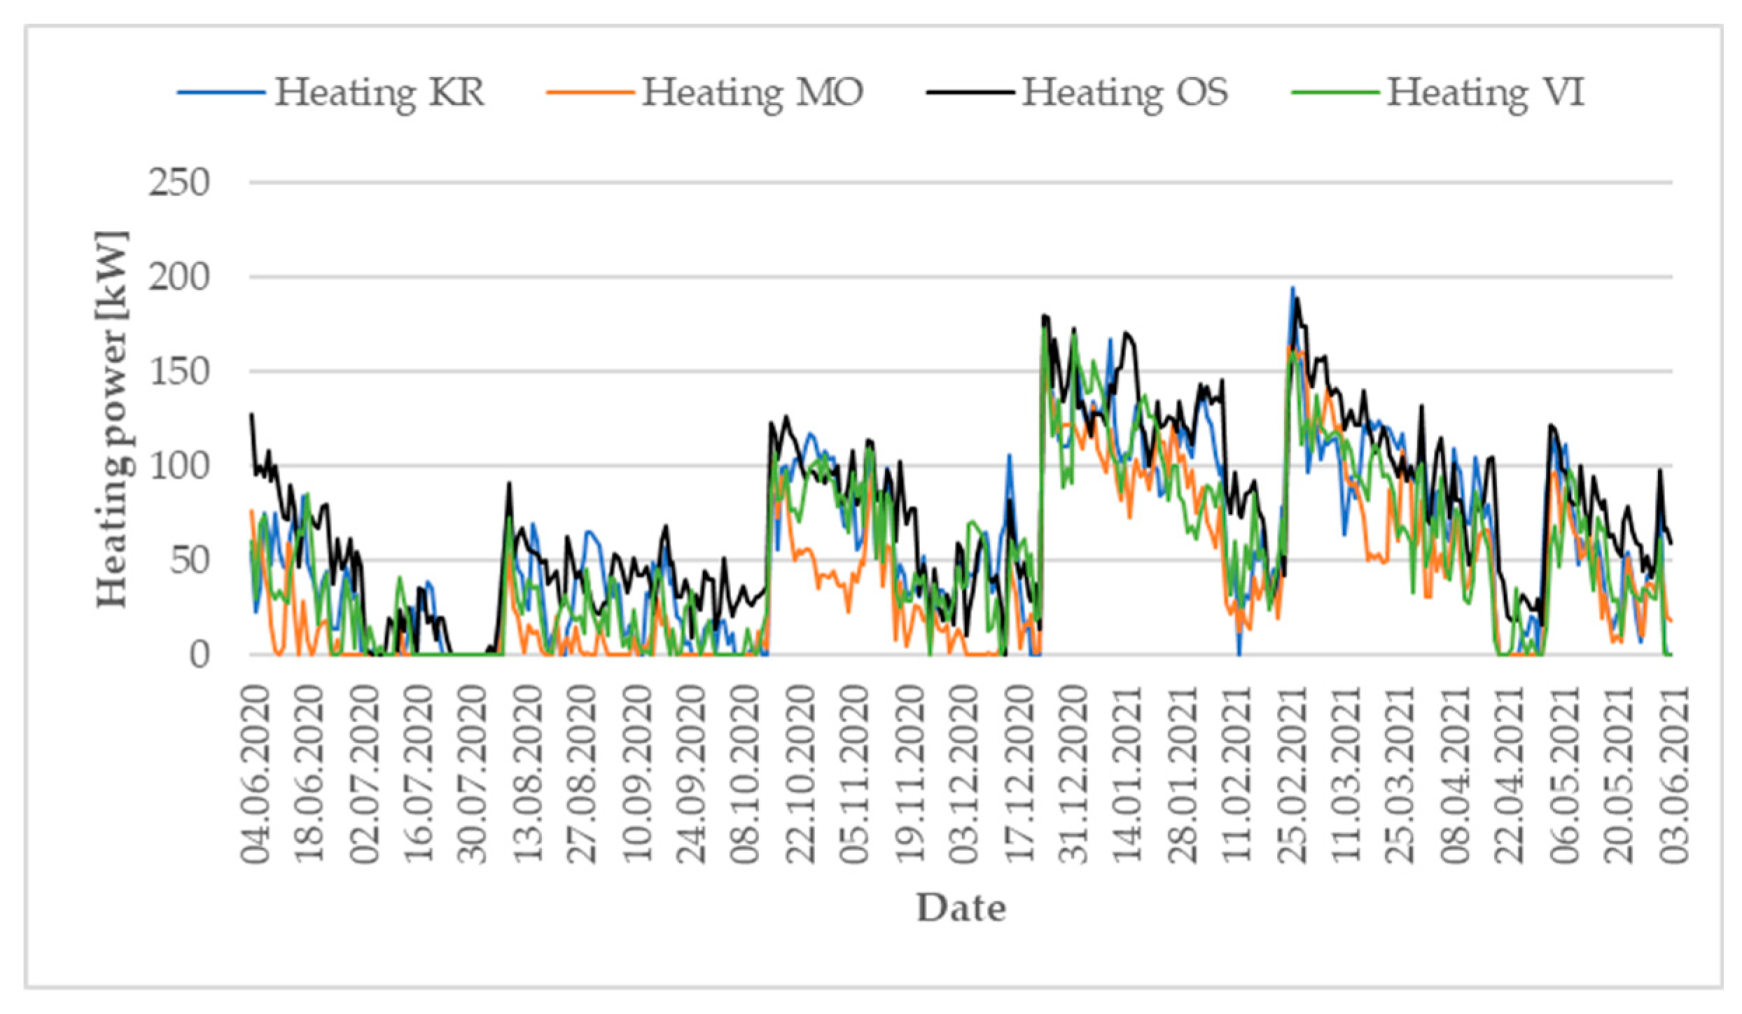
The large variation in year-round energy demand for heating does not directly translate into the peak heating power needed to achieve the assumed indoor thermal conditions. The highest energy demand is present at the very beginning of the production cycle. The heating system is then activated to achieve optimal thermal conditions in the first days of chicken rearing (
Figure 13).
The analysis of the test results showed that the highest heating power should be provided in the building located in Oslo, which should be 219.3 kW. However, the results for Krakow and Vienna did not show significantly lower peak heating power demand. In order to ensure an adequate indoor temperature for the studied building, a maximum power of 214.9 kW must be provided in Krakow and 212.3 kW in Vienna. Due to the milder climate characteristics of Modena, the analysis showed that a heating system capacity of 191.6 kW can be assumed for this location.
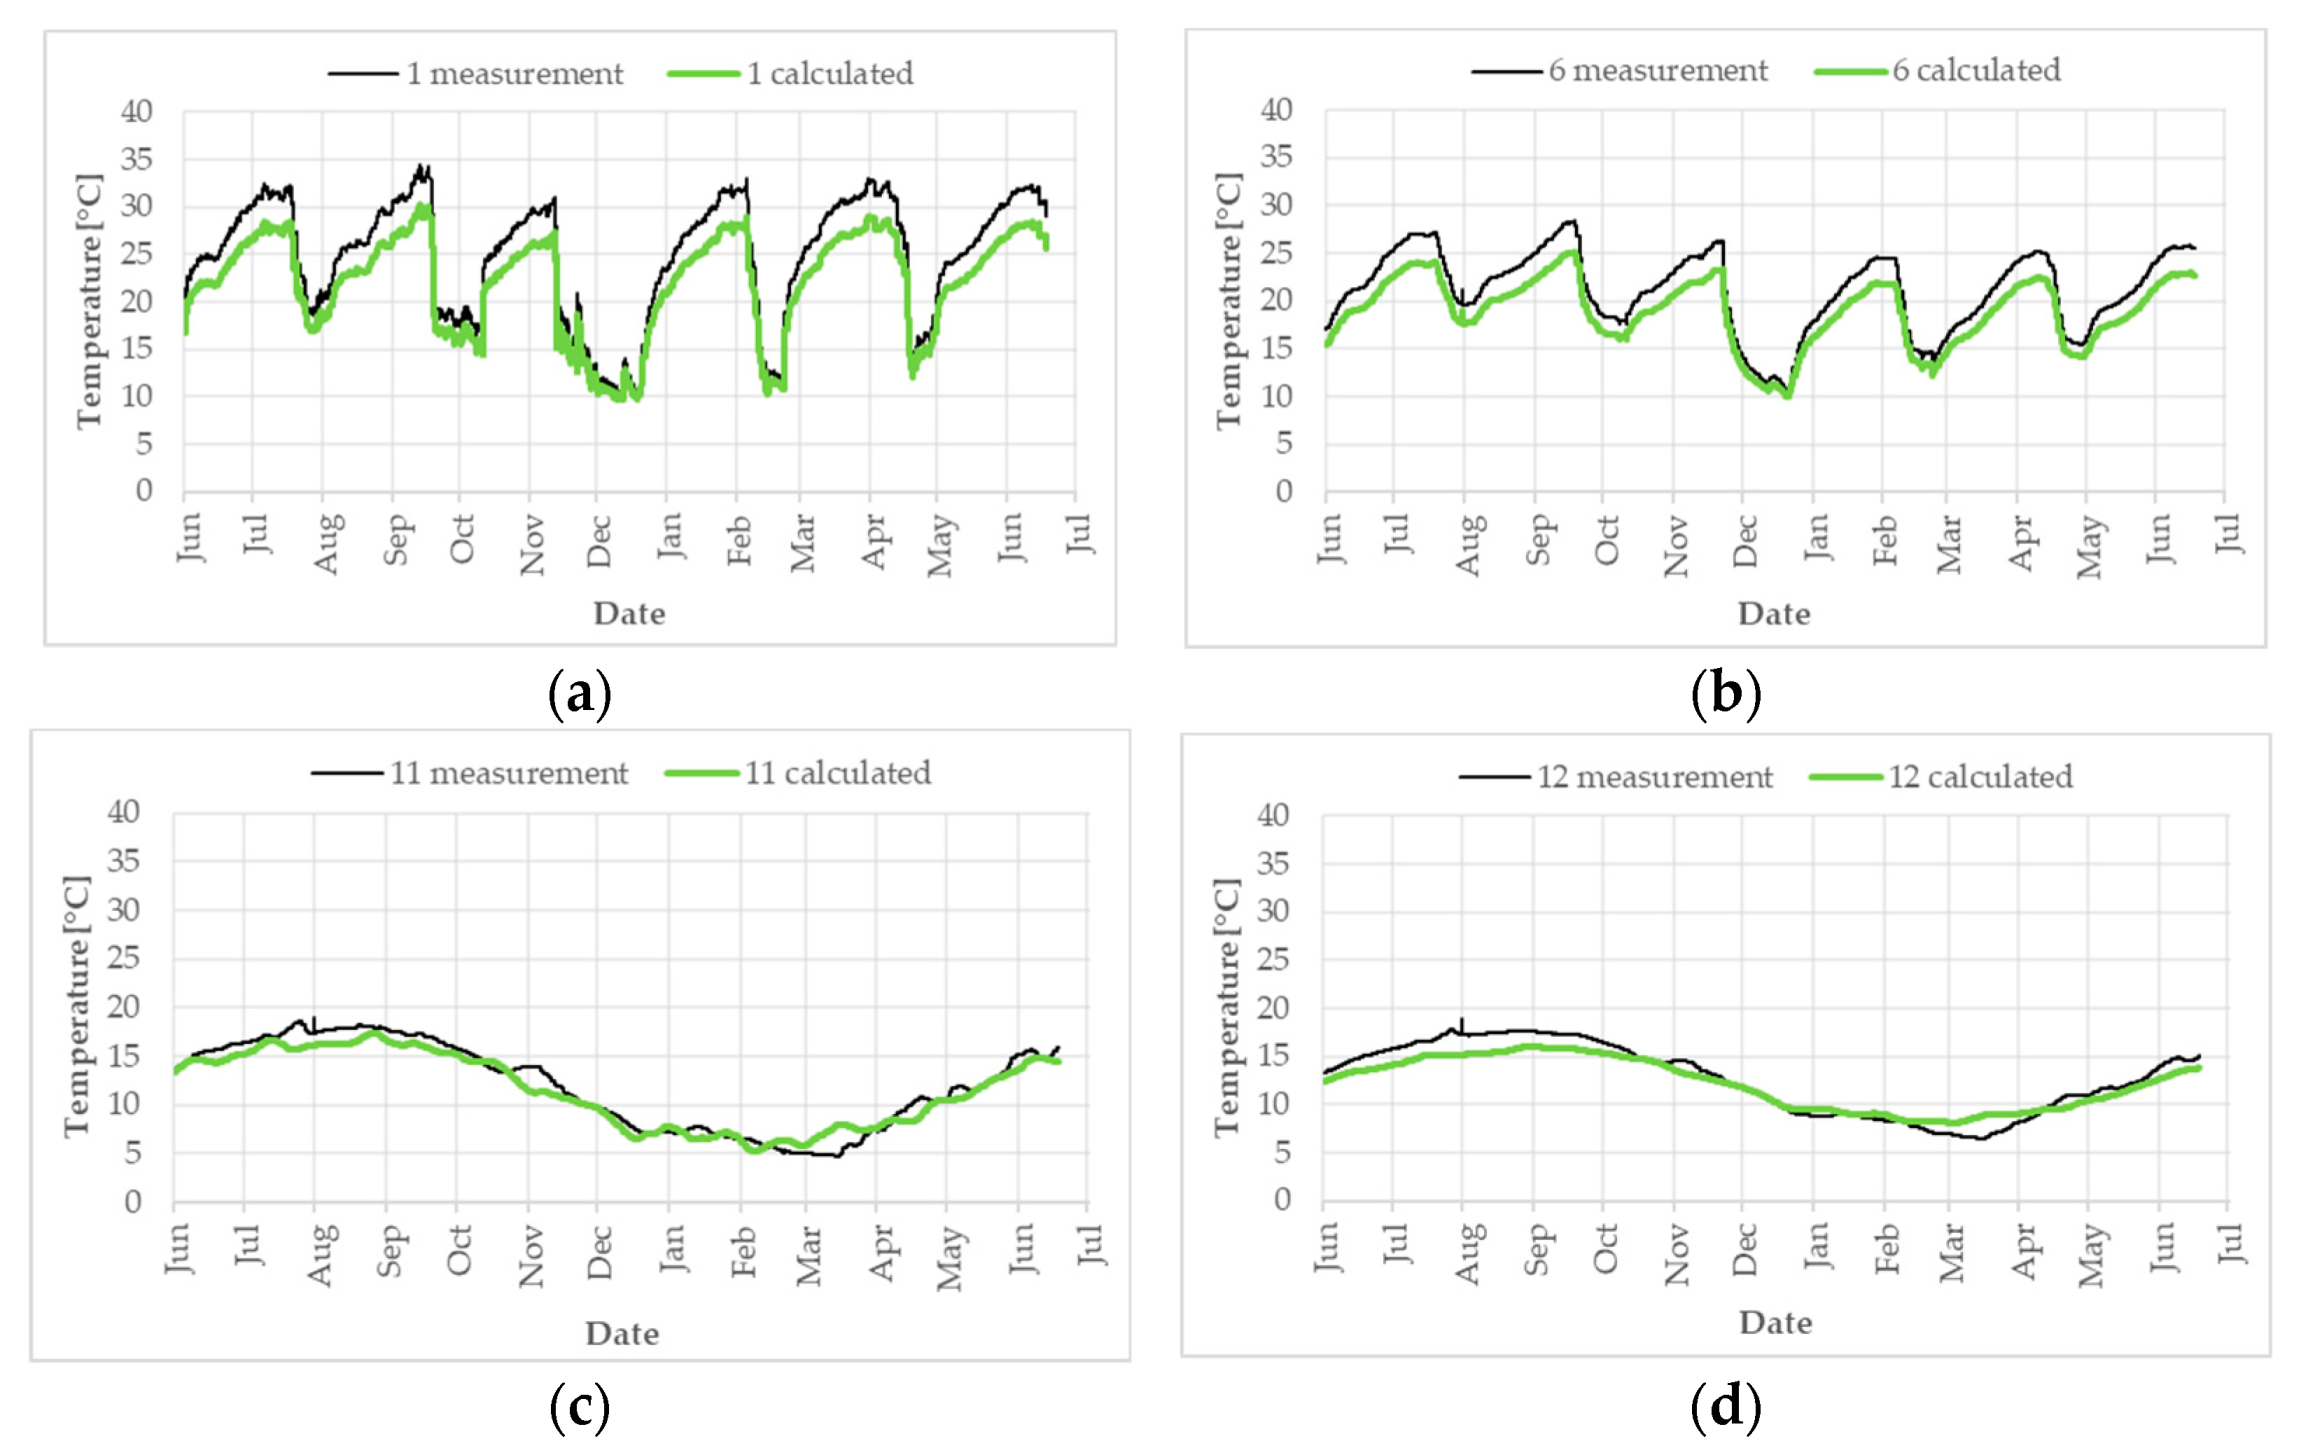
3.3. Effect of Building Location on Ground Heat Exchange
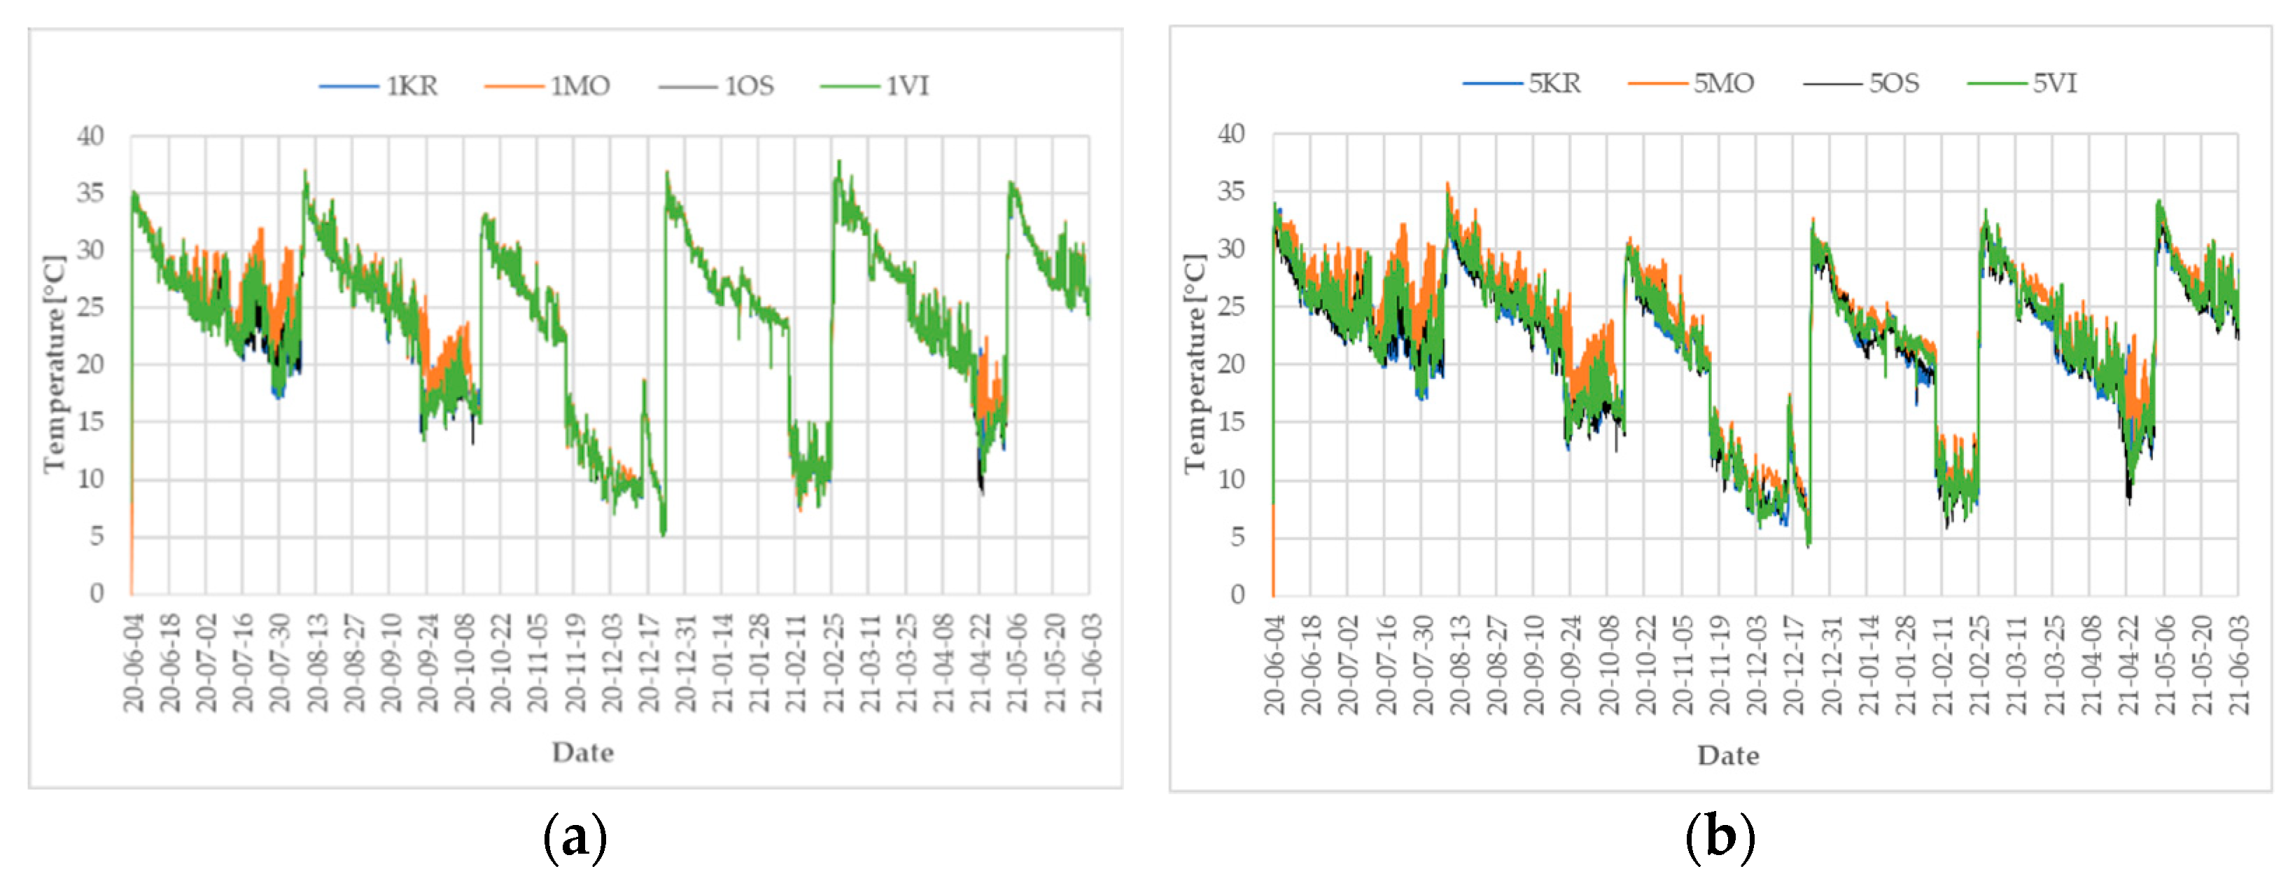
The effect of the location of the study site was not only significant with respect to its energy management. The results of the simulation analysis allowed us to investigate the characteristics of floor and ground temperature development, as well as to calculate the intensity of ground heat transfer. Ground temperature waveforms were obtained at 12 measurement points (1–12). Floor temperature (points 1 and 5) ranged from 4.9 °C to 36.4 °C throughout the year (
Figure 14).
Due to the specific nature of the building, the production cycle periods were considered separately from technological breaks in the floor temperature analysis. Having considered these, the average floor temperature was found to be 32.3 °C at the beginning of the cycle and 21.7 °C at the end of the production cycle. During technological breaks, when the heating system was operating with a significant weakness, the floor temperature varied in the range of 4.9–23.1 °C (
Figure 15). The floor temperature amplitude value during the technological breaks was strongly correlated with the external microclimate conditions. Statistical analysis of the results showed no significant effect of location (outdoor climate) on floor temperature.
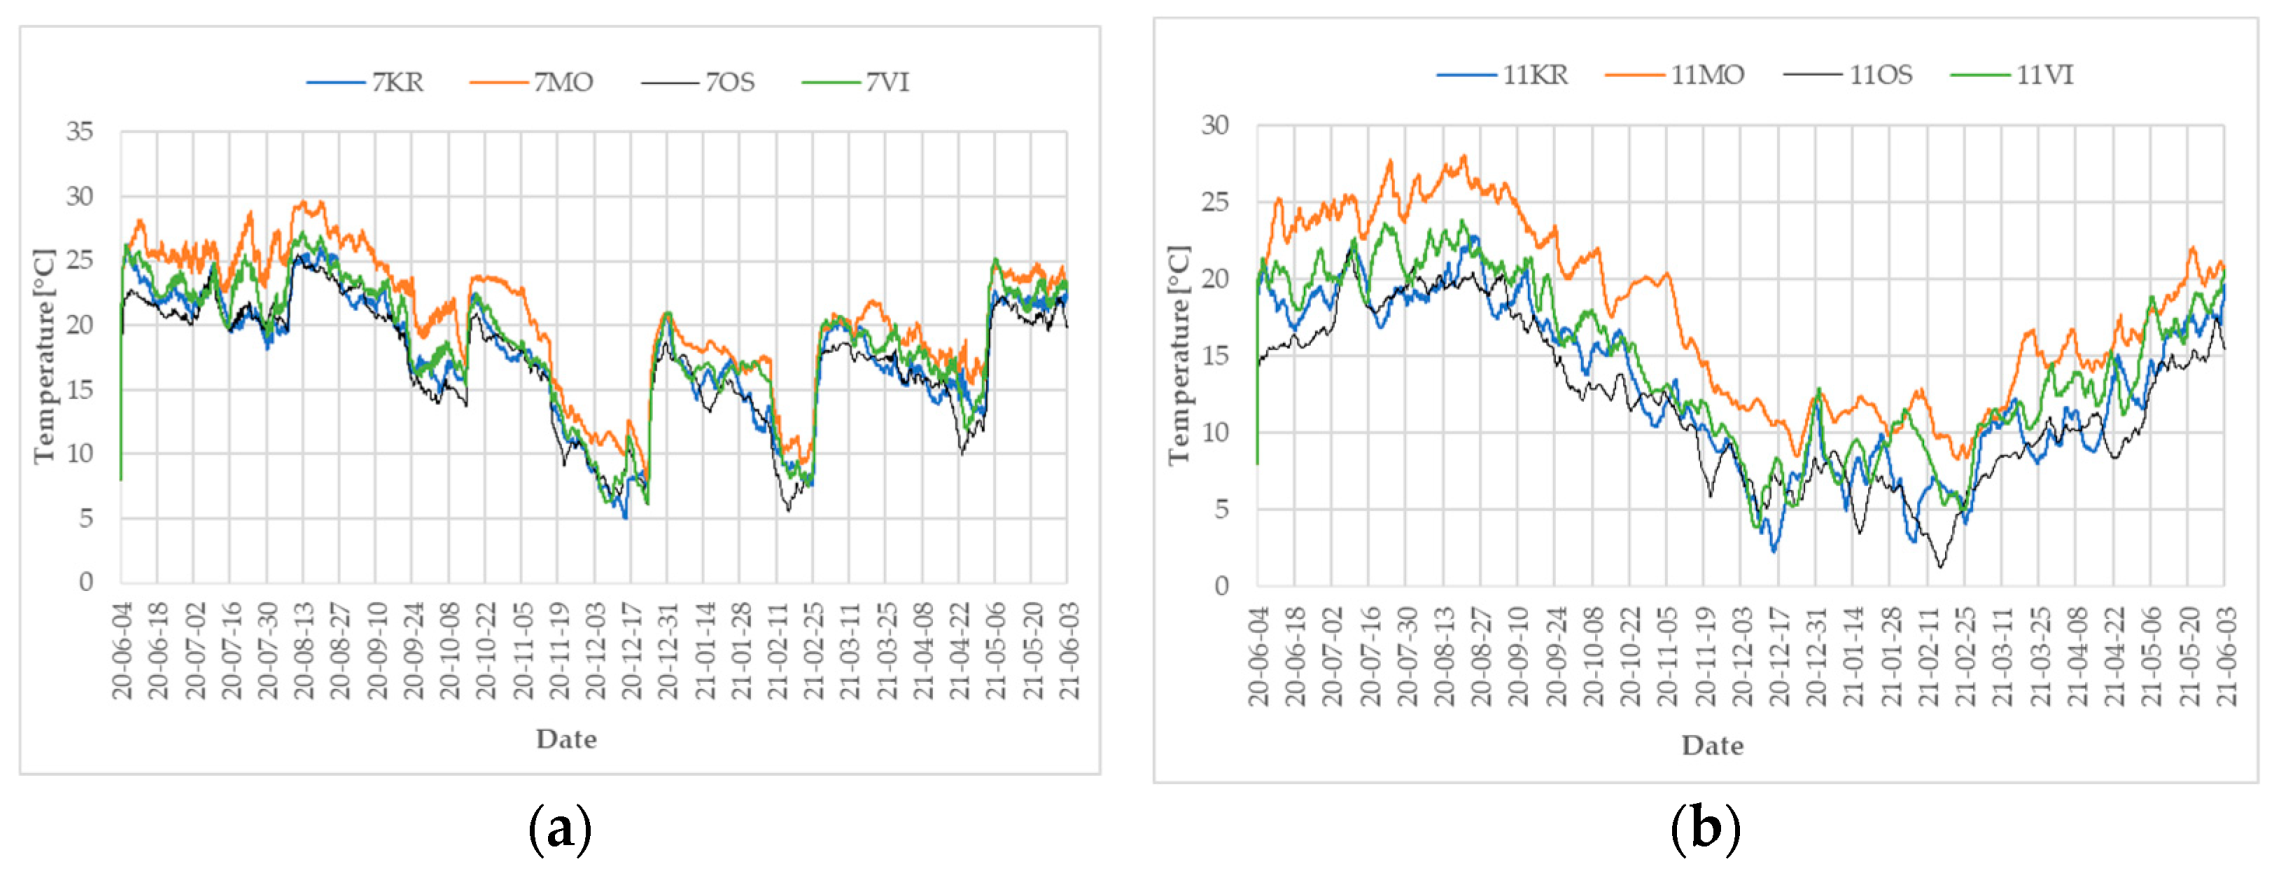
Significant impact of the building location on the ground temperature evolution was found for the internal measurement points 6–8 and in the case of the points located outside the building outline (9–12). The analysis results showed a ground temperature difference of up to 11.6 °C for the same point (11), assuming building location in Oslo and in Modena.
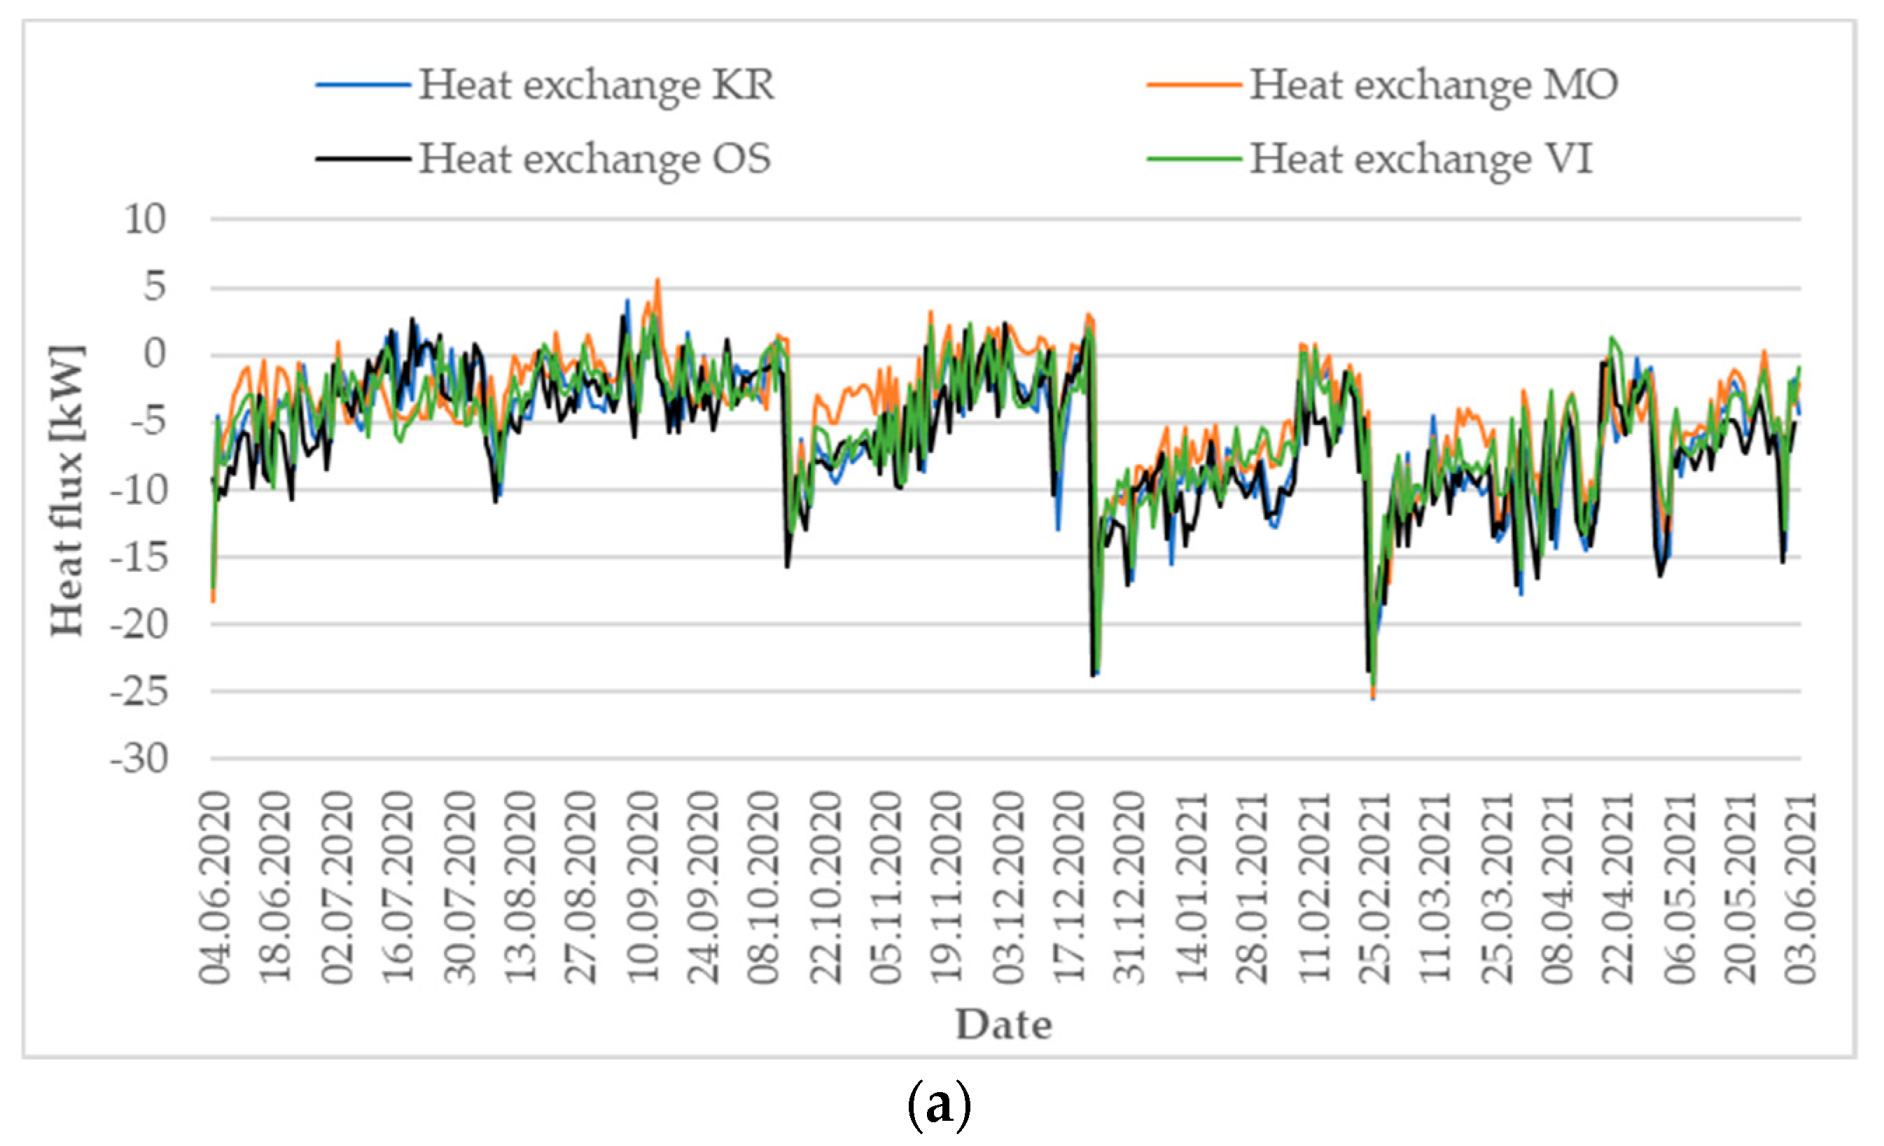
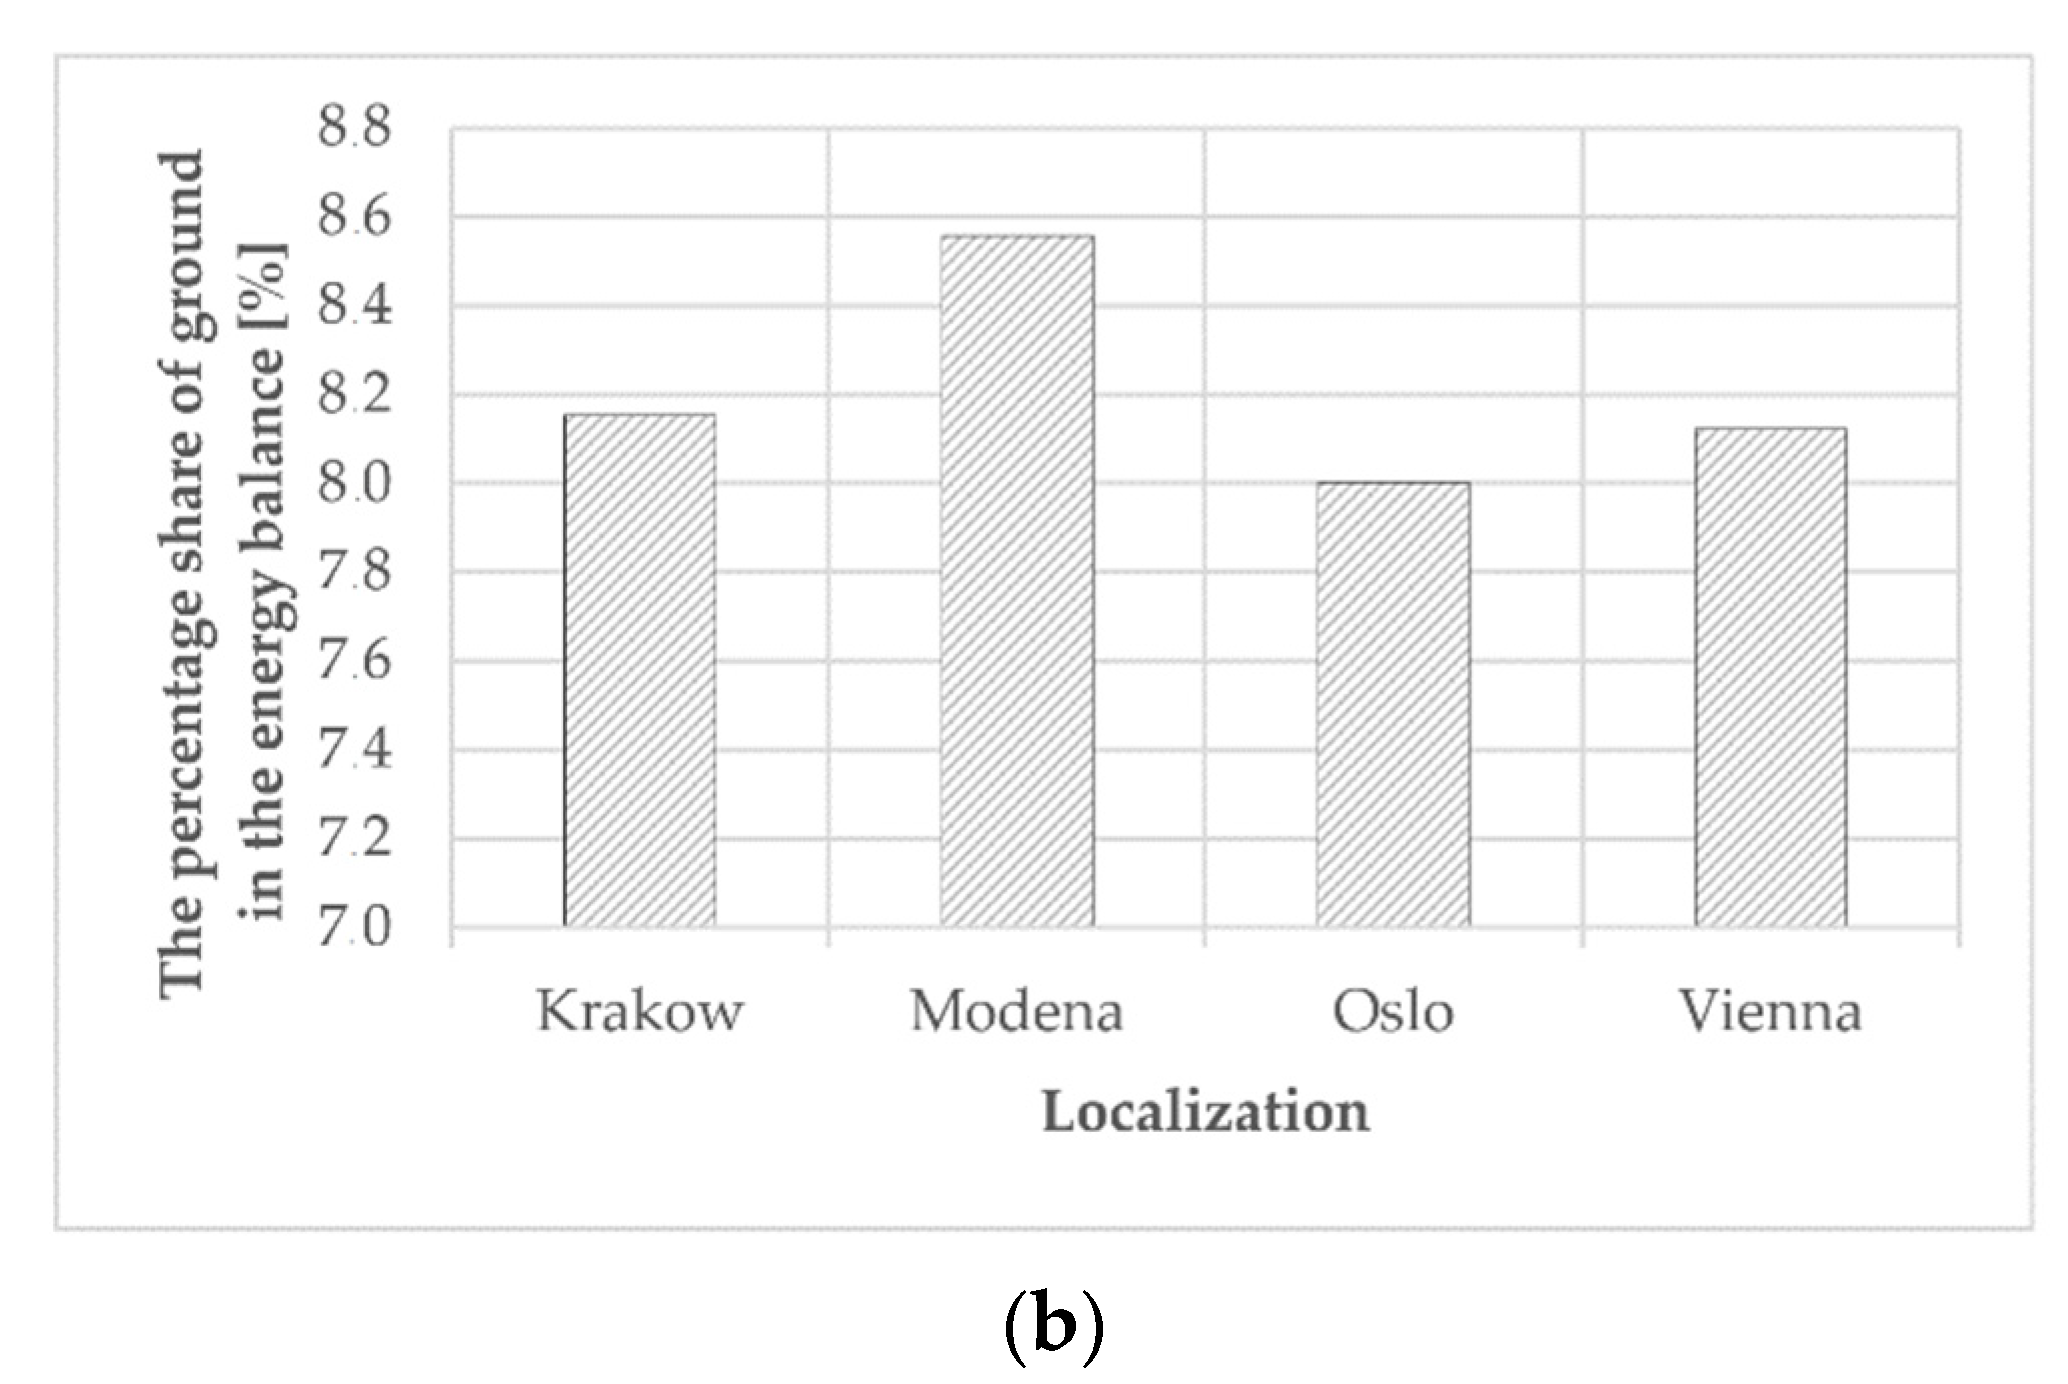
The ground heat transfer calculation allowed us to determine energy gains and losses to the ground, and to estimate the contribution of the ground to the energy balance of the building, taking its location into account (
Figure 16). The results of the obtained calculations showed a statistically significant effect of location on ground heat transfer. Due to the highest ground temperature, the highest specific heat flow was found in Modena, at 5.4 kW. Furthermore, a maximum single-unit energy gain from the ground of 2.7 kW was reported in Oslo. The results of the analysis showed significantly higher values of heat flow from the building to the ground, specifically during the last days of the production cycles. The highest heat losses to the ground were recorded at the end of the two winter production cycles, i.e.,: December 22 and February 23. The maximum specific energy loss to the ground during this time was between 24 and 25.2 kW, depending on the location. The percentage of land in the total energy balance was estimated as the balance of annual energy flow through the land divided by the total heating needs of the building. The results of this analysis showed that the highest contribution of land to the energy balance of the broiler house was in Modena (8.56%), while the lowest was in Oslo (8.00%). The share of ground in the energy balance of the broiler house for Krakow and Vienna was similar, at 8.15% and 8.12%, respectively.
4. Discussion
The location of the building and the prevailing climate primarily determine the energy performance of buildings and the requirements placed on them, from the perspective of thermal protection and energy efficiency [
25]. The specific mode of operation of agricultural buildings, especially cyclic use, can be a positive feature in terms of the possibility of technological and functional modifications [
14,
26,
27]. The results of analyzing the influence of location on the energy management of the studied buildings showed that the external climate significantly determined the amount of energy expenditure for heating purposes. Similar relationships were also found in buildings outside the agricultural sector [
28,
29]. The phenomenon of heat exchange with the ground and the possibility to use the potential of the ground as a specific regulator of the interior microclimate is a very important aspect from a year-round building operation perspective. The contribution of land to the energy balance of a building is usually in the range of 5–10% [
9]. However, it should be noted that, in a large-scale broiler house, the floor and the ground beneath it are the main recipients of heat generated by the animals housed there, specifically in the final days of rearing [
14,
30]. As a result of this, the benefits and risks of floor insulation should always be considered on a case-by-case basis. Numerical computational methods can be used to accurately determine the impact of the location and technical–utility parameters of buildings on their energy management. They allow for the analysis of variability of selected indicators, for non-stationary conditions [
31,
32,
33]. Having considered that the results obtained are purely theoretical, they should always be critically verified by performing a calculation validation process. In the case of the calculation model validation, one should use results of field measurements conducted for at least one year. Bypassing the validation process could contribute to large calculation errors, especially for specific, unusual buildings, such as agricultural buildings, while the data obtained should be considered as estimates [
34]. The results of the research showed that, depending on the location, different solutions should be adopted in order to increase the energy management of buildings. In the case of Scandinavia (Oslo) and Central Europe (Krakow, Vienna), it is worth considering the use of thermal insulation of the floor on the ground and foundation walls in order to eliminate the large influence of the external microclimate on the internal microclimate. Such a solution can significantly contribute to the decrease in the energy demand of the building in question. However, great care should be taken in this respect, because in summer, a well-insulated floor may pose a risk of heat stress. The excess heat will not flow freely into the ground, which may contribute to overheating of the animal residence zone.
5. Conclusions
This paper analyzed the impact of the broiler house location on its energy management and the formation of heat exchange with the ground. A year-long field study was conducted to meet the objective of the assumed study and validate the computational model. The computational model was based on the numerical method of elementary balances. Validation results had a very strong correlation with experimental results. Statistical analysis of significance for the differences between the measured data and the simulation results showed no significant differences. The validated model was used to run a series of simulations including climate variability (TRY) at the following locations: Krakow, Modena, Oslo, and Vienna. The validation was based on the actual results of field measurements. The computational results obtained allowed for the following conclusions:
Numerical analysis, using the elementary balance method, is a suitable computational tool to obtain accurate results for comparative simulations, under non-stationary conditions and with real measurements. This is particularly important for buildings, in terms of which energy management is not strictly defined by normative acts.
The applied numerical method can be used as a universal tool, after prior validation of the calculations. However, attention should be paid to certain limitations of the model, such as the inability to take into account non-stationary snow cover or changes in soil moisture over time.
Points validated below the ground surface and in the floor showed a weaker correlation (0.87) with the measured data. This is due to the inability to account for lingering snow cover and fogging under non-stationary conditions. Nevertheless, these inconveniences did not result in statistically significant differences between measured and calculated data (p ≤ 0.05).
The highest annual outdoor temperature amplitude was found for the building located in Krakow (51.1 K), while the lowest was for the building in Modena (38.4 K).
The climate data analysis for the studied locations and its impact on the energy management of the studied building showed that, in Modena, the outdoor air temperature remained below 0.0 °C during 53 h for the entire year. The longest period during which the outside air temperature was found to fall below 0.0 °C was found in Oslo, at 1801 h.
The variation in outdoor climate significantly affected the energy flow through the building envelope and ventilation system. Due to it having the highest insolation, the highest energy gains were obtained for the building located in Modena (4112.8 kWh/a). The buildings located in Krakow and Vienna were characterized as having a heat energy yield from the external environment that was twice as low.
For the site located in Oslo, it was found that the largest thermal energy gain came from the ground medium located under and surrounding the broiler house (1137 kWh/a).
The location of the broiler house significantly affects year-round heating needs. The building located in Oslo required 677,207.2 kWh/a of energy for heating purposes. If the same material and construction solutions are adopted, the building located in Modena requires 43% less energy for heating purposes.
The demand for peak heating power was verified due to the specific nature of the studied building, in which the microclimate changes cyclically in a very dynamic way. The highest value of this parameter was recorded for the building located in Oslo (219.3 kW), while the lowest was found in the building in Modena (191.6 kW). The demand for peak heating power in Krakow and Vienna was similar and amounted to 214.9 kW and 212.3 kW, respectively.
Changing the location of the site significantly affected the temperature of the ground under the floor and around the building. Due to the precise control of the interior microclimate, there was no significant effect of location on changes in floor temperature.
Heat exchange with the ground was most intense in the building located in Modena. For this location, the land’s contribution to the overall energy balance was 8.56%. The lowest contribution of land to the energy balance of the broiler house was found in the case of the building located in Oslo (8.00%).
An important study, from the point of view of a building’s energy sector, would be to analyze various material and construction solutions and various active systems (ventilation, heating) to assess the impact of these factors on building operations.


