Abstract
The accuracy and precision with which carbon amounts have been accounted for in forests have been questioned. As countries seek to comply with agreements to reduce global warming and industries seek to maximize bioenergy potential, this matter has increased international concern. White spruce (Picea glauca (Moench) Voss) stand density management trials in the Petawawa Research Forest, Ontario, Canada, were sampled to evaluate carbon concentration variation within trees and plots of differing stand density. Sample-drying methodologies were also tested to compare freeze-dried carbon (FDC) and oven-dried carbon (ODC) measurements. The average FDC was 51.80 ± 1.19%, and the corrected freeze-dried carbon content (FDCCOR) was 51.76 ± 1.33%. The average ODC was 49.10 ± 0.92%, and the average volatile carbon fraction (Cvol) was 2.67 ± 1.71%. FDC was higher than ODC (mean of the differences = 2.52) and generally more variable. ODC significantly decreased radially and longitudinally. FDC was significantly affected by thinning, where heavy treatments resulted in the highest FDC amounts compared to medium, light, and control treatments. In addition to reducing carbon content (CC), drying influences wood CC in many ways that are still to be elucidated. The results of this study suggest that ODC should continue to be used within the bioenergy industry, while FDC must become the preferred standard for carbon accounting protocols.
1. Introduction
Forest carbon accounting has been gaining global attention as countries seek to comply with agreements to reduce global warming [1]. Concerns regarding data reliability are becoming more prevalent as carbon is now valuated financially, with the enactment of carbon taxes and carbon credits [2]. Although established methods for measuring forest metrics (e.g., volume, biomass) to estimate carbon content in forests exist and are reasonably accurate, they carry many sources of imprecision [1,3]. Some of these sources of error are related to sampling design (related to tree selection, plot size, number, and location), measurement error (related to tree shape and equipment accuracy), and regression error (related to the substantial changes with the equation used) [1,3]. Assuming that sufficient care is taken to avoid all of the sources of error mentioned, a major cause of imprecision resides in the assumption that carbon represents 50% (w/w) of the above-ground biomass (kg dry weight ha−1) (AGB) of a tree. Therefore, carbon concentration variation still needs to be accurately described to improve our estimation of carbon stocks in forest stands.
Carbon content ((CC), also referred to as carbon fraction or carbon concentration) is known to vary with tree species [4,5,6,7,8,9,10], wood tissues [4,5,7,10,11,12,13,14], canopy position and tree size [15,16], and life-history traits (e.g., shade tolerance) [12]. Stand density management practices, used for the sustainable production of renewable forest fiber, increase radial growth rates with increased intensity of thinning [17,18] and initial spacing [19]. However, studies of the effects of thinning and spacing on wood properties have been limited to wood density and some macroscopic characteristics, or, for many species, absent. The influence of thinning and initial spacing on CC has not yet been assessed. Wood density is known to be higher in dominant trees compared to trees in other social classes (Larix decidua Mill. [20], Pinus massonica [21]). Given the high correlation between wood density and CC [6], one would expect the latter to similarly increase with social class.
Excluding forest soil carbon, stem wood carbon represents the largest proportion of forest carbon compared to litter or underground carbon in roots [13,22] or foliage, branches, and bark [13,14,22]. Kraenzel et al. [13] found that 86.9% and 13.1% of Tectona grandis carbon were stored in shoots and roots, respectively, and that woody tissues (trunk, branches, twigs, and coarse roots) had significantly higher carbon concentrations than soft tissues (leaves, flowers, and fine roots), at 49.2% and 46.4%, respectively. Therefore, acquiring as many measurements as possible for stem wood CC across a range of conditions will improve overall forest CC estimates [23]. Furthermore, stem wood CC is easier to measure than CC in other carbon pools such as deadwood [13] and roots [13,22].
Anatomical [24,25], physical [26], and morphological [26] wood quality attributes (WQA) are known to change from pith to bark, with tree height, and in the two main wood zones of a tree (i.e., juvenile wood and mature wood). These changes are mainly due to cambium aging and the proximity of the living crown [27]. One can reasonably expect CC to present a radial and a longitudinal pattern, as observed in most studied WQA.
Wood biomass is one of the most important sources of bioenergy production based on renewable sources [28]. Valorizing biomass as a bioenergy source presents many advantages for industrial applications, forest management, and the environment [29]. The elemental composition is among the most important properties of biomass [30]. It defines the energy content stored in the material and determines how clean and efficient utilization of the biomass materials will be [31]. The carbon content, determined directly through ultimate analyses or predicted from proximate analysis, plays a key role in calculating wood calorific value [28,32]. The calorific value is an important wood property when thermochemical conversion is the objective. It indicates the energy chemically bonded in the biomass, which will be converted into useable energy [28].
The conventional oven-drying (OD) method typically involves two steps: movement of water from the interior (high moisture content) to the surface (low moisture content), and removal of water from the surface (through evaporation) [33]. The freeze-drying process (FD or lyophilization) takes place in three stages: initial freezing, which crystallizes the free water; primary drying, which removes solid water through sublimation; and secondary drying, which removes most of the residual moisture through desorption of the adsorbed water [34]. FD starts by removing heat from the product and may be considered a gentler drying method compared to OD, which begins by applying heat to the product [34]. Freeze-drying preserves temperature-sensitive products (such as volatile compounds) and has therefore been established as the drying method of choice for many bio-industrial applications [35]. Increasing drying temperature is known to alter the chemical composition of wood [30].
Loss in the carbon fraction (during oven-drying) has been considered as a plausible explanation for CC measurement discrepancies among some studies [12]. Thus, the amount of volatile carbon must also be established. Ideally, CC must be measured on fine (≤0.3 mm) powdered samples to avoid large dispersion of the data [36].
White spruce (Picea glauca (Moench) Voss) has a broad ecological niche and occurs in pure stands as well as in mixed stands in association with a wide variety of both coniferous and deciduous species [37]. As such, it is widely distributed across North America, extending from Newfoundland in the east to northwestern Alaska in the west. Its latitudinal range is from the northern treeline across the continent, south (in the Western Cordillera) to southern British Columbia and Alberta, following the southern boreal boundary in the prairie provinces (Alberta, Saskatchewan, Manitoba) and east along the northern tier states from Minnesota to Maine. [38]. Therefore, establishing accurate estimates of white spruce CC would contribute towards refining the Carbon Budget Model of the Canadian Forest Sector (CBM-CFS3) and may also benefit similar models in the USA.
The main objective of this study was to examine the radial and longitudinal variation of white spruce carbon content in managed stands while comparing FDC and ODC. A secondary goal was to determine the impact of stand density management (thinning and initial spacing) on white spruce carbon content. Finally, the variation in white spruce carbon content with tree social class was explored.
2. Materials and Methods
2.1. Stand Description
The white spruce samples used in this study were obtained from a thinning experiment and an initial spacing experiment. The thinning experiment consisted of a plantation established in 1936 within the Petawawa Research Forest, Ontario, Canada (lat. 45.59° N, long. 77.25° W, elev. 168 m). Initial stocking was 3068 trees/ha (1.8 × 1.8 m spacing). The experiment included light, medium, and heavy thinning treatments with target basal areas of 32, 25, and 18 m2/ha, respectively, and a maintained control plot. Thinning treatments were applied repeatedly in 1962, 1972, and 1982. In 1982, the basal area in the control plot was 44 m2/ha. For this study, eight healthy trees (two dominant, four co-dominant, and two suppressed) were randomly selected per treatment [25].
The initial spacing study site consisted of a plantation established in 1967 at the same location. The plantation had four initial spacing intensities: 1.2 × 1.2 m, 1.8 × 1.8 m, 4.3 × 4.3 m, and 6.1 × 6.1 m. One healthy dominant tree was randomly sampled in each of the four spacing treatments [25].
All 36 trees used in this study were felled and pruned once on the ground in July 2008. Tree diameter at breast height (DBH), total height, clear bole, and crown lengths were measured using a tape measure (Table 1). Stem disks 3–4 cm thick were cut at 1.3 m from trees in the thinning trial and at 1.3 m, 4.3 m, 7.3 m, and 10.3 m from trees in the spacing trial.

Table 1.
Tree characteristics including freeze-dried carbon (FDC).
2.2. Sample Collection and Preparation
After harvesting, wood disks were stored in a warehouse at the Université du Québec en Abibiti-Témiscamingue (UQAT). In 2018, the breast height disks from the thinning experiment and disks at four heights (1.3 m, 4.3 m, 7.3 m, and 10.3 m) from the spacing experiment were transferred to Natural Resources Canada—Northern Forestry Centre (NoFC). A bark-to-bark sample batten, centered on the pith, was cut from each disc. The direction of sampling was random. Compression wood, knots, and piths were avoided based on a detailed visual check. Each batten was sectioned into three-ring samples from rings 1 through 15 and five-ring samples from ring 16 outward, to ring 60 for thinning trial samples and to ring 35 for spacing trial samples. Samples were labeled according to the sample’s highest ring number (oldest cambial age) (e.g., 3, 6, 9, etc.). The boundary between growth rings was visually determined.
All discs were sanded before being reduced into battens to expose a non-oxidized surface [36] to minimize the impact of the volatile carbon loss due to air drying. The wood sections extracted from the battens were also shaved using a surgical scalpel before being reduced into wood sticks of smaller size for grinding. Before grinding, wood sticks were sealed in plastic bags and stored in a freezer. Each wood sample (i.e., the section of multiple rings) was individually pulverized into a homogenous powder using a Wiley Mill (No. 20 mesh) and split for two drying treatments. Half of each sample was placed in a forced-air oven (Thermo Scientific, Lindberg/Blue M, Model# MO1450A-1, Asheville, NC, USA, [39]) at 70 °C for three days. The other half was freeze-dried at −50 °C for seven days using an 8 L freeze-drying system (Labconco Co., Kansas City, MO, USA, [40]).
2.3. Chemical Analysis
Dried samples were analyzed using a LECO Truspec Micro CHNS Analyser (LECO Instruments ULC, Mississauga, ON, Canada) [41], calibrated with a certified EDTA standard. Quality assurance was achieved using certified reference materials such as orchard leaves and alfalfa, and checks were performed every 20 samples. Volatile Mass Fraction (VMF), corrected freeze-dried value (FDCcor), and volatile carbon concentration (Cvol) were computed following the equation described in Gao et al. [12]. Carbon content (CC) measurement problems resulted in 429 usable data points for the thinning trial and 94 for the spacing trial.
2.4. Statistical Analysis
Descriptive statistics for FDC and ODC were obtained using the entire dataset (containing all tree heights and ages) as well as subsets that focused on specific tree heights, ages, and ranges of tree maturity (≤15 years old: juvenile wood; >15 years old: mature wood). The transition age from juvenile to mature wood used in this study was based on a piecewise linear model on tracheid length, determined for this same material in a previous study [24]. A paired t-test was performed to compare FDC and ODC in the spacing trial dataset at the 0.05 significance level. Regression analyses and analysis of variance (ANOVA) tests were performed for FDC and ODC using subsets of the thinning and spacing trial data. All statistical analyses were performed using R statistical software [42].
3. Results
3.1. Comparison of Freeze-Dried Carbon and Oven-Dried Carbon, Radial and Longitudinal Variation of Carbon Content
Using a paired t-test, the average FDC was higher than that of ODC (mean of the differences = 2.52) with high significance (p < 0.0001) (Figure 1). This tendency held when subsetting the whole database into different heights (Figure 2) and age classes (Figure 3). A high amount of volatile carbon was found at all the measured heights (Figure 2). The mean FDC value was 51.8% for both juvenile wood and mature wood, while the juvenile wood ODC mean (49.2%) was similar to that of mature wood ODC (49.0%). When segregating trees based on maturity and testing for differences with a Welch two-sample t-test, no difference was found between juvenile wood and mature wood for FDC and ODC (Figure 3).
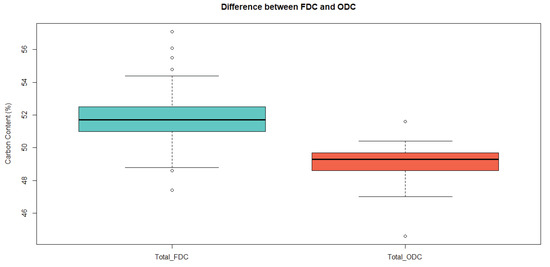
Figure 1.
Boxplot displaying the differences between freeze-dried carbon (FDC) and oven-dried carbon (ODC).
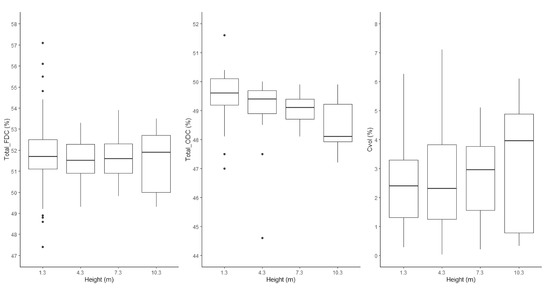
Figure 2.
Boxplot displaying the variation of freeze-dried carbon (FDC), oven-dried carbon (ODC), and volatile carbon (Cvol) with tree height.
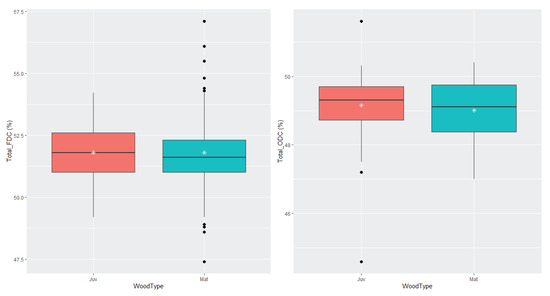
Figure 3.
Boxplots displaying the differences between juvenile wood (Juv) and mature wood (Mat) for freeze-dried carbon (FDC), left panel, and oven-dried carbon (ODC), right panel.
No statistically significant difference was found for the increasing FDC (thinning and spacing) across the various cambial ages at breast height (Figure 4). Although ODC significantly decreased with age (Figure 4, Table 2), this tendency was weak, with a coefficient of determination of 0.18. Except for height = 4.3 m, FDC increased with age (Figure 5) while ODC decreased with age at all considered heights (Figure 5). Although ODC decreased with height (Figure 5), this tendency was also weak (R2 = 0.18). There was no clear pattern of FDC variation with height.
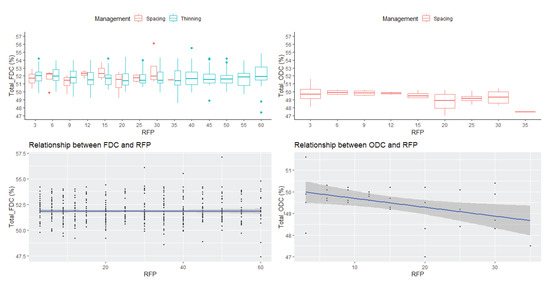
Figure 4.
Boxplots displaying annual FDC distribution for spacing and thinning management data, annual ODC distribution for the spacing data, the relationship between FDC and RFP, and between ODC and RFP, all at breast height (1.3 m). FDC: freeze-dried carbon; ODC: oven-dried carbon; RFP: ring number from pith.
Table 2.
Summary of linear regressions for oven-dried carbon.
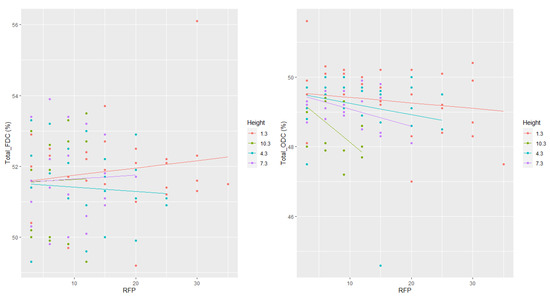
Figure 5.
Radial and longitudinal variations of freeze-dried carbon (FDC) and oven-dried carbon (ODC) with ring number from the pith (RFP) and tree height.
3.2. Inter-Tree Variation: Impact of Stand Density Management and Social Class
The tree from the 1.8 m initial spacing (2S-1.8D) displayed the highest % FDC among the four trees from the initial spacing experiment (Table 1, Figure 6), while the highest % ODC was found in the tree from the 4.3 m initial spacing (3S-4.3D) (Figure 6). However, the effect of spacing on both FDC and ODC was not tested because of the small number of trees (one replicate per treatment).
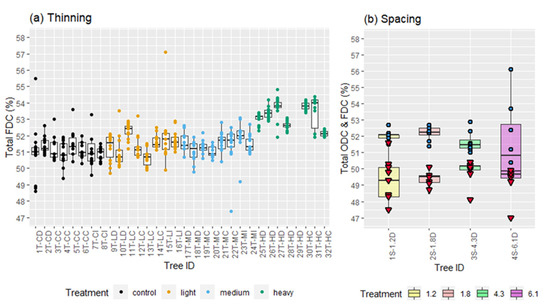
Figure 6.
Inter-tree variation and treatment comparison at breast height (1.3 m) displaying (a) total FDC (thinning data) and (b) total ODC (red triangle) and FDC (blue circle) (spacing data).
FDC average values at breast height for the different thinning treatments are presented in Table 1. In each treatment, there was a tendency for some trees to maintain a higher FDC from pith to bark (Figure 6). Thinning significantly affected FDC, with a higher FDC found in the heavy thinning treatment than other treatments. FDC is directly correlated with social class, showing a steady decline with lowering social class (i.e., dominant > co-dominant > intermediate) (Figure 7). However, these differences were not significant.
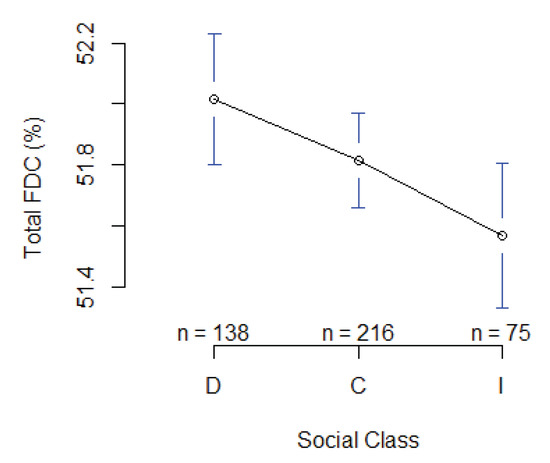
Figure 7.
Mean plot displaying social class comparison for FDC at breast height (1.3 m) (D = dominant, C = co-dominant, I = intermediate).
4. Discussion
4.1. Comparison of Freeze-Dried Carbon and Oven-Dried Carbon, Variation of Carbon Content
The averages of freeze-dried carbon content (FDC = 51.8%) and corrected freeze-dried carbon content (FDCCOR = 51.76%) were found to be similar in this study. Therefore, most of the results are discussed using the 51.8% value. The small standard deviation in this study was an indication that samples were ground to suitable particle sizes [36]. The average white spruce FDCCOR found in this study was much higher than the 49% reported by Gao et al. [12]. This was likely due to the average DBH of our 36 trees (Table 1) being much higher than the average DBH that Gao et al. [12] measured in their sample of 21 trees, which included trees as small as 2 cm DBH. This difference in tree sizes also explains why our volatile carbon fraction (2.67%) was higher than the 1.4% Gao et al. [12] reported previously. The average ODC for white spruce in this study (49.1%) cannot be compared to the 50.4% reported by Lamlom and Savidge [36] since all pith-to-bark tissue types were considered in our study (i.e., juvenile wood, mature wood, earlywood, and latewood). In contrast, Lamlom and Savidge [36] only collected juvenile heartwood of fast-growing rings (ring width > 5 mm) near the pith. The wide ring width of Lamlom and Savidge [36] trees may explain their higher ODC compared to the juvenile wood ODC in this study (49.2). The wider tree spacings were associated with wider rings and higher ODC values.
The significant decrease observed in ODC compared to FDC when analyzing the same samples agrees with the findings of Lamlom and Savidge [36], who studied North American tree species, including white spruce, as well as Martin and Thomas [43], who studied 59 Panamanian rainforest tree species. These results confirm that CC measured using oven-dried samples underestimated the proper amount of carbon in forest trees, regardless of their growing environment. The 2.67% volatile carbon fraction found in this study concurs with previous studies advocating that volatile carbon represents a significant part of total carbon in forest trees [36,43] and must be systematically accounted for in any carbon accounting protocol. On top of being systematically lower than FDC, ODC was also found to present weak significant variations where FDC did not show any. The reason for this significant variation of ODC is still unclear. However, one should avoid using oven-dried samples to establish any causal relationship between growth (or any other factor) and CC.
The absence of a pith-to-bark radial pattern of FDC observed in this study was not expected, based on studies of other white spruce WQA [26]. On the one hand, our results are in agreement with Castaño-Santamaría and Bravo [44], who found no or limited variation of CC between heartwood and sapwood. On the other hand, there are contrary results from studies reporting an increasing CC with increasing age class for Acer saccharum Marsh. [8] and Nothofagus antarctica [22], but higher CC in heartwood compared to sapwood for Sequoiadendron giganteum (Lindl.) Bucholz [8], Pinus pinaster [11], and other pine species [5]. Bert and Danjon [11] hypothesized that this pattern is associated with lignin/carbohydrate concentration in juvenile vs. mature wood and with chemical changes occurring during the transformation of sapwood into heartwood. These contradictory results in the literature suggest that FDC radial variation is species-specific [8,9], and white spruce belongs to the group of species with no or non-significant variation of FDC from pith to bark. Alternatively, the weak significant variation observed with ODC suggests that more carbon may be lost during drying of wood laid down after maturity, which agrees with Rosner’s finding of higher sensitivity to drying of mature wood than juvenile wood in spruce [45]. The latter could be explained by the higher number of tracheids per volume in juvenile wood than mature wood in spruce [45]. In both cases, the Bert and Danjon [11] hypotheses should be further verified for white spruce and future studies on CC, ensuring a direct contrast between FDC and ODC with all other relevant WQA using the same samples.
The decrease in ODC with tree height found in this study from breast height to 10.3 m (approximately 60% relative height for three of our four trees) concurs with the decrease from the stump to about 60% relative height that Bert and Danjon [11] found with their four Pinus pinaster trees. De Aza et al. [5] (heartwood) and Castaño-Santamaría and Bravo [44] (Q. petraea and Q. pyrenaica sapwood) also reported a decreasing ODC with tree height. However, this tendency was not observed for FDC. Again, one can hypothesize that these changes are an artifact brought on by drying. The reasons for such artifacts are not yet clear. Furthermore, our longitudinal sampling was performed at fixed cambial ages and not at fixed calendar years. In a previous study involving these samples, tracheid diameter did not vary longitudinally when sampled at fixed cambial ages. Still, a highly significant variation was found when sampling the same WQA at fixed calendar years [25]. It will be interesting to measure both FDC and ODC using fixed cambial age vs. fixed calendar year sampling methods and further investigate the presence or absence of longitudinal variation, its drivers, and drying impacts.
4.2. Impact of Stand Density Management and Social Class
The tallest trees in our even-aged stand were also the ones with the largest diameters. No significant difference in the increasing FDC with social status was found, as was observed between ODC and DBH of Tectona grandis grown in Panama [13] and between ODC and DBH of Miconia mirabilis ((Aubl.) L.O. Williams) grown in Dominica [16]. Although not significant, Martin et al. [16] also found an increasing relationship between ODC and DBH for Dacryodes excels Vahl. Similarly, Laiho and Laine [14] found an increasing relationship between ODC and tree volume of three coniferous species, including spruce. Cambronero et al. [4] hypothesized that a higher carbon fraction could be expected in higher canopy palms since they require higher mechanical support. However, the reverse pattern was found by Peri et al. [22], who found ODC to increase from dominant to suppressed Nothofagus antarctica trees. Elias and Potvin [6] found that ODC was increasing with DBH for some species, while it decreased with other species, suggesting that the impact of social classes may be species-specific and must be further studied. Direct cross-study comparisons of CC are not straightforward because there is no established standard protocol for sampling or measuring CC [10]. In the case of social class impact on CC, most studies approach this issue from a different (although not contradictory) angle. Zhang et al. [10] sampled trees from four social classes and measured ODC, but addressed the mean annual biomass increment and not strictly social status. Martin et al. [16] used FDC and contrasted sapling (only JW) vs. outer rings of large trees (only MW); by doing so, the comparison was more related to age class (JW vs. MW) and sampling height than social classes. At a stand level, Cambronero et al. [4] used the canopy position as a proxy for social classes but considered different palm species and not social classes of the same species. At a regional level, Baker et al. [3] attempted an approach that informs on the impact of growth stage, but not strictly social status. Our study used FDC to contrast even-aged trees collected in the same plots, at the same tree height, and using the same tissue type. By doing so, other confounding factors were avoided (e.g., age classes, sampling height, drying, and the environment). Standardized protocols for CC measurements will help to reduce conflicting results.
No previous studies have extensively analyzed CC variation in a stand density management experiment. The lesser effect of spacing (especially very wide spacing) on CC compared with thinning (especially heavy thinning) is in agreement with initial spacing management having less impacts on tree characteristics than thinning management in Pinus taeda [46]. Average FDC data from the thinning experiment (Table 1 and Figure 6a) clearly show that a heavy thinning boosts CC in white spruce. This agrees with the effect of thinning on wood density in Picea mariana [47] and was reflected in the tree-to-tree comparisons (not shown), with most of the significant differences seen in trees from the heavy thinning experiment. Thus, valorizing residues extracted from heavy thinning treatments for thermochemical conversion may be more efficient for producing bioenergy based on renewable biomass from managed stands than biomass from comparable unmanaged stands. This significant increase in CC may be explained by increased compression wood [48,49] due to greater auxin production by expanded crowns in heavily thinned stands [27,48,50]. Compression wood is known to have higher wood density [27,51], latewood proportion [27], lignin content [52], and thicker tracheid walls [51] than normal wood, resulting in higher CC [8,11]. The fact that some trees maintained a higher FDC from pith to bark than other trees in the same thinning treatment is probably an indication that they were genetically predisposed to have a higher CC [53].
4.3. Practical Implications and Limitations
The main achievement of this study was in measuring the amount of carbon stored in white spruce wood. These numbers provide a sufficient depiction of variations in CC of white spruce growing in comparable conditions [8]. Although weak, the significant variations found with ODC (where FDC did not show a significant variation) raise questions about the effects of the drying method used. This suggests that FDC should be utilized for carbon accounting strategies since the goal is to closely estimate the amount of carbon stored in the forests, independently of the biomass use. However, ODC measurements may be suitable for use in the bioenergy industry, for example, to determine the calorific value of wood since drying is often a mandatory step of the conversion processes. The results of this study are in line with the previous research available. Although this study contributes significantly to the field, increased sample sizes (especially for ODC) will add scientific value to subsequent work. In addition, a tree is made up of several tissue types (wood, roots, bark, needles, etc.) that differ in CC [13]. Measuring all tissue types and weighing their contributions to the overall CC remains the only way to estimate accurately the total amount of carbon stored in a tree.
5. Conclusions
To our knowledge, this study is the first to quantify the impact of thinning and initial spacing on wood CC. It is also the first to quantify the effect of social status on CC while controlling all other confounding parameters. White spruce CC increased with thinning, but this increase was only significant for heavy thinning. White spruce CC increased with social class, although not significantly. The apparent causal relationships between CC and growth parameters (e.g., age and tree height) are altered by the drying process. ODC is therefore not suitable to explain the relationships between tree growth and its chemical compounds. ODC appears to be most suitable for use in the bioenergy industry, where drying at ambient or raised temperatures is often unavoidable. FDC must become the standard for forest carbon accounting purposes due to its superior accuracy and reliability compared to ODC. Neither the age-related nor the height-related FDCs showed a significant effect on white spruce CC variations. In order to further increase our understanding of forest CC variation and to refine carbon accounting protocols, extensive sampling of various tree tissues, forest environments, and tree sizes will be essential.
Author Contributions
Conceptualization, C.S.M.; methodology, C.S.M. and J.D.S.; formal analysis, C.S.M. and C.H.; resources, C.S.M., J.D.S. and A.K.; data curation, C.S.M.; writing—original draft preparation, C.S.M. and C.H.; writing—review and editing, C.S.M., J.D.S., C.H. and A.K.; supervision, C.S.M.; funding acquisition, C.S.M., A.K. and J.D.S. All authors have read and agreed to the published version of the manuscript.
Funding
Natural Resources Canada funded this research through the Forest Innovation Program (FIP).
Institutional Review Board Statement
Not applicable.
Informed Consent Statement
Not applicable.
Data Availability Statement
Contact corresponding author for data sharing.
Acknowledgments
The authors thank Bouslimi Besma (UQAT) and Jared Salvail (Canadian Wood Fibre Centre) for samples preparation. The support of Joe Crumbaugh (Canadian Forest Service chemical analysis laboratory in Edmonton) was instrumental in carrying out this research.
Conflicts of Interest
The authors declare no conflict of interest.
References
- Brown, S. Measuring carbon in forests: Current status and future challenges. Environ. Pollut. 2002, 116, 363–372. [Google Scholar] [CrossRef]
- Skovgaard, J.; Ferrari, S.S.; Knaggård, Å. Mapping and clustering the adoption of carbon pricing policies: What polities price carbon and why? Clim. Policy 2019, 19, 1173–1185. [Google Scholar] [CrossRef] [Green Version]
- Baker, T.R.; Phillips, O.L.; Malhi, Y.; Almeida, S.; Arroyo, L.; Di Fiore, A.; Erwin, T.; Higuchi, N.; Killeen, T.J.; Laurance, S.G.; et al. Increasing biomass in Amazonian forest plots. Philos. Trans. R. Soc. B Biol. Sci. 2004, 359, 353–365. [Google Scholar] [CrossRef]
- Cambronero, M.; Avalos, G.; Alvarez-Vergnani, C. Variation in the Carbon Fraction of Seven Neotropical Palm Species of Different Forest Strata. PALMS 2018, 62, 11. [Google Scholar]
- De Aza, C.H.; Turrión, M.B.; Pando, V.; Bravo, F. Carbon in heartwood, sapwood and bark along the stem profile in three Mediterranean Pinus species. Ann. For. Sci. 2011, 68, 1067. [Google Scholar] [CrossRef] [Green Version]
- Elias, M.; Potvin, C. Assessing inter- and intra-specific variation in trunk carbon concentration for 32 neotropical tree species. Can. J. For. Res. 2003, 33, 1039–1045. [Google Scholar] [CrossRef]
- Jones, D.A.; O’Hara, K.L. Variation in carbon fraction, density, and carbon density in conifer tree tissues. Forests 2018, 9, 430. [Google Scholar] [CrossRef] [Green Version]
- Lamlom, S.H.; Savidge, R.A. Carbon content variation in boles of mature sugar maple and giant sequoia. Tree Physiol. 2006, 26, 459–468. [Google Scholar] [CrossRef] [PubMed] [Green Version]
- Thomas, S.C.; Martin, A.R. Carbon content of tree tissues: A synthesis. Forests 2012, 3, 332–352. [Google Scholar] [CrossRef] [Green Version]
- Zhang, Q.; Wang, C.; Wang, X.; Quan, X. Carbon concentration variability of 10 Chinese temperate tree species. For. Ecol. Manag. 2009, 258, 722–727. [Google Scholar] [CrossRef]
- Bert, D.; Danjon, F. Carbon concentration variations in the roots, stem and crown of mature Pinus pinaster (Ait.). For. Ecol. Manag. 2006, 222, 279–295. [Google Scholar] [CrossRef]
- Gao, B.; Taylor, A.R.; Chen, H.Y.H.; Wang, J. Variation in total and volatile carbon concentration among the major tree species of the boreal forest. For. Ecol. Manag. 2016, 375, 191–199. [Google Scholar] [CrossRef]
- Kraenzel, M.; Castillo, A.; Moore, T.; Potvin, C. Carbon storage of harvest-age teak (Tectona grandis) plantations, Panama. For. Ecol. Manag. 2003, 173, 213–225. [Google Scholar] [CrossRef]
- Laiho, R.; Laine, J. Tree stand biomass and carbon content in an age sequence of drained pine mires in southern Finland. For. Ecol. Manag. 1997, 93, 161–169. [Google Scholar] [CrossRef]
- Martin, A.R.; Thomas, S.C. Size-dependent changes in leaf and wood chemical traits in two Caribbean rainforest trees. Tree Physiol. 2013, 33, 1338–1353. [Google Scholar] [CrossRef] [PubMed] [Green Version]
- Martin, A.R.; Thomas, S.C.; Zhao, Y. Size-dependent changes in wood chemical traits: A comparison of neotropical saplings and large trees. AoB Plants 2013, 5, plt039. [Google Scholar] [CrossRef]
- Herman, M.; Dutilleul, P.; Avella-Shaw, T. Growth rate effects on temporal trajectories of ring width, wood density, and mean tracheid length in Norway spruce (Picea abies (L.) Karst.). Wood Fiber Sci. 1998, 30, 6–17. [Google Scholar]
- Pelletier, G.; Pitt, D.G. Silvicultural responses of two spruce plantations to midrotation commercial thinning in New Brunswick. Can. J. For. Res. 2008, 38, 851–867. [Google Scholar] [CrossRef]
- Lasserre, J.P.; Mason, E.G.; Watt, M.S.; Moore, J.R. Influence of initial planting spacing and genotype on microfibril angle, wood density, fibre properties and modulus of elasticity in Pinus radiata D. Don corewood. For. Ecol. Manag. 2009, 258, 1924–1931. [Google Scholar] [CrossRef]
- Jelonek, T.; Pazdrowski, W.; Tomczak, A.; Splawa-Neyman, S. The efect of biological class and age on physical and mechanical properties of european larch (Larix decidua mill.) in Poland. Wood Res. 2009, 54, 1–14. [Google Scholar]
- Deng, X.W.; Zhang, L.Y.; Lei, P.F.; Xiang, W.H.; Yan, W.D. Variations of wood basic density with tree age and social classes in the axial direction within Pinus massoniana stems in Southern China. Ann. For. Sci. 2013, 71, 505–516. [Google Scholar] [CrossRef] [Green Version]
- Peri, P.L.; Gargaglione, V.; Pastur, G.M.; Lencinas, M.V. Carbon accumulation along a stand development sequence of Nothofagus antarctica forests across a gradient in site quality in Southern Patagonia. For. Ecol. Manag. 2010, 260, 229–237. [Google Scholar] [CrossRef]
- Martin, A.R.; Gezahegn, S.; Thomas, S.C. Variation in carbon and nitrogen concentration among major woody tissue types in temperate trees. Can. J. For. Res. 2015, 45, 744–757. [Google Scholar] [CrossRef]
- Mvolo, C.S.; Koubaa, A.; Beaulieu, J.; Cloutier, A.; Mazerolle, M.J. Variation in Wood Quality in White Spruce (Picea Glauca (Moench) Voss). Part I. Defining the Juvenile–Mature Wood Transition Based on Tracheid Length. Forests 2015, 6, 183–202. [Google Scholar] [CrossRef] [Green Version]
- Mvolo, C.S.; Koubaa, A.; Defo, M.; Beaulieu, J.; Yemele, M.-C.; Cloutier, A. Prediction of tracheid length and diameter in white spruce (Picea glauca (Moench) Voss). IAWA 2015, 36, 186–207. [Google Scholar] [CrossRef]
- Mvolo, C.S.; Koubaa, A.; Beaulieu, J.; Cloutier, A.; Defo, M.; Yemele, M.-C. Phenotypic correlations among growth and selected wood properties in white spruce (Picea glauca (Moench) Voss). Forests 2019, 10, 589. [Google Scholar]
- Larson, P.R.; Kretschmann, D.E.; Clark, A., III; Isebrands, J.G. Formation and Properties of Juvenile Wood in Southern Pines: A Synopsis; General Technical Report, FPL-GTR-129; US Department of Agriculture, Forest Service, Forest Products Laboratory: Madison, WI, USA, 2001; p. 42.
- Erol, M.; Haykiri-Acma, H.; Küçükbayrak, S. Calorific value estimation of biomass from their proximate analyses data. Renew. Energy 2010, 35, 170–173. [Google Scholar] [CrossRef]
- Mvolo, C.S. Valorisation Thermochimique et Biochimique de la Biomasse Ligneuse Forestiere au Quebec: Possibles Implications Pour L’amenagement Forestier et les Industries Traditionnelles de la Fibre. 2010. Available online: https://www.researchgate.net/publication/281110602_Valorisation_thermochimique_et_biochimique_de_la_biomasse_ligneuse_forestiere_au_Quebec_possibles_implications_pour_l’amenagement_forestier_et_les_industries_traditionnelles_de_la_fibre (accessed on 12 November 2021).
- Shen, Y.; Gao, Z.; Hou, X.; Chen, Z.; Jiang, J.; Sun, J. Spectral and thermal analysis of Eucalyptus wood drying at different temperature and methods. Dry. Technol. 2020, 38, 313–320. [Google Scholar] [CrossRef]
- Parikh, J.; Channiwala, S.A.; Ghosal, G.K. A correlation for calculating elemental composition from proximate analysis of biomass materials. Fuel 2007, 86, 1710–1719. [Google Scholar] [CrossRef]
- Telmo, C.; Lousada, J.; Moreira, N. Proximate analysis, backwards stepwise regression between gross calorific value, ultimate and chemical analysis of wood. Bioresour. Technol. 2010, 101, 3808–3815. [Google Scholar] [CrossRef] [PubMed]
- Kretschmann, D.E. Mechanical Properties of Wood. In Wood Handbook, Wood as an Engineering Material; Ross, R.J., Ed.; USDA Forest Service, Forest Products Laboratory: Madison, WI, USA, 2010; Volume FPL-GTR-190, p. 509. [Google Scholar]
- Ward, K.R.; Matejtschuk, P. The principles of freeze-drying and application of analytical technologies. Methods Mol. Biol. 2021, 2180, 99–127. [Google Scholar]
- Franks, F. Freeze-drying of bioproducts: Putting principles into practice. Eur. J. Pharm. Biopharm. 1998, 45, 221–229. [Google Scholar] [CrossRef]
- Lamlom, S.H.; Savidge, R.A. A reassessment of carbon content in wood: Variation within and between 41 North American species. Biomass Bioenergy 2003, 25, 381–388. [Google Scholar] [CrossRef]
- Nienstaedt, H.; Zasada, J.C. White Spruce. In Sylvics—Volume 1: Conifers; Burns, R.M., Honkala, B.H., Eds.; USDA, Forest Service: Washington, DC, USA, 1990; Agriculture Handbook 654; pp. 389–442. [Google Scholar]
- Little, E.L. Checklist of United States Trees (Native and Naturalized); US Department of Agriculture, Forest Service: Washington, DC, USA, 1979; Agriculture Handbook 541; p. 375.
- Thermofisher. Lindberg/Blue M™ Moldatherm™ Box Furnaces. Available online: https://www.thermofisher.com/order/catalog/product/BF51794C (accessed on 12 November 2021).
- Labconco. FreeZone 2.5 Liter -50C Benchtop Freeze Dryers. Available online: https://www.labconco.com/product/freezone-25-liter-50c-benchtop-freeze-dryers/6102 (accessed on 12 November 2021).
- Leco. 828 Series Combustion. Available online: https://www.leco.com/product/828 (accessed on 12 November 2021).
- R Core Team. R: A Language and Environment for Statistical Computing; R Foundation for Statistical Computing: Vienna, Austria, 2018. [Google Scholar]
- Martin, A.R.; Thomas, S.C. A reassessment of carbon content in tropical trees. PLoS ONE 2011, 6, e23533. [Google Scholar] [CrossRef] [PubMed] [Green Version]
- Castaño-Santamaría, J.; Bravo, F. Variation in carbon concentration and basic density along stems of sessile oak (Quercus petraea (Matt.) Liebl.) and Pyrenean oak (Quercus pyrenaica Willd.) in the Cantabrian Range (NW Spain). Ann. For. Sci. 2012, 69, 663–672. [Google Scholar] [CrossRef] [Green Version]
- Rosner, S. Acoustic detection of cavitation events in water conducting elements of norway spruce sapwood. J. Acoust. Emiss. 2004, 22, 9. [Google Scholar]
- Baldwin, C., Jr.; Peterson, K.D.; Clark III, A.; Ferguson, R.B.; Strub, M.R.; Bower, D.R. The effects of spacing and thinning on stand and tree characteristics of 38-year-old Loblolly Pine. For. Ecol. Manag. 2000, 137, 91–102. [Google Scholar] [CrossRef]
- Vincent, M.; Krause, C.; Koubaa, A. Variation in black spruce (Picea mariana (Mill.) BSP) wood quality after thinning. Ann. For. Sci. 2011, 68, 1115–1125. [Google Scholar] [CrossRef]
- Cown, D.J. Comparison of the effects of two thinning regimes on some wood properties of radiata pine. N. Z. J. For. Sci. 1974, 4, 540–551. [Google Scholar]
- Smith, D.M. Wood Quality of Loblolly Pine After Thinning; US Department of Agriculture, Forest Service, Forest Products Laboratory: Madison, WI, USA, 1968.
- Megraw, R.A. Wood Quality Factors in Loblolly Pine—The Influence of Tree Age, Position in Tree, and Cultural Practice on Wood Specific Gravity, Fiber Length, and Fibril Angle; Tappi Press: Atlanta, GA, USA, 1985; p. 88. [Google Scholar]
- Donaldson, L.A.; Grace, J.; Downes, G.M. Within-tree variation in anatomical properties of compression wood in radiata pine. IAWA J. 2004, 25, 253–271. [Google Scholar] [CrossRef] [Green Version]
- Wadenbäck, J.; Clapham, D.; Gellerstedt, G.; Von Arnold, S. Variation in content and composition of lignin in young wood of Norway spruce. Holzforschung 2004, 58, 107–115. [Google Scholar] [CrossRef]
- Savidge, R.A. Tree growth and wood quality. In Wood Quality and Its Biological Basis; Barnett, J.R., Jeronimidis, G., Eds.; CRC Press LLC: Boca Raton, FL, USA, 2003; p. 226. [Google Scholar]
Publisher’s Note: MDPI stays neutral with regard to jurisdictional claims in published maps and institutional affiliations. |
© 2021 by the authors. Licensee MDPI, Basel, Switzerland. This article is an open access article distributed under the terms and conditions of the Creative Commons Attribution (CC BY) license (https://creativecommons.org/licenses/by/4.0/).