
Evaluation of Thermoelectric Generators under Mismatching Conditions


Abstract
:1. Introduction
2. Materials and Methods
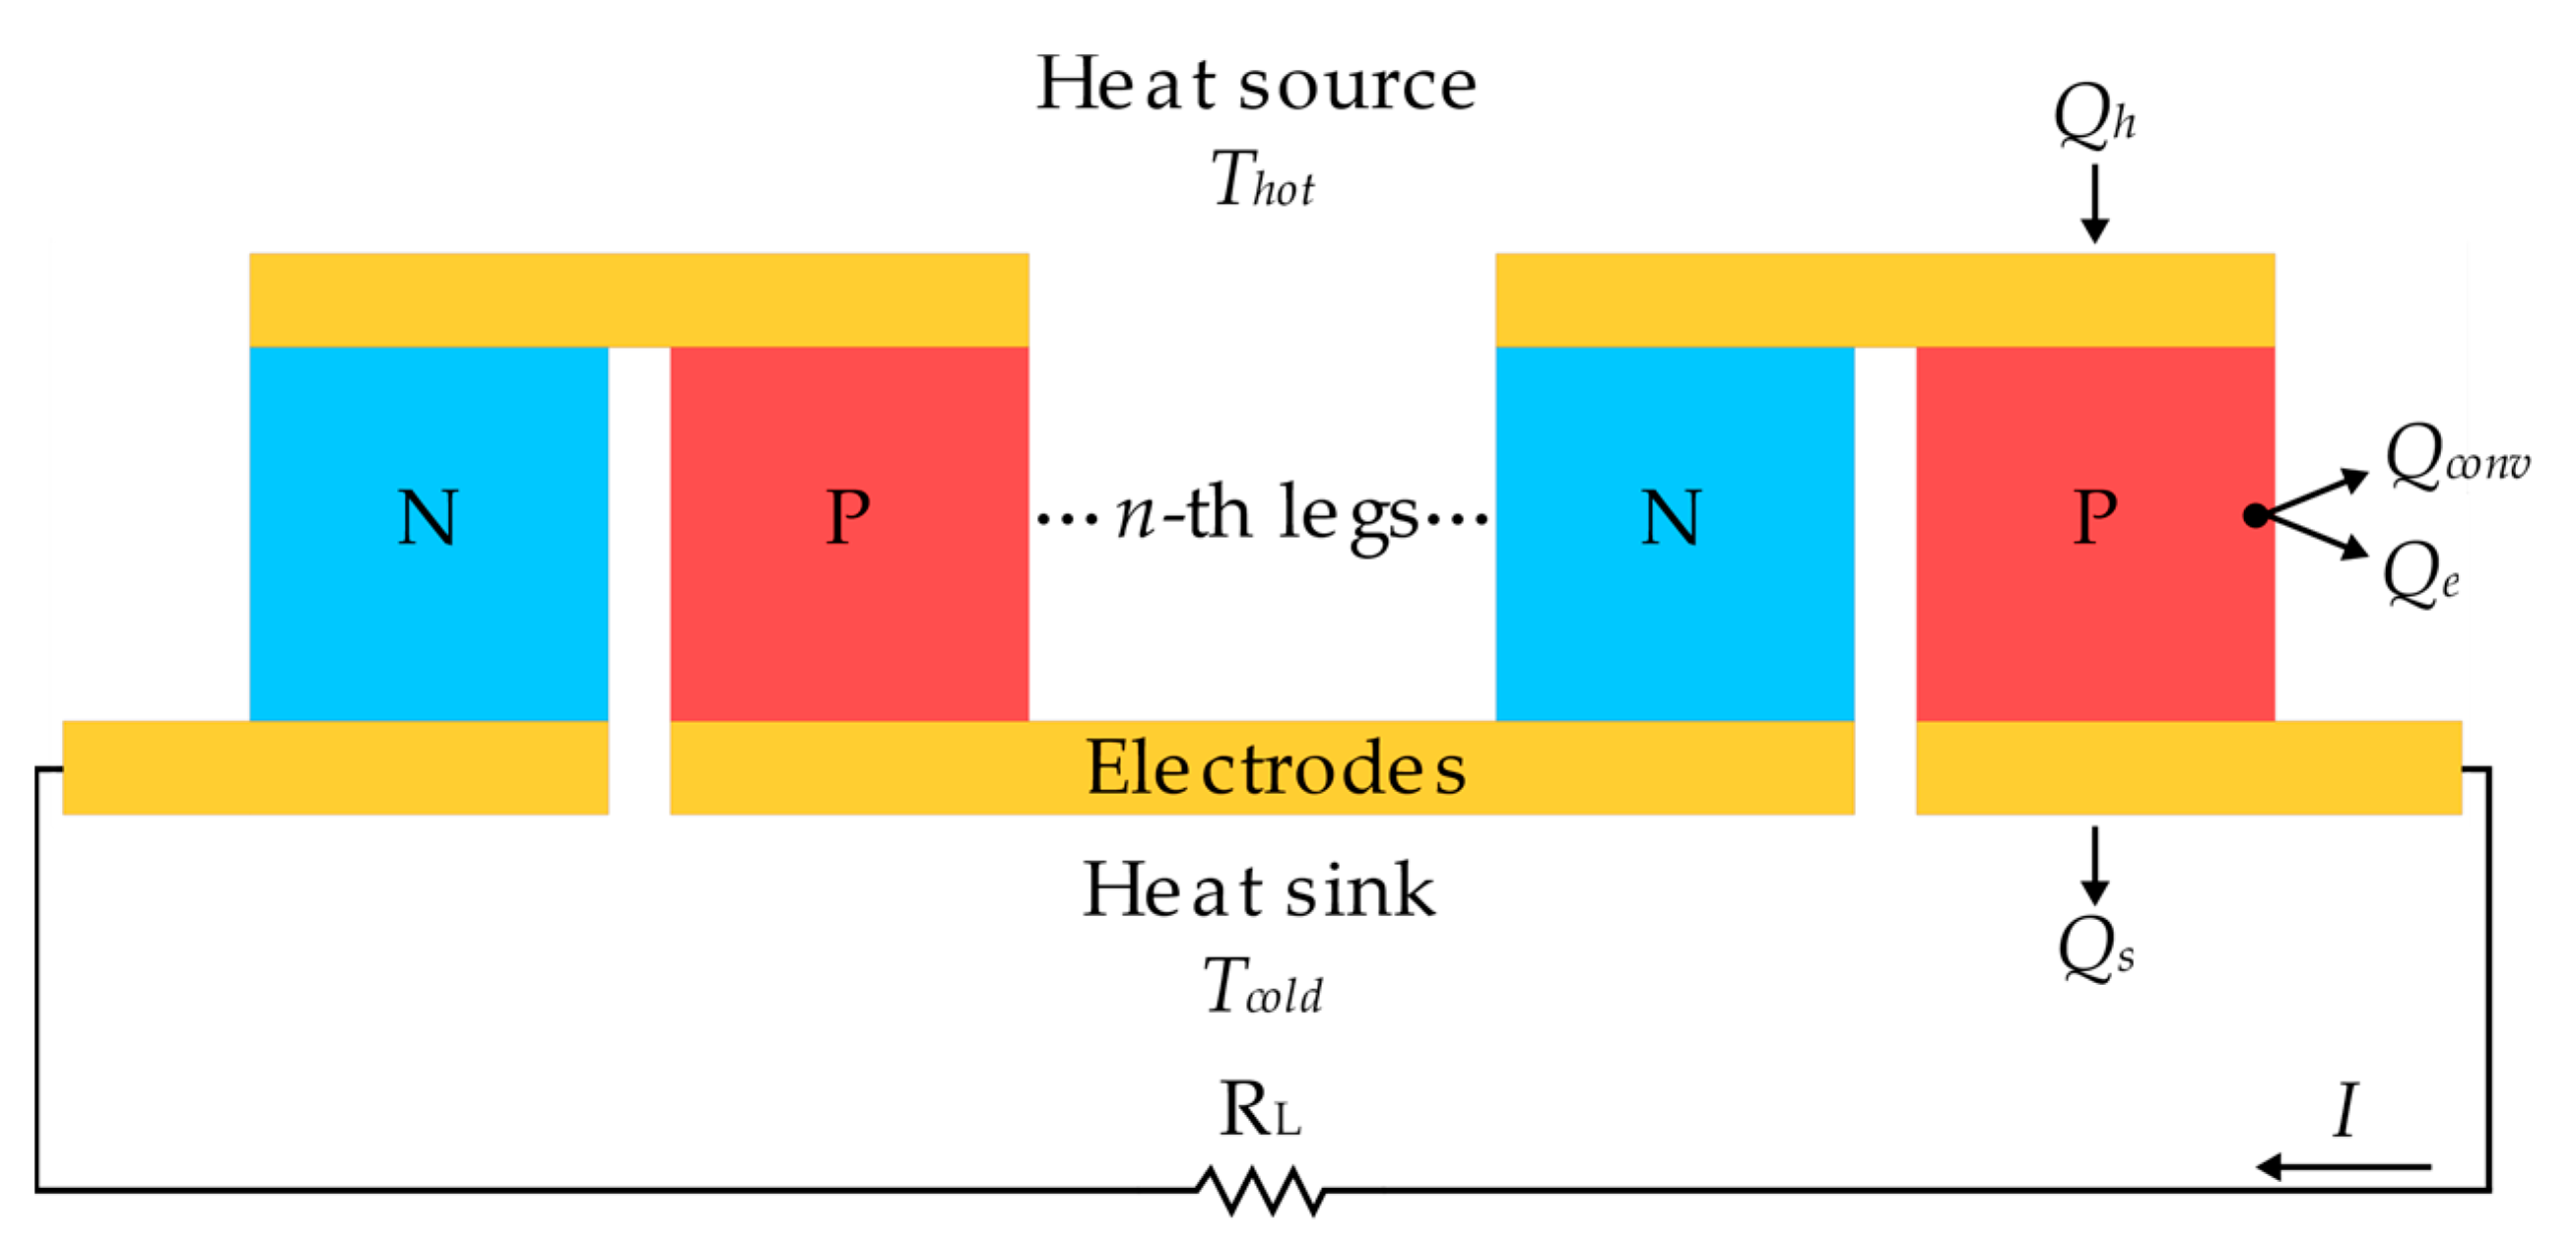
2.1. Governing Equations
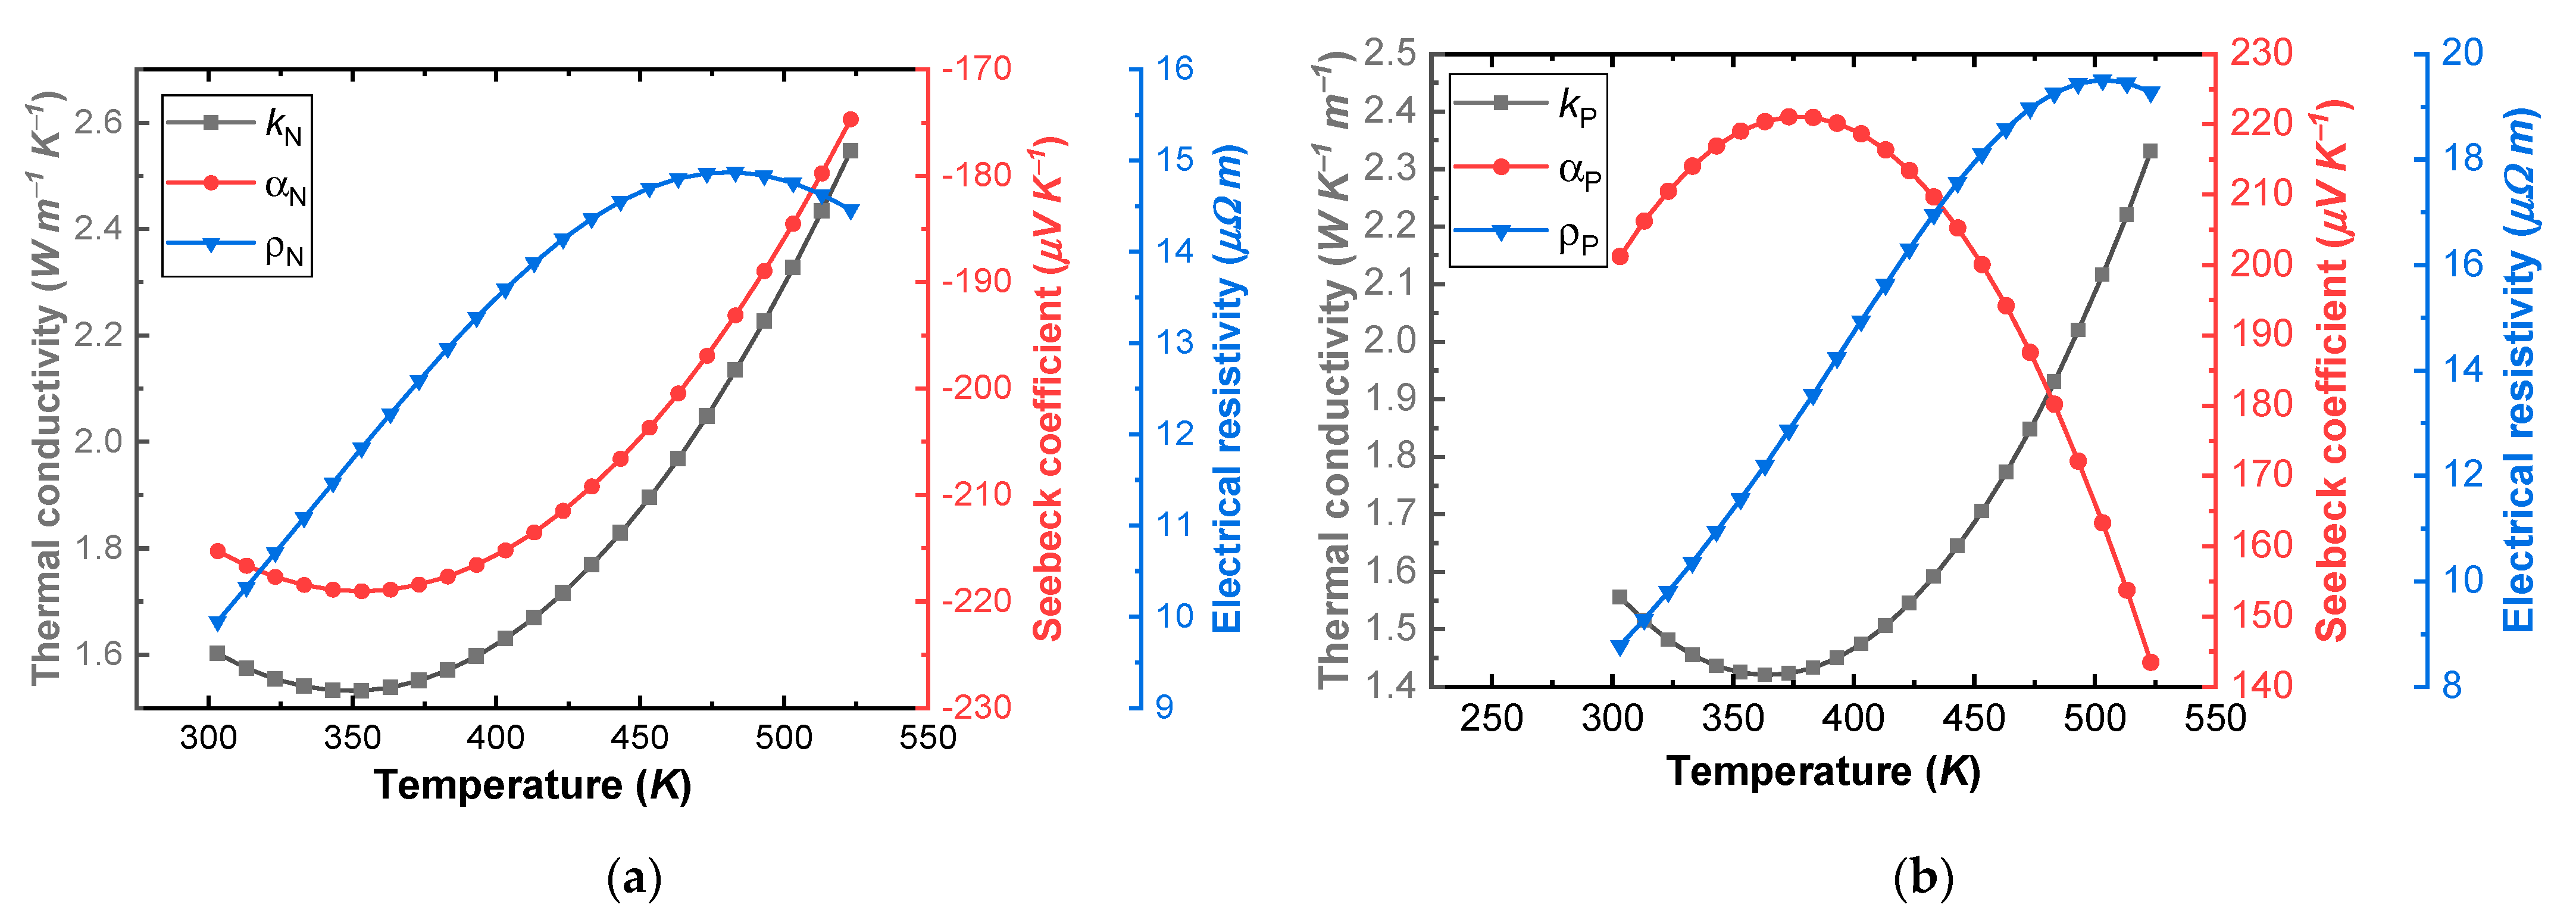
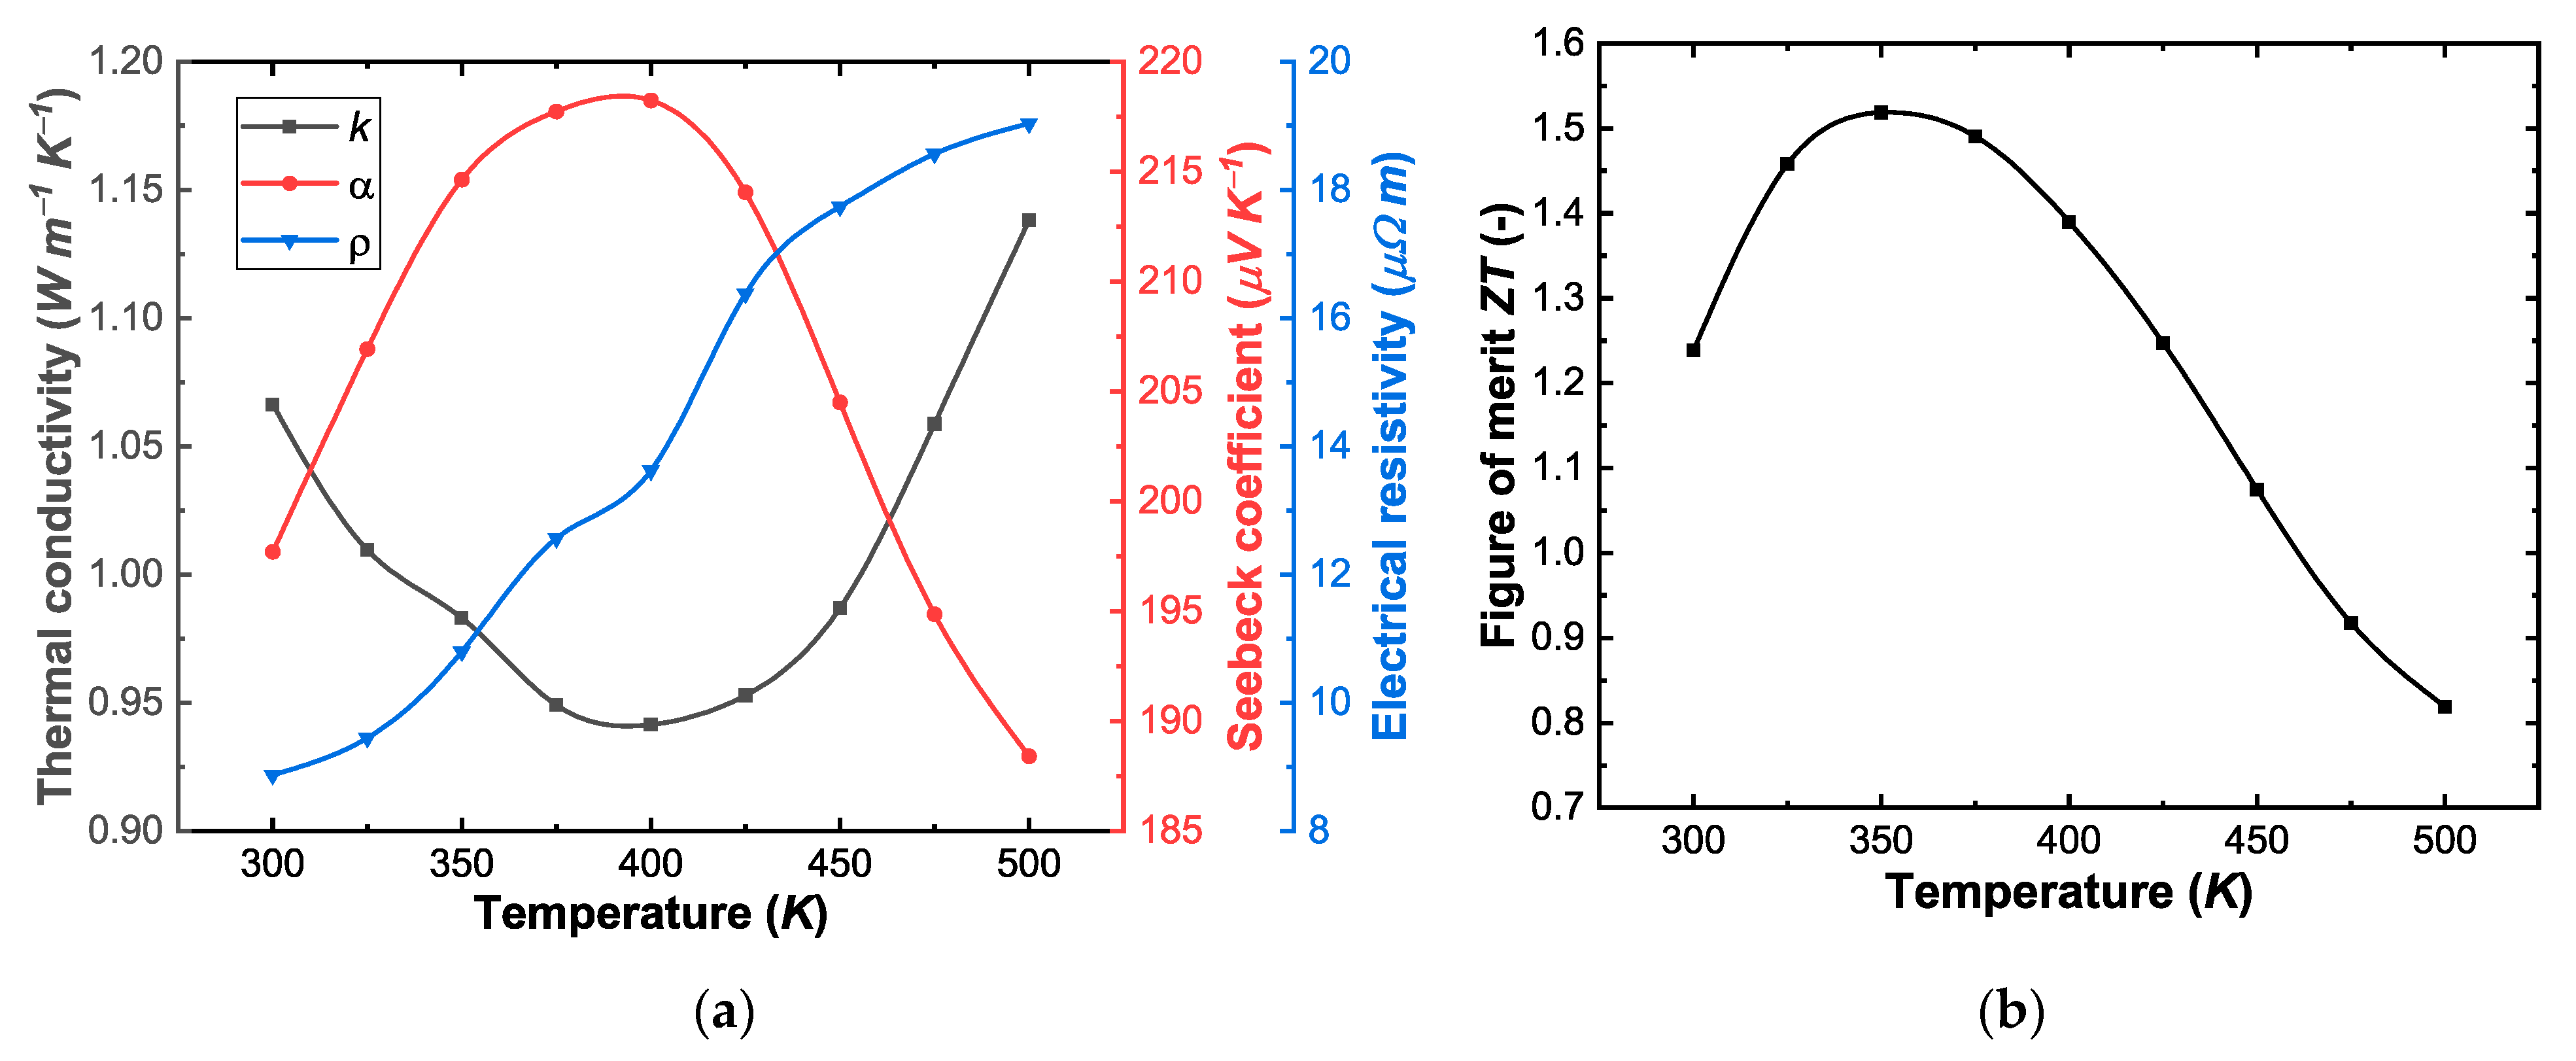
2.2. Thermoelectric Properties of Materials
2.3. Validation Study of the Numerical Model
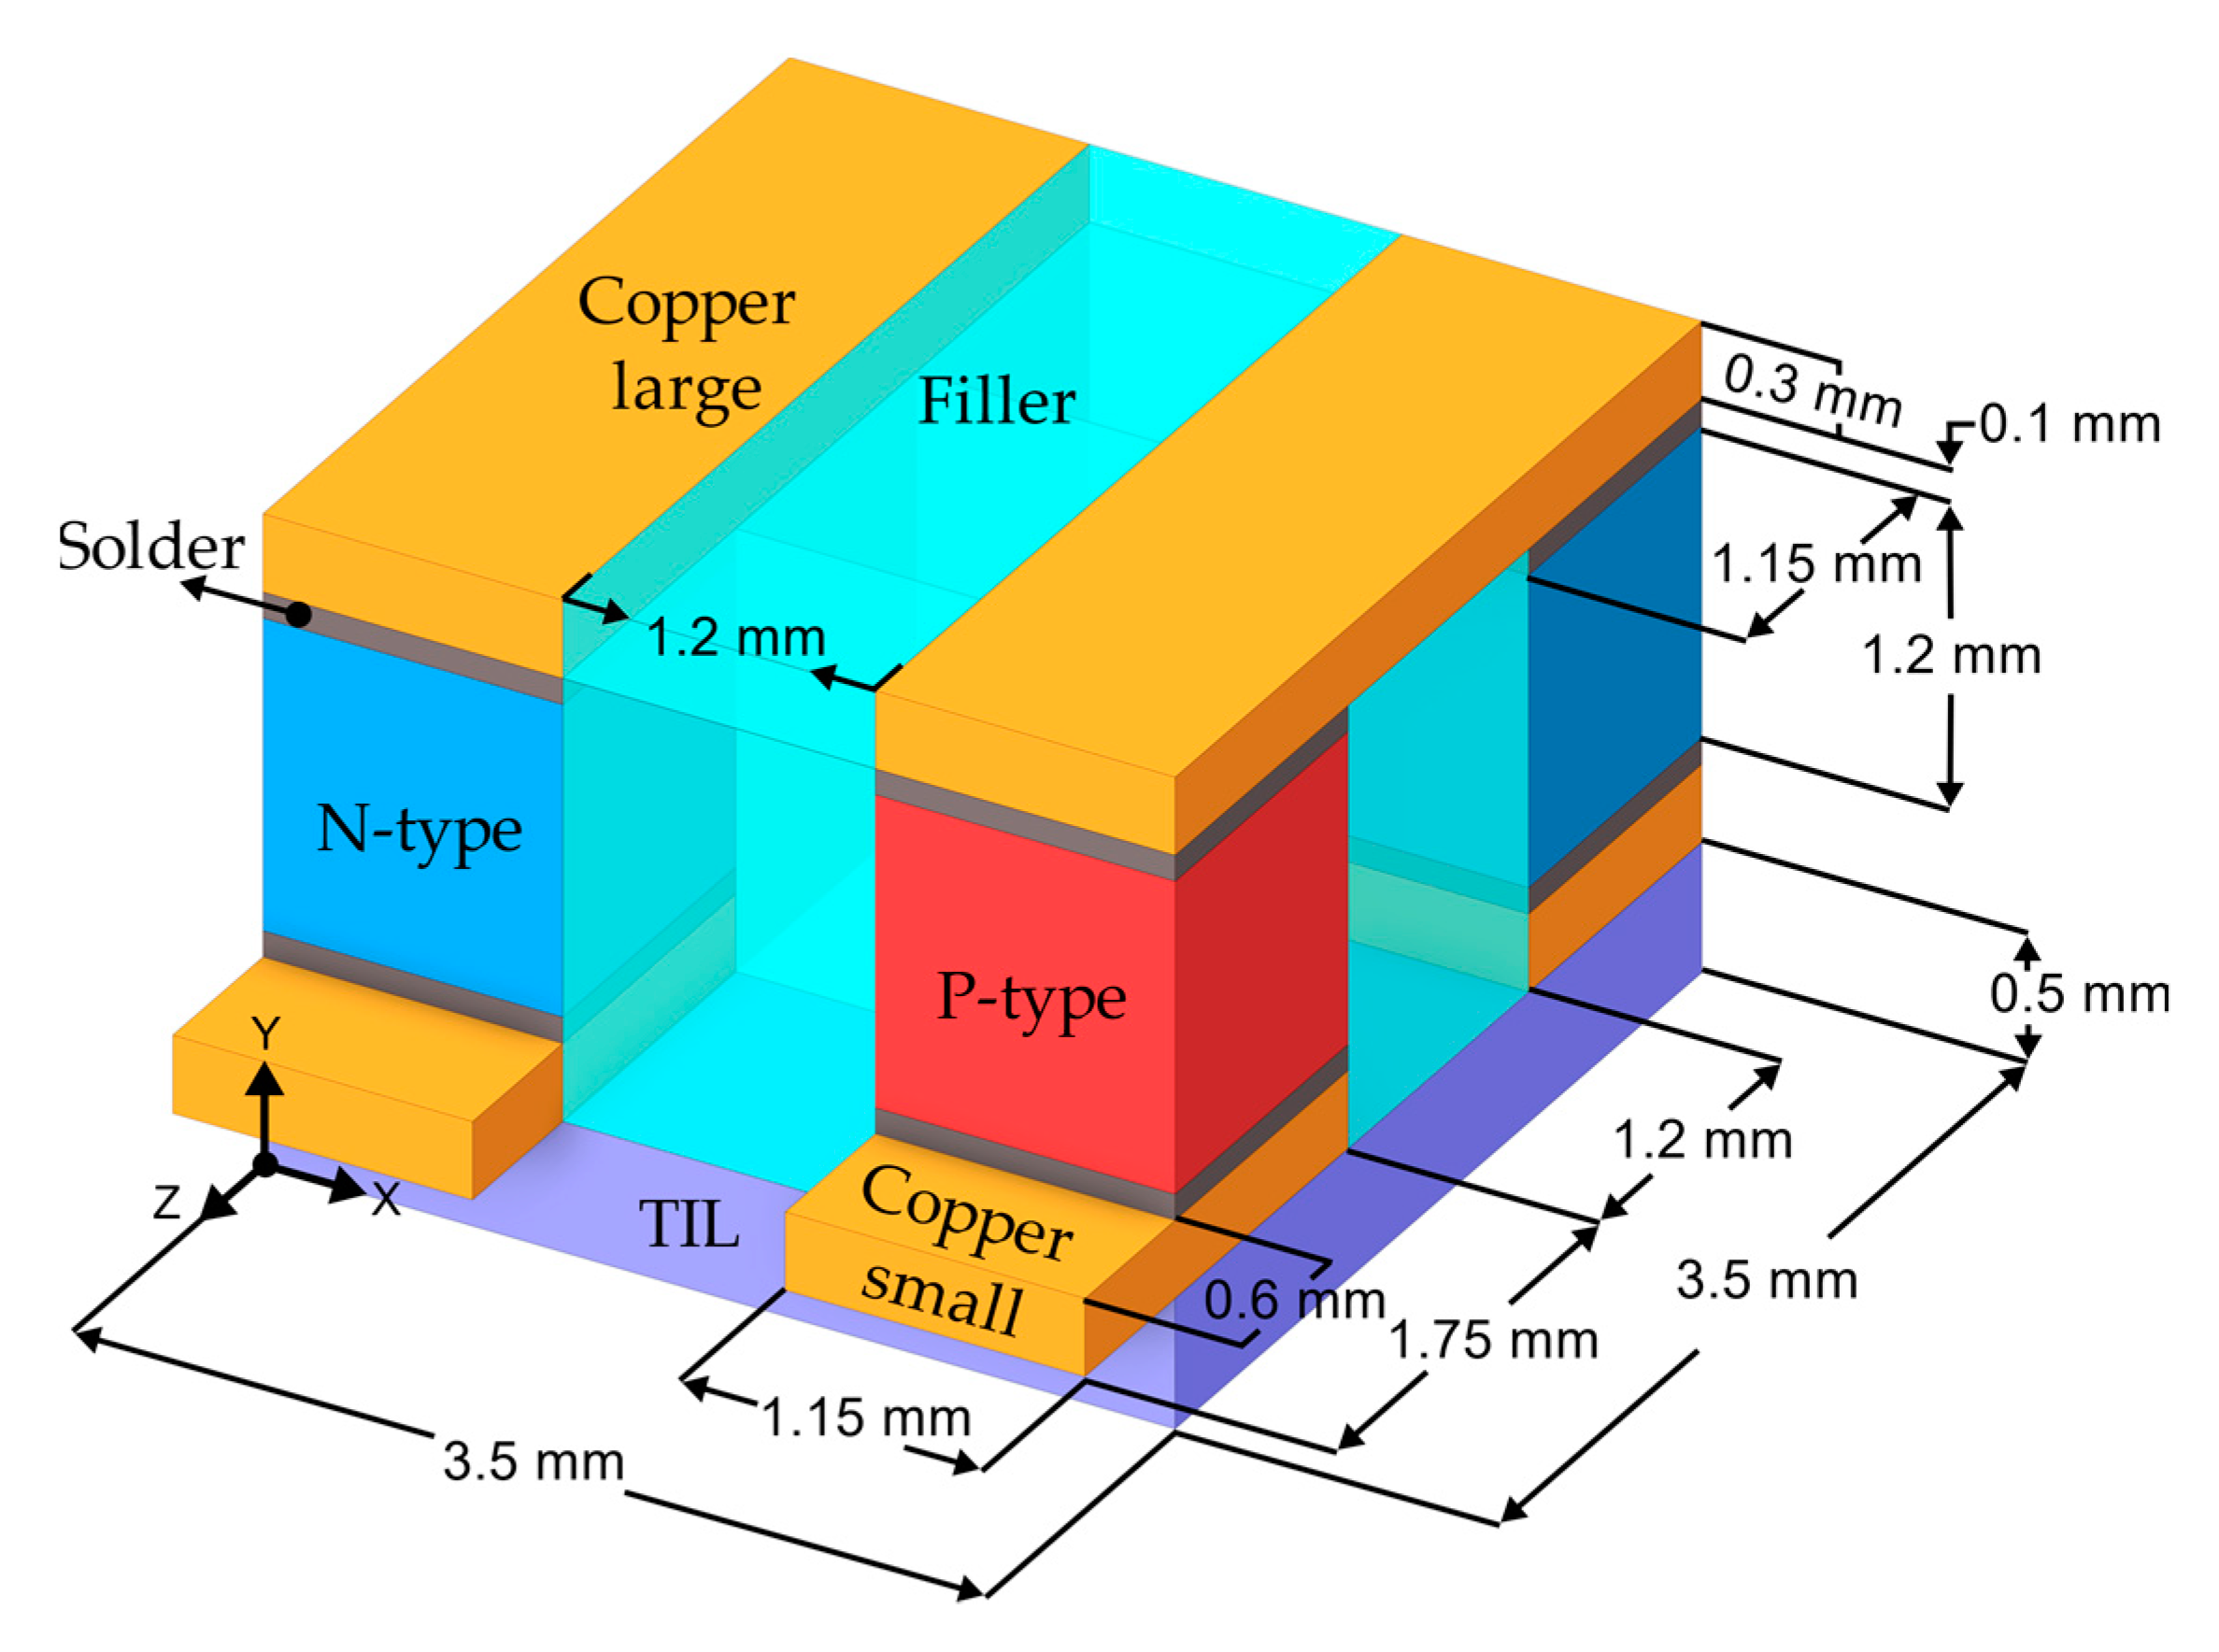
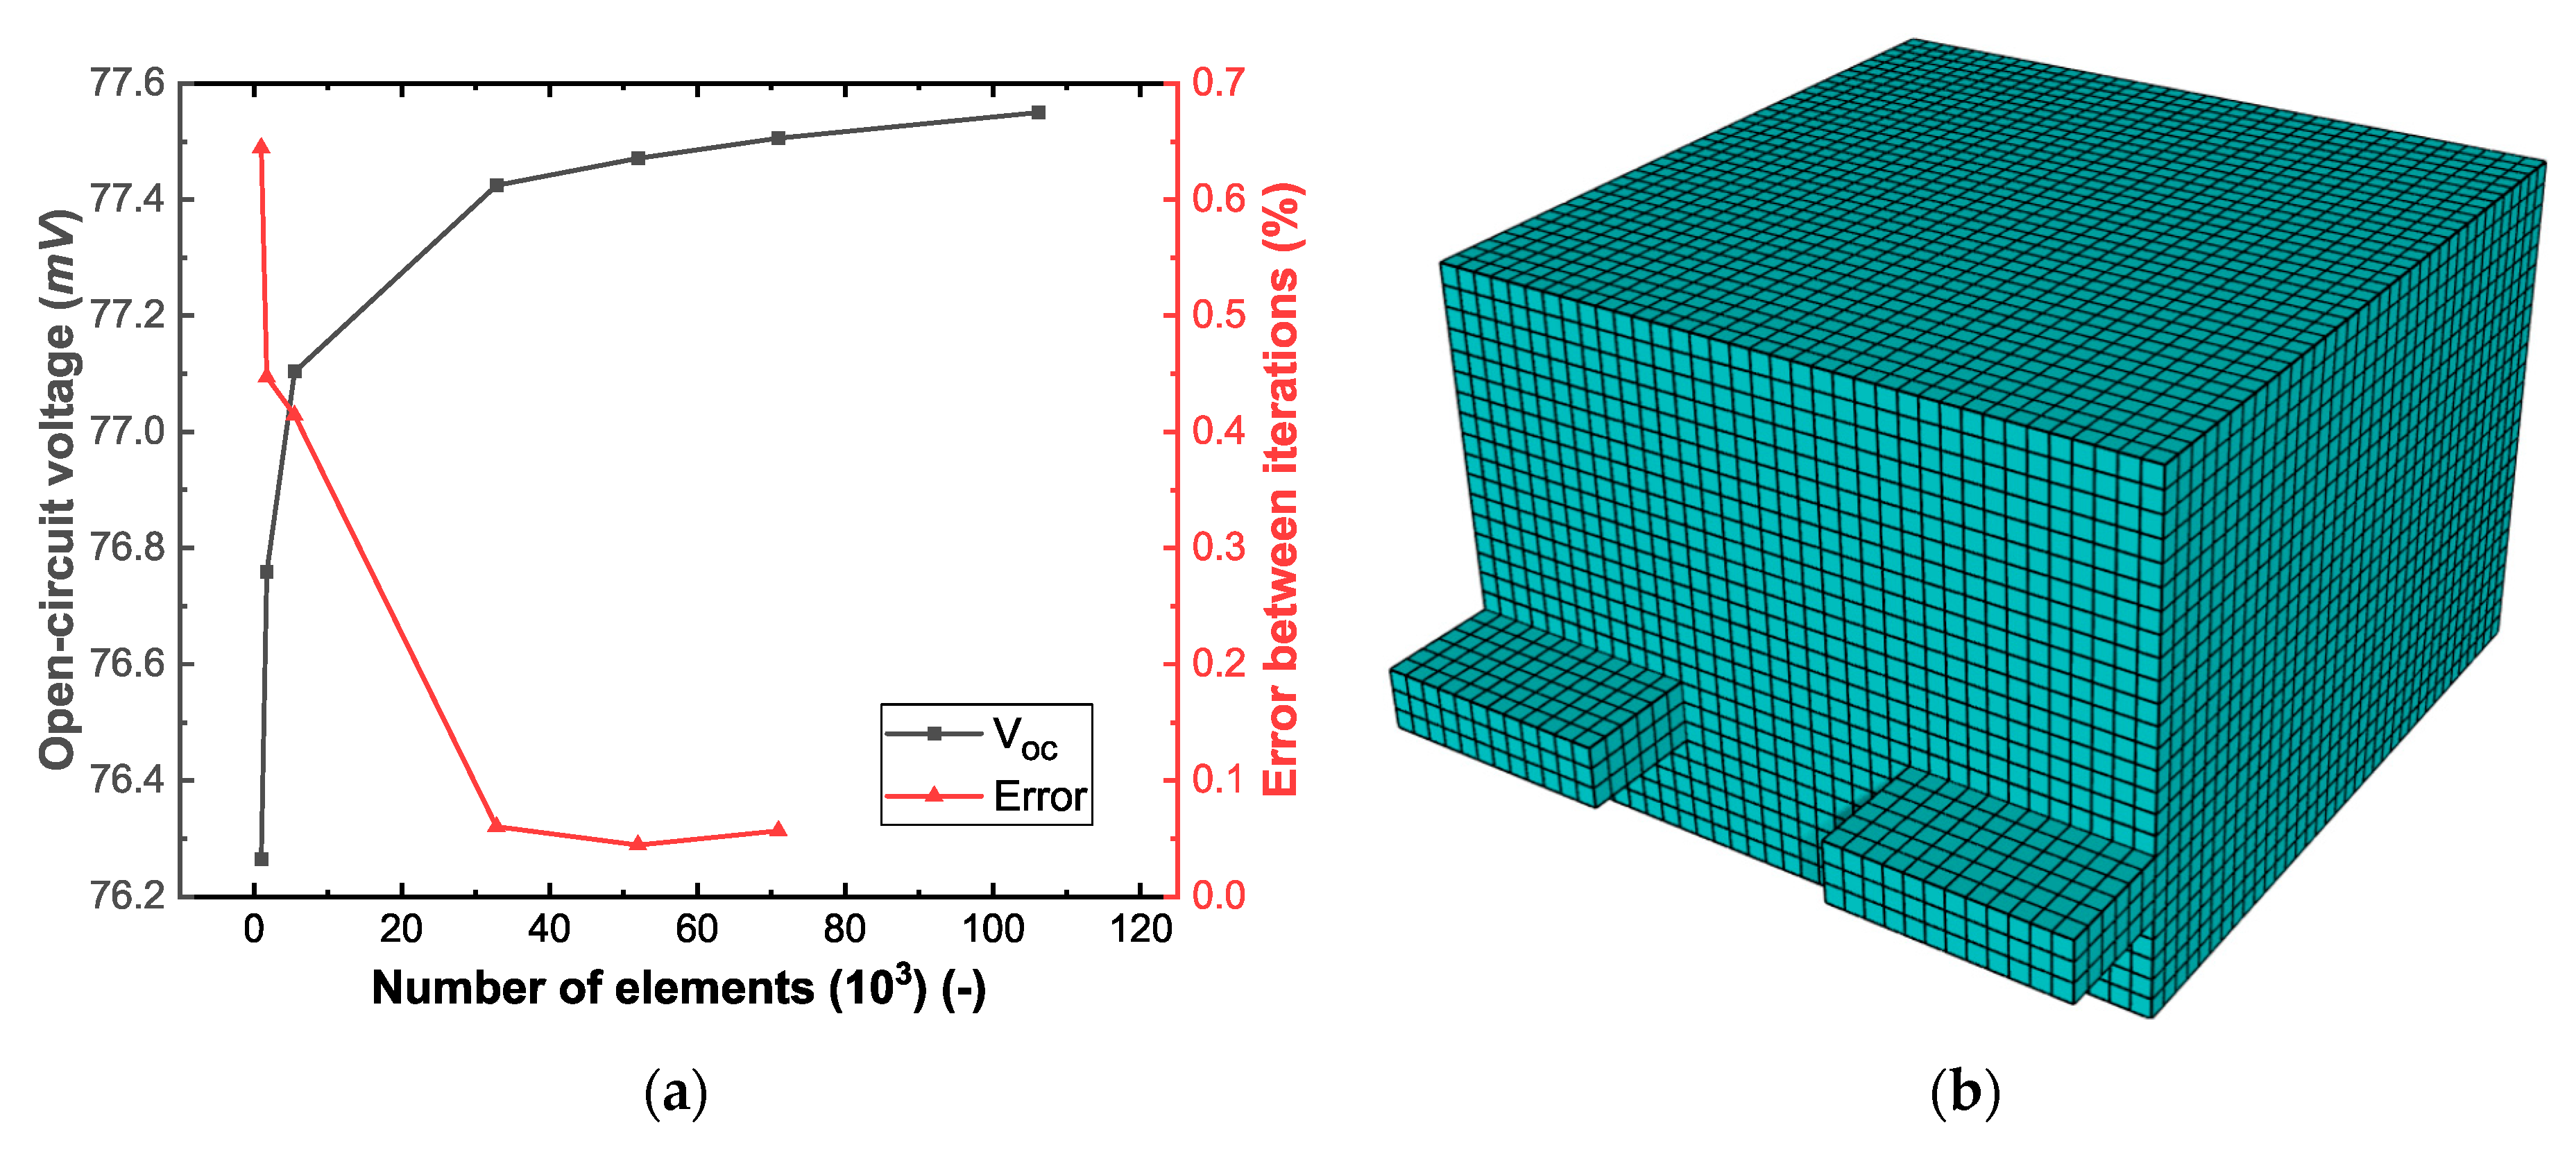
2.3.1. TEG Device Three-Dimensional Model and Mesh
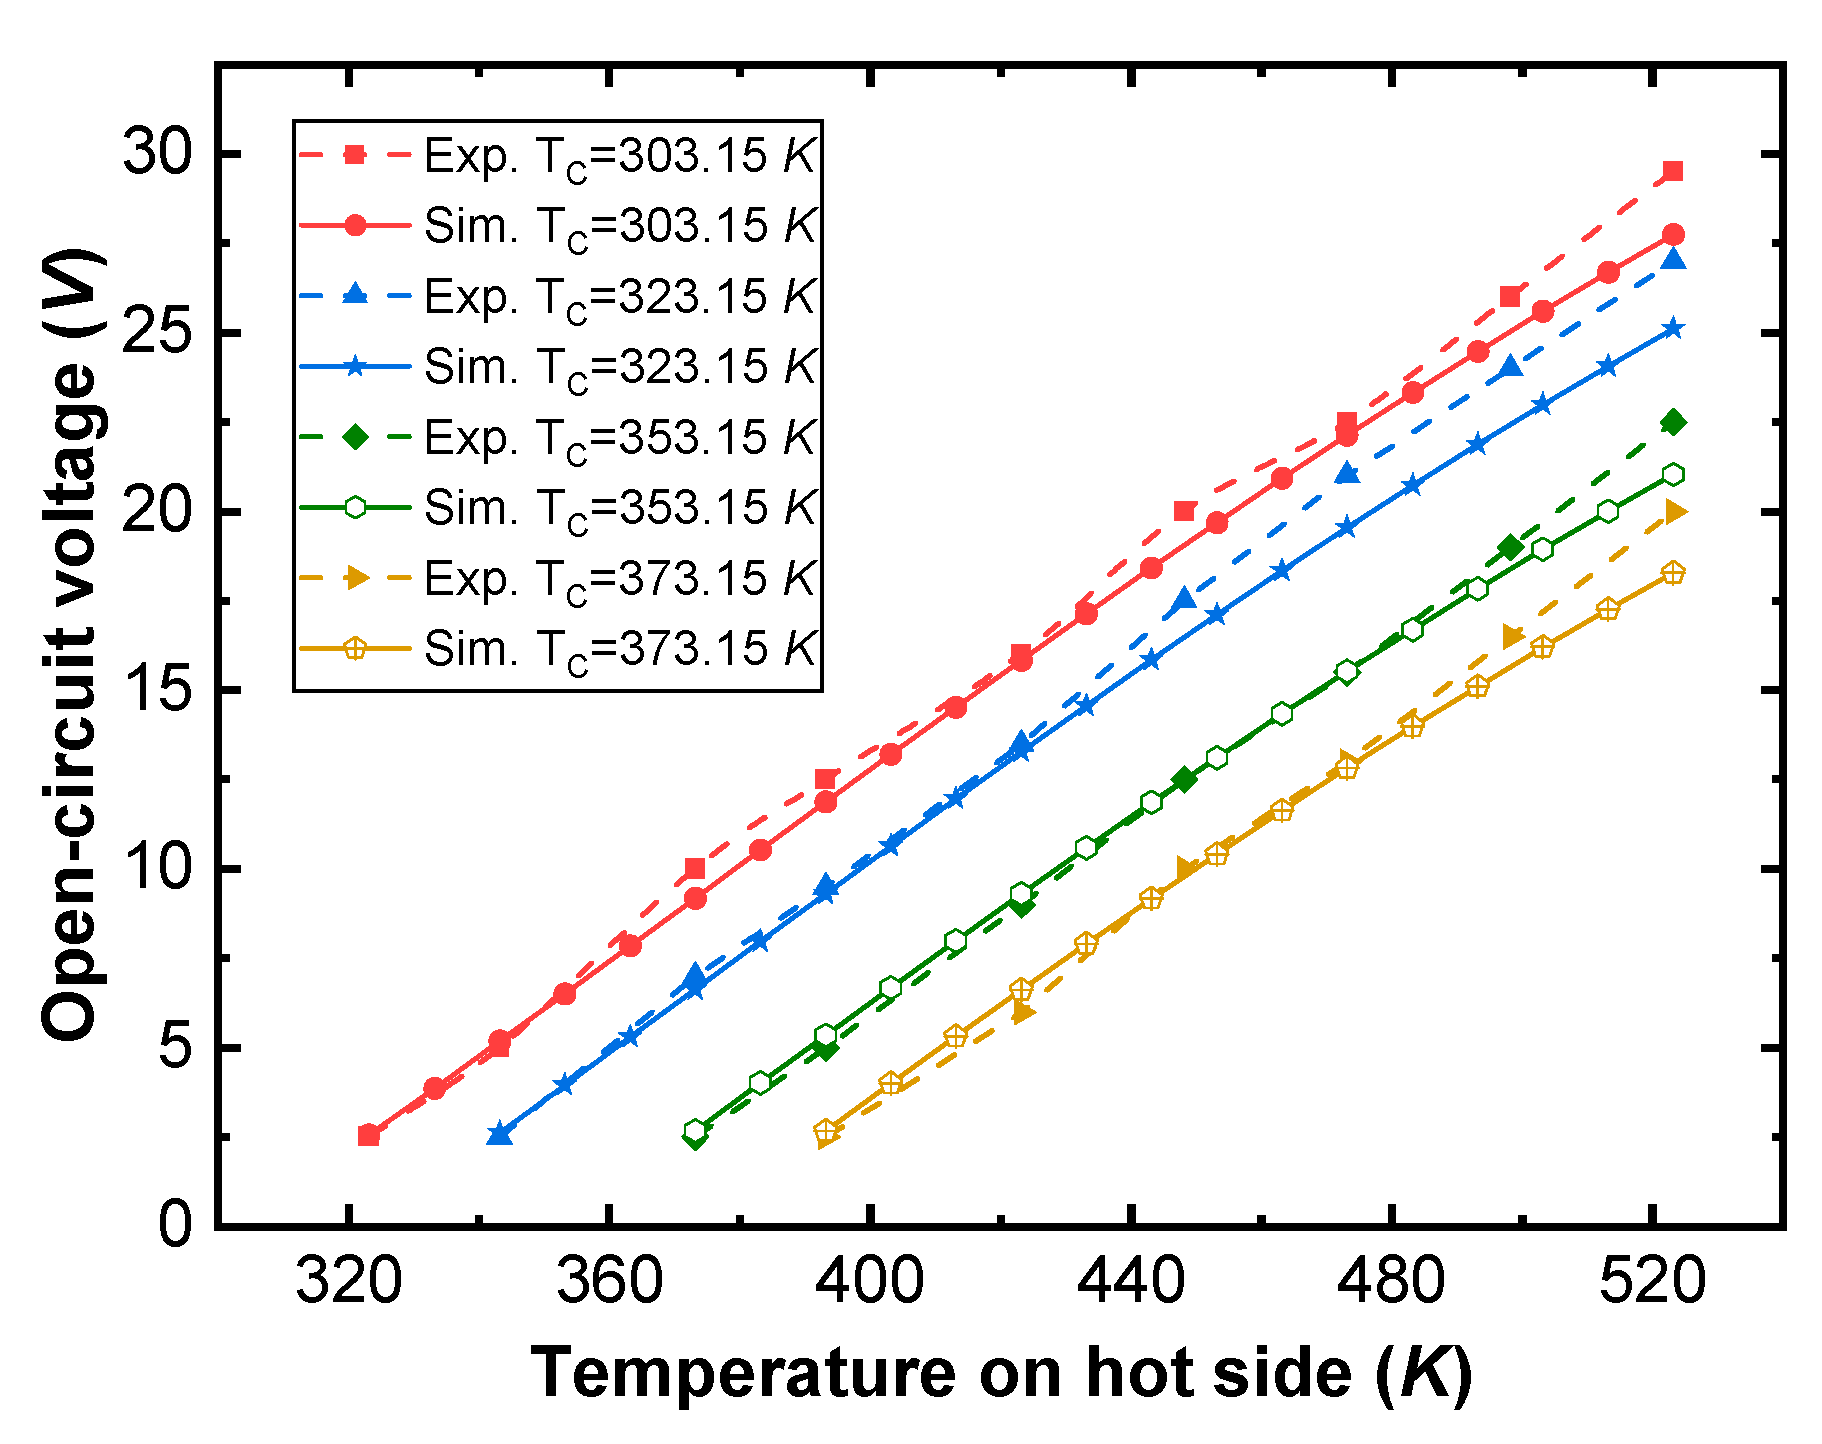
2.3.2. Comparison between Experimental Data and Numerical Model Results
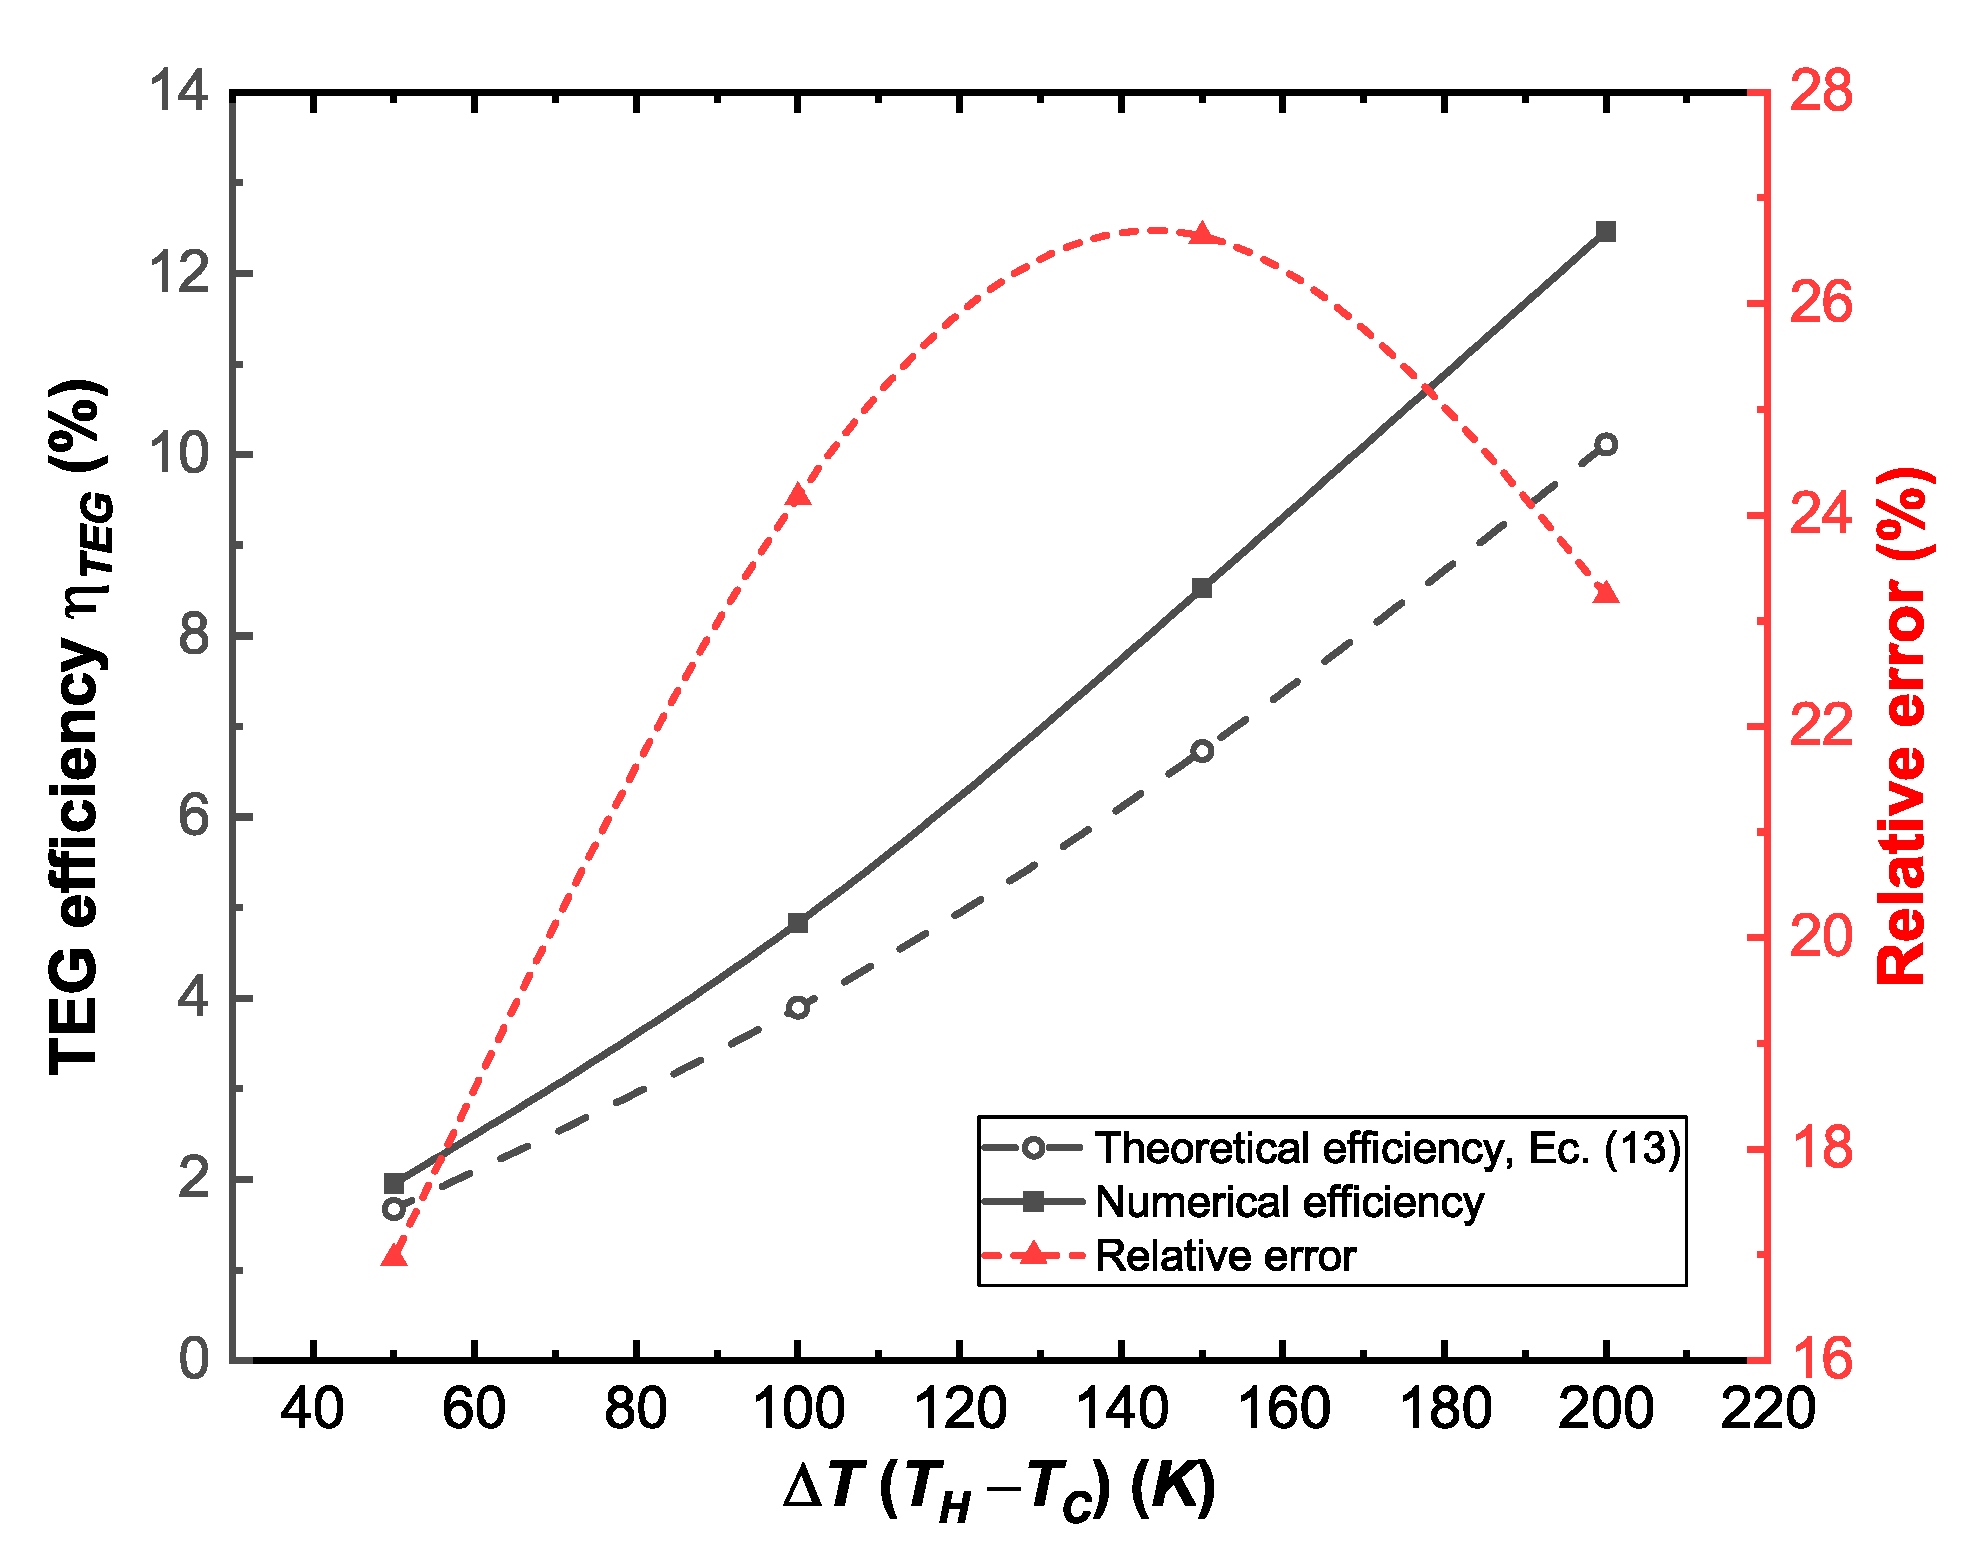
2.3.3. Verification of Numerical Thermal Efficiency
2.4. Boundary Conditions and Parametric Studies
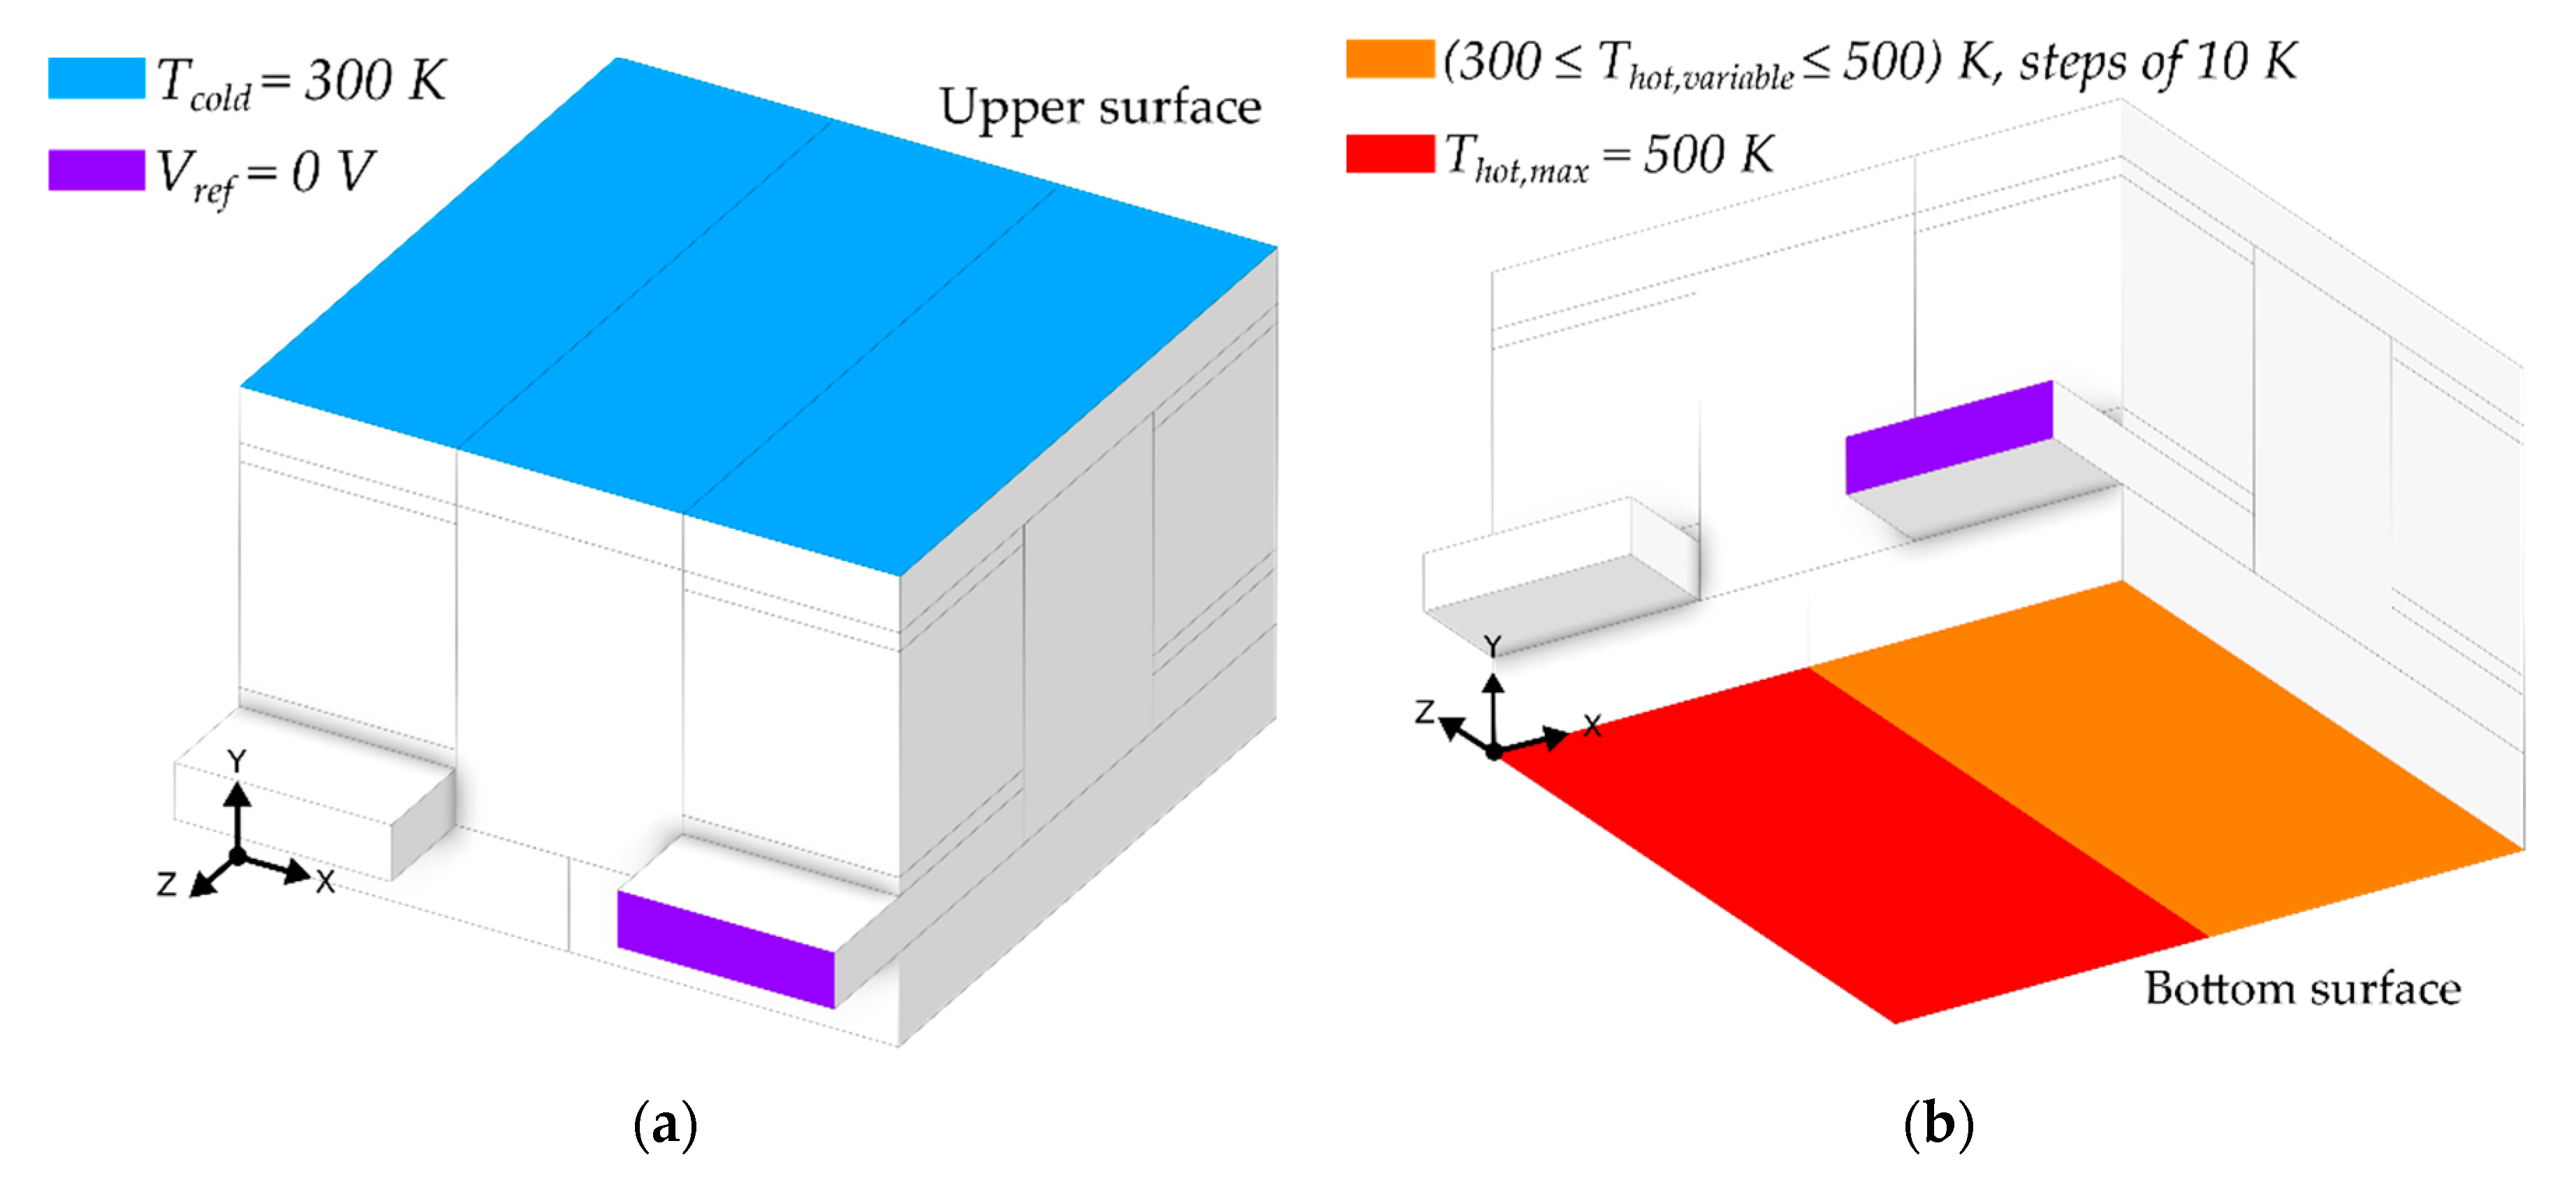
2.4.1. Numerical Simulation of the Mismatching Condition on the Heat Side (Bottom Surfaces) of the TEG Device
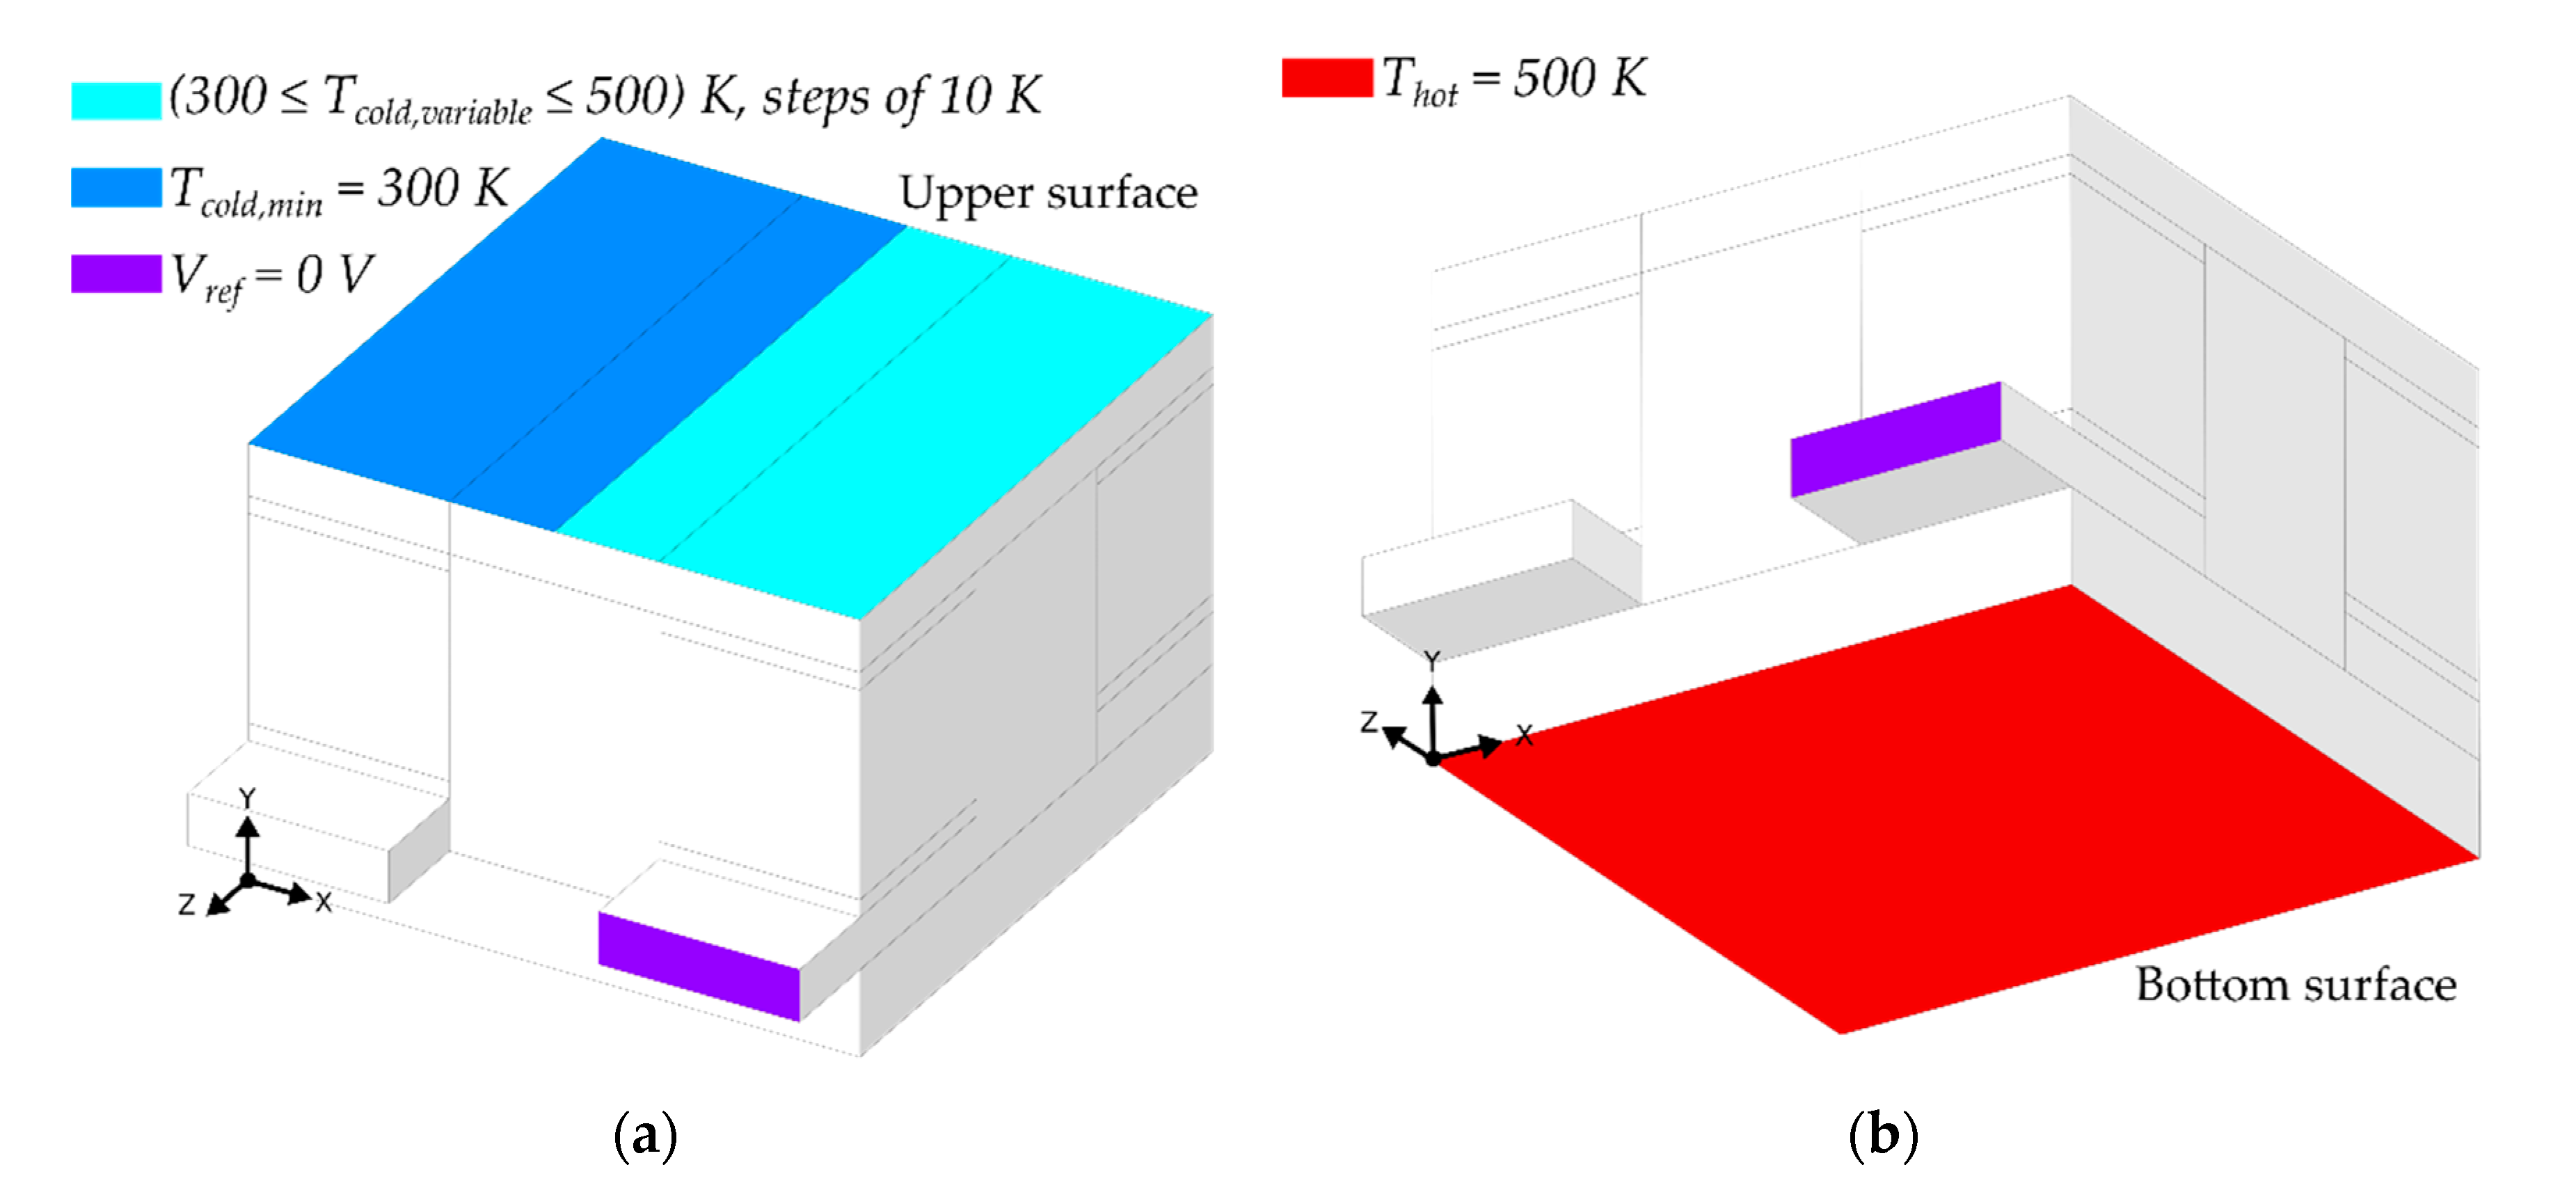
2.4.2. Numerical Simulation of the Mismatching Condition on the Heatsink (Upper Surfaces) of the TEG Device
3. Results and Discussion
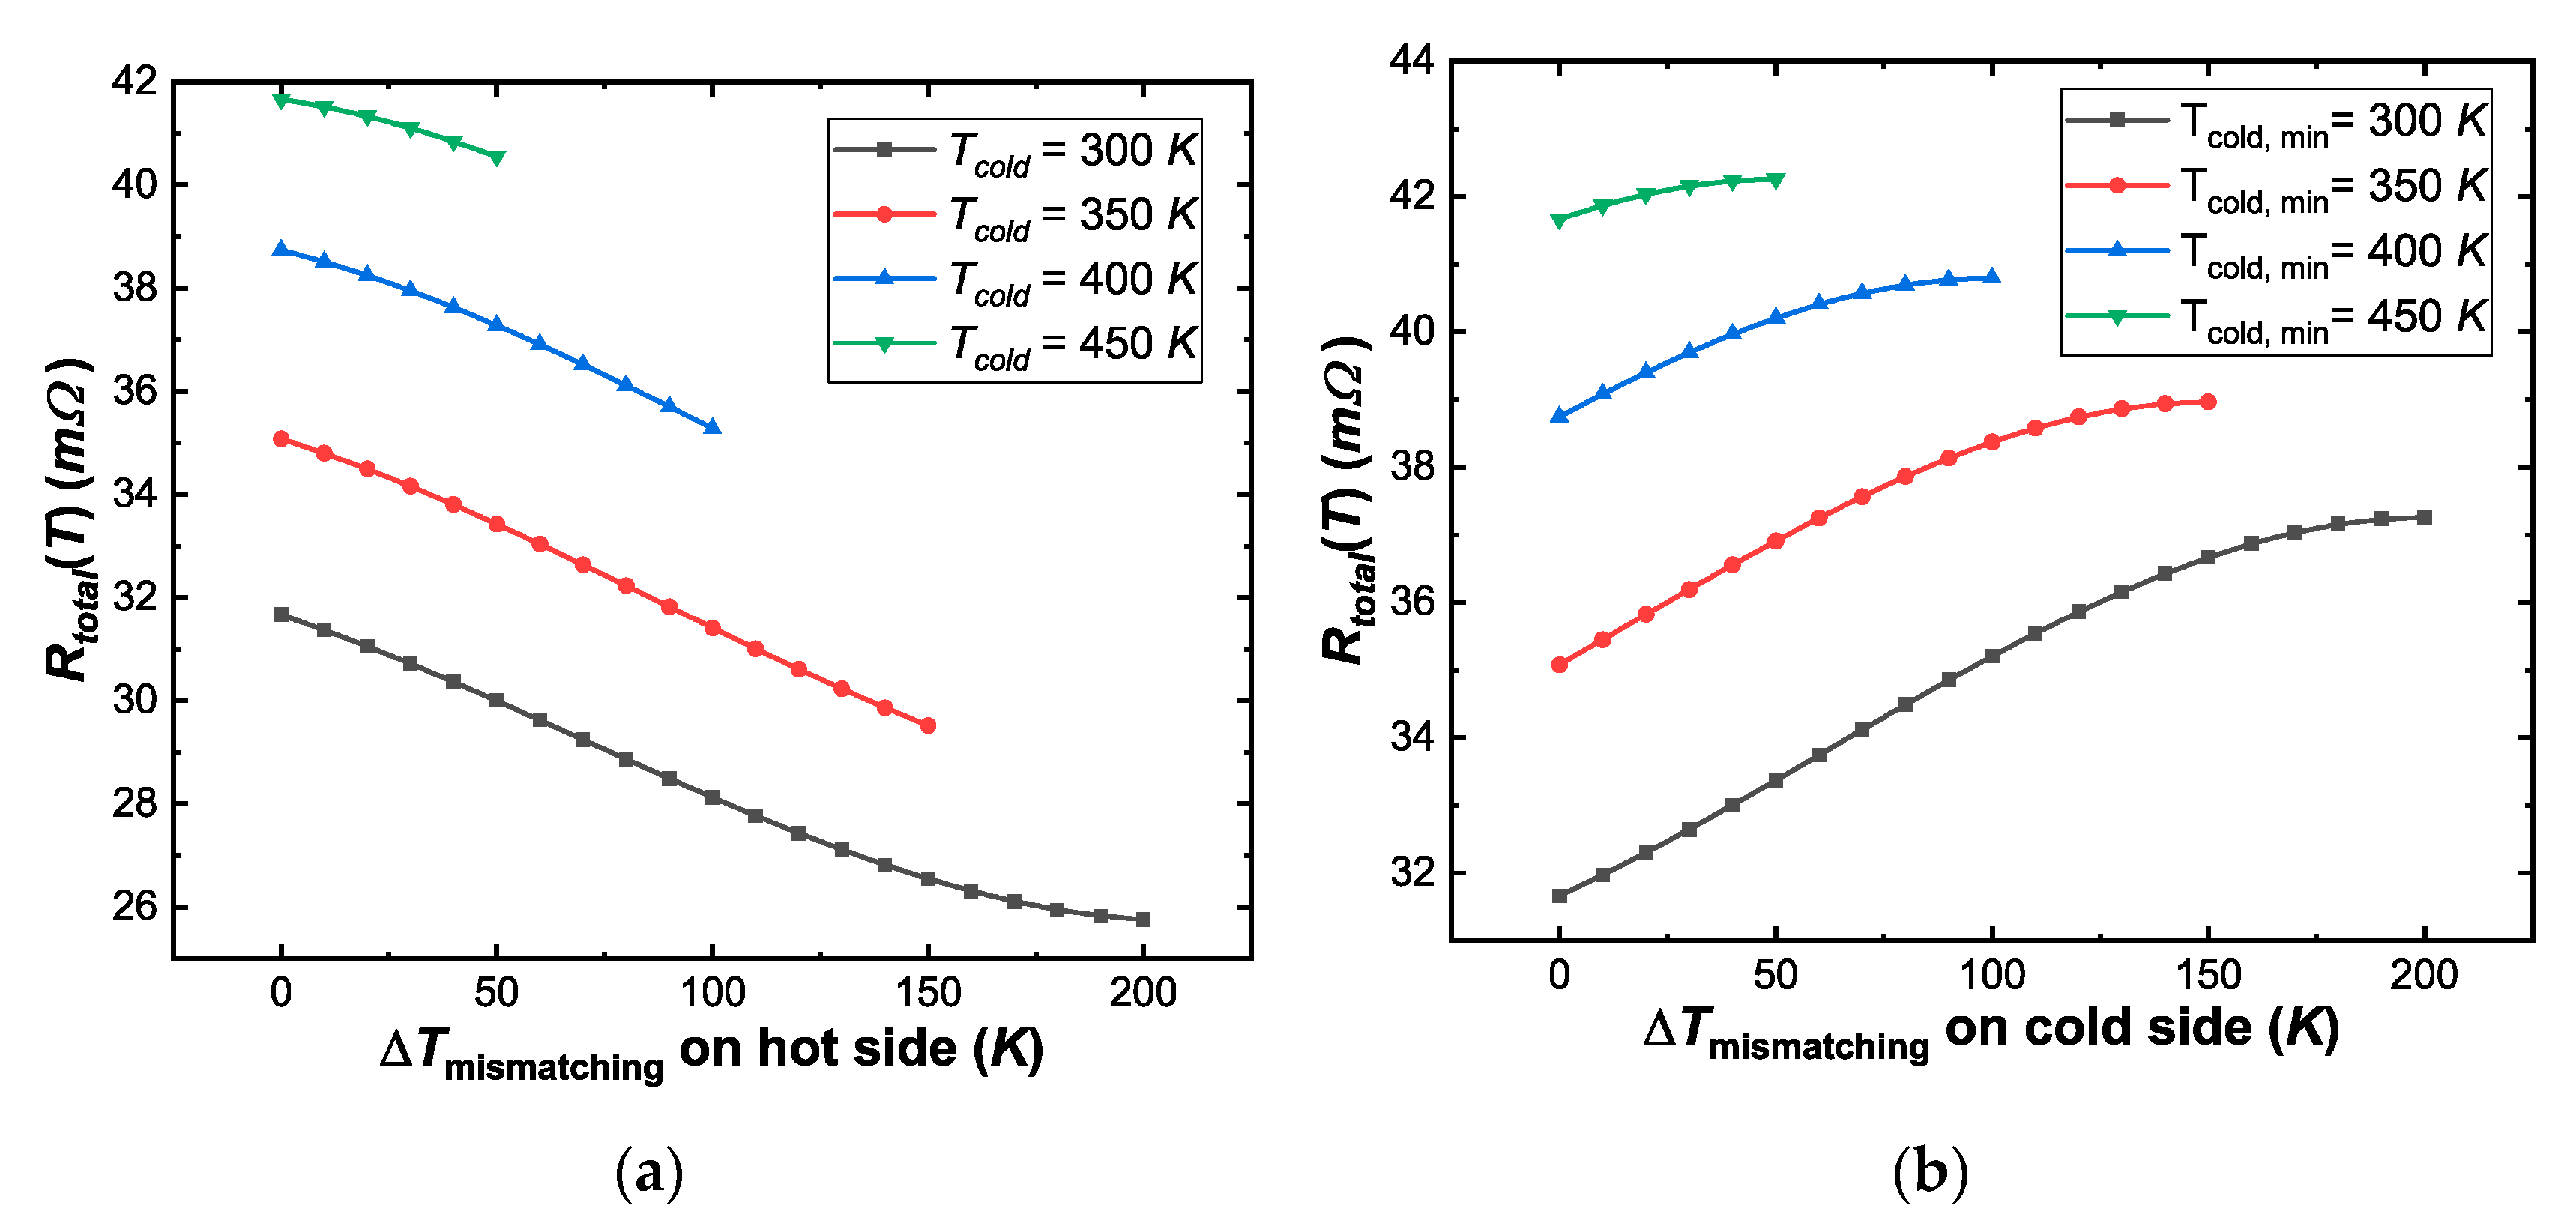
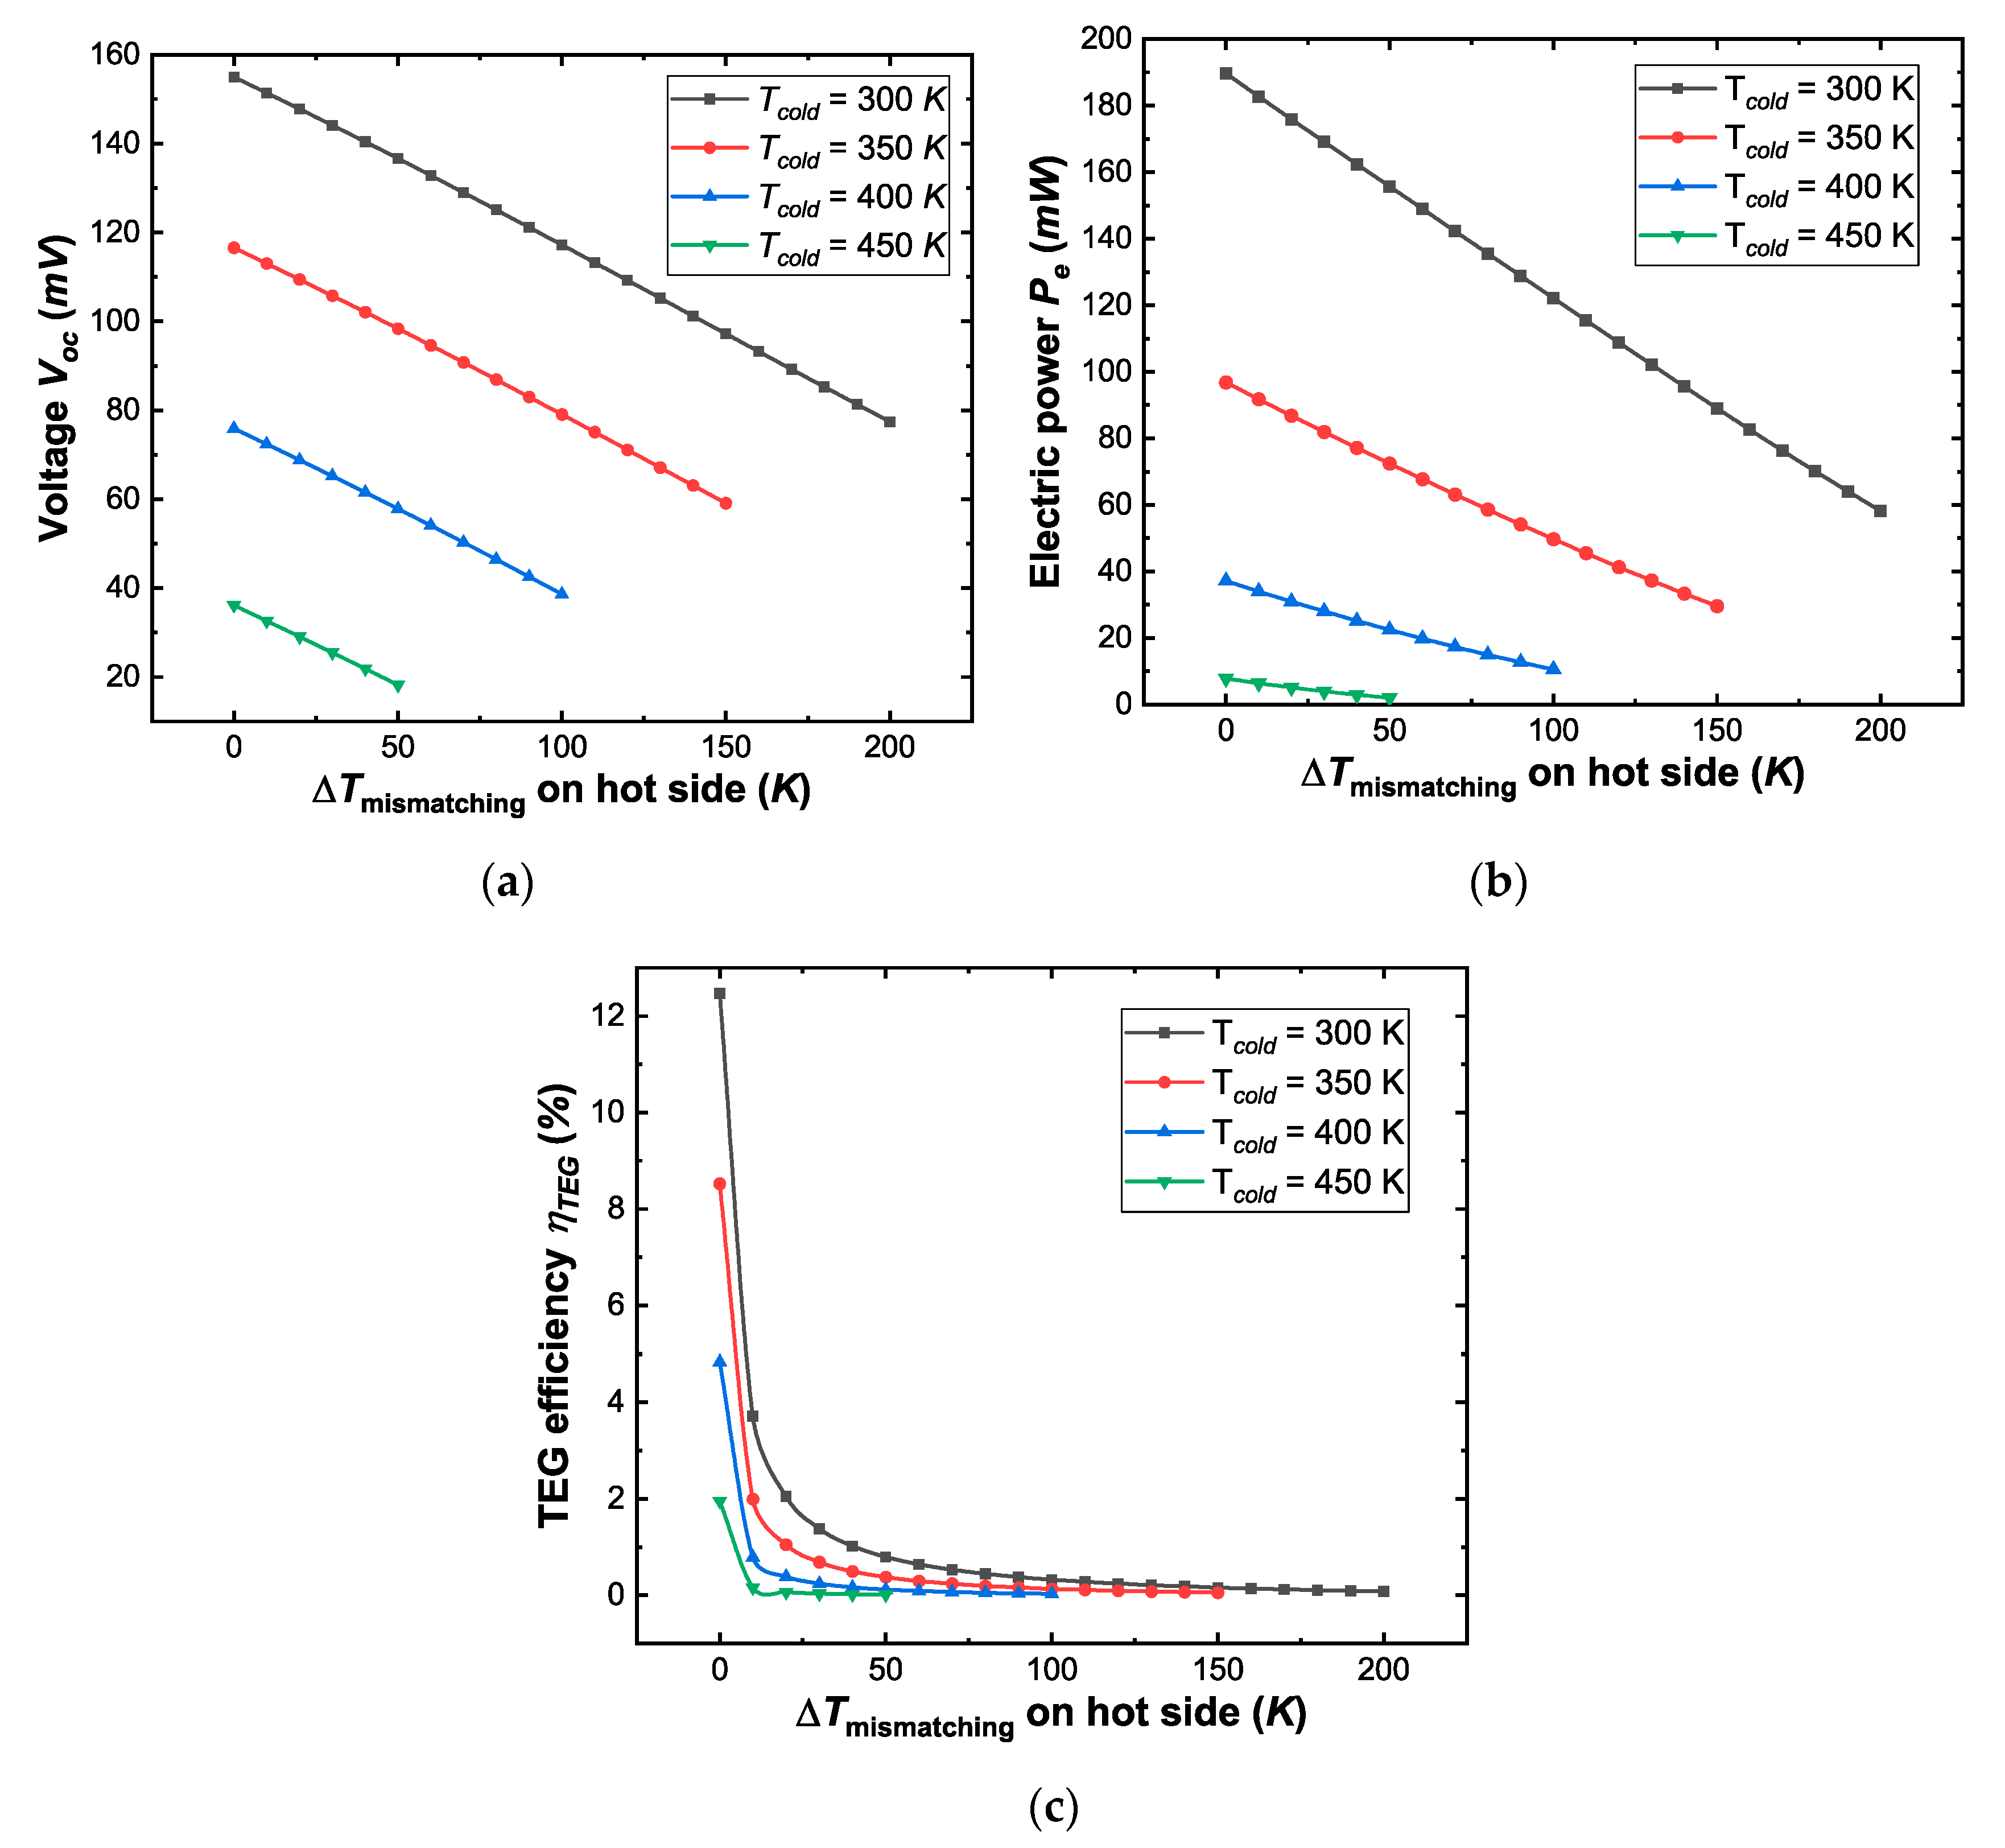
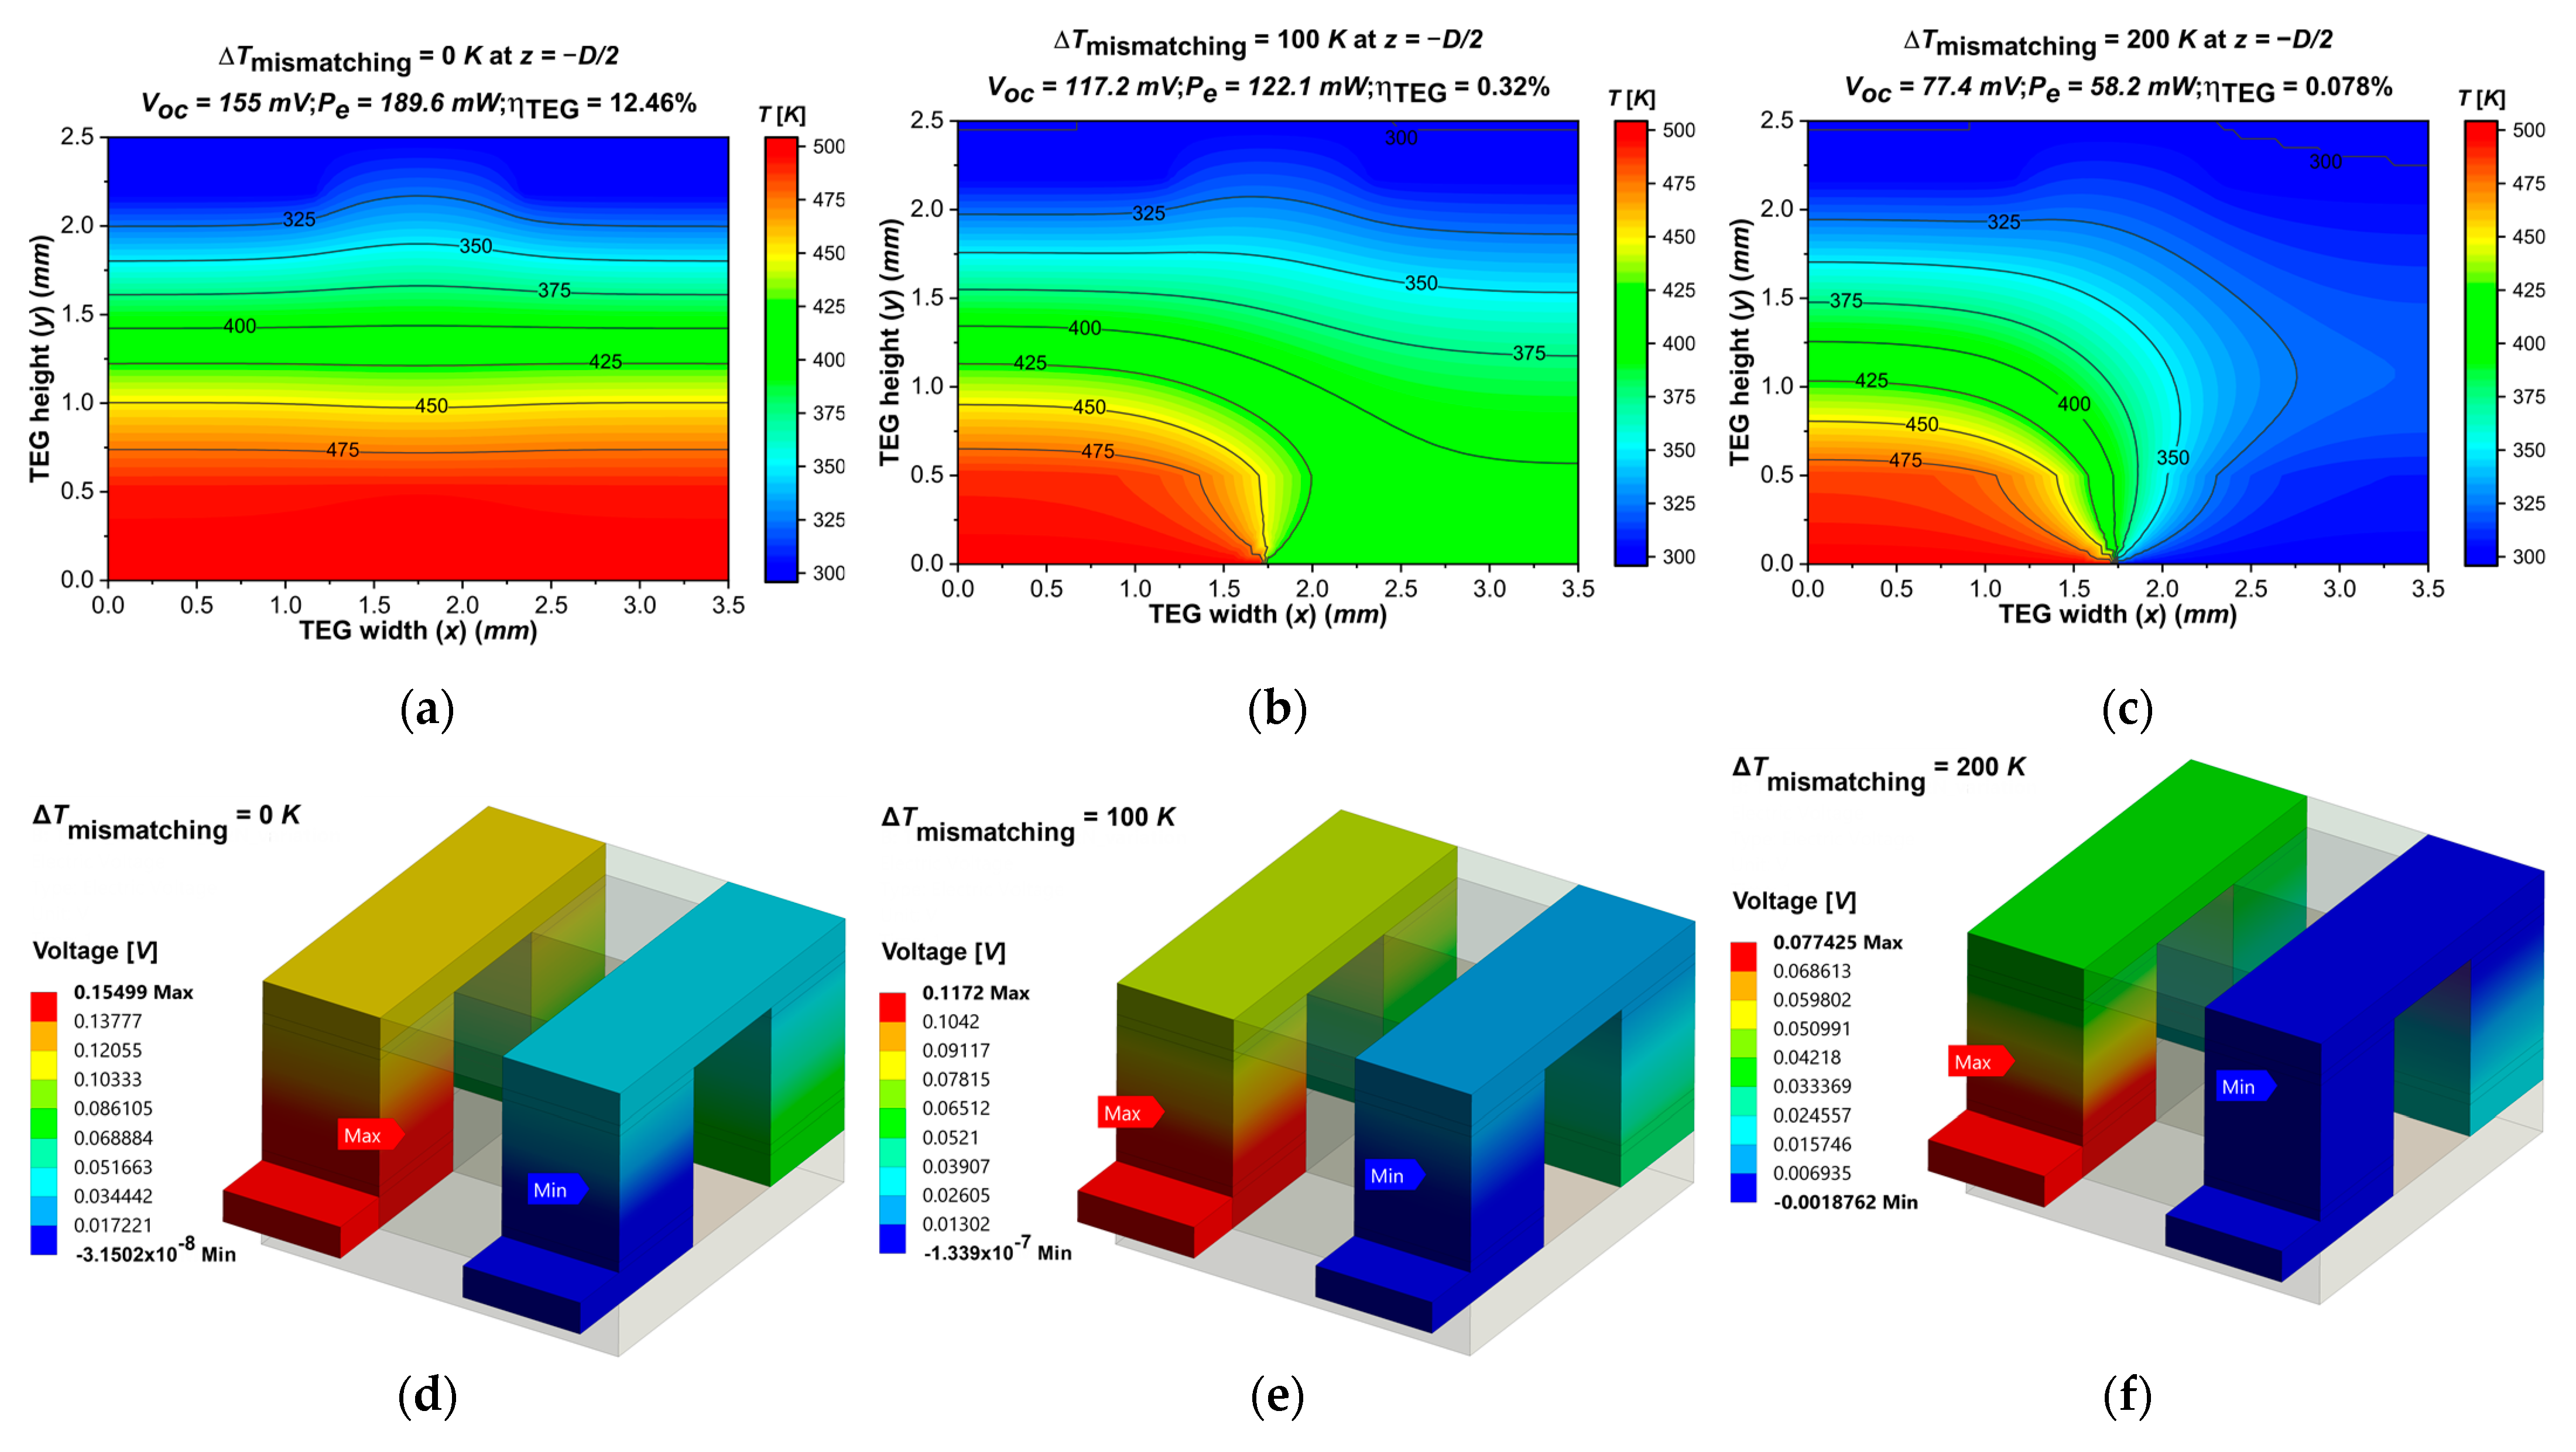
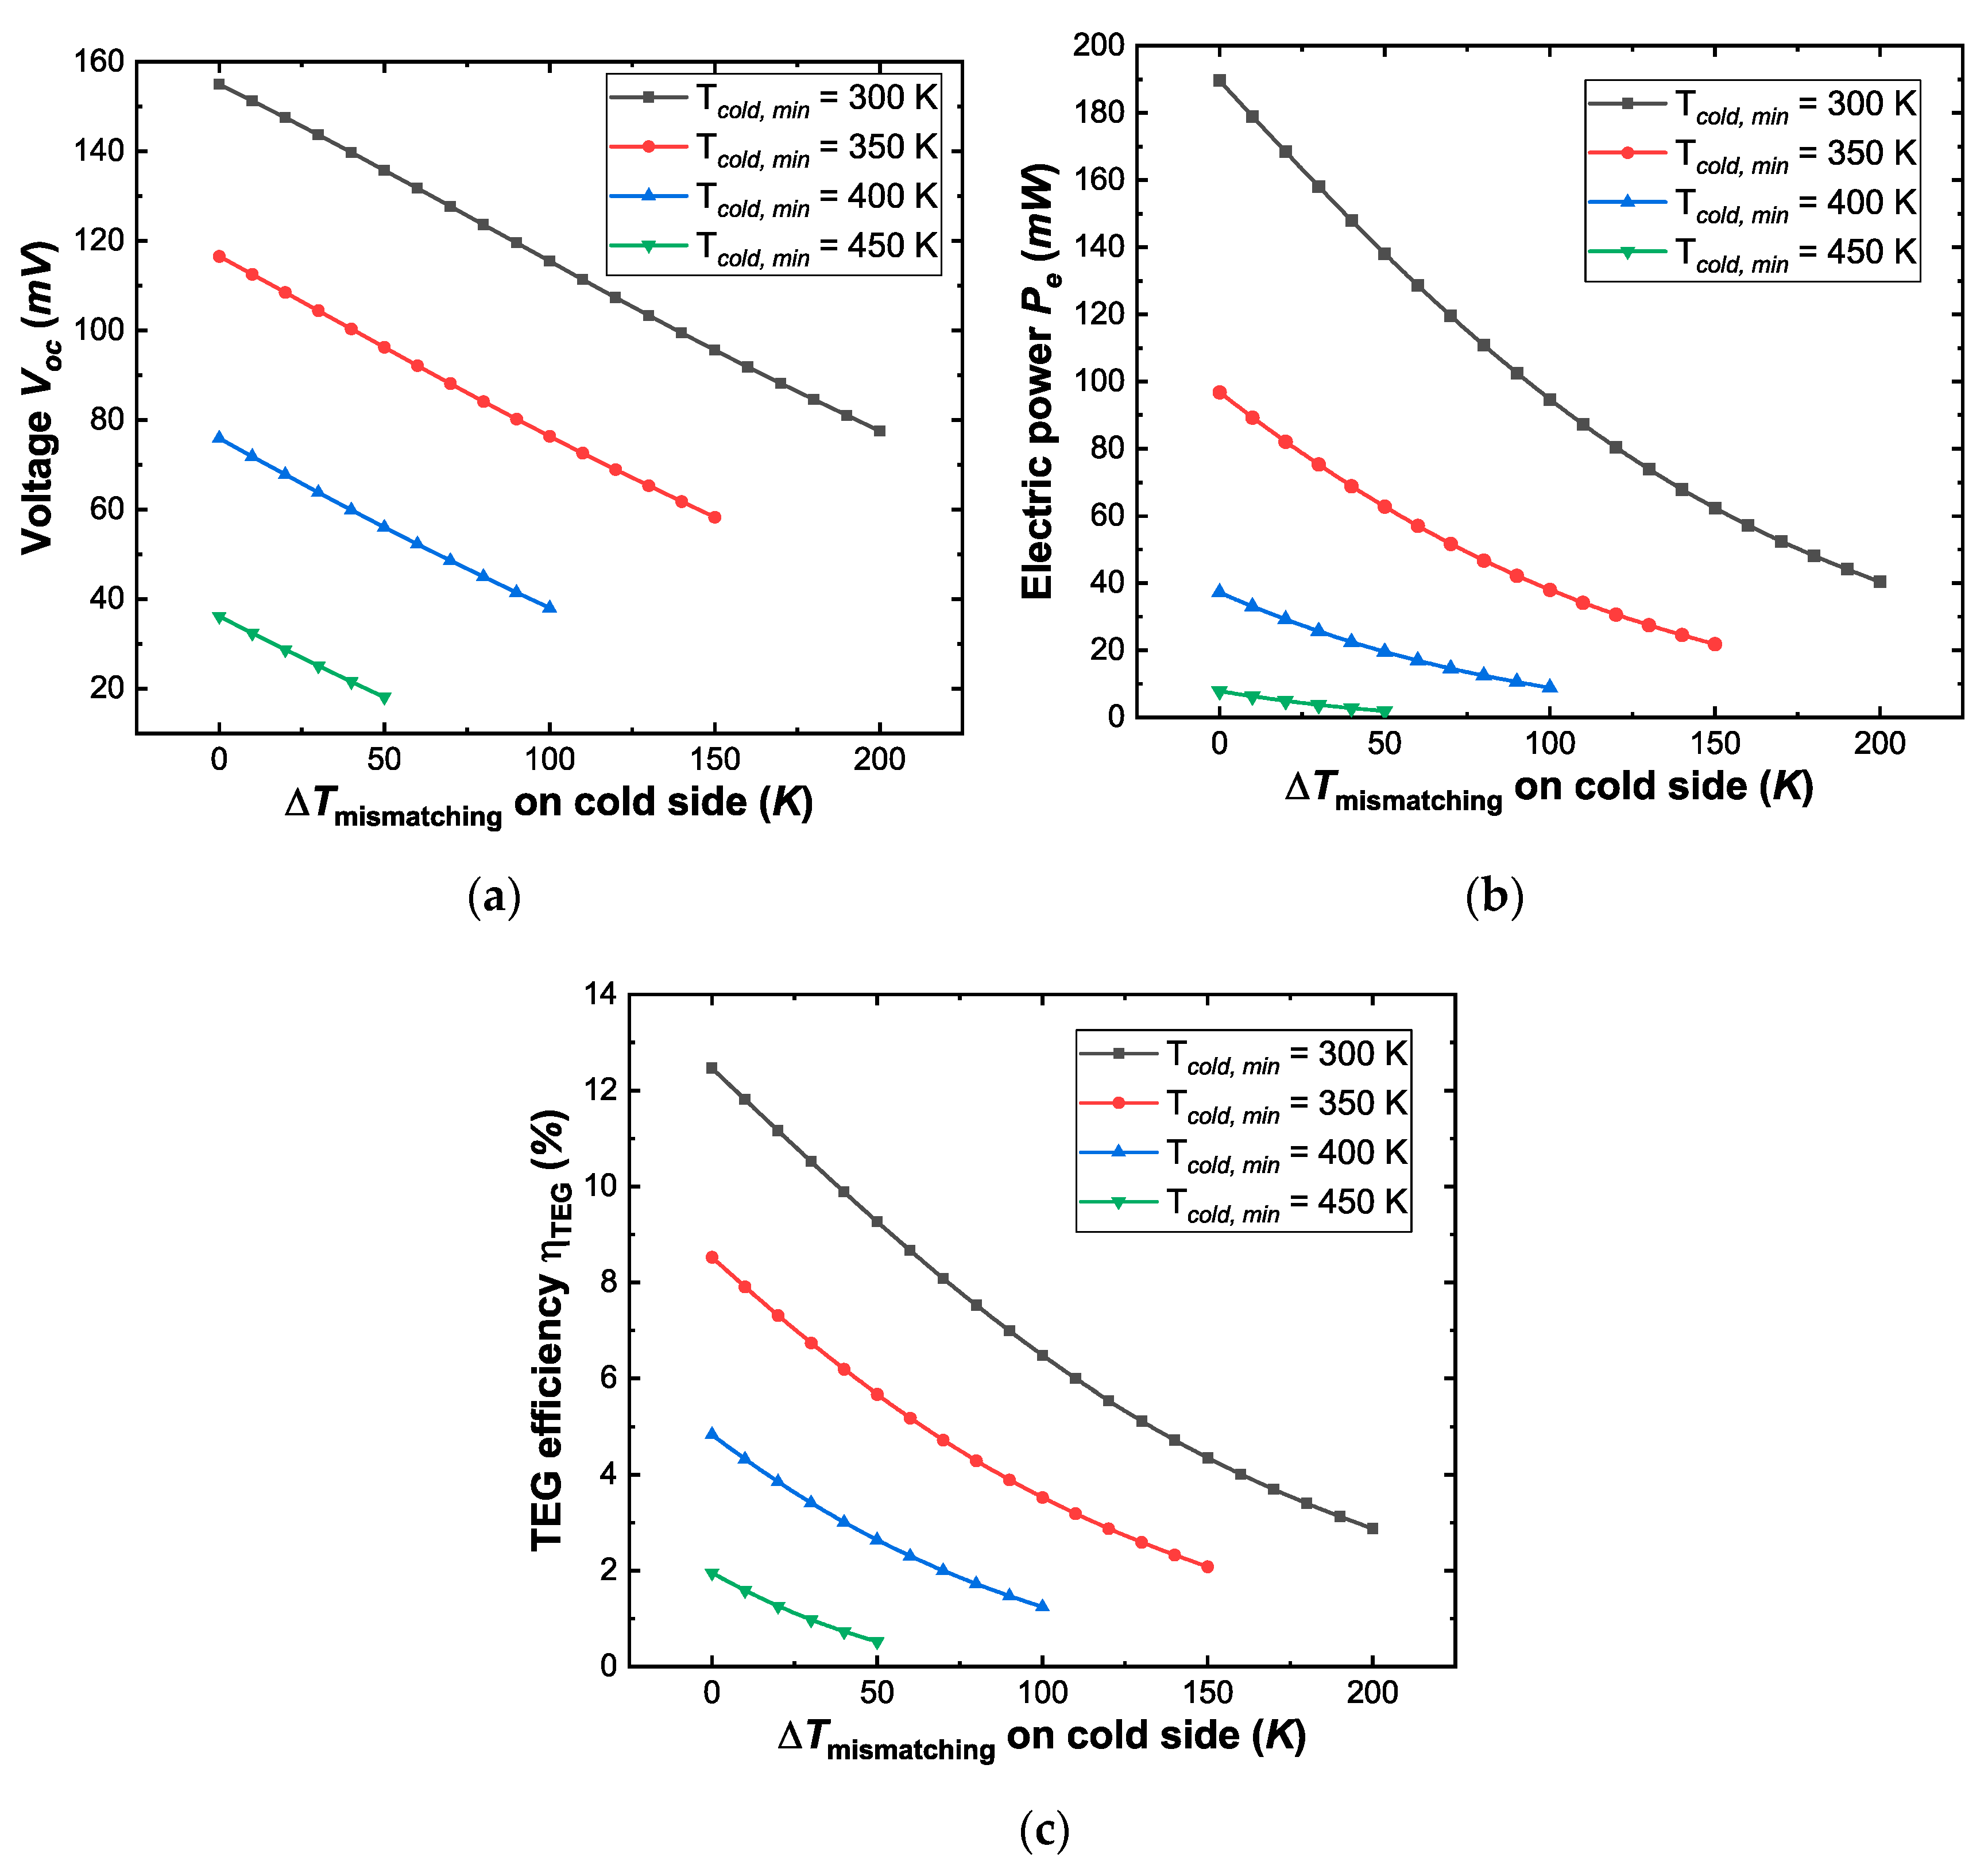
3.1. Numerical Results and Contours of the Mismatching Condition Simulation on the Heat Side (Bottom Surface) of the TEG Device
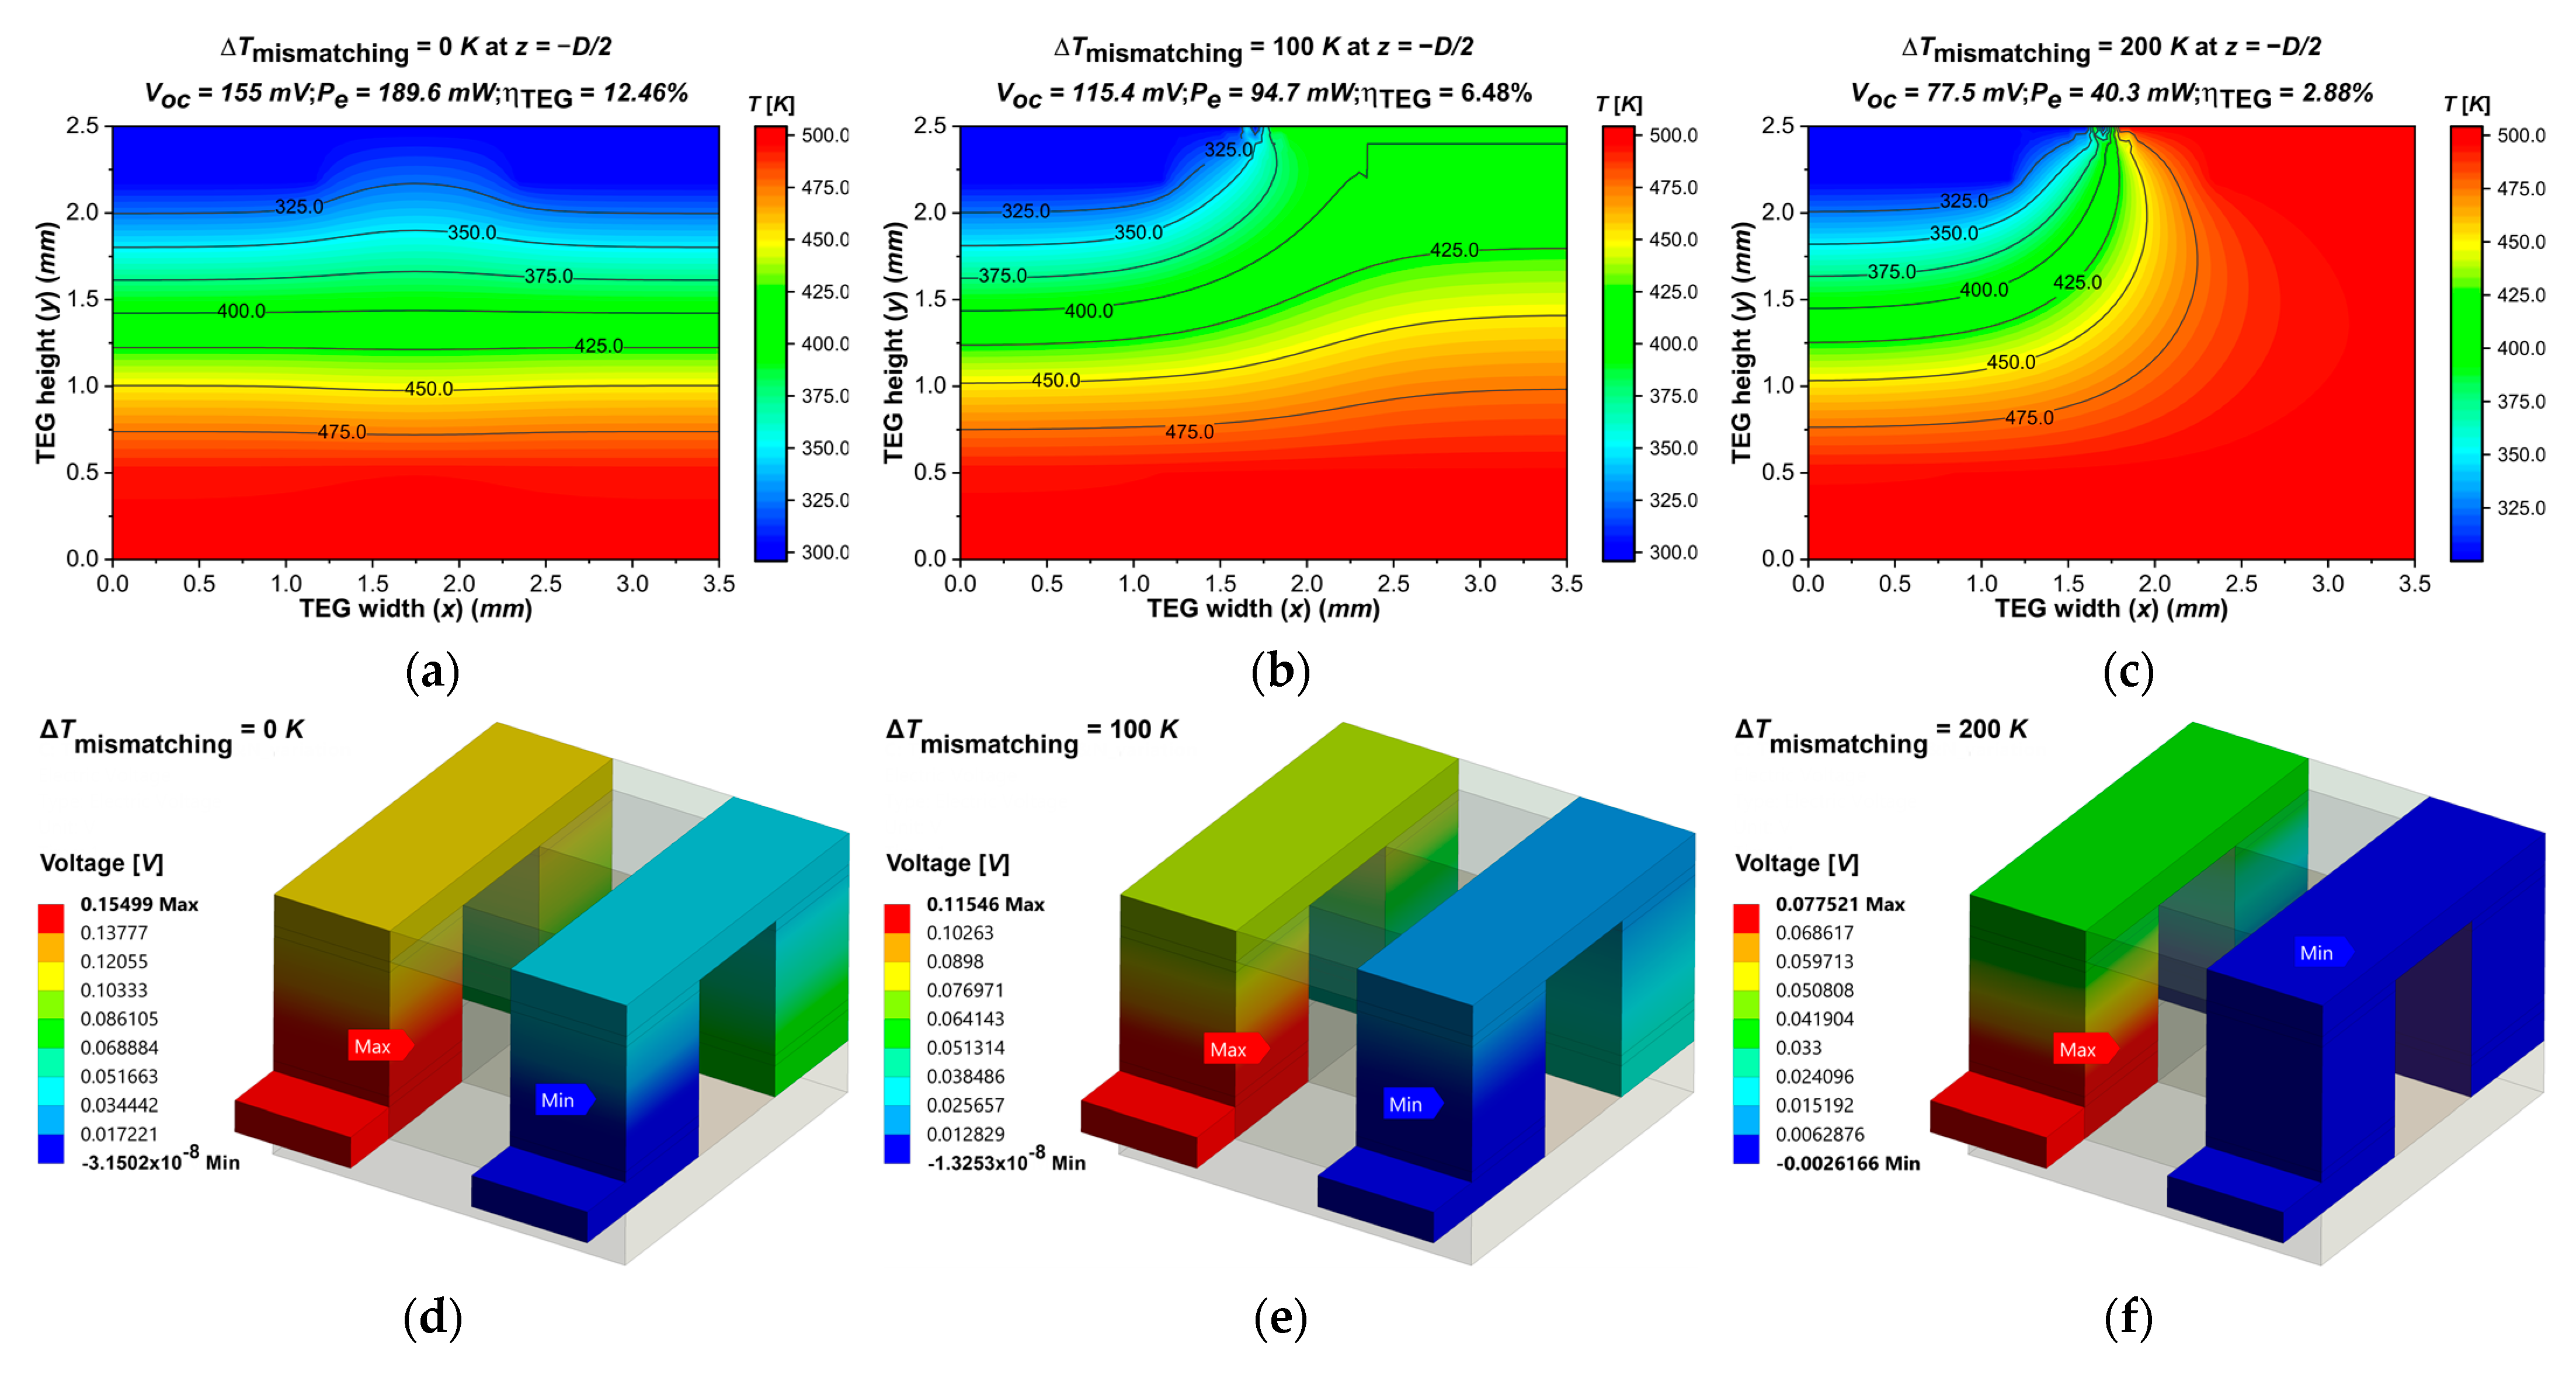
3.2. Numerical Results and Contours of the Mismatching Condition Simulation on the Heatsink (Upper Surface) of the TEG Device
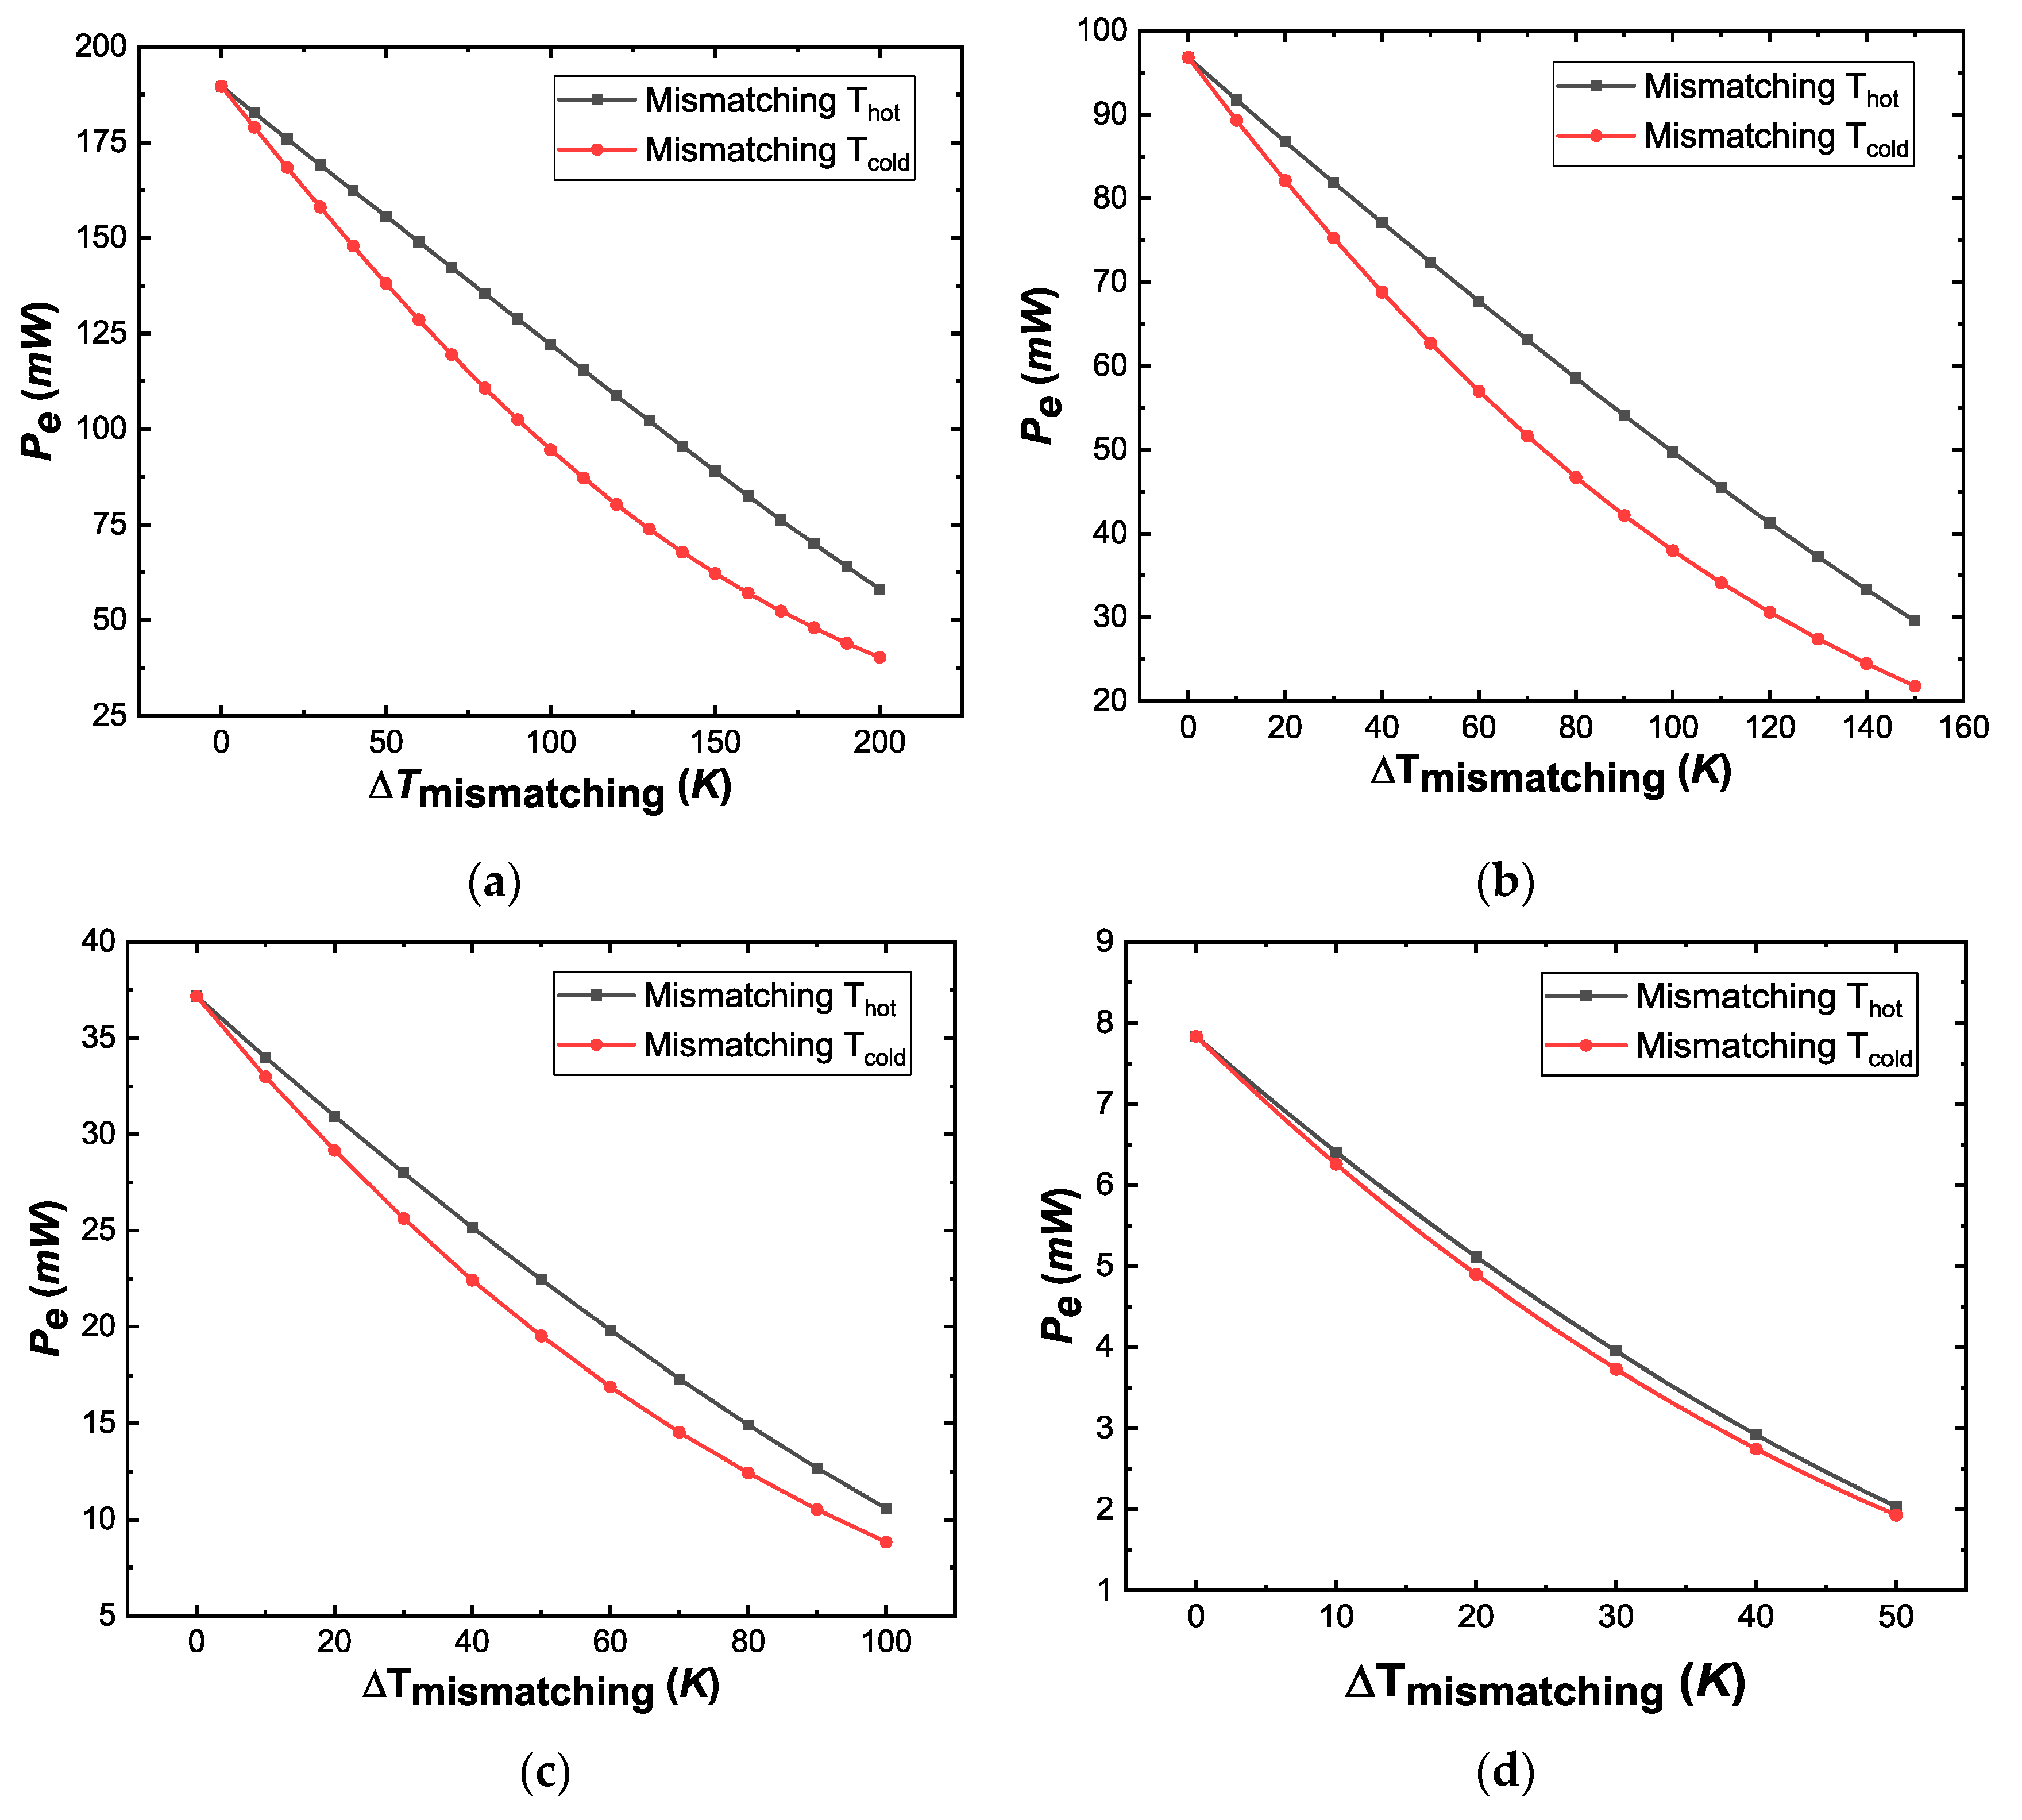
3.3. Comparison of the Numerical and Contour Results between the Mismatching Conditions on the Heat and Cold Sides of the TEG Device Simulations
4. Conclusions
Author Contributions
Funding
Institutional Review Board Statement
Informed Consent Statement
Data Availability Statement
Acknowledgments
Conflicts of Interest
Nomenclature
| Roman letters | Hot temperature | ||
| Area | Cold temperature | ||
| Thermoelectric device depth | Mismatching temperature | ||
| Electric field intensity vector | TEG | Thermoelectric generator | |
| Thermoelectric device height | Open-circuit voltage | ||
| Heat transfer coefficient | Thermoelectric device width | ||
| Electrical current | Dimensionless figure of merit | ||
| Electric current density vector | |||
| Thermal conductivity | Greek letters | ||
| Perimeter | Combined Seebeck coefficient | ||
| Electrical output power | P-type material Seebeck coefficient | ||
| Heat energy input | N-type material Seebeck coefficient | ||
| Heat to electrical energy conversion | Thomson coefficient | ||
| Heat loss due to convection | Mathematical difference | ||
| Heatsink energy | Efficiency of the thermoelectric device | ||
| Heat flux vector | Electrical resistivity | ||
| Heat generation rate per unit volume | Mean value of the N and P resistivities | ||
| Load electrical resistance | Electrical conductivity | ||
| TEG’s total electrical resistance | Electric scalar potential |
References
- Twaha, S.; Zhu, J.; Yan, Y.; Li, B. A Comprehensive Review of Thermoelectric Technology: Materials, Applications, Modelling and Performance Improvement. Renew. Sustain. Energy Rev. 2016, 65, 698–726. [Google Scholar] [CrossRef]
- Ray, T.R.; Choi, J.; Bandodkar, A.J.; Krishnan, S.; Gutruf, P.; Tian, L.; Ghaffari, R.; Rogers, J.A. Bio-Integrated Wearable Systems: A Comprehensive Review. Chem. Rev. 2019, 119, 5461–5533. [Google Scholar] [CrossRef]
- Machacek, Z.; Walendziuk, W.; Sotola, V.; Slanina, Z.; Petras, R.; Schneider, M.; Masny, Z.; Idzkowski, A.; Koziorek, J. An Investigation of Thermoelectric Generators Used as Energy Harvesters in a Water Consumption Meter Application. Energies 2021, 14, 3768. [Google Scholar] [CrossRef]
- Cózar, I.R.; Pujol, T.; Massaguer, E.; Massaguer, A.; Montoro, L.; González, J.R.; Comamala, M.; Ezzitouni, S. Effects of Module Spatial Distribution on the Energy Efficiency and Electrical Output of Automotive Thermoelectric Generators. Energies 2021, 14, 2232. [Google Scholar] [CrossRef]
- Albatati, F.; Attar, A. Analytical and Experimental Study of Thermoelectric Generator (Teg) System for Automotive Exhaust Waste Heat Recovery. Energies 2021, 14, 204. [Google Scholar] [CrossRef]
- Ismail, B.I.; Ahmed, W.H. Thermoelectric Power Generation Using Waste-Heat Energy as an Alternative Green Technology. Recent Patents Electr. Eng. 2009, 2, 27–39. [Google Scholar] [CrossRef]
- Kim, T.Y. Prediction of System-Level Energy Harvesting Characteristics of a Thermoelectric Generator Operating in a Diesel Engine Using Artificial Neural Networks. Energies 2021, 14, 2426. [Google Scholar] [CrossRef]
- Dzulkfli, M.S.b.; Pesyridis, A.; Gohil, D. Thermoelectric Generation in Hybrid Electric Vehicles. Energies 2020, 13, 3742. [Google Scholar] [CrossRef]
- Nagayoshi, H.; Tokumisu, K.; Kajikawa, T. Evaluation of Multi MPPT Thermoelectric Generator System. In Proceedings of the 26th International Conference on Thermoelectrics, Jeju, Korea, 3–7 June 2007; pp. 318–321. [Google Scholar] [CrossRef]
- Cotfas, P.A.; Cotfas, D.T. Comprehensive Review of Methods and Instruments for Photovoltaic-Thermoelectric Generator Hybrid System Characterization. Energies 2020, 13, 6045. [Google Scholar] [CrossRef]
- Lashin, A.; Al Turkestani, M.; Sabry, M. Performance of a Thermoelectric Generator Partially Illuminated with Highly Concentrated Light. Energies 2020, 13, 3627. [Google Scholar] [CrossRef]
- Shure, L.I.; Harvey, J.S. Survey of Electric Power Plants for Space Applications; NASA: Philadelphia, PA, USA, 1965. [Google Scholar]
- Radioisotope Power Systems. Available online: https://rps.nasa.gov/ (accessed on 31 July 2021).
- Voyager, the Interstellar Mission. Available online: https://voyager.jpl.nasa.gov/mission/spacecraft/ (accessed on 31 July 2021).
- Montecucco, A.; Siviter, J.; Knox, A.R. The Effect of Temperature Mismatch on Thermoelectric Generators Electrically Connected in Series and Parallel. Appl. Energy 2014, 123, 47–54. [Google Scholar] [CrossRef] [Green Version]
- Tang, Z.B.; Deng, Y.D.; Su, C.Q.; Shuai, W.W.; Xie, C.J. A Research on Thermoelectric Generator’s Electrical Performance under Temperature Mismatch Conditions for Automotive Waste Heat Recovery System. Case Stud. Therm. Eng. 2015, 5, 143–150. [Google Scholar] [CrossRef] [Green Version]
- Hakim, A.; Lim, J.H. The Effect of Temperature Mismatch on Interconnected Thermoelectric Module for Power Generation. AIP Conf. Proc. 2020, 2233, 02009. [Google Scholar] [CrossRef]
- Kidegho, G.; Njoka, F.; Muriithi, C.; Kinyua, R. Evaluation of Thermal Interface Materials in Mediating PV Cell Temperature Mismatch in PV–TEG Power Generation. Energy Rep. 2021, 7, 1636–1650. [Google Scholar] [CrossRef]
- Ruzaimi, A.S.S.; Hassan, W.Z.W.; Azis, N.; Ya’acob, M.E.; Elianddy, E.; Aimrun, W. Performance Analysis of Thermoelectric Generator Implemented on Non-Uniform Heat Distribution of Photovoltaic Module. Energy Rep. 2021, 7, 2379–2387. [Google Scholar] [CrossRef]
- Haxel, G.B.; James, B.H.; Greta, J.O. Rare Earth Elements—Critical Resources for High Technology; United States Department of the Interior Geological Survey: Reston, VA, USA, 2002; pp. 1–11. [Google Scholar]
- Champier, D. Thermoelectric Generators: A Review of Applications. Energy Convers. Manag. 2017, 140, 167–181. [Google Scholar] [CrossRef]
- Chen, S.; Ren, Z. Recent Progress of Half-Heusler for Moderate Temperature Thermoelectric Applications. Mater. Today 2013, 16, 387–395. [Google Scholar] [CrossRef]
- Leblanc, S.; Yee, S.K.; Scullin, M.L.; Dames, C.; Goodson, K.E. Material and Manufacturing Cost Considerations for Thermoelectrics. Renew. Sustain. Energy Rev. 2014, 32, 313–327. [Google Scholar] [CrossRef]
- Lin, C.X.; Kiflemariam, R. Numerical Simulation and Validation of Thermoeletric Generator Based Self-Cooling System with Airflow. Energies 2019, 12, 4052. [Google Scholar] [CrossRef] [Green Version]
- Sanin-Villa, D.; Monsalve-Cifuentes, O.D.; Del Rio, J.S. Early Fever Detection on COVID-19 Infection Using Thermoelectric Module Generators. Int. J. Electr. Comput. Eng. 2021, 11, 3828–3837. [Google Scholar] [CrossRef]
- Ramos-Paja, C.A.; Bastidas, J.D.; Saavedra-Montes, A.J.; Guinjoan-Gispert, F.; Goez, M. Mathematical Model of Total Cross-Tied Photovoltaic Arrays in Mismatching Conditions. In Proceedings of the IEEE 4th Colombian Workshop on Circuits and Systems (CWCAS), Barranquilla, Colombia, 1–2 November 2012. [Google Scholar] [CrossRef]
- Choi, T.; Kim, T.Y. Three-Zone Numerical Modeling Method for Predicting System-Level Waste Heat Recovery Performance of Thermoelectric Generator with Various Electrical Array Configurations. Energy Convers. Manag. 2021, 240, 114270. [Google Scholar] [CrossRef]
- Wang, P.; Wang, K.F.; Wang, B.L.; Cui, Y.J. Modeling of Thermoelectric Generators with Effects of Side Surface Heat Convection and Temperature Dependence of Material Properties. Int. J. Heat Mass Transf. 2019, 133, 1145–1153. [Google Scholar] [CrossRef]
- Wee, D. Analysis of Thermoelectric Energy Conversion Efficiency with Linear and Nonlinear Temperature Dependence in Material Properties. Energy Convers. Manag. 2011, 52, 3383–3390. [Google Scholar] [CrossRef]
- Ju, C.; Dui, G.; Zheng, H.H.; Xin, L. Revisiting the Temperature Dependence in Material Properties and Performance of Thermoelectric Materials. Energy 2017, 124, 249–257. [Google Scholar] [CrossRef]
- Thielen, M.; Sigrist, L.; Magno, M.; Hierold, C.; Benini, L. Human Body Heat for Powering Wearable Devices: From Thermal Energy to Application. Energy Convers. Manag. 2017, 131, 44–54. [Google Scholar] [CrossRef] [Green Version]
- Antonova, E.E.; Looman, D.C. Finite Elements for Thermoelectric Device Analysis in ANSYS. In Proceedings of the ICT 2005 24th International Conference on Thermoelectrics, Clemson, SC, USA, 19–23 June 2005; pp. 200–203. [Google Scholar] [CrossRef]
- Chen, W.H.; Liao, C.Y.; Hung, C.I. A Numerical Study on the Performance of Miniature Thermoelectric Cooler Affected by Thomson Effect. Appl. Energy 2012, 89, 464–473. [Google Scholar] [CrossRef]
- Oliveira, K.S.M.; Cardoso, R.P.; Hermes, C.J.L. Numerical Assessment of the Thermodynamic Performance of Thermoelectric Cells via Two-Dimensional Modelling. Appl. Energy 2014, 130, 280–288. [Google Scholar] [CrossRef]
- Huang, M.J.; Yen, R.H.; Wang, A.B. The Influence of the Thomson Effect on the Performance of a Thermoelectric Cooler. Int. J. Heat Mass Transf. 2005, 48, 413–418. [Google Scholar] [CrossRef]
- Strasser, M.; Aigner, R.; Franosch, M.; Wachutka, G. Miniaturized Thermoelectric Generators Based on Poly-Si and Poly-SiGe Surface Micromachining. Sens. Actuators A Phys. 2002, 97–98, 535–542. [Google Scholar] [CrossRef]
- Abdel-Motaleb, I.M.; Syed, M.Q. Thermoelectric Devices: Principles and Future Trends. arXiv 2017, arXiv:1704.07742. [Google Scholar]
- Snyder, G.J.; Snyder, A.H. Figure of Merit ZT of a Thermoelectric Device Defined from Materials Properties. Energy Environ. Sci. 2017, 10, 2280–2283. [Google Scholar] [CrossRef]
- Kasap, S. Thermoelectric Effects in Metals; The Department of Electrical and Computer Engineering: Saskatoon, SK, Canada, 2001; pp. 1–11. [Google Scholar]
- Shnawah, D.A.; Sabri, M.F.M.; Badruddin, I.A.; Said, S.B.M.; Ariga, T.; Che, F.X. Effect of Ag Content and the Minor Alloying Element Fe on the Mechanical Properties and Microstructural Stability of Sn-Ag-Cu Solder Alloy under High-Temperature Annealing. J. Electron. Mater. 2013, 42, 470–484. [Google Scholar] [CrossRef]
- Liou, B.H.; Chen, C.M.; Horng, R.H.; Chiang, Y.C.; Wuu, D.S. Improvement of Thermal Management of High-Power GaN-Based Light-Emitting Diodes. Microelectron. Reliab. 2012, 52, 861–865. [Google Scholar] [CrossRef]
- Corning, D. SYLGARDTM 184 Silicone Elastomer Kit. Available online: https://www.dow.com/en-us/pdp.sylgard-184-silicone-elastomer-kit.01064291z.html (accessed on 30 July 2021).
- Wang, Y.; Shi, Y.; Mei, D.; Chen, Z. Wearable Thermoelectric Generator for Harvesting Heat on the Curved Human Wrist. Appl. Energy 2017, 205, 710–719. [Google Scholar] [CrossRef]
- ANSYS Inc. ANSYS Workbench Product Release Notes 10.0; ANSYS Inc.: Canonsburg, PA, USA, 2005. [Google Scholar]
- Chen, Z.; Lin, M.Y.; Xu, G.D.; Chen, S.; Zhang, J.H.; Wang, M.M. Hydrothermal Synthesized Nanostructure Bi-Sb-Te Thermoelectric Materials. J. Alloys Compd. 2014, 588, 384–387. [Google Scholar] [CrossRef]
- Mackey, J.; Dynys, F.; Sehirlioglu, A. Uncertainty Analysis for Common Seebeck and Electrical Resistivity Measurement Systems. Rev. Sci. Instrum. 2014, 85, 6. [Google Scholar] [CrossRef] [PubMed]
- Mackey, J.; Dynys, F.; Sehirlioglu, A. Uncertainty Analysis of Seebeck Coefficient and Electrical Resistivity Characterization; NASA: Akron, OH, USA, 2013; Volume 24. [Google Scholar]
- Mechanical APDL Modeling and Meshing Guide; ANSYS Inc.: Canonsburg, PA, USA, 2010; Volume 3304, pp. 724–746.
- ANSYS Mechanical APDL Modeling and Meshing Guide; ANSYS 2020 R1 Release; ANSYS Inc.: Canonsburg, PA, USA, 2020.
- European Thermodynamics Limited. Thermoelectric Generator Module GM250-449-10-12. Available online: https://media.digikey.com/pdf/DataSheets/EuropeanThermodynamicsPDFs/GM250-449-10-12.pdf (accessed on 3 October 2021).
- Xiao, H.; Gou, X.; Yang, S. Detailed Modeling and Irreversible Transfer Process Analysis of a Multi-Element Thermoelectric Generator System. J. Electron. Mater. 2011, 40, 1195–1201. [Google Scholar] [CrossRef]


| Material | |||
|---|---|---|---|
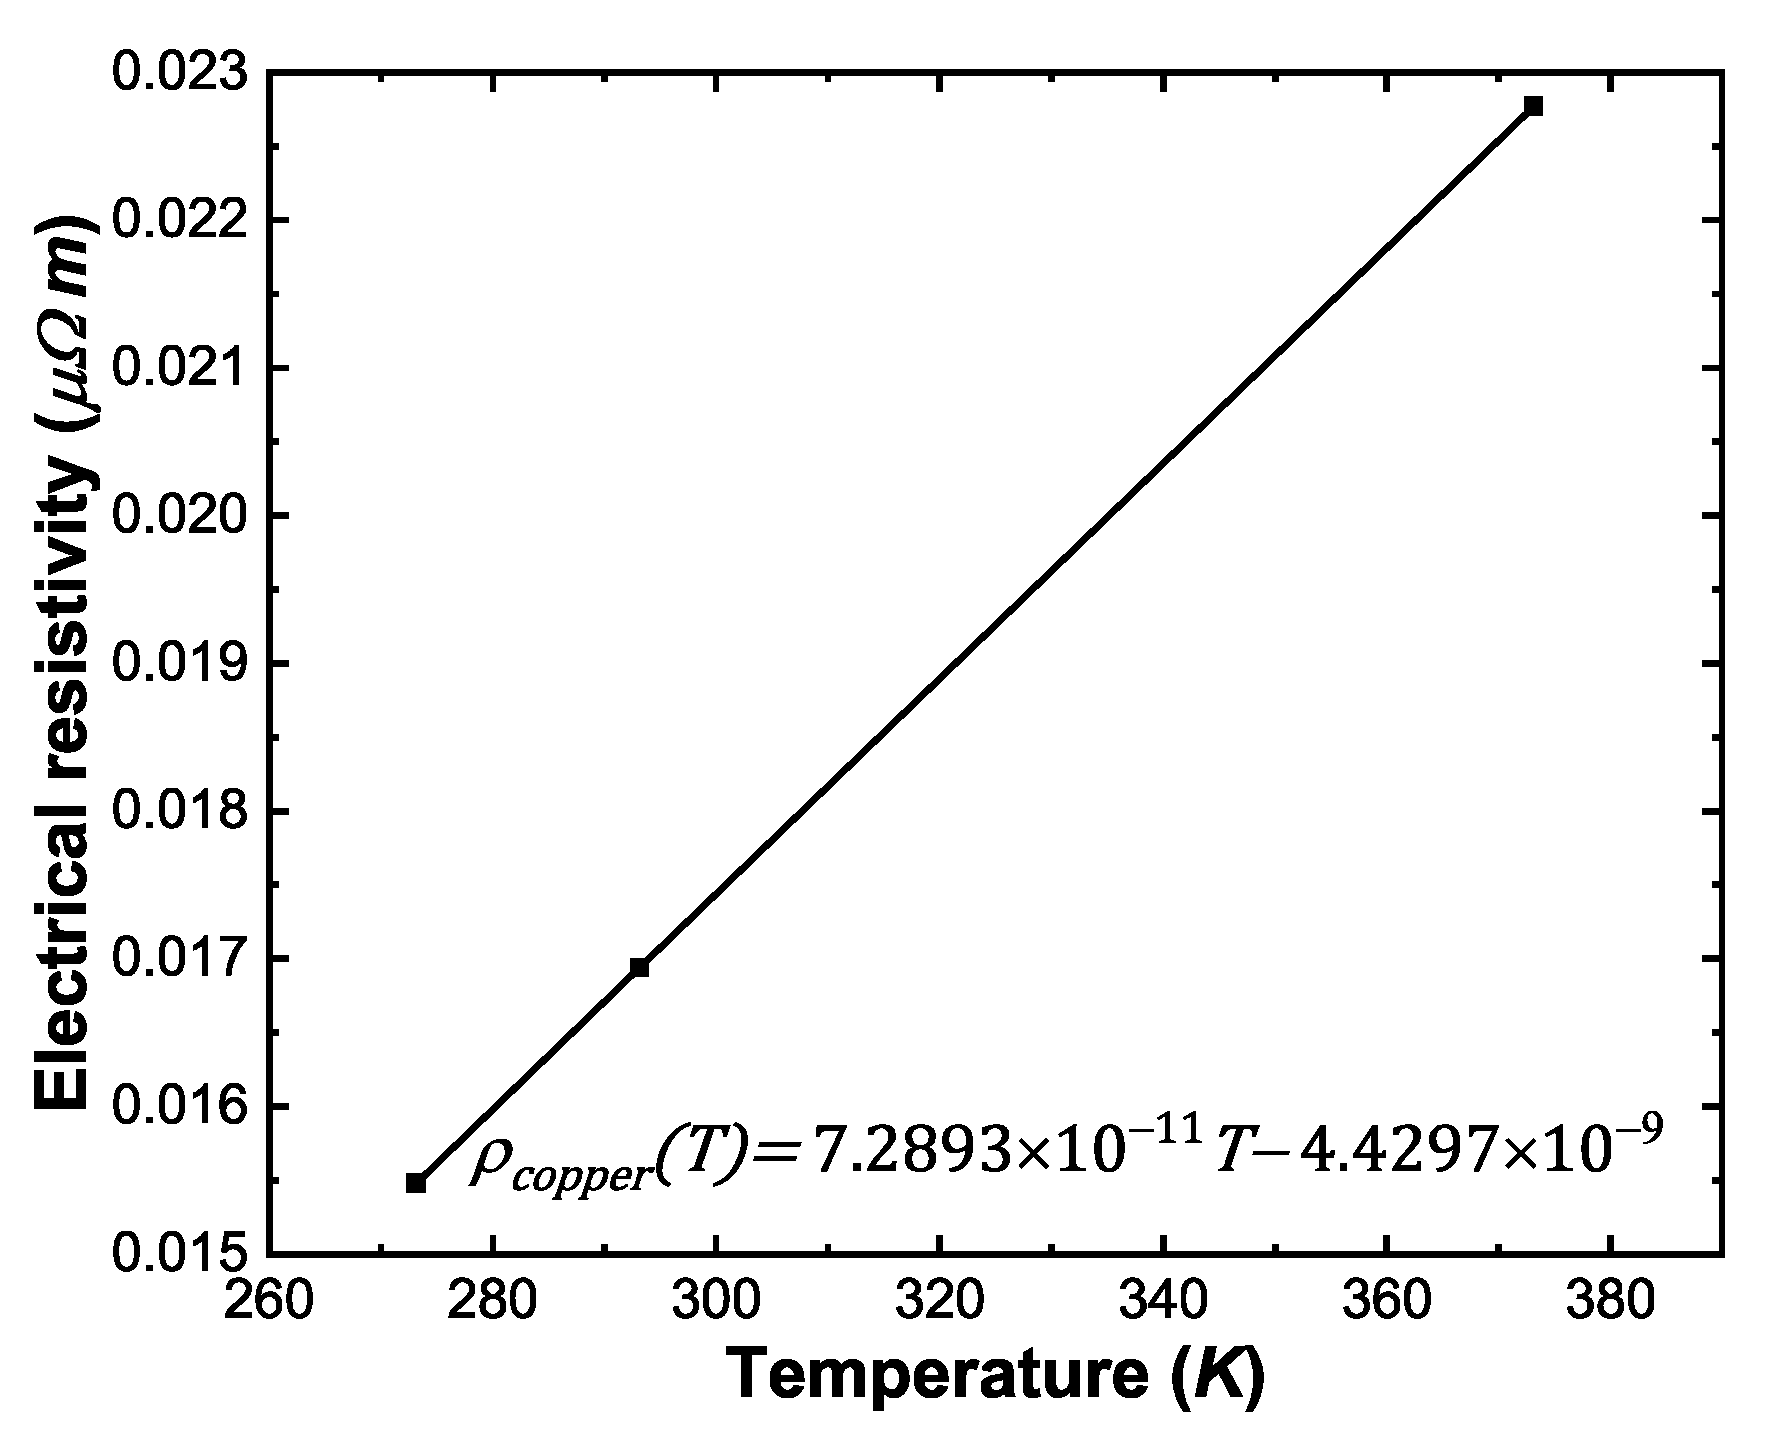
| Copper | 400 [34] | 1.80 [39] | Variable, see Figure 2 |
| Solder | 64 [40] | 1.25 10−7 [41] | |
| Filler (silicone elastomer) | 0.27 [42] | ||
| Thermal interface layer (TIL) | 4 [43] |
| Polynomial Regressions | |
|---|---|
| Thermal conductivity | , |
| Seebeck coefficient | , |
| Electrical resistivity | , |
| Dimensionless figure of merit | , |
| Mesh Quality Parameters | Minimum Value | Maximum Value | Average Value | Standard Deviation | Error Limit Threshold |
|---|---|---|---|---|---|
| Element quality | 0.9512 | 1 | 0.9981 | 3.982910−3 | 510−4 |
| Jacobian ratio (corner nodes) | 0.8568 | 1 | 0.9965 | 8.690310−3 | 0.025 |
| 500 | (300 500), steps of 10 K | 300 | 0 |
| (350 500), steps of 10 K | 350 | ||
| (400 500), steps of 10 K | 400 | ||
| (450 500), steps of 10 K | 450 |
| 500 | (300 500), steps of 10 K | 300 | 0 |
| (350 500), steps of 10 K | 350 | ||
| (400 500), steps of 10 K | 400 | ||
| (450 500), steps of 10 K | 450 |
| Material | Number of Components | ||||
|---|---|---|---|---|---|
| N and P-type | 4 (2 N and 2 P) | 0.00150 | 0.00120 | 0.00150 | 2.2510−6 |
| Copper (large) | 3 | 0.00150 | 0.00030 | 0.00350 | 5.2510−6 |
| Copper (small) | 2 | 0.00150 | 0.00030 | 0.00175 | 2.63 10−6 |
| Solder | 8 | 0.00150 | 0.0001 | 0.00150 | 2.2510−6 |
Publisher’s Note: MDPI stays neutral with regard to jurisdictional claims in published maps and institutional affiliations. |
© 2021 by the authors. Licensee MDPI, Basel, Switzerland. This article is an open access article distributed under the terms and conditions of the Creative Commons Attribution (CC BY) license (https://creativecommons.org/licenses/by/4.0/).
Share and Cite
Sanin-Villa, D.; Monsalve-Cifuentes, O.D.; Henao-Bravo, E.E. Evaluation of Thermoelectric Generators under Mismatching Conditions. Energies 2021, 14, 8016. https://doi.org/10.3390/en14238016
Sanin-Villa D, Monsalve-Cifuentes OD, Henao-Bravo EE. Evaluation of Thermoelectric Generators under Mismatching Conditions. Energies. 2021; 14(23):8016. https://doi.org/10.3390/en14238016
Chicago/Turabian StyleSanin-Villa, Daniel, Oscar D. Monsalve-Cifuentes, and Elkin E. Henao-Bravo. 2021. "Evaluation of Thermoelectric Generators under Mismatching Conditions" Energies 14, no. 23: 8016. https://doi.org/10.3390/en14238016
APA StyleSanin-Villa, D., Monsalve-Cifuentes, O. D., & Henao-Bravo, E. E. (2021). Evaluation of Thermoelectric Generators under Mismatching Conditions. Energies, 14(23), 8016. https://doi.org/10.3390/en14238016