
Computational Studies of Air-Mist Spray Cooling in Continuous Casting


Abstract
1. Introduction
2. Methodology
2.1. Continuous Phase (Air)
2.2. Multiphase Flows
2.3. Atomization
2.4. Droplet Coalescence and Breakup
2.5. Droplet Motion and Convective Heat Transfer
2.6. Droplet-Wall Impingement Model
2.7. Impingement Heat Transfer Model
2.8. Slab Movement
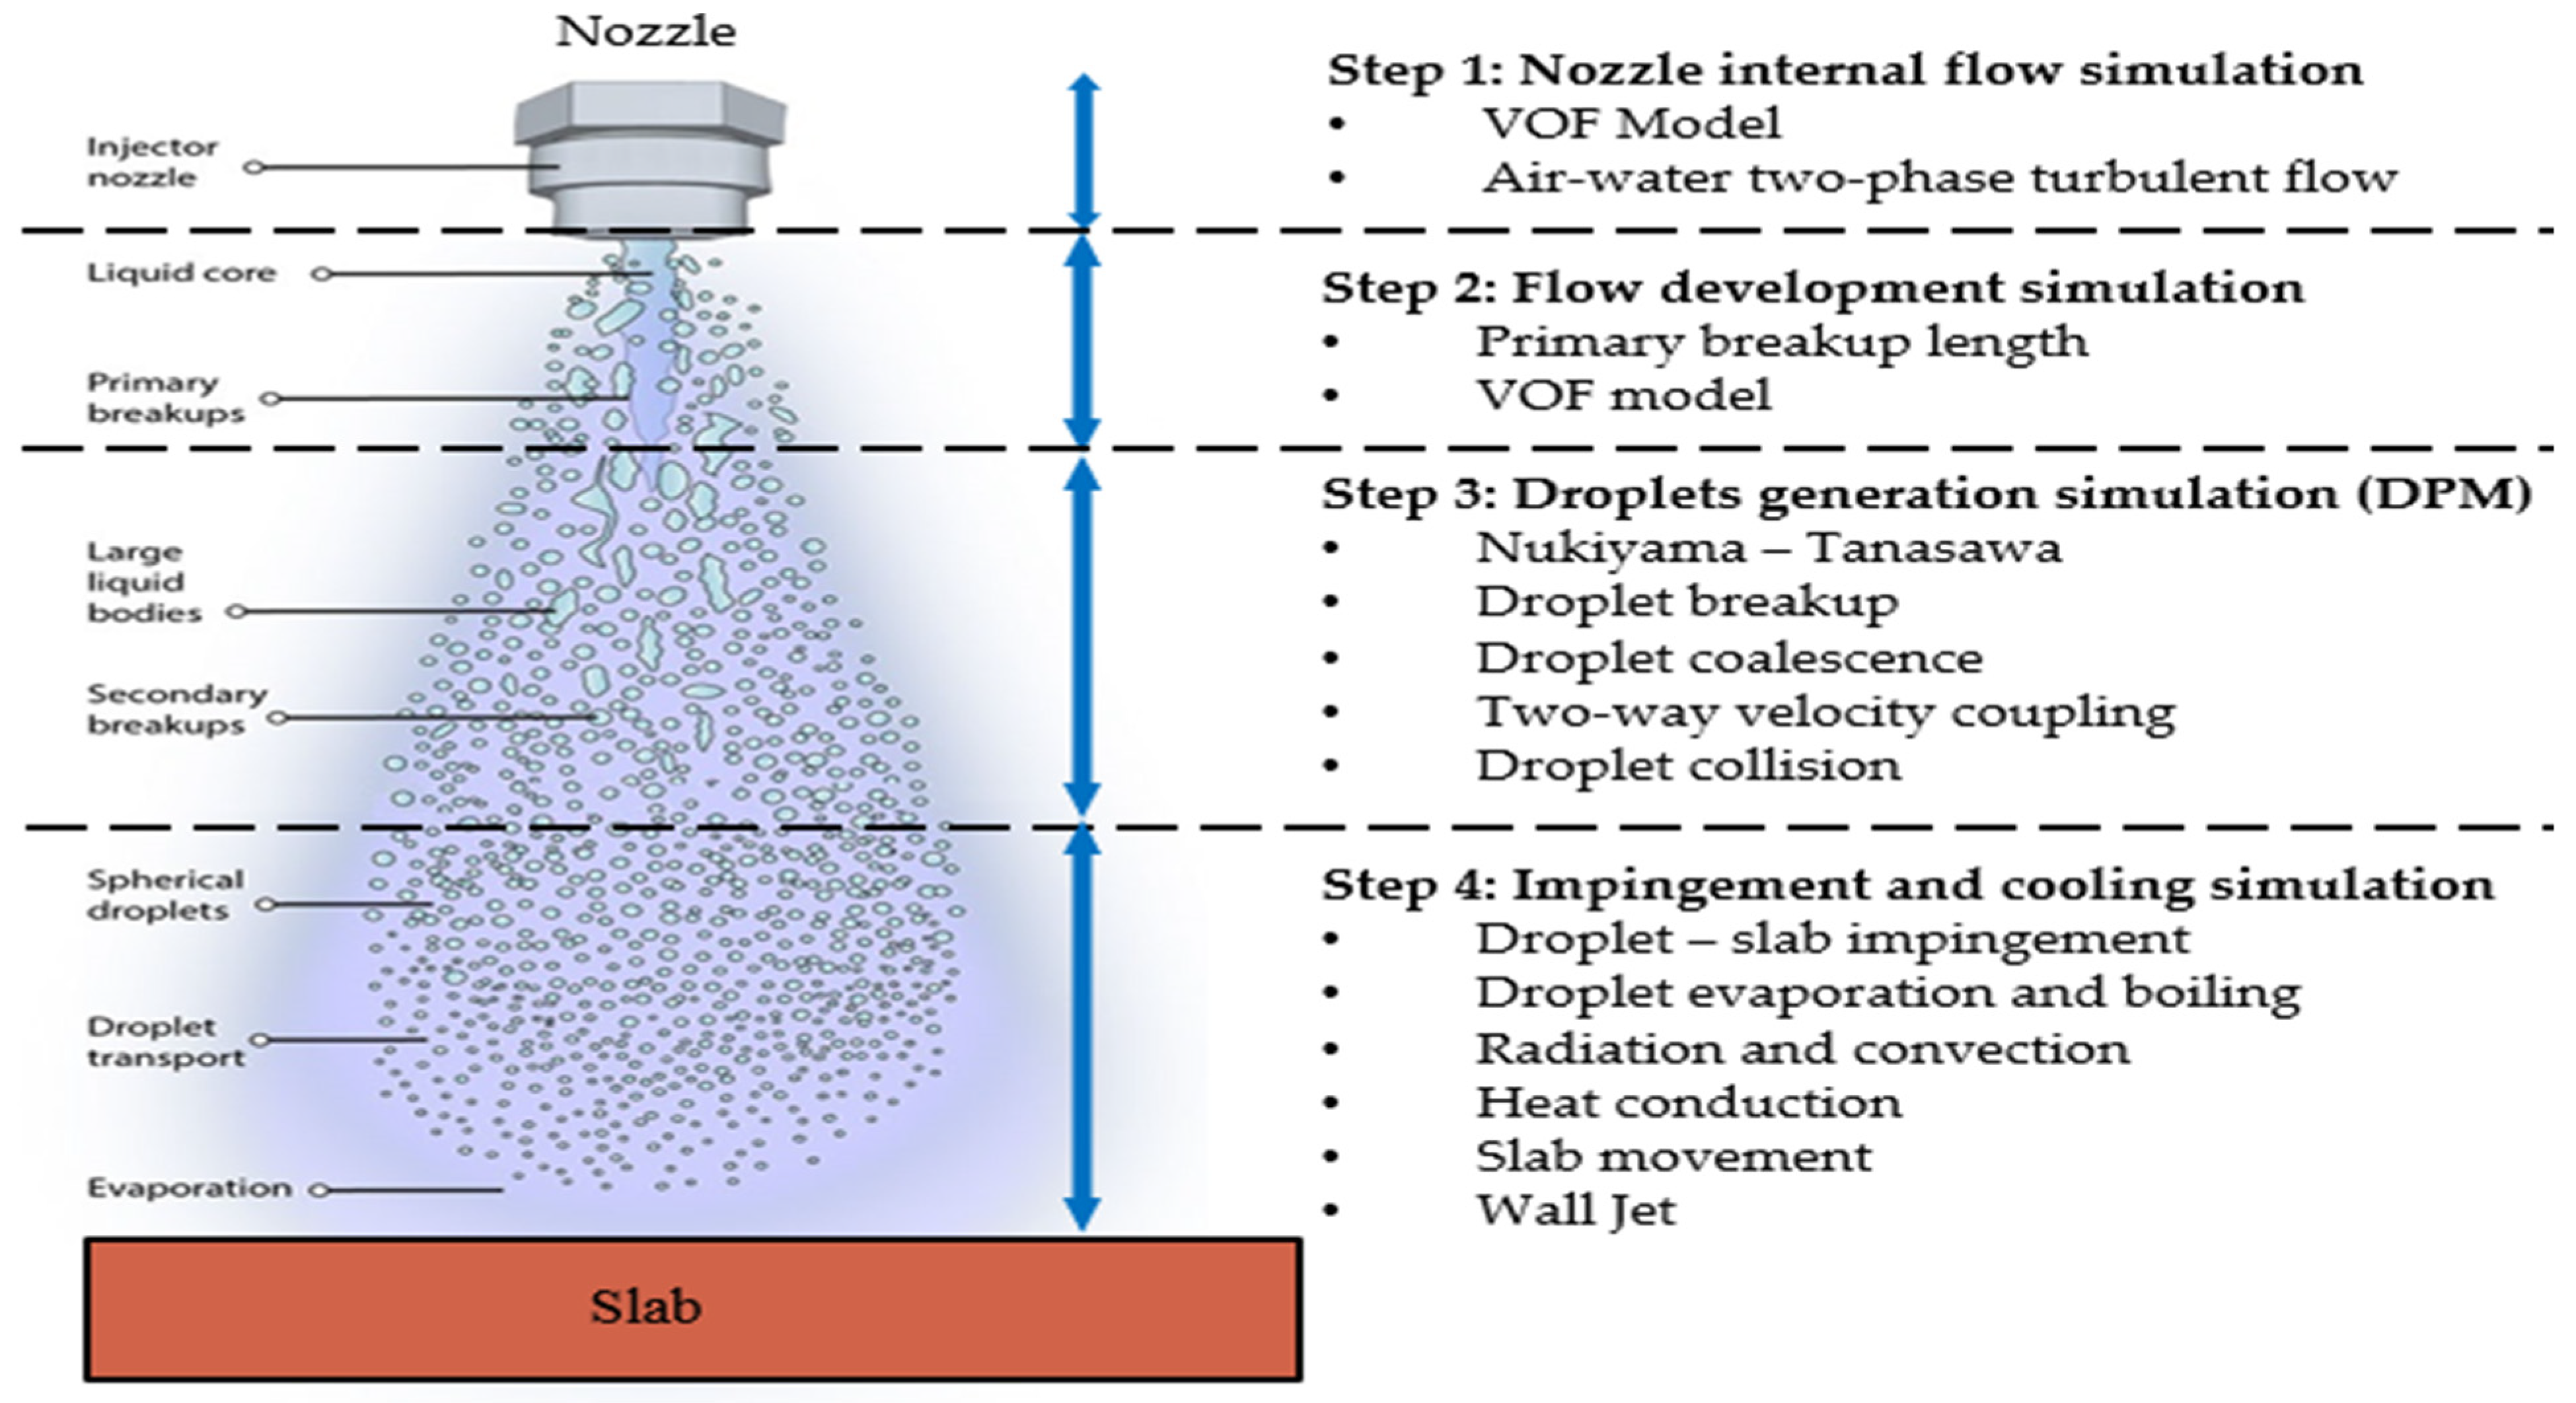
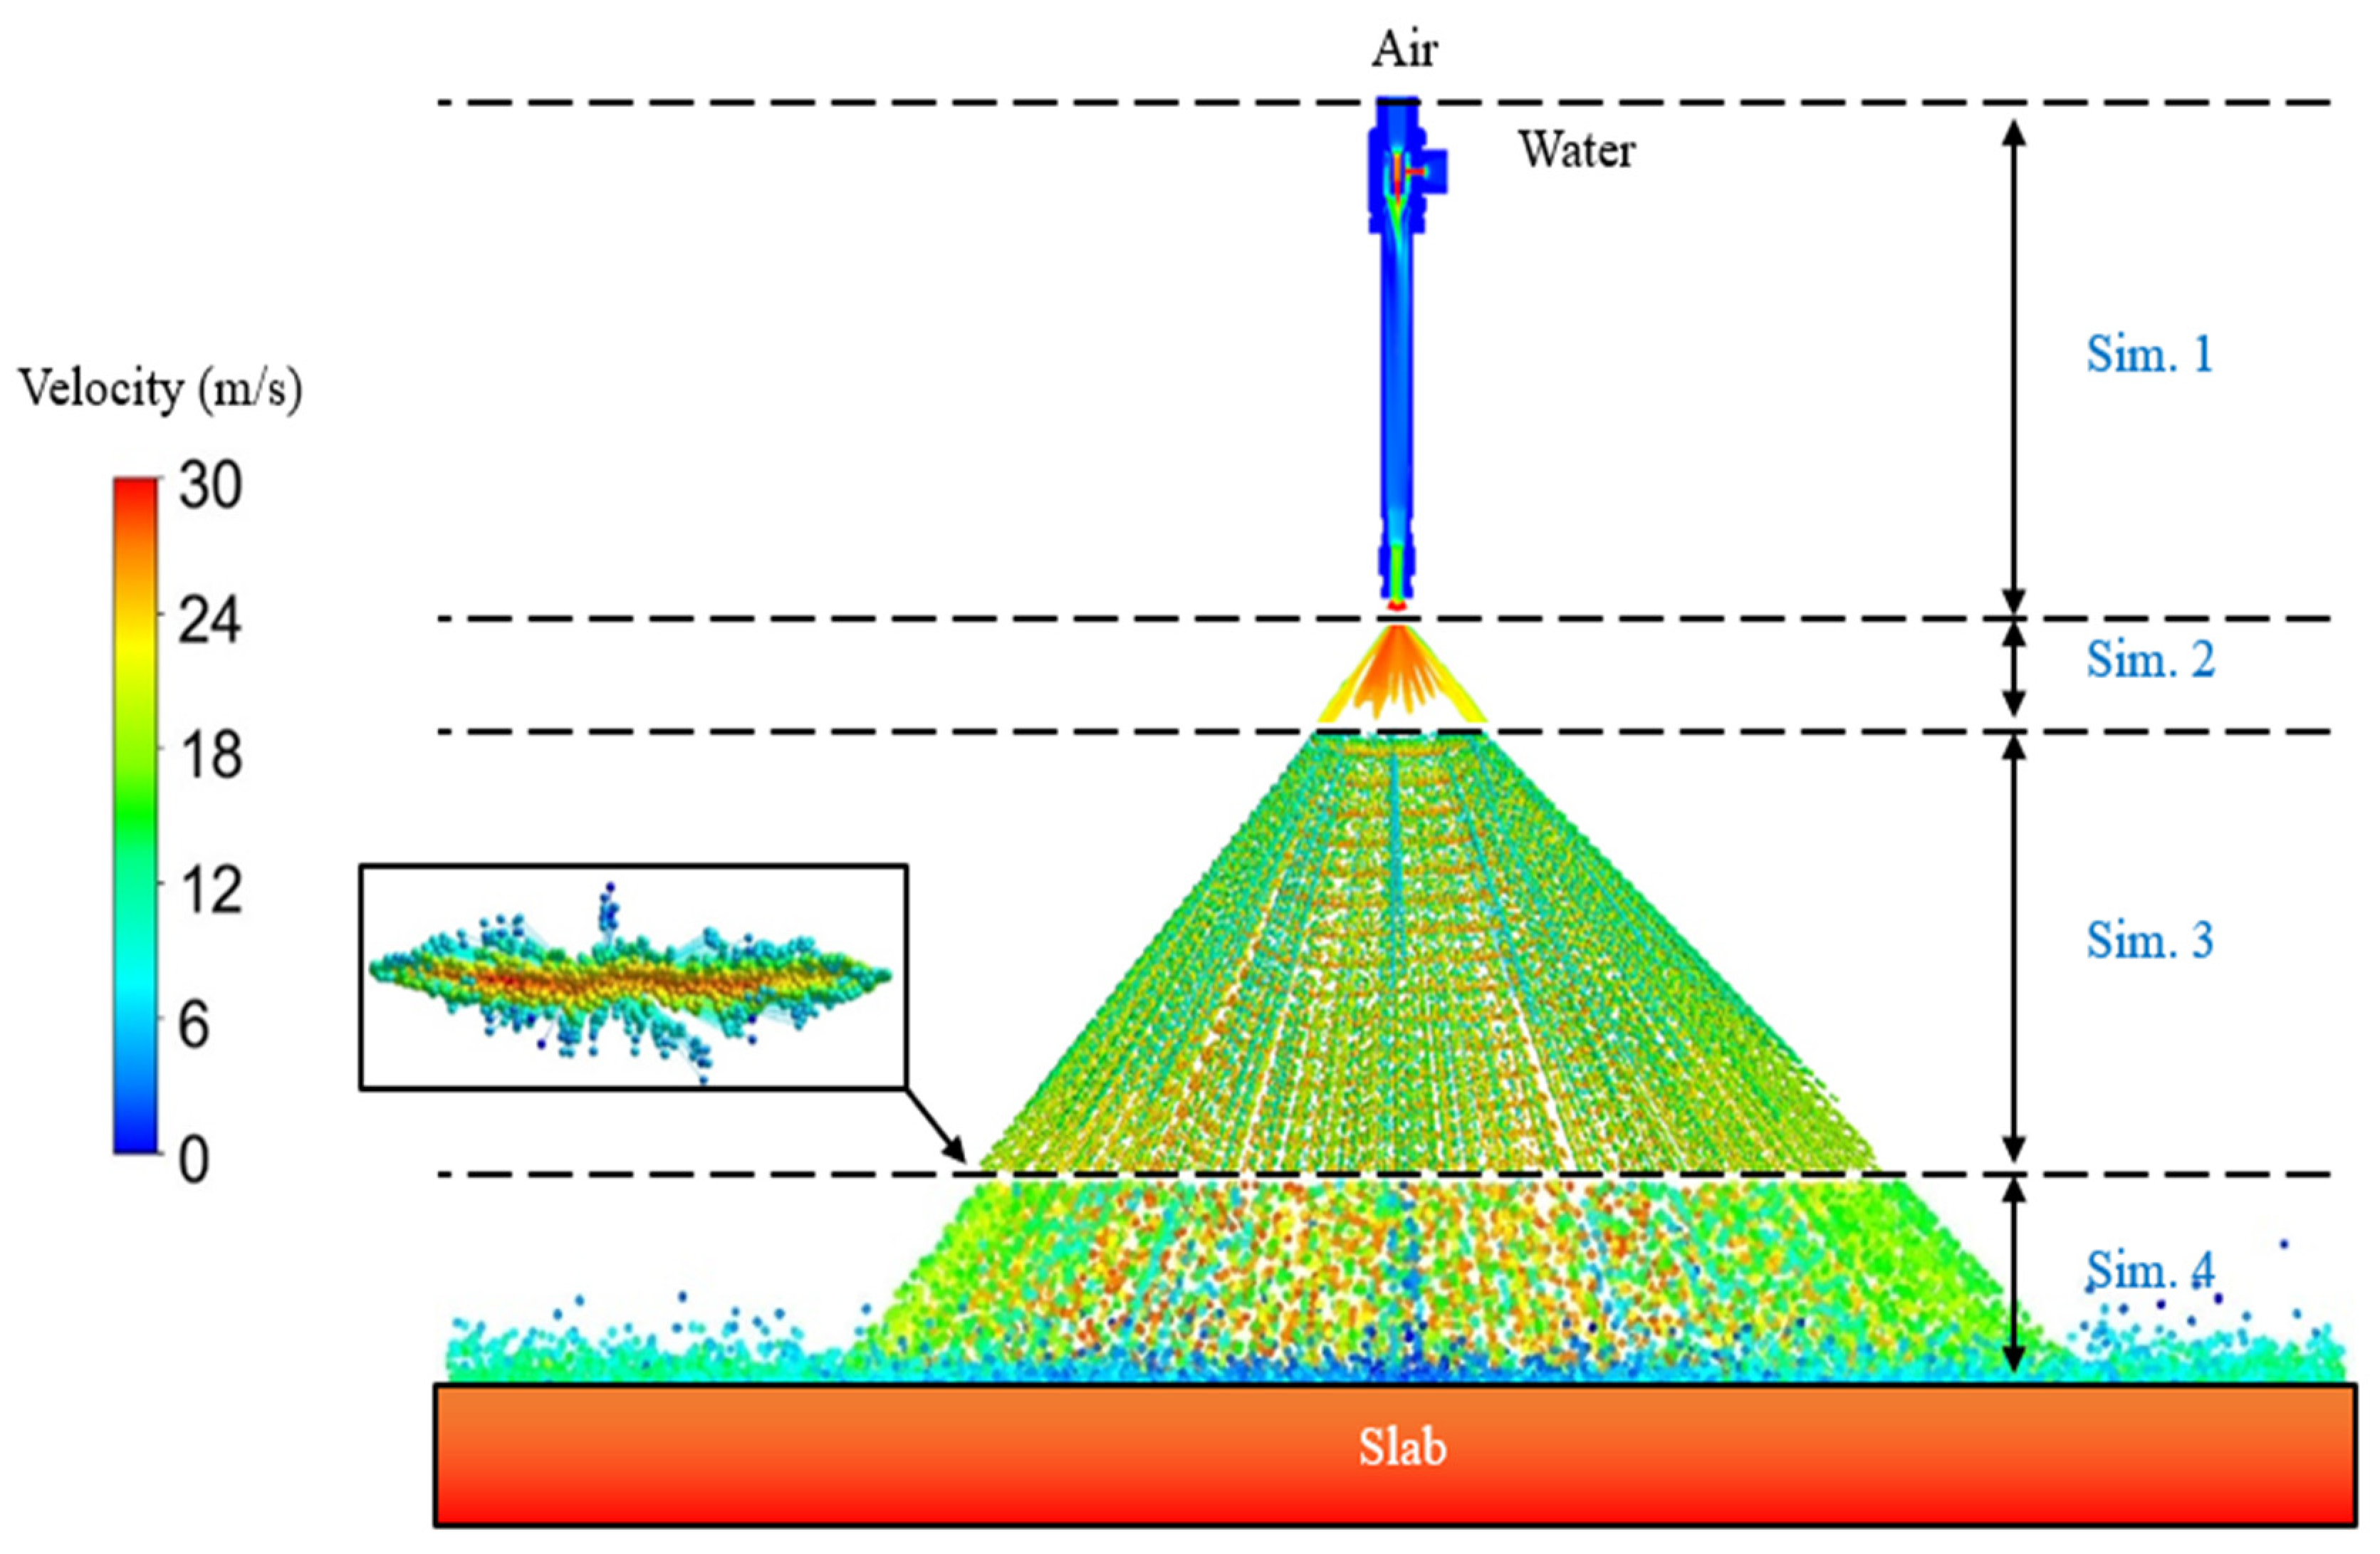
2.9. Simulation Approach
2.9.1. Section 1 (Internal Flow in the Nozzle)
2.9.2. Section 2 (Flow Development)
2.9.3. Section 3 (Droplets Generation)
2.9.4. Section 4 (Impingement and Cooling)
3. Computational Domain and Boundary Conditions
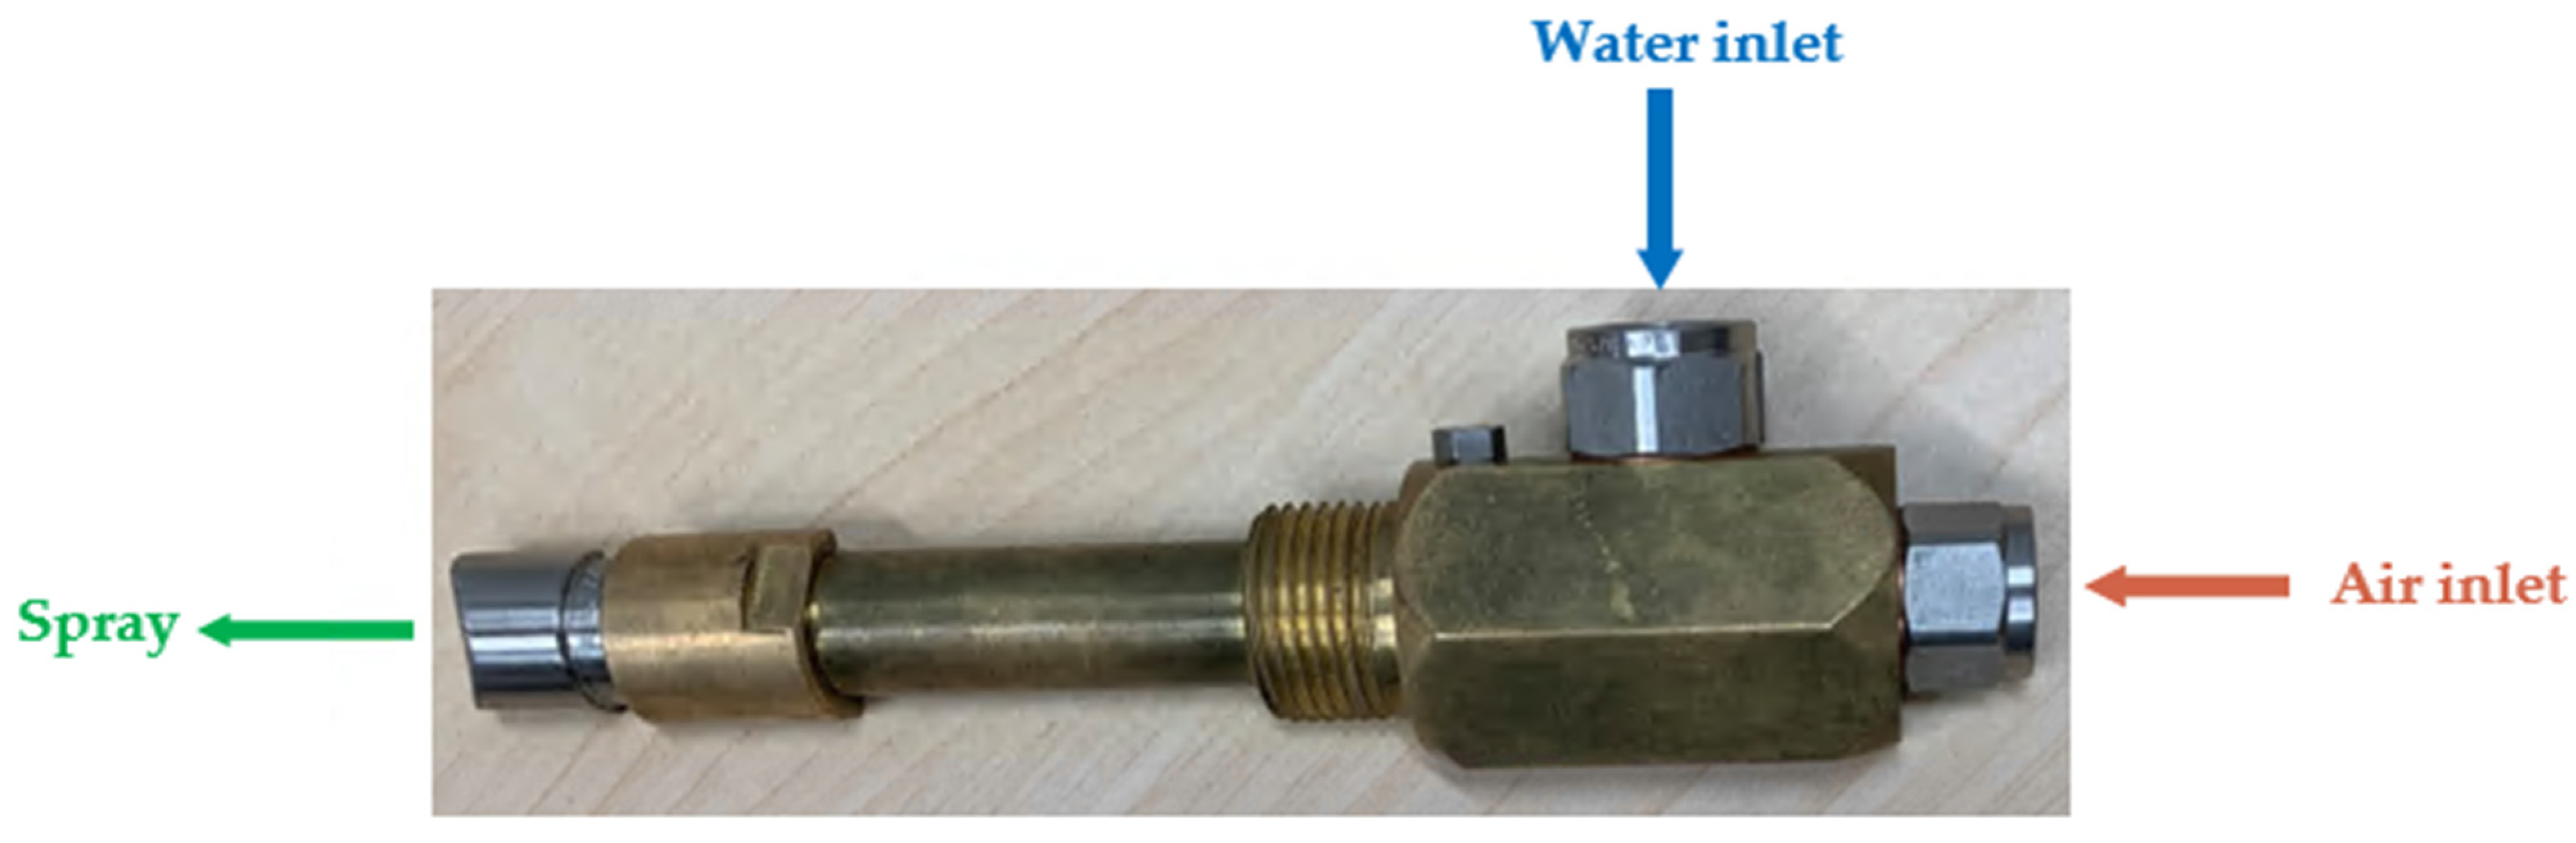
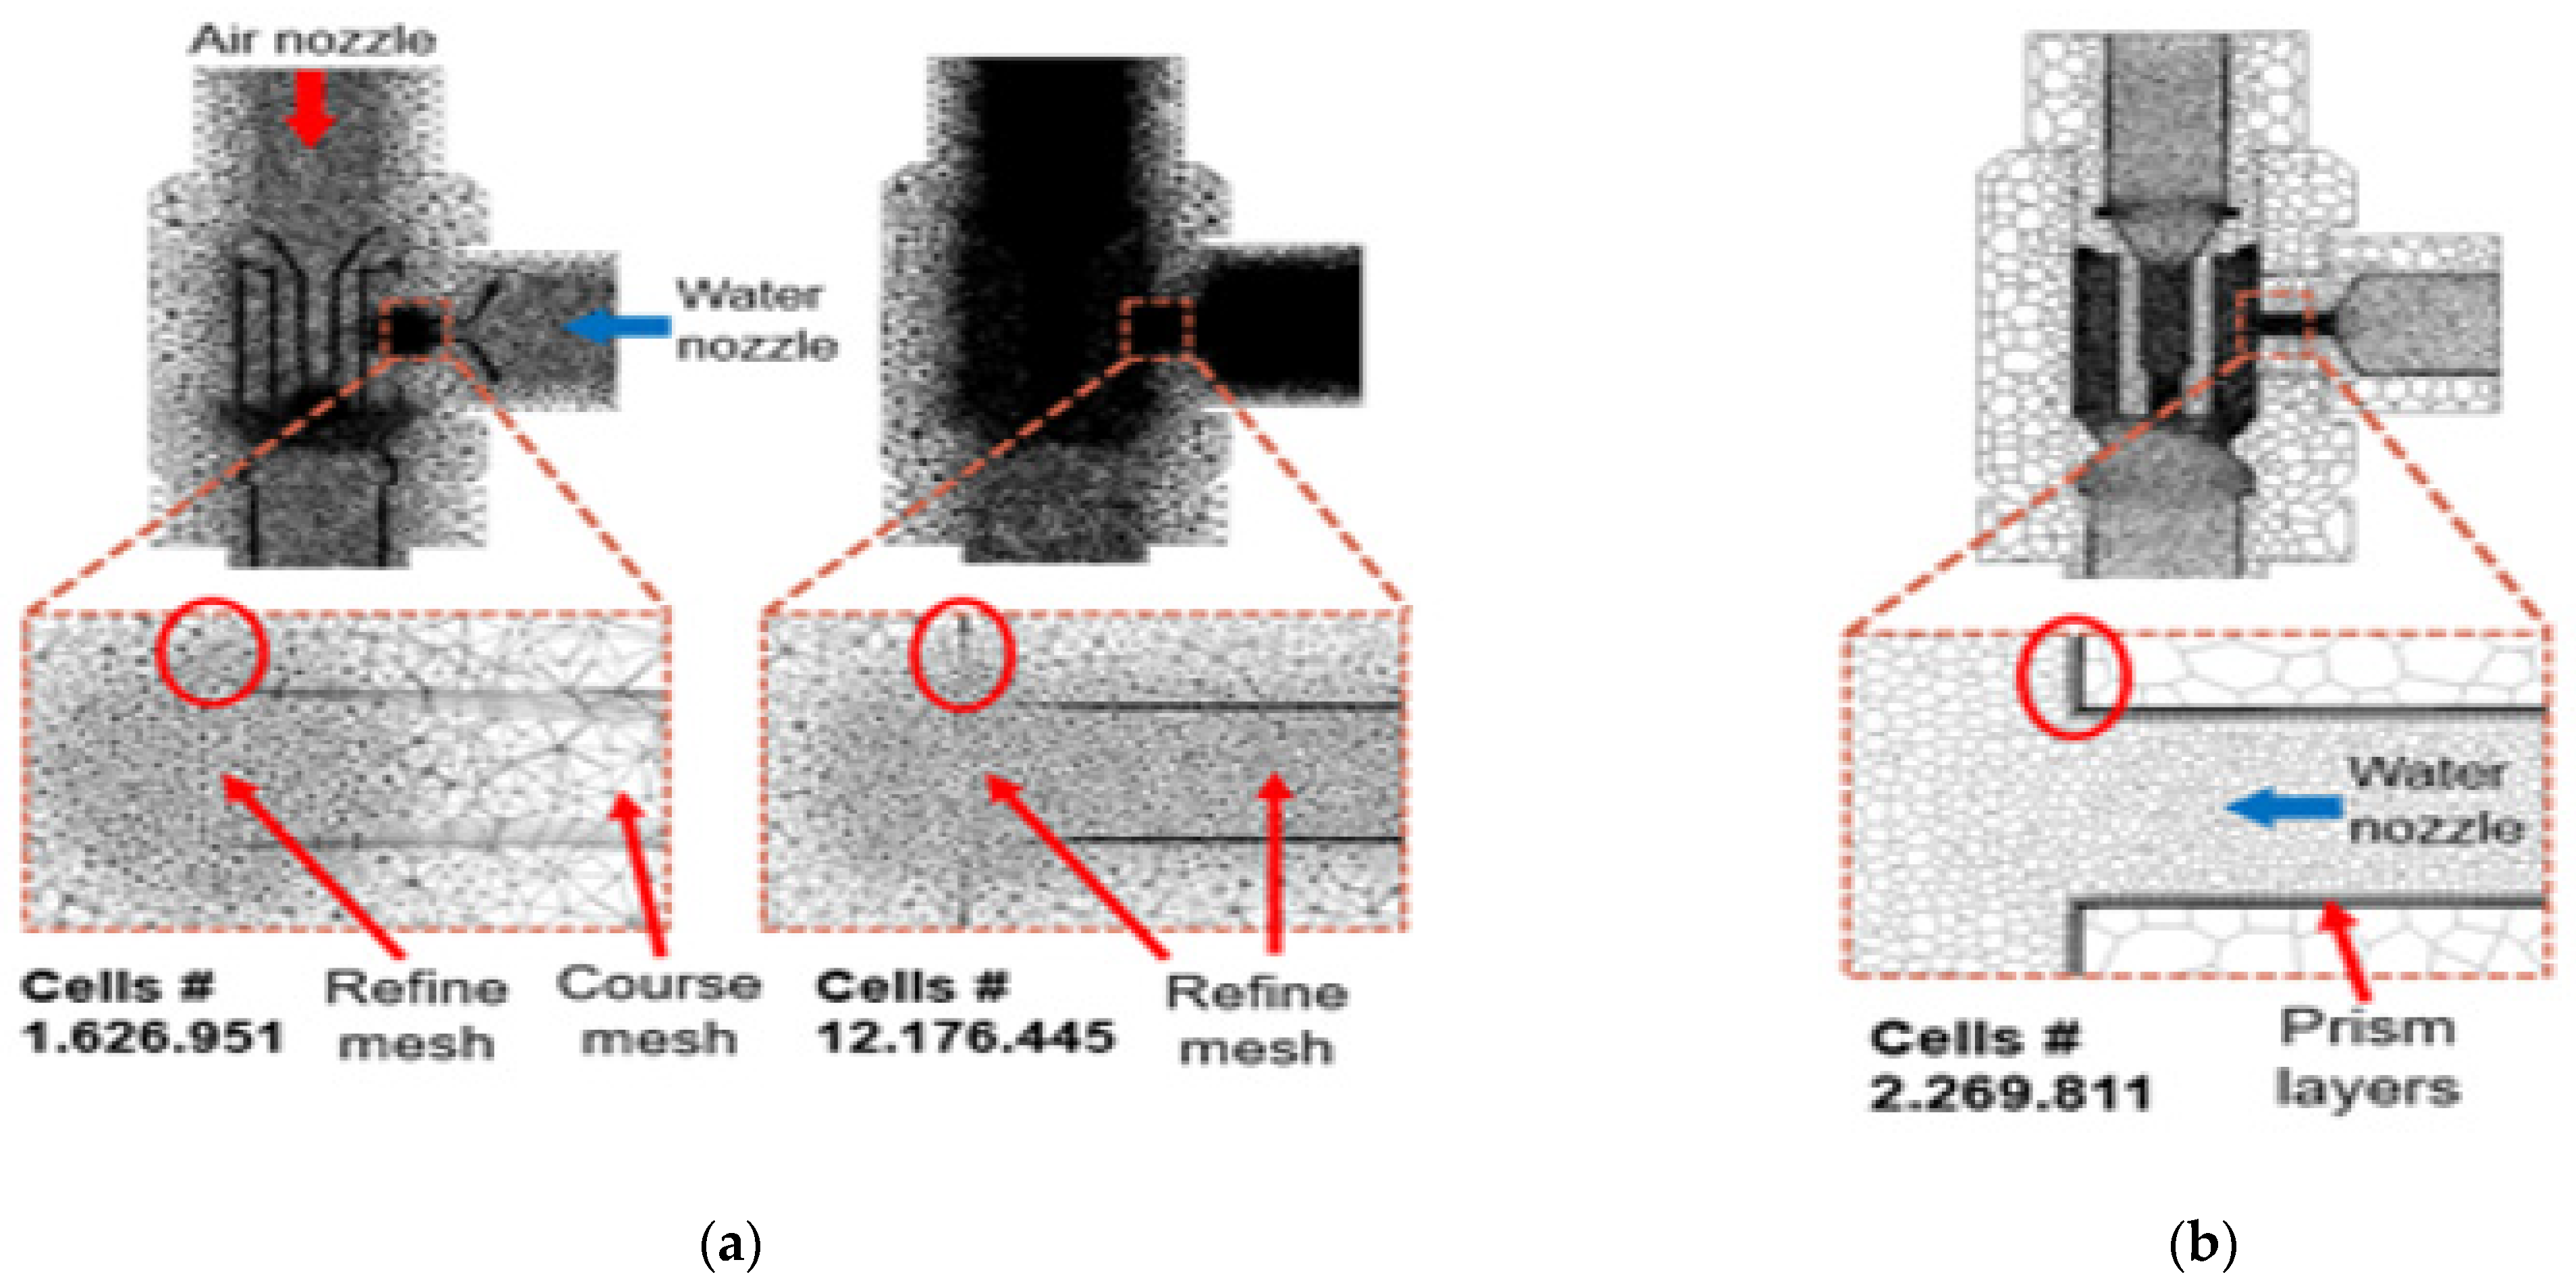
3.1. Nozzle Internal Region
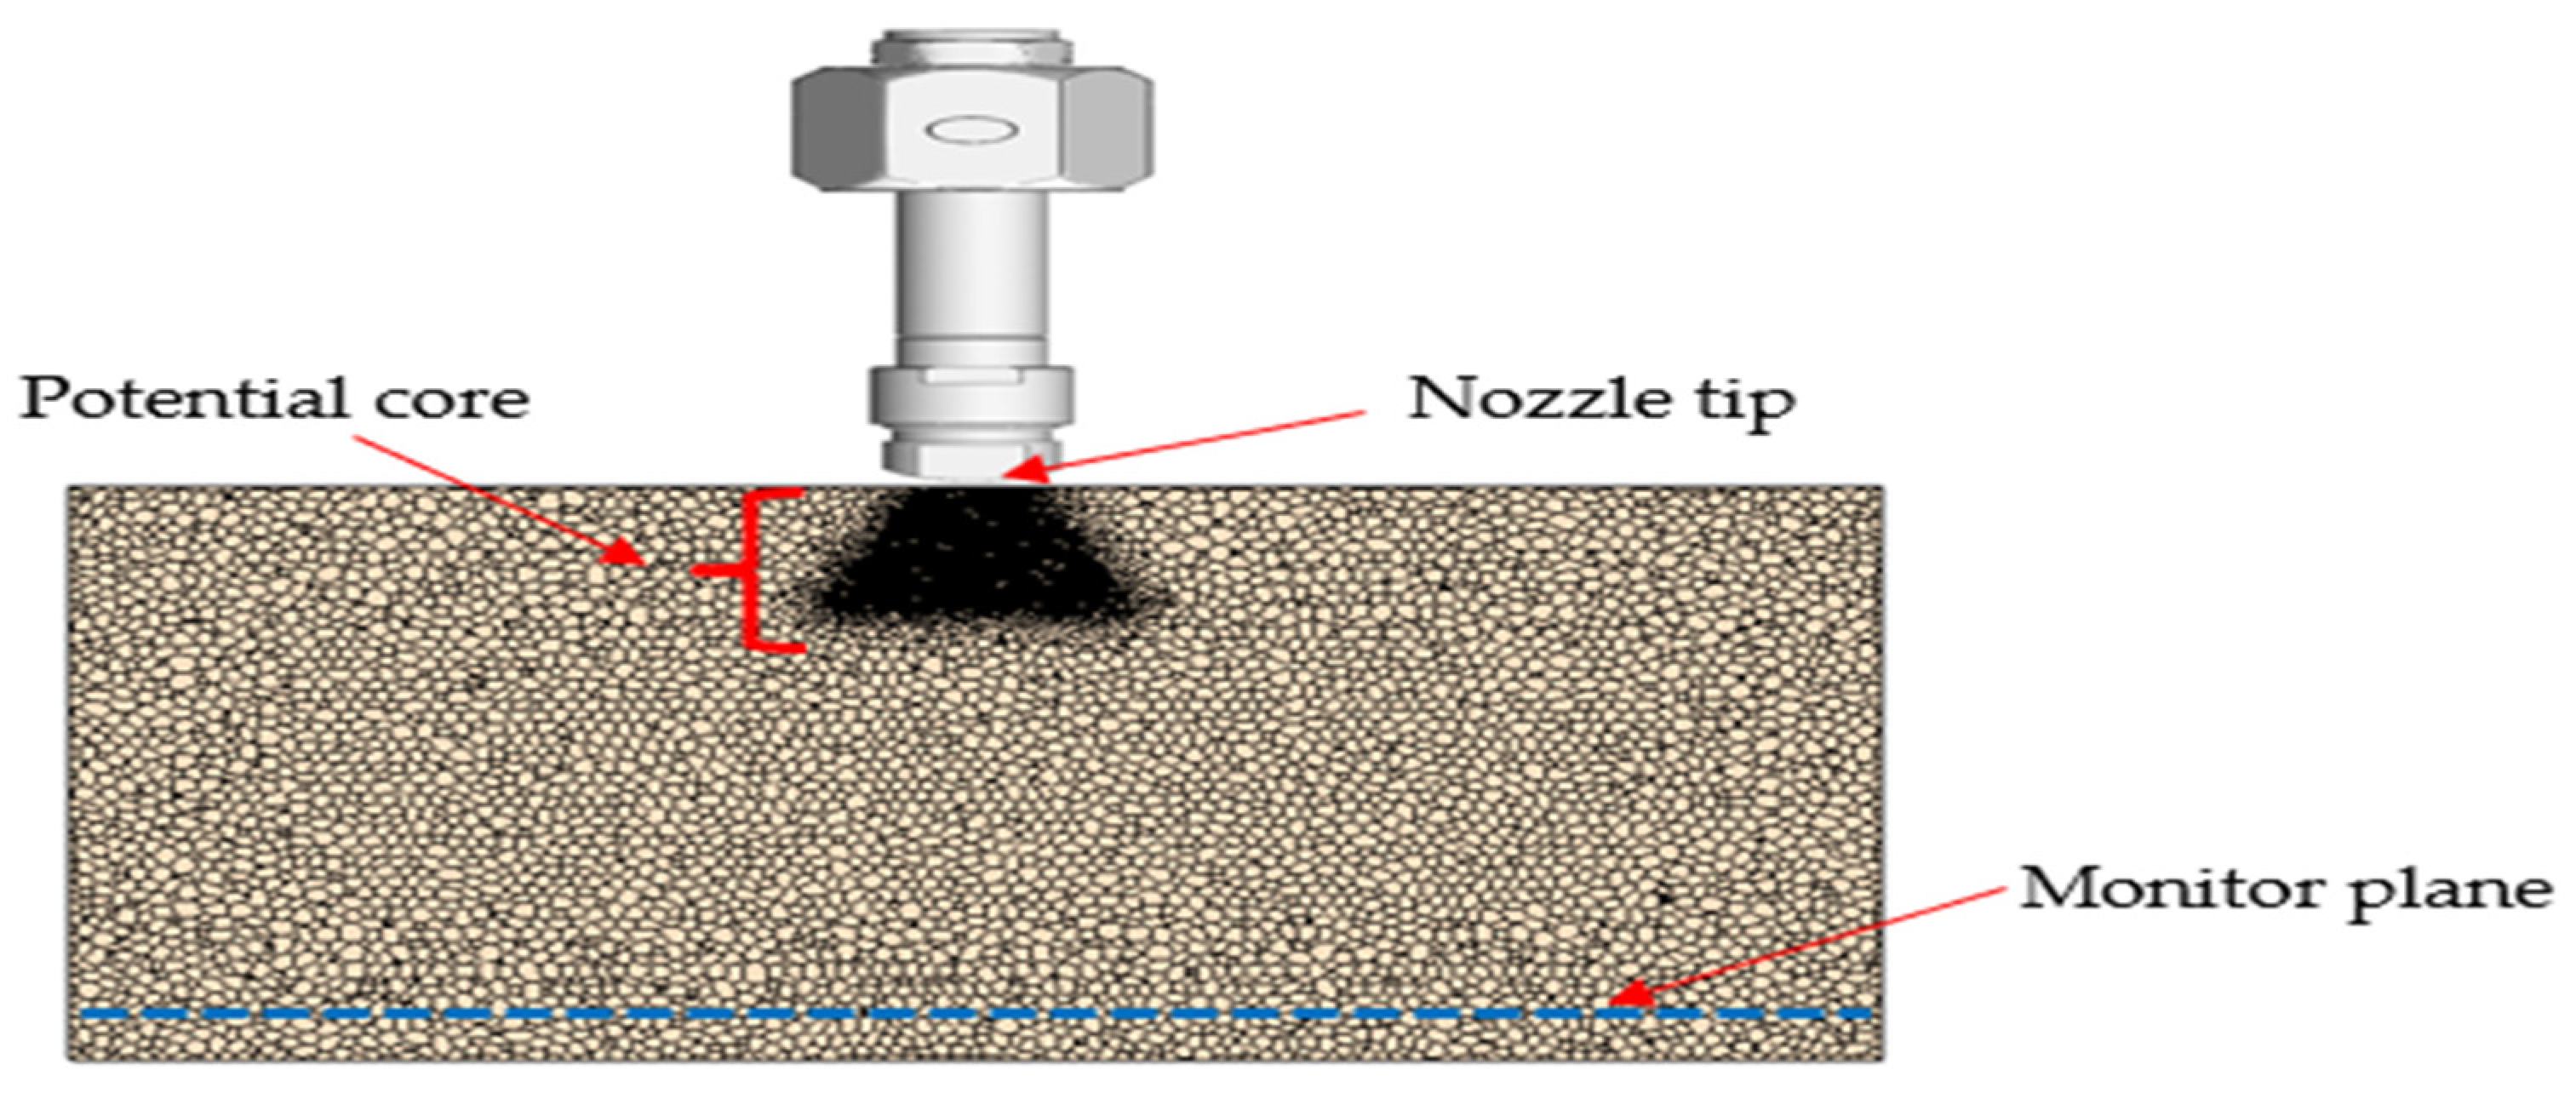
3.2. Spray Development
3.3. Droplets Generation
3.4. Impingement and Cooling
4. Results and Discussion
4.1. Validation of Droplet Size
4.2. Validation of VOF-to-DPM Model
4.2.1. Spray Cooling Result
4.2.2. Effect of Air Pressure on Slab Cooling
4.2.3. Effect of Water Flow Rate
4.2.4. Effect of Casting Speed
4.2.5. Effect of Standoff Distance
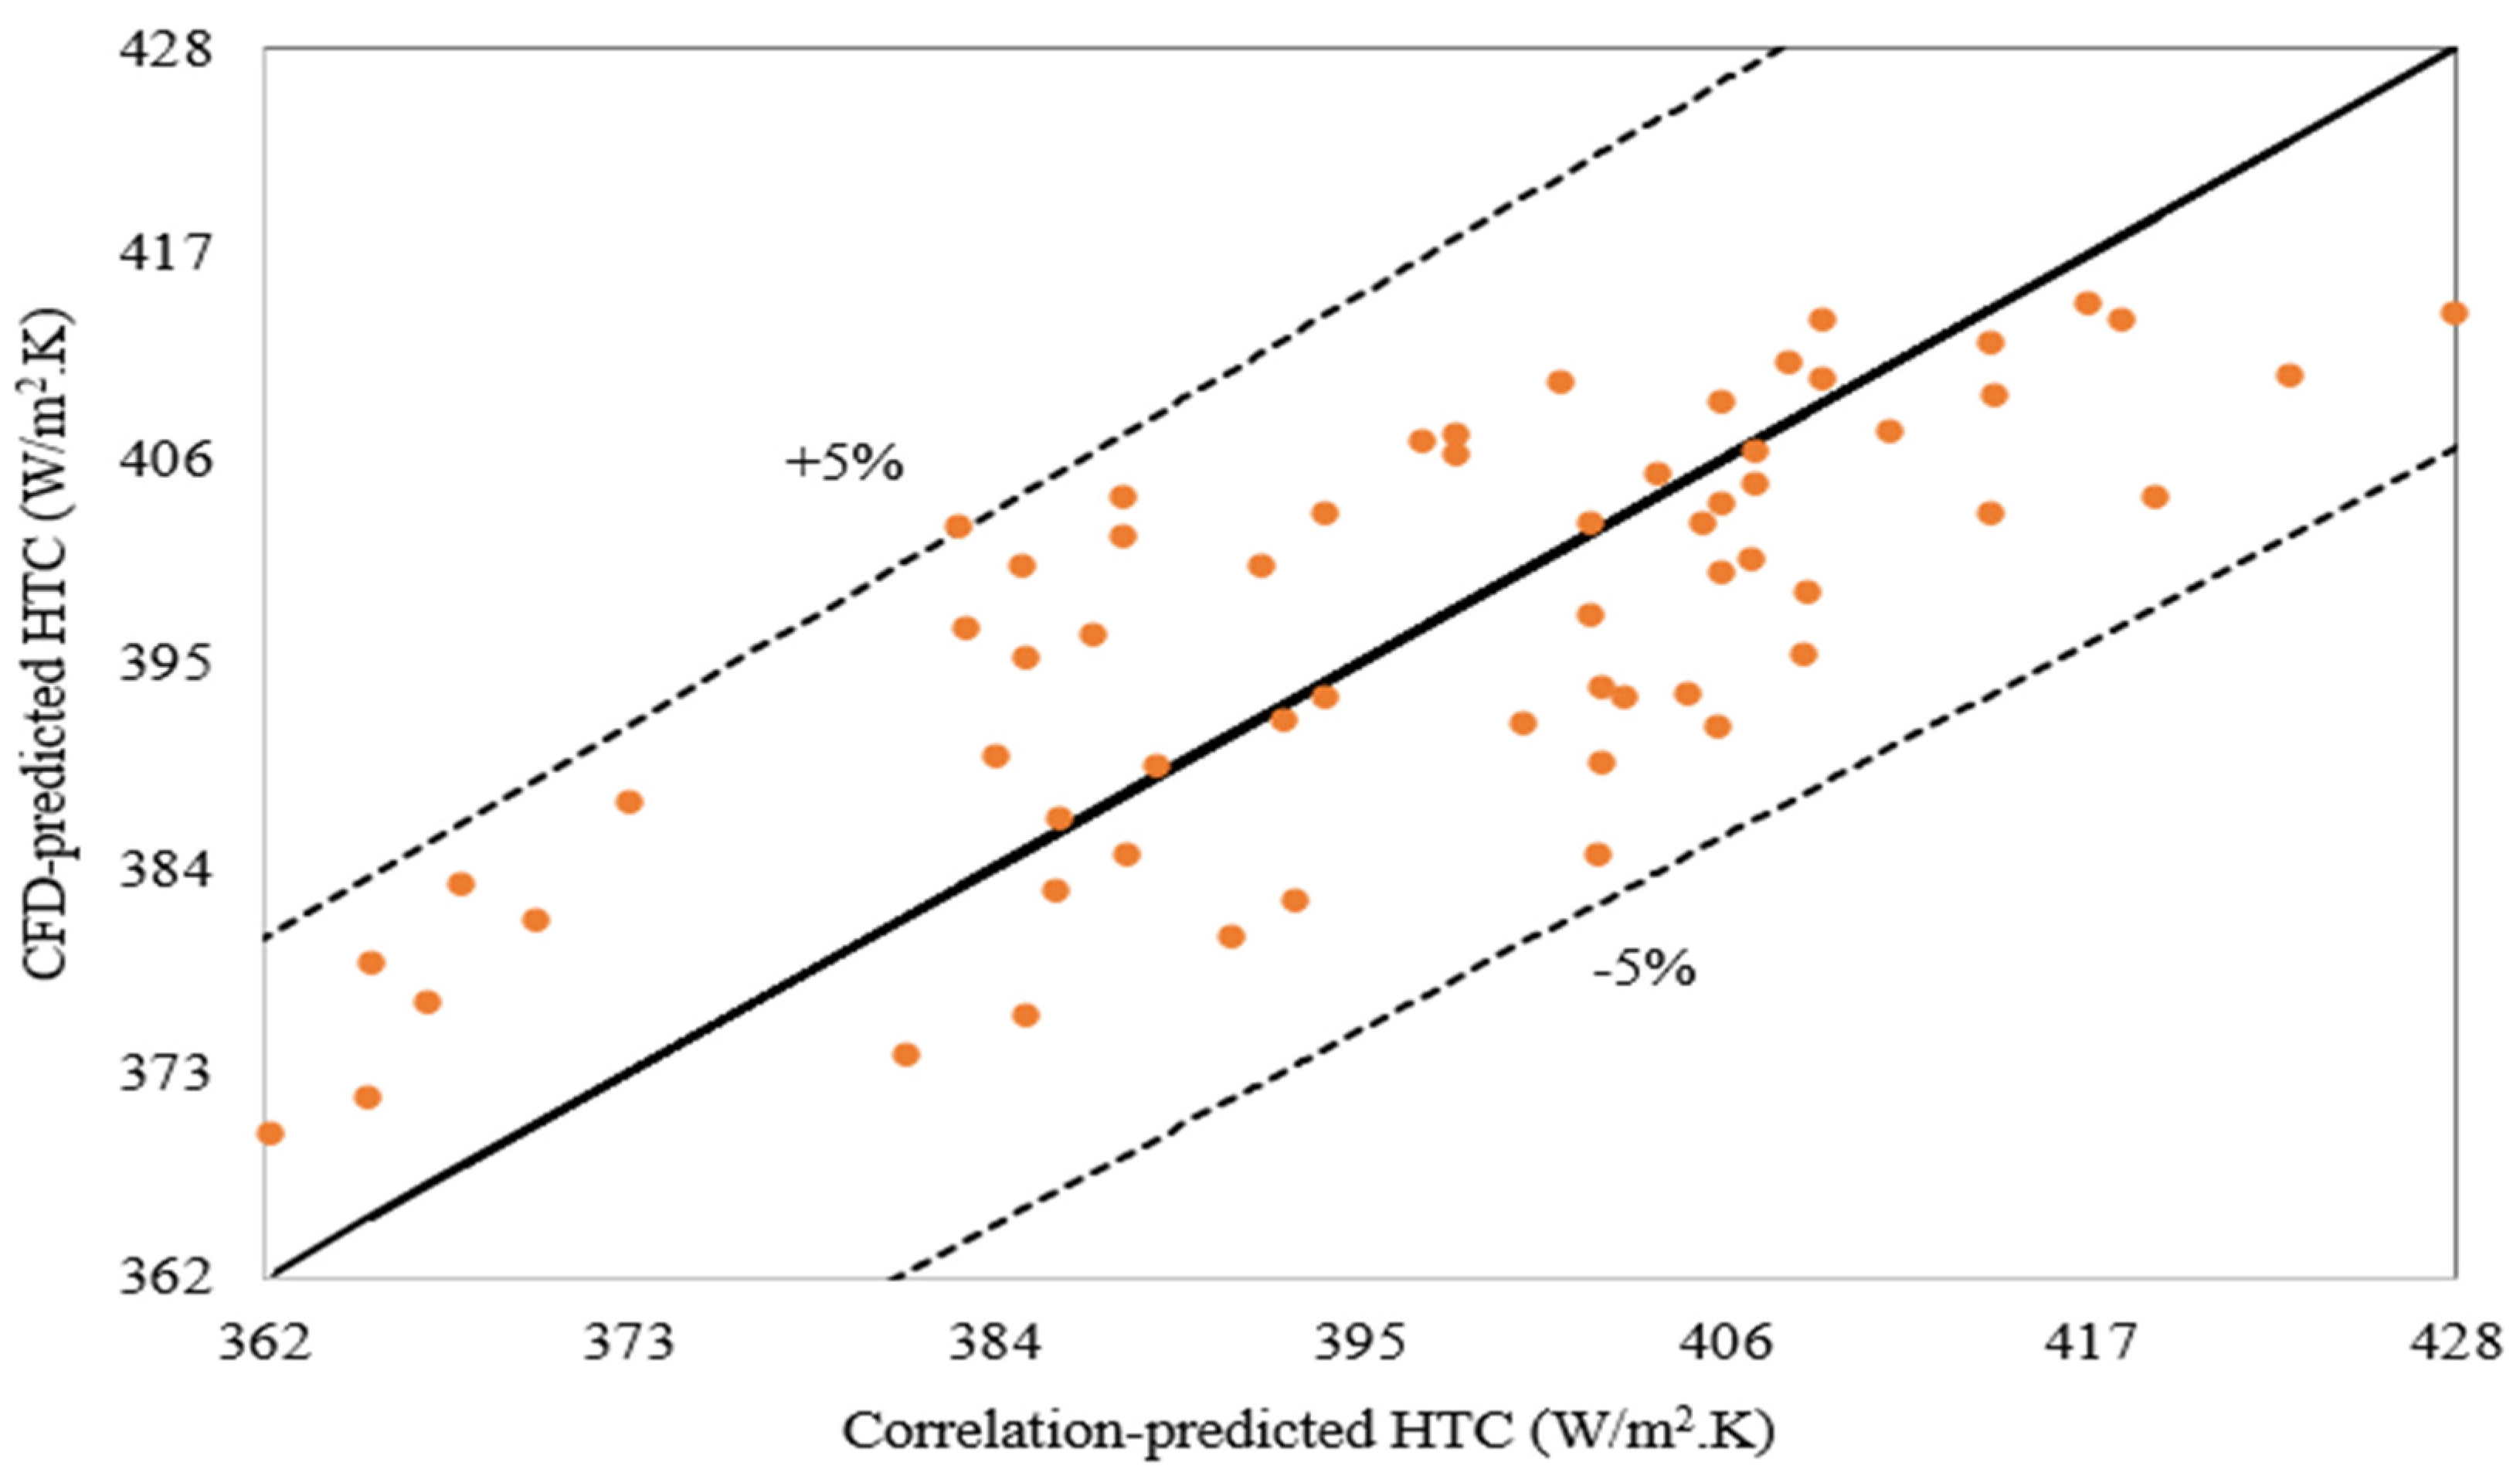
4.2.6. Heat Transfer Coefficient Correlation
5. Conclusions
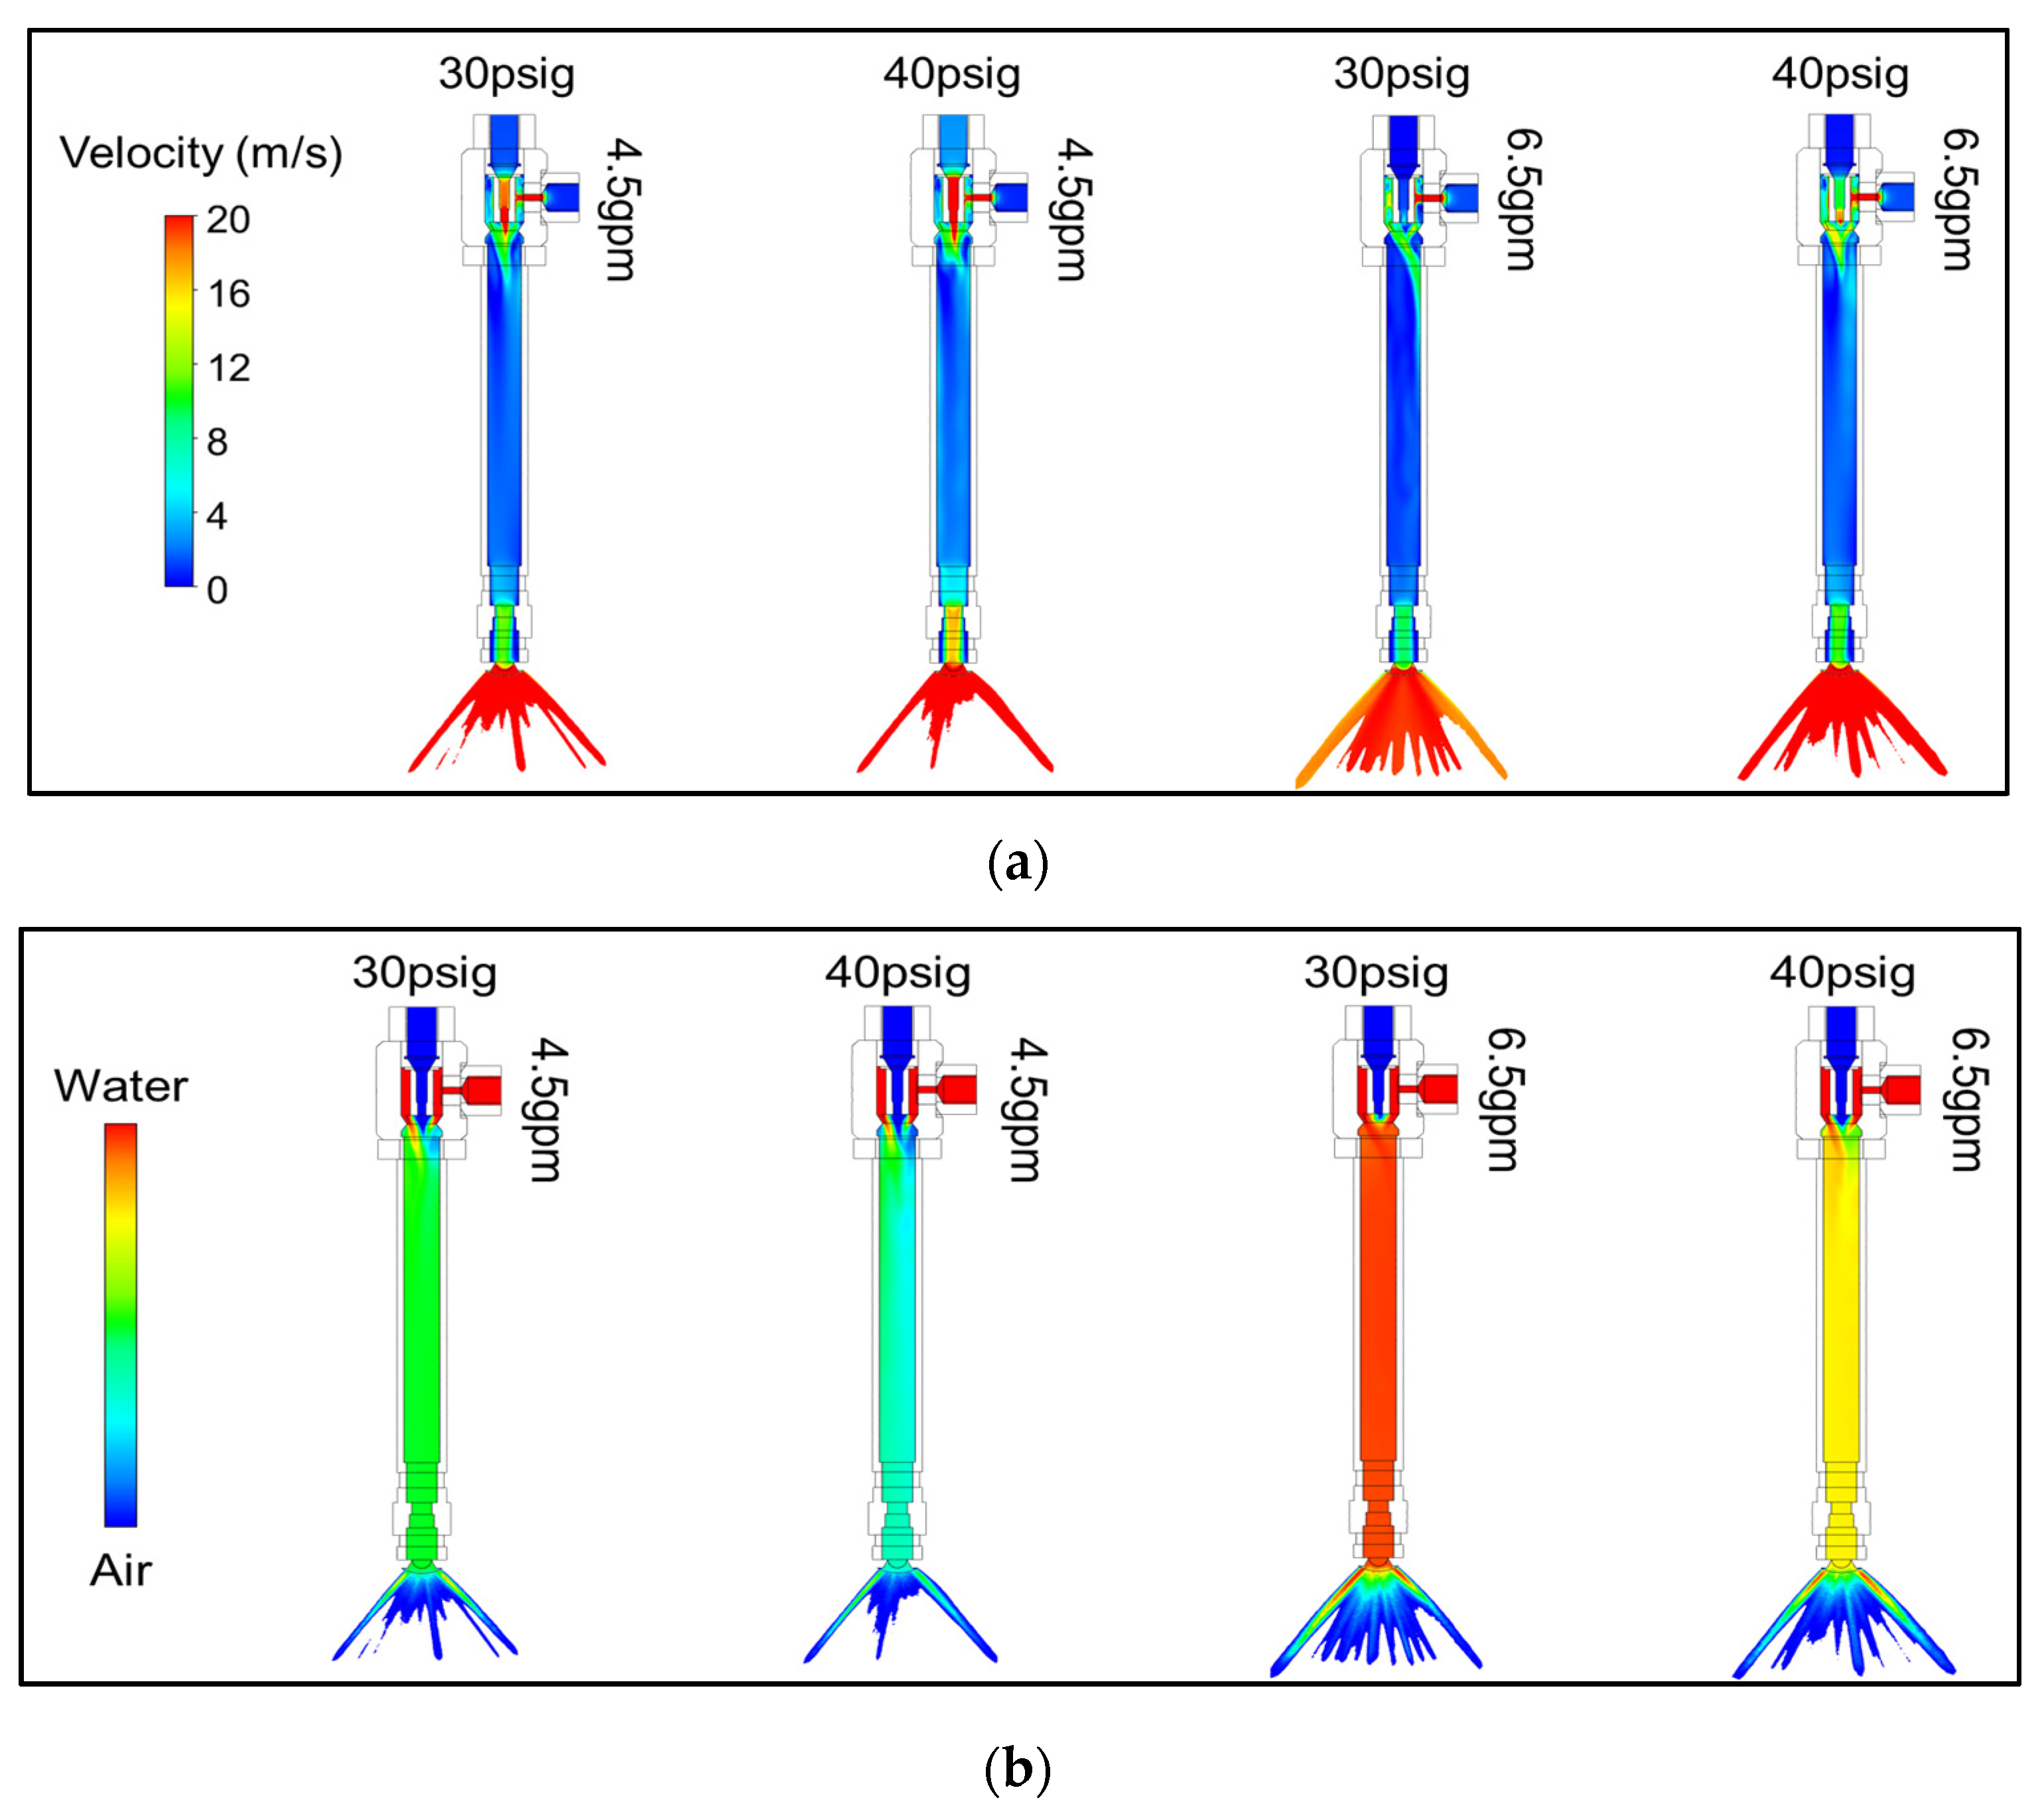
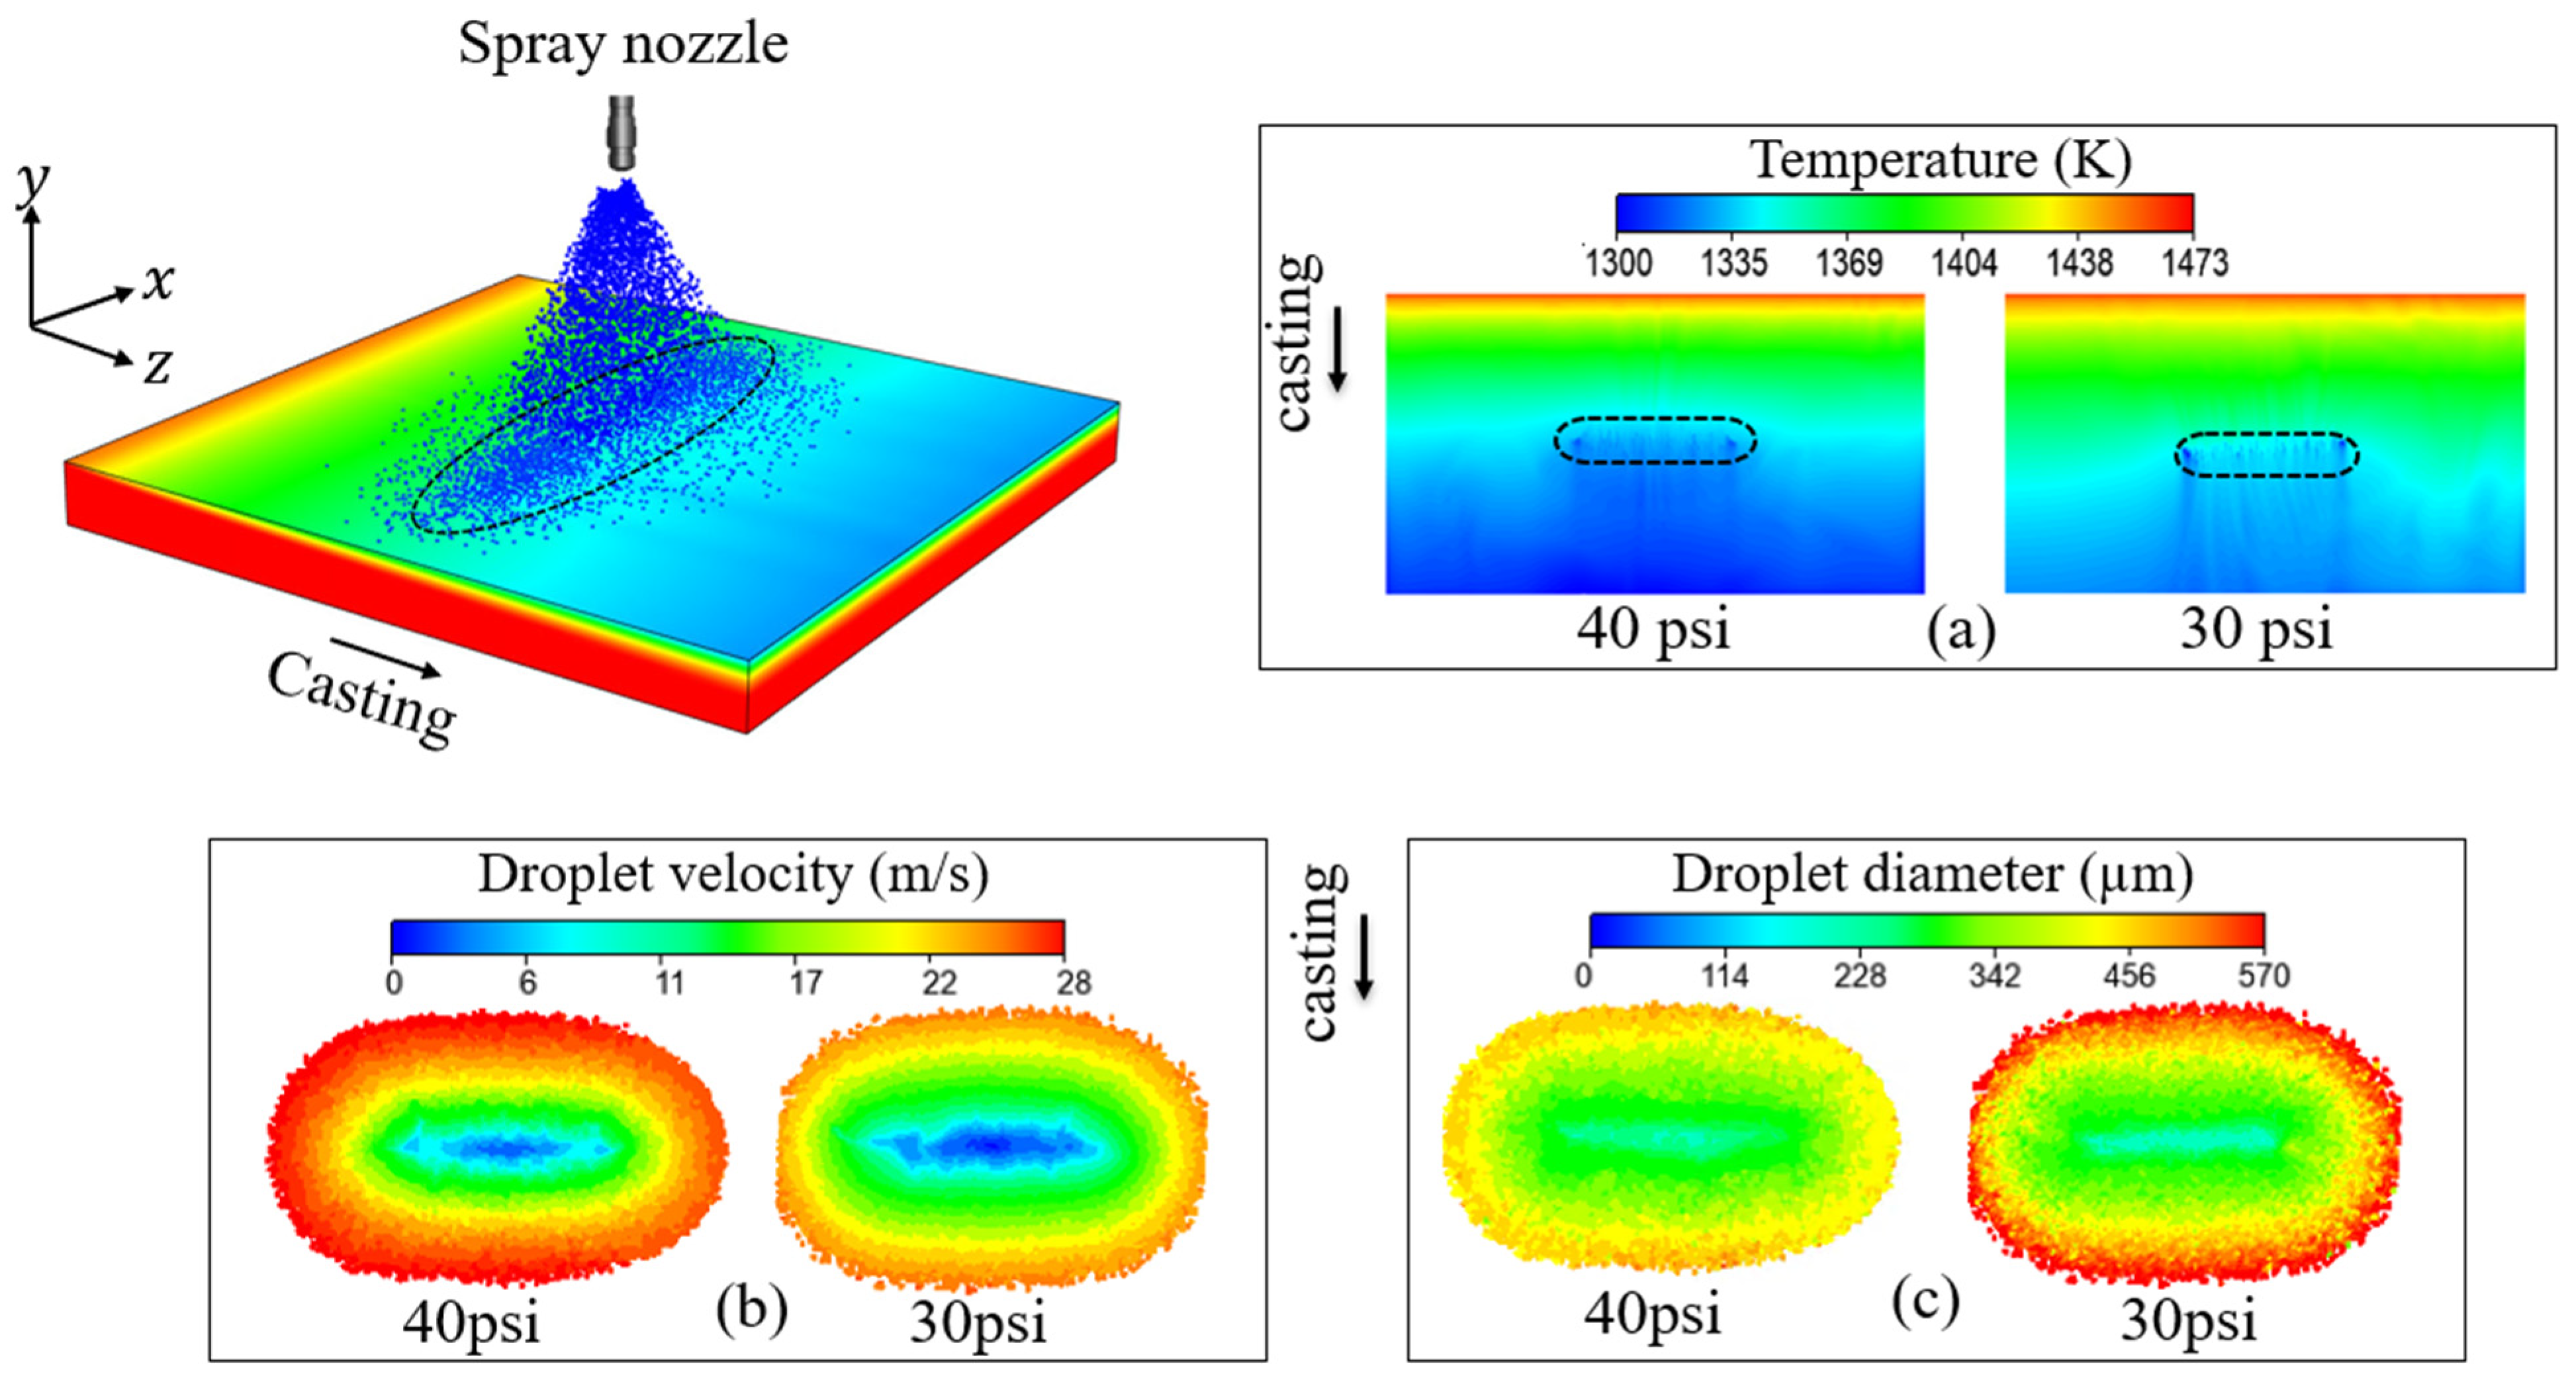
- Increase in air pressure increases the instabilities in the water nozzle resulting in faster breakup of water; the increased air pressure also impacts on the kinetic energy of the droplets and formation of smaller droplets that ultimately improves cooling. By increasing the air pressure from 30 psi to 40 psi, the droplets size could be reduced by 17% while the droplet velocity could be increased by 27.9%. This would result in an increase in the lumped HTC by 9.2%. this effect would be more if the air pressure is increased further although there is a risk of reduced cooling effect as the very small droplets produced upon further increase could evaporate before reaching the slab thereby reducing drastically the quantity of droplets available to cool the slab.
- Increase in air pressure could also lead to droplet loss due to air entrainment or the droplets evaporating before reaching the hot steel slab if the droplet size is very small.
- With increased water flow rate from 2 gpm to 2.5 gpm at a constant air pressure of 30 psi, the weber number and Reynolds number at the nozzle outlet reduces by 33.8% and 25.9%, respectively. Increase in water flow rate increases the number of droplets on the slab but the droplets have lower velocity and higher size resulting in lower cooling of the slab.
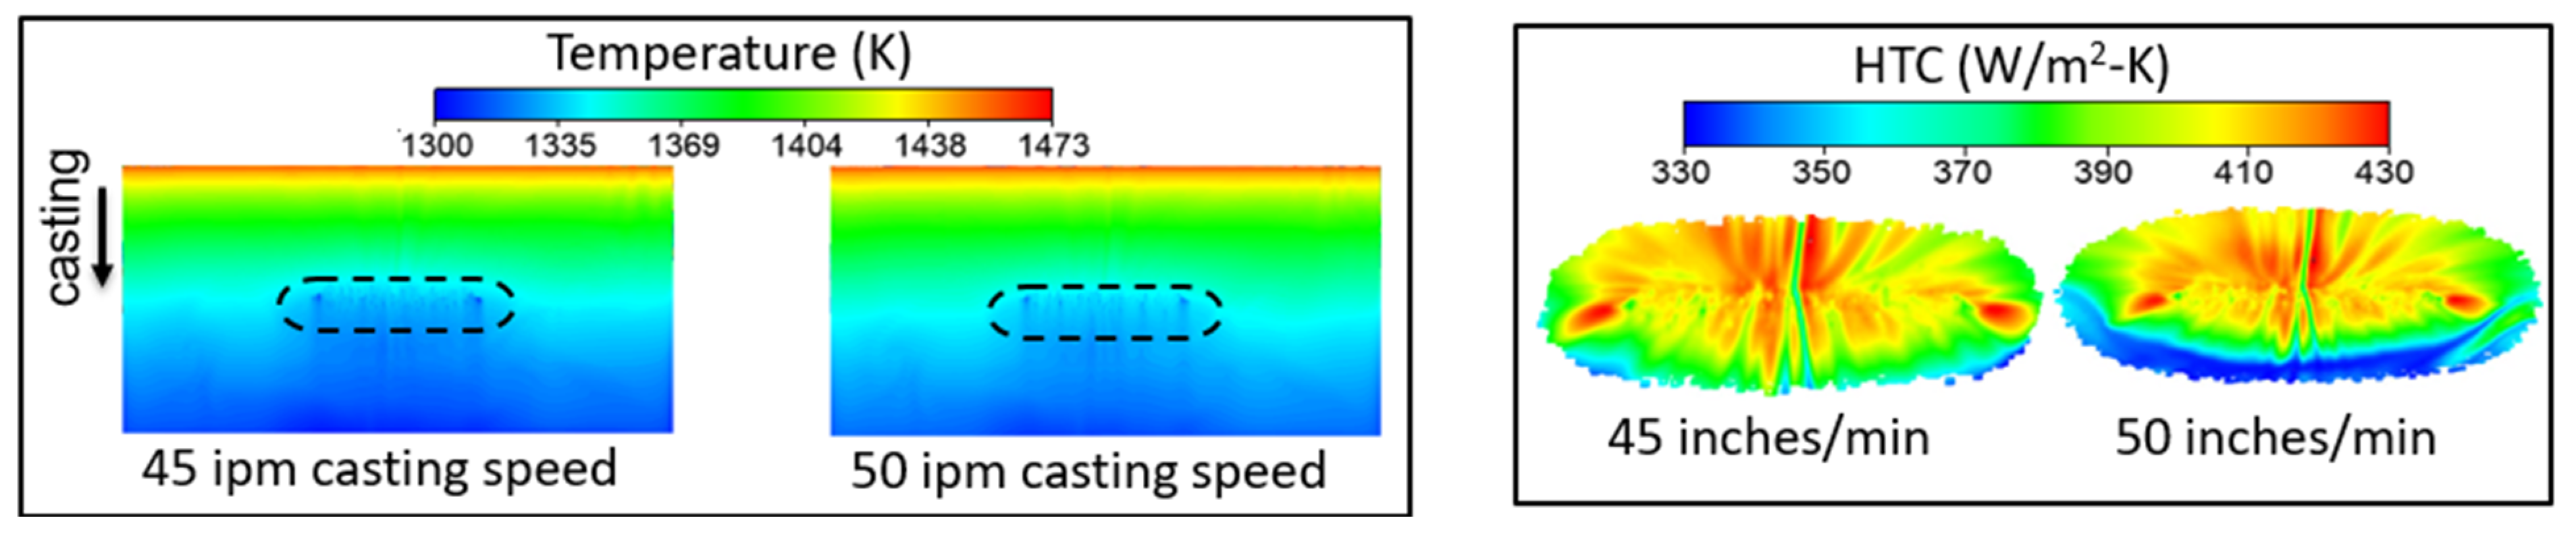
- Increase in casting speed results in lower contact time between the droplets and the slab and thus lower cooling of the slab. At an air pressure of 40 psi and a water flow rate of 2 gpm, the cooling of the slab could decrease by 4.41% when the casting is increased from 45 ipm to 50 ipm and by 10.29% when it is further increased to 60 ipm.
Author Contributions
Funding
Data Availability Statement
Acknowledgments
Conflicts of Interest
References
- Laitinen, E.; Neittaanmaaki, P. On Numerical Simulation of the Continuous Casting Process. J. Eng. Math. 2003, 22, 335–354. [Google Scholar] [CrossRef]
- Thomas, B.G. Continuous Casting (metallurgy). In Yearbook of Science and Technology; McGrow-Hill Co.: New York, NY, USA, 2004. [Google Scholar]
- Stahl: World Steel Production. 2009. Available online: http://www.stahlonline.de/english/business_and_politics/economic_and_trade_policy/steel_in_figures/start.asp (accessed on 13 February 2020).
- Sengupta, J.; Thomas, B.G.; Wells, M.A. The use of water cooling during the continuous casting of steel and aluminium. Metall. Mater. Trans. B 2005, 36, 187–204. [Google Scholar] [CrossRef]
- Camporredondo, S.J.E.; Castillejos, E.A.H.; Acosta, G.F.A.; Gutie’rrez, M.E.P.; Herrera, G.M.A. Analysis of Thin-Slab Casting by the Compact-Strip Process: Part I. Heat Extraction and Solidification. Metall. Mater. Trans. B 2004, 35, 541–559. [Google Scholar] [CrossRef]
- Hibbins, S.G.; Brimacombe, J.K. Characterization of heat transfer in the secondary cooling system of a continuous slab caster. ISS Trans. 1983, 3, 77–89. [Google Scholar]
- Haibo, M.; Justina, L.; Kaile, T.; Rui, L.; Michael, L.; Armin, S.; Chenn, Q.Z. Modelling of spray cooling with a moving steel slab during the continuous casting process. Steel Res. Int. 2019, 90, 18000393. [Google Scholar]
- Visaria, M.; Issam, M. Theoretical and experimental study of the effects of spray inclination on two-phase spray cooling and critical heat flux. Int. J. Heat Mass Transfer 2008, 51, 2398. [Google Scholar] [CrossRef]
- Mitsutake, Y.; Monde, M.J. Analytical method of two-dimensional inverse heat conduction problem using Laplace transformation: Effect of number of measurement point. Heat Transfer 2003, 125, 6. [Google Scholar]
- Mozumder, A.K.; Monde, M.; Woodfield, P.L.; Islam, M.A. Maximum heat flux in relation to quenching of a high temperature surface with liquid jet impingement. Int. J. Heat Mass Transfer 2006, 49, 2877. [Google Scholar] [CrossRef]
- Moravec, R.; Blazek, K.; Horsky, J.; Graham, J.; Fiegle, S.; Dombovic, T.; Kaurich, T. Coupling of Solidification model and Heat Transfer Coefficients to have Valuable Tool for Slab Surface Temperatures Prediction. In Proceedings of the T in METEC InSteelCon, Düsseldorf, Germany, 27 June–1 July 2011. [Google Scholar]
- Kim, J. Spray cooling heat transfer: The state of the art. Int. J. Heat Fluid Flow 2007, 28, 753–767. [Google Scholar] [CrossRef]
- Nitin, K.; Tatiana, G.R.; Peter, S.; Cam, T. A hydrodynamic model for subcooled liquid jet impingement at the Leidenfrost condition. Int. J. Therm. Sci. 2011, 50, 993–1000. [Google Scholar]
- Müller, H.; Jeschar, R. Untersuchung des Wärmeübergangs an einer simulierten Sekundärkühlzone beim Stranggießverfahren. Arch. Eisenhüttenwesen 1978, 44, 589–594. [Google Scholar] [CrossRef]
- Choi, K.J.; Yao, S.C. Mechanisms of film boiling heat transfer of normally impacting spray. Int. J. Heat Mass Transf. 1987, 30, 311–318. [Google Scholar] [CrossRef]
- Deb, S.; Yao, S.C. Analysis on film boiling heat transfer of impacting sprays. Int. J. Heat Mass Transf. 1989, 32, 2099–2112. [Google Scholar] [CrossRef]
- Fujimoto, H.; Hatta, N.; Asakawa, H.; Hashimto, T. Predictable Modelling of Heat Transfer Coefficient between Spraying Water and a Hot Surface above the Leidenfrost Temperature. ISIJ Int. 1997, 37, 492–497. [Google Scholar] [CrossRef]
- Horsky, J.; Raudensky, M.; Tseng, A.A. Heat transfer study of secondary cooling in continuous casting. In Proceedings of the AISTech 2005, Iron & Steel Technology Conference and Exposition, Charlotte, NC, USA, 9–12 May 2005. [Google Scholar]
- Hernández, B.A.; Minchaca, M.J.I.; Castillejos, E.A.H.; Acosta, G.F.A.; Xiaoxu, Z.; Thomas, B.G. Measurement of heat flux in dense air-mist cooling: Part II—The influence of mist characteristics on steady-state heat transfer. Exp. Therm. Fluid Sci. 2013, 44, 161–173. [Google Scholar] [CrossRef]
- Mario, E.H.L.; Esther, M.G.M.; Castillejos, E.A.H. Heat Transfer and Observation of Droplet-Surface Interactions During Air-Mist Cooling at CSP Secondary System Temperatures. Metall. Mater. Trans. B 2016, 47, 1409. [Google Scholar]
- Mishra, P.C.; Nayak, S.K.; Pradhan, P.; Durga, P.G. Impingement Cooling of Hot Metal Strips in Runout Table—A Review. Interfac. Phenom. Heat Transfer 2015, 3, 117–137. [Google Scholar] [CrossRef]
- Gradeck, M.; Kouachi, A.; Lebouche, M.; Volle, F.; Maillet, D.; Borean, J.L. Boiling curves in relation to quenching of a high temperature moving surface with liquid jet impingement. Int. J. Heat Mass Transf. 2009, 52, 1094. [Google Scholar] [CrossRef]
- Islam, M.A.; Monde, M.; Woodfield, P.L.; Mitsutake, Y. Jet impingement quenching phenomena for hot surfaces well above the limiting temperature for solid–liquid contact. Int. J. Heat Mass Transf. 2008, 51, 1226. [Google Scholar] [CrossRef]
- Balachandar, S.; Eaton, J.K. Turbulent dispersed multiphase flow. Annu. Rev. Fluid Mech. 2010, 42, 111–133. [Google Scholar] [CrossRef]
- Crowe, C.T.; Schwarzkopf, J.D.; Sommerfeld, M.; Tsuji, Y. Multiphase Flows with Droplets and Particles; CRC Press: Boca Raton, FL, USA, 2011. [Google Scholar]
- Elghobashi, S. Particle-laden turbulent flows: Direct simulation and closure models. Appl. Sci. Res. 1991, 48, 301–314. [Google Scholar] [CrossRef]
- Elghobashi, S. On predicting particle-laden turbulent flows. Appl. Sci. Res. 1994, 52, 309–329. [Google Scholar] [CrossRef]
- Elghobashi, S.; Truesdell, G.C. Direct simulation of particle dispersion in a decaying isotropic turbulence. J. Fluid Mech. 1992, 242, 655–700. [Google Scholar] [CrossRef]
- Maxey, M.R. The gravitational settling of aerosol particles in homogeneous turbulence and random flow fields. J. Fluid Mech. 1987, 174, 441–465. [Google Scholar] [CrossRef]
- Squires, K.D.; Eaton, J.K. Preferential concentration of particles by turbulence. Phys. Fluids A 1991, 3, 1169–1179. [Google Scholar] [CrossRef]
- Momenifar, M.; Dhariwal, R.; Bragg, A.D. Influence of Reynolds number on the motion of settling, bidisperse inertial particles in turbulence. Phys. Rev. Fluids 2019, 4, 054301. [Google Scholar] [CrossRef]
- Bec, J.; Homann, H.; Ray, S.S. Gravity-Driven Enhancement of Heavy Particle Clustering in Turbulent Flow. Phys. Rev. Lett. 2014, 112, 184501. [Google Scholar] [CrossRef]
- Ireland, P.J.; Bragg, A.D.; Collins, L.R. The effect of Reynolds number on inertial particle dynamics in isotropic turbulence. Part 2. Simulations with gravitational effects. J. Fluid Mech. 2016, 796, 659. [Google Scholar] [CrossRef]
- Dhariwal, R.; Bragg, A.D. Enhanced and suppressed multiscale dispersion of bidisperse inertial particles due to gravity. Phys. Rev. Fluids 2019, 4, 034302. [Google Scholar] [CrossRef]
- Zhou, Y.; Wexler, A.S.; Wang, L.P. Modelling turbulent collision of bidisperse inertial particles. J. Fluid Mech. 2001, 433, 77. [Google Scholar] [CrossRef]
- Chen, J.; Jin, G. Large-eddy simulation of turbulent preferential concentration and collision of bidisperse heavy particles in isotropic turbulence. Powder Technol. 2017, 314, 281. [Google Scholar] [CrossRef]
- Kruis, F.E.; Kusters, K.A. The collision rate of particles in turbulent flow. Chem. Eng. Commun. 1997, 158, 201. [Google Scholar] [CrossRef]
- Wang, L.P.; Maxey, M.R. Settling velocity and concentration distribution of heavy particles in homogeneous isotropic turbulence. J. Fluid Mech. 1993, 256, 27. [Google Scholar] [CrossRef]
- Bec, J.; Biferale, L.; Boffetta, G.; Celani, A.; Cencini, M.; Lanotte, A.S.; Musacchio, S.; Toschi, F. Acceleration statistics of heavy particles in turbulence. J. Fluid Mech. 2006, 550, 349. [Google Scholar] [CrossRef]
- Ayyalasomayajula, S.; Warhaft, Z.; Collins, L.R. Modeling inertial particle acceleration statistics in isotropic turbulence. Phys. Fluids 2008, 20, 095104. [Google Scholar] [CrossRef]
- Chang, K.; Malec, B.J.; Shaw, R.A. Turbulent pair dispersion in the presence of gravity. New J. Phys. 2015, 17, 033010. [Google Scholar] [CrossRef]
- Alam, U.; Krol, J.; Specht, E.; Schmidt, J. Enhancement and Local Regulation of Metal Quenching Using Atomized Sprays. J. ASTM Int. 2008, 5, 91–103. [Google Scholar]
- Lefebvre, A.H.; McDonell, V.G. Atomization and Sprays; CRC press: Boca Raton, FL, USA, 2017. [Google Scholar]
- Mitsutsuka, M.; Fukuda, K. Boiling phenomena and effects of water temperature on heat transfer in the process of immersion cooling. Tsetsu Hagane 1979, 65, 608–616. [Google Scholar] [CrossRef][Green Version]
- Mitsutsuka, M.; Fukuhisa, Y.; Wake, M.; Okajima, M.; Miyashita, N.; Takeda, Y. Development of Air-atomizing Mist Nozzles and Mist Cooling System for Continuous Casting. Trans. ISIJ 1985, 25, 1244–1250. [Google Scholar] [CrossRef]
- Jeschar, R.; Reiners, U.; Scholz, R. Heat Transfer During Water and Water-Air Spray Cooling in the Secondary Cooling Zone of Continuous Casting Plants. In Proceedings of the 69th Steelmaking Conference, Washington, DC, USA, 6–9 April 1986; pp. 511–521. [Google Scholar]
- Raudensky, M.; Horsky, J. Secondary cooling in continuous casting and Leidenfrost temperature effects. Ironmak. Steelmak. 2005, 32, 159–164. [Google Scholar] [CrossRef]
- Horský, J.; Raudenský, M. Measurement of heat transfer characteristics of secondary cooling in continuous casting. Metal 2005, 24–26.5. [Google Scholar]
- McGinnis, F.K.; Holman, J.P. Individual droplet heat-transfer rates for splattering on hot surfaces. Int. J. Heat Mass Transf. 1969, 12, 95–108. [Google Scholar] [CrossRef]
- Pedersen, C.O. An experimental study of the dynamic behavior and heat transfer characteristics of water droplets impinging upon a heated surface. Int. J. Heat Mass Transf. 1970, 13, 369–379. [Google Scholar] [CrossRef]
- Araki, K.; Moriyama, A. Theory on Deformation Behaviour of a Liquid Droplet Impinging onto Hot Metal Surface. Trans. ISIJ 1981, 21, 583–590. [Google Scholar] [CrossRef]
- Wachters, L.H.J.; Westerling, N.A. The heat transfers from a hot wall to impinging mist droplets in the spheroidal state. Chem. Eng. Sci. 1966, 21, 1047–1056. [Google Scholar] [CrossRef]
- Prinz, B.; Bamberger, M. Determination of heat transfer coefficient of air mist sprays. Mater. Sci. Technol. 1989, 5, 389–393. [Google Scholar] [CrossRef]
- Jenkins, M.S.; Story, S.R.; Davies, R.H. Measurement and Characterisation of Air-Mist Nozzles for Spray Quenching Heat Transfer. In Proceedings of the 19th Australasian Chemical Engineering Conference, Newcastle, UK, 18–20 September 1991; pp. 161–169. [Google Scholar]
- Puschmann, F.; Specht, E. Transient measurement of heat transfer in metal quenching with atomized sprays. Exp. Therm. Fluid Sci. 2004, 28, 607–615. [Google Scholar] [CrossRef]
- Bendig, L.; Raudensky, M.; Horsky, J. Spray parameters and heat transfer coefficients of spray nozzles for continuous casting. In Proceedings of the Seventy-Eight Steelmaking Conference, Iron and Steel Society, Nashville, TN, USA, 2–5 April 1995; pp. 391–398. [Google Scholar]
- Montes, R.J.J.; Castillejos, E.A.H.; Acosta, G.F.A.; Gutiérrez, M.E.P.; Herrera, G.M.A. Effect of the operating conditions of air-mists nozzles on the thermal evolution of continuously cast thin slabs. Can. Metall. Q. 2008, 47, 187–204. [Google Scholar]
- Castillejos, E.A.H.; Acosta, G.F.A.; Herrera, M.A.; Hernández, C.I.; Gutiérrez, M.E.P. Practical productivity gains—Towards a better understanding of air-mist cooling in thin slab continuous casting. In Proceedings of the Third International Congress of Steelmaking, Association of Iron and Steel Technology, Charlotte, NC, USA, 9–12 May 2005; pp. 881–890. [Google Scholar]
- Schmidt, J.; Boye, H. Influence of velocity and size of the droplets on the heat transfer in spray cooling. Chem. Eng. Technol. 2001, 24, 255–260. [Google Scholar] [CrossRef]
- Haibo, M.; Armin, S.; Chenn, Z. Numerical Development of Heat Transfer Coefficient Correlation for Spray Cooling in Continuous Casting. Front. Mater. 2020, 7, 577265. [Google Scholar]
- Mascarenhas, N.; Mudawar, I. Methodology for predicting spray quenching of thick-walled metal alloy tubes. Int. J. Heat Mass Transfer 2012, 55, 2953–2964. [Google Scholar] [CrossRef]
- Agnieszka, C.R.; Zbigniew, M.; Andrzej, B. The influence of selected parameters of spray cooling and thermal conductivity on heat transfer coefficient. Int. J. Therm. Sci. 2016, 110, 52–64. [Google Scholar]
- Haibo, M.; Rui, L.; Micheal, L.; Armin, S.; Chenn, Z. Numerical Investigation of Spray Cooling at Various Operation Conditions during Continuous Casting of Steel. In Proceedings of the AISTech Conference, Pittsburgh, PA, USA, 6–9 May 2019. [Google Scholar]
- Nukiyama, S.; Tansawa, Y. Experiments on the atomization of liquids in anatomized jet. Trans. Soc. Mech. Engrs. (Japan) 1939, 6, II-7, II-15. [Google Scholar]
- Zeoli, N.; Tabbara, H.; Gu, S. CFD Modeling of Primary Breakup during Metal Powder Spray. Chem. Eng. Sci. 2011, 66, 6498–6504. [Google Scholar] [CrossRef]
- Altimira, M.; Rivas, A.; Anton, R.; Sanchez, L.G.; Ramos, J.C. Fan-Spray Atomizers Analysis through Mathematical Modeling. In Proceedings of the ILASS-Europe Conferences, Mugla, Turkey, 10–13 September 2007. [Google Scholar]
- Koutsakis, K.; Gu, S.; Vardelle, A. Three Dimensional CFD Simulation of Liquid Copper Break up for the Liquid Precursor Spraying. Surf. Coat. Technol. 2011, 220, 214–218. [Google Scholar] [CrossRef]
- Kalata, W.; Brown, K.; O’Donnell, S.; Schick, R.J. Transfer Efficiency for an Oil Spray Application. In Proceedings of the 26th ILASS Americas Annual Conference on Liquid Spray and Spray Systems, Portland, OR, USA, 16–19 May 2016. [Google Scholar]
- Alkhedhair, A.; Jahn, I.; Gurgenci, H.; Guan, Z.; He, S.; Lu, Y. Numerical Simulation of Water Spray in Natural Draft Dry Cooling Towers with a New Nozzle Representation Approach. Appl. Therm. Eng. 2016, 98, 924–935. [Google Scholar] [CrossRef]
- Crowe, C.T.; Sharma, M.P.; Stock, D.E. The Particle-Source-In Cell (PSI-CELL) Model for Gas-Droplet Flows. J. Fluids Eng. 1977, 99, 325–332. [Google Scholar] [CrossRef]
- Zuckerman, N.; Lior, N. Jet impingement heat transfer: Physics, correlations, and numerical modeling. Adv. Heat Transfer 2006, 39, 565. [Google Scholar]
- Menter, F.R. Multiscale model for turbulent flows. In Proceedings of the AIAA 24th Fluid Dynamics Confernce, Orlando, FL, USA, 6–9 July 1993. [Google Scholar]
- Ishii, M. Thermo-fluid Dynamics Theory of Two-phase Flow. Eyrolles Paris 1975, 75, 29657. [Google Scholar]
- Hirt, C.W.; Nichols, B.D. Volume of fluid (VOF) method for the dynamics of free boundaries. J. Comp. Phys. 1981, 39, 201. [Google Scholar] [CrossRef]
- Kothe, D.B.; Mjolsness, R.C. RIPPLE: A new model for incompressible flows with free surfaces. AIAA J. 1992, 30, 2694. [Google Scholar] [CrossRef]
- Kothe, D.B.; Rider, W.J.; Mosso, S.J.; Brock, J.I.; Hochstein, J.S. Volume tracking of interfaces having surface tension in two and three dimensions. In Proceedings of the AIAA 34th Aerospace Sciences Meeting and Exhibit, Reno, NV, USA, 15–18 January 1996. Paper 96-0859. [Google Scholar]
- Richards, J.R.; Beris, A.N.; Lenhoff, A.M. Drop formation in liquid–liquid systems before and after jetting. Phys. Fluids 1995, 7, 2617. [Google Scholar] [CrossRef]
- Rayleigh, L. On the instability of jets. Proc. Lond. Math. Soc. 1878, 1, 4–13. [Google Scholar] [CrossRef]
- Reitz, R.D. Atomization and Other Breakup Regimes of a Liquid Jet. Ph.D. Thesis, Princeton University, Princeton, NJ, USA, 1978. [Google Scholar]
- Reitz, R.D. Modeling atomization processes in high-pressure vaporizing sprays. At. Spray Technol. 1987, 3, 309–337. [Google Scholar]
- Nijdam, J.J.; Guo, B.; Fletcher, D.F.; Langrish, T.A. Lagrangian and Eulerian models for simulating turbulent dispersion and coalescence of droplets within a spray. Appl. Math. Model. 2006, 30, 1196–1211. [Google Scholar] [CrossRef]
- Fung, M.C.; Inthavong, K.; Yang, W.; Tu, J. CFD modeling of spray atomization for a nasal spray device. Aerosol. Sci. Technol. 2012, 46, 1219–1226. [Google Scholar] [CrossRef]
- Eroglu, H.; Chigier, N.; Farago, Z. Coaxial atomizer liquid intact lengths. Phys. Fluids A 1991, 3, 303–308. [Google Scholar] [CrossRef]
- Leroux, B.; Delabroy, O.; Lacas, F. Experimental study of coaxial atomizers scaling. Part I: Dense core zone. At. Sprays 2007, 17, 381–407. [Google Scholar] [CrossRef]
- Zhao, H.; Liu, H.F.; Tian, X.S. Influence of atomizer exit area ratio on the breakup morphology of coaxial air and round water jets. AIChE J. 2014, 60, 2335–2345. [Google Scholar] [CrossRef]
- Engelbert, C.; Hardalupas, Y.; Whitelaw, J.H. Breakup phenomena in coaxial airblast atomizers. Proc. R. Soc. Lond. A 1995, 451, 189–229. [Google Scholar]
- Kumar, A.; Sahu, S. Liquid jet breakup unsteadiness in a coaxial air-blast atomizer. Int. J. Spray Combust. Dyn. 2018, 10, 211–230. [Google Scholar] [CrossRef]
- O’Rourke, P.J.; Bracco, F.V. Modeling of Drop Interactions in Thick Sprays and Comparison with Experiments. Instit. Mech. Eng. 1980, 404, 80. [Google Scholar]
- Liu, A.B.; Mather, D.; Reitz, R.D. Modeling the Effects of Drop Drag and Breakup on Fuel Sprays. SAE Int. J. Eng. 1993, 102, 83–95. [Google Scholar]
- Ranz, W.E.; Marshall, W.R. Evaporation from Drops. Chem. Eng. Progress 1952, 48, 141–146. [Google Scholar]
- Naber, J.D.; Reitz, R.D. Modeling Engine Spray/Wall Impingement. SAE Int. J. Eng. 1988, 97, 118–140. [Google Scholar]
- Bernardin, J.D.; Mudawar, I. The Leidenfrost point: Experimental study and assessment of existing models. J. Heat Trans. 1999, 121, 894–903. [Google Scholar] [CrossRef]
- Miller, R.S.; Harstad, K.; Bellan, J. Evaluation of Equilibrium and Non-Equilibrium Evaporation Models for Many Droplet Gas-Liquid Flow Simulations. Int. J. Multiphase Flow 1998, 24, 1025–1055. [Google Scholar] [CrossRef]
- Sazhin, S.S. Advanced Models of Fuel Droplet Heating and Evaporation. Progress Energy Combust. Sci. 2006, 32, 162–214. [Google Scholar] [CrossRef]
- Brackbill, J.U.; Kothe, D.B.; Zemach, C. A continuum method for modeling surface tension. J. Comput. Phys. 1992, 100, 335–354. [Google Scholar] [CrossRef]
- Menter, F.R.; Kuntz, M.; Langtry, R. Ten years of experience with the SST turbulence model. Turbul. Heat Mass Transf. 2003, 4, 625–632. [Google Scholar]
- Patankar, S.V.; Spalding, D.B. A calculation procedure for heat, mass and momentum transfer in three-dimensional parabolic flows. Int. J. Heat Mass Transf. 1972, 15, 1787. [Google Scholar] [CrossRef]
- Jadidi, M. Introduction to Multiphase Flows-Part#2 Fundamental Definitions & Choosing a Multiphase Model. Available online: https://www.researchgate.net/publication/312228367_Introduction_to_Multiphase_Flows-Part_2_Fundamental_Definitions_Choosing_a_Multiphase_Model (accessed on 4 June 2021).
- Reitz, R.D.; Diwakar, R. Structure of high-pressure fuel sprays. SAE Paper 1987, 492–509. [Google Scholar]
- Spray Analysis and Research Services. Spray Characterization of Nozzles Used in Casting Application. Laboratory Test Report. April 2016. Available online: https://www.sprayanalysis.com/ (accessed on 1 November 2021).
- Xiaoyi, L.; Marco, A.; Marcos, S.; Mark, S. Towards an efficient, high-fidelity methodology for liquid jet atomization computations. In Proceedings of the 48th Aerospace Sciences Meeting, Orlando, FL, USA, 4–7 January 2010. [Google Scholar]
- Leong, M.Y.; Hautman, D.J. Near-field spray characterization of a liquid fuel jet injected into a crossflow. In Proceedings of the ILASS Americas, 15th Annual Conference on Liquid Atomization and Spray Systems, Madison, WI, USA, 14–17 May 2002. [Google Scholar]
- Minchacha, M.J.I.; Castillejos, E.A.H.; Acosta, G.F.A. Size and velocity characteristics of droplets generated by thin steel slab continuous casting secondary cooling air-mist nozzles. Metall. Mater. Trans. B 2011, 42, 500–515. [Google Scholar] [CrossRef]
- Yao, S.C.; Cox, T.L. Investigation into the Use of Large-Drop Sprays for Hot Strip Rolling Mills. In Proceedings of the Mechanical Working and Steel Processing Conference, Pittsburgh, PA, USA, 25–28 October 1998; pp. 359–366. [Google Scholar]


| Air pressure (psi) | 30, 40, 45 |
| Water flow rate (gpm) | 2, 2.5, 3.7,4.5, 6.5 |
| Casting speed (inch/min) | 40,45, 46,49,50,60 |
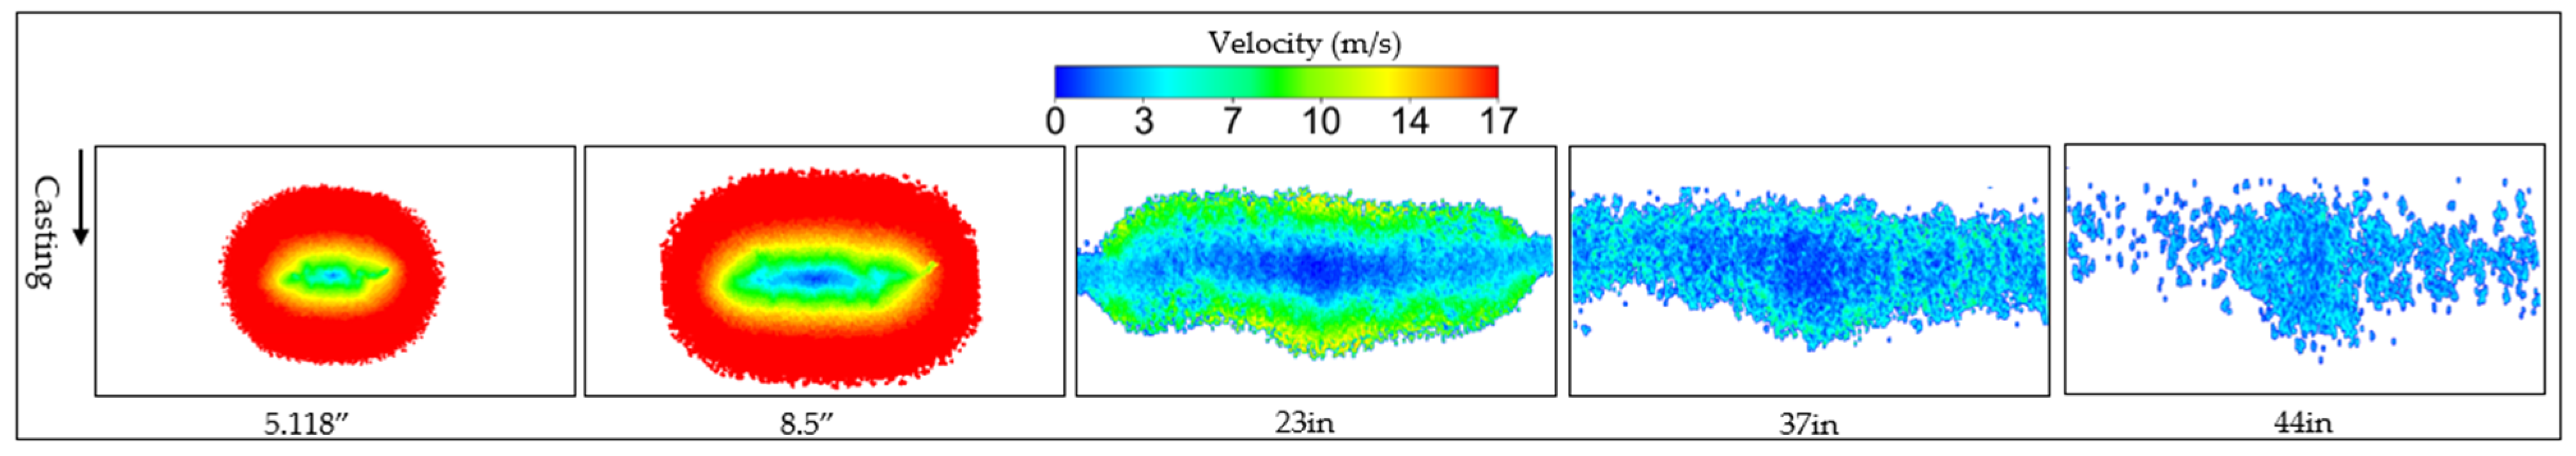
| Standoff distance (inches) | 5.118, 6.7, 6.89, 8.5, 12, 23, 37, 44 |
| Air Pressure (psi) | Water Flow Rate (gpm) | Ave. Weber Number | Ave. Reynolds Number | Breakup Length (mm) |
|---|---|---|---|---|
| 30 | 2 | 76.079 | 1083.681 | 14.565 |
| 30 | 2.5 | 50.381 | 803.261 | 14.845 |
| 30 | 3.7 | 41.295 | 556.486 | 15.412 |
| 40 | 2 | 116.523 | 1372.402 | 13.866 |
| 40 | 2.5 | 73.316 | 828.161 | 13.013 |
| 40 | 3.7 | 50.725 | 782.182 | 13.399 |
| 45 | 2 | 139.986 | 1494.343 | 14.316 |
| Є (m2/s3) | η (m) | St. | Re | |||||
|---|---|---|---|---|---|---|---|---|
| 30 psi | 40 psi | 30 psi | 40 psi | 30 psi | 40 psi | 30 psi | 40 psi | |
| On slab | 643 | 761 | 4.69 × 10⁻⁵ | 4.50 × 10⁻⁵ | 8700 | 7205 | 5850 | 7082 |
| 10 mm above slab | 59 | 56 | 8.64 × 10⁻⁵ | 8.61 × 10⁻⁵ | 444 | 482 | 1309 | 2189 |
| 30 mm above slab | 42 | 16 | 9.42 × 10⁻⁵ | 1.17 × 10⁻⁴ | 578 | 360 | 1655 | 1413 |
| Droplets Properties | Unit | 30 psi Air | 40 psi Air |
|---|---|---|---|
| Droplets coverage area | m2 | 0.0623 | 0.0867 |
| Droplets weber number | - | 1522 | 1660 |
| Sauter mean diameter | µm | 439 | 381 |
| Droplets concentration | Kg/m3 | 0.9854 | 0.4278 |
| Droplets volume fraction | - | 9.87 × 10⁻⁴ | 4.29 × 10⁻⁴ |
| Droplets Number density | Number/m3 | 4.85 × 10⁷ | 2.29 × 10⁷ |
Publisher’s Note: MDPI stays neutral with regard to jurisdictional claims in published maps and institutional affiliations. |
© 2021 by the authors. Licensee MDPI, Basel, Switzerland. This article is an open access article distributed under the terms and conditions of the Creative Commons Attribution (CC BY) license (https://creativecommons.org/licenses/by/4.0/).
Share and Cite
Anisiuba, V.; Ma, H.; Silaen, A.; Zhou, C. Computational Studies of Air-Mist Spray Cooling in Continuous Casting. Energies 2021, 14, 7339. https://doi.org/10.3390/en14217339
Anisiuba V, Ma H, Silaen A, Zhou C. Computational Studies of Air-Mist Spray Cooling in Continuous Casting. Energies. 2021; 14(21):7339. https://doi.org/10.3390/en14217339
Chicago/Turabian StyleAnisiuba, Vitalis, Haibo Ma, Armin Silaen, and Chenn Zhou. 2021. "Computational Studies of Air-Mist Spray Cooling in Continuous Casting" Energies 14, no. 21: 7339. https://doi.org/10.3390/en14217339
APA StyleAnisiuba, V., Ma, H., Silaen, A., & Zhou, C. (2021). Computational Studies of Air-Mist Spray Cooling in Continuous Casting. Energies, 14(21), 7339. https://doi.org/10.3390/en14217339