Abstract
The rapid growth of the Information and Communications Technology (ICT) sector requires additional infrastructure, such as more micro-datacenters and telecom stations, to support the higher internet speeds and low latency requirements of 5G networks. The increased power requirements of the new ICT technologies necessitate the proposal of new power supplies, in an attempt to support the increase in energy demand and running costs. This work provides an in-depth theoretical analysis on the losses of the individual stages of commercially available PSU and proposes a new multicell PSU, the buck PFC converter, which offers a higher overall efficiency at varying load levels. The theoretical results are verified using simulation results, via a PSIM Thermal Module, and using experimental data. The results indicate that multicell structures can improve the overall PSU efficiency by 1.2% at 50% rated power and more than 2.1% at full power. Finally, taking into consideration the economic implications of this study, it is shown that the proposed multicell structure may increase the PSU costs by 10.78%, but the payback period is in the order of just 3.3 years.
1. Introduction
The 5G network requirements for the Information and Communication Technology (ICT) sector has caused a continuous demand for growth in micro-datacenter and Telecommunication Stations (TS) [1,2]. Datacenters accommodate the ICT data storage and processing equipment such as servers, hubs, hard discs, and ICT racks, etc. A micro-datacenter (μDC) is a datacenter of size smaller or equal to one rack. The growth of datacenters and micro-datacenters is huge nowadays and they have a great impact on global electricity consumption. In 2016, more than 1.8% of the global electrical energy was consumed by datacenters and this will keep increasing [3]. The higher speeds of radio frequency bands (such as 4G and 5G) tend to have a shorter area coverage and as a result more TS are needed. Furthermore, 5G networks have increased energy requirements compared to previous generations, and therefore several researchers have concentrated on improving the energy efficiency of communication links [4,5,6]. The increased number of TS and μDC will unavoidably lead to an increased energy consumption.
The impact of the power supply system to the overall energy efficiency of datacenters and TS has pushed several energy agencies to develop strict efficiency requirements, such as Energy Star and EPRI [7,8]. In the last two decades, the telecommunications industry has adopted equipment supplied by 48 V DC. In the Information Technology (IT) and Datacenter industries though, the preferred voltage system over the last few decades was 230 V AC, using though integral secondary power supplies for converting the AC 230 V to 12 V DC. With the IT and Telecom industry convergence of the last few years, both AC 230 V and DC 48 V systems were used, causing a debate as to which system would dominate the market. Over the last few years, Facebook initiated the “open compute project” (and other organizations have joined, such as Google and Microsoft), for promoting the 48 V DC distribution topology for the IT industry, because of its improved performance [9,10].
Multicell structures have been utilized in the last two decades for several applications, but the main objectives were the improvement of the voltage gain in the input or the output of a circuit and the component stress decrease. There are four different topologies of multicell structures which are:
- Input in Series Output in Series (ISOS);
- Input in Series Output in Parallel (ISOP);
- Input in Parallel Output in Series (IPOS);
- Input in Parallel Output in Parallel (IPOP).
Aiming for higher efficiency, Kasper et al. [11] suggested a 6-cell converter system, which showed the highest efficiency conversion above 1 kW, however, the suggested converter [11] has great efficiency only in specific loading conditions. Furthermore, the 6-Cell ISOP converter creates additional complexity to the system and reduced reliability, since failure of one of the cells could lead to overall system failure, especially as cells are connected in series at the input. Multicell structures have been used in various studies but not primarily for energy efficiency improvement. Arezki Fekik et al. [12] proposes a three-cell DC to DC structure for Off-Grid PV systems for improved robustness using an ISOS structure but the study does not include an experimental verification and although simulation results are promising in terms of the maximum power point tracking (MPPT) function, the efficiency is not validated. Furthermore, the reliability of the three-cell DC to DC structure is reduced since failure of one of the three cells leads to overall system failure. ISOS structures in both AC to DC and DC to DC conversion stages do not significantly improve the efficiency and have much more complicated load sharing control [13,14]. The IPOS structure which is proposed in [15] in order to improve efficiency and output voltage, reduces the overall system efficiency (maximum efficiency of 91%) and increases the complexity of the system.
The paper analyzes and compares multicell topology structures (ISOS, IPOS IPOP or ISOP) and the way that these can lead to energy efficiency improvements by investigating each stage of conversion (rectification, power factor correction and DC to DC stage through LLC and PSFB converters). The work verifies through simulations and experimental measurements that IPOP structures can lead to an improved energy efficiency conversion and proposes a new multicell buck PFC structure to increase the energy conversion efficiency. Furthermore, the work presents a technoeconomic evaluation of multicell structures compared to single structure power supply units.
The Introduction Section of the work is followed by Section 2, which presents the structure of AC/DC 48 V power supplies. The section identifies and analyzes the three individual conversion stages and specifies single-stage and two-stage conversion alternative topologies. In Section 3, the multicell structure topologies are introduced and analyzed. This analysis is subsequently followed by Section 4, the experimental setup and verification. The proposed multicell buck PFC converter is presented in Section 5 and a technoeconomic analysis follows in Section 6. The last section of the paper, Section 7, is the conclusion.
2. Structure of AC to DC 48 V Power Supplies
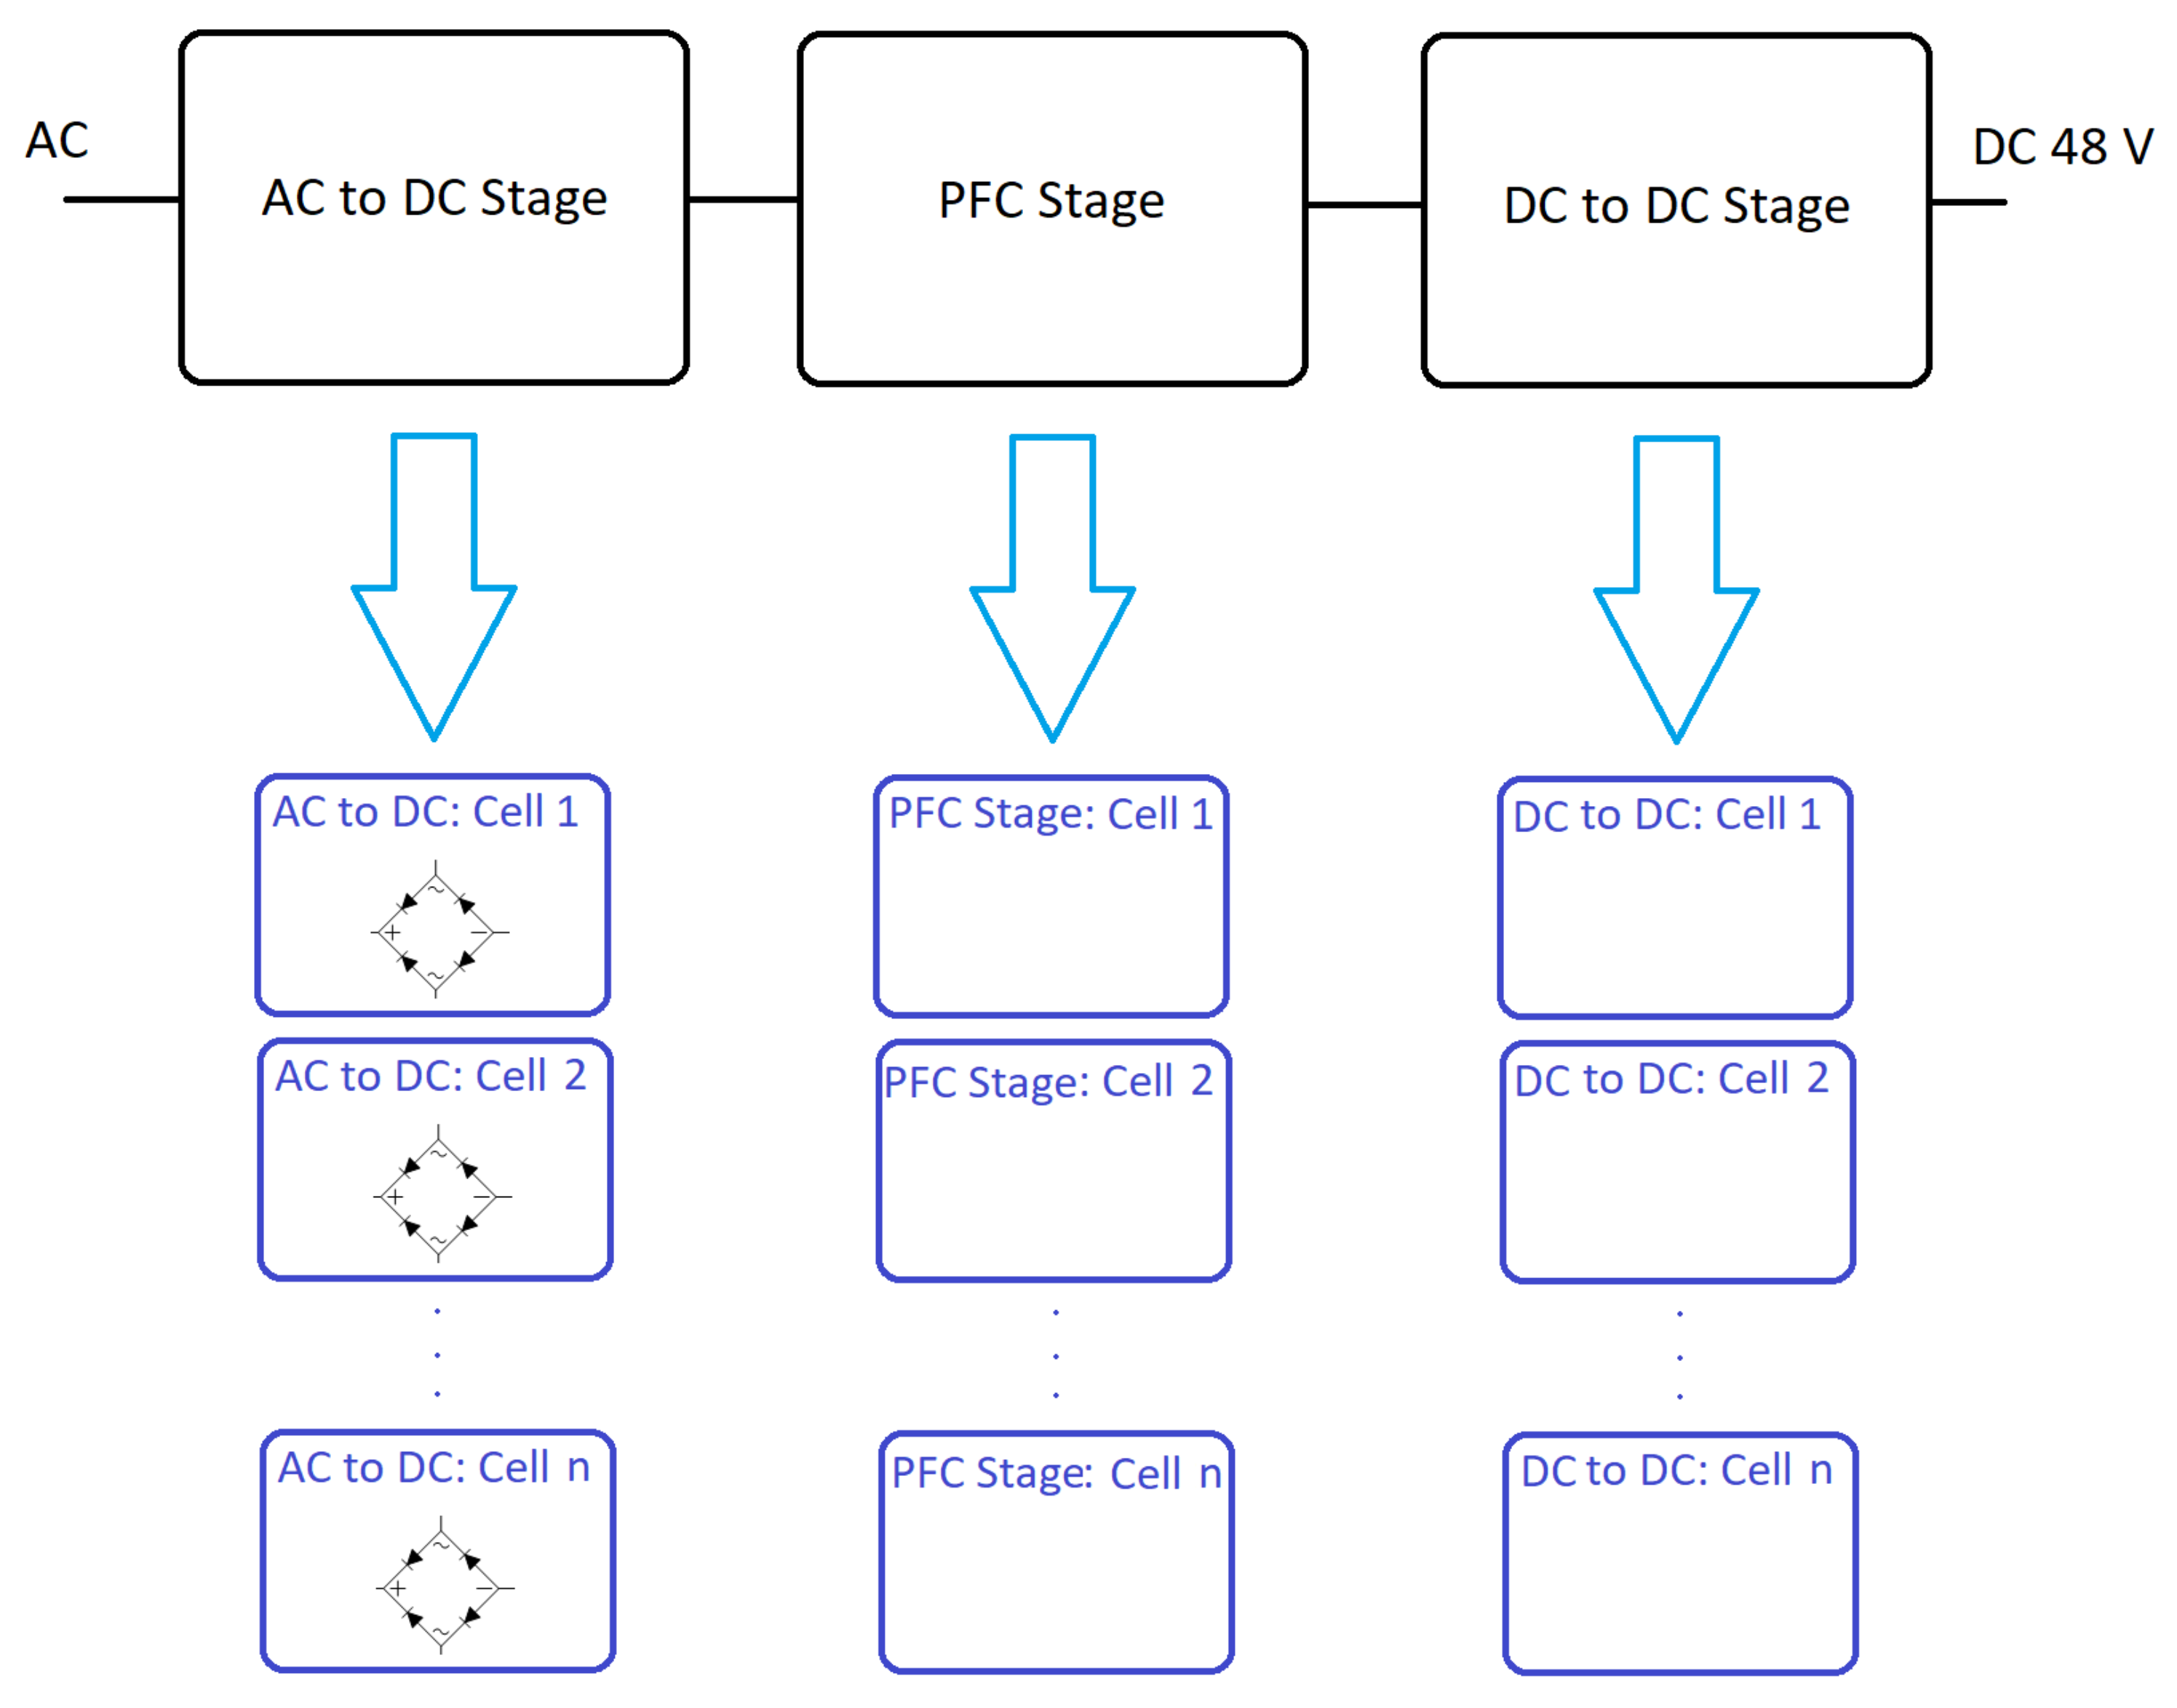
Power supply (PS) systems tend to have low efficiency under low loading conditions. It is for this reason that modular PS systems are commonly used within TS and datacenters to overcome the problem of oversized PS systems. A DC PS system may be composed of a number of power supply units (PSU), frequently called “modules”, that work in parallel to feed a DC bus, creating in this way a scalable PS system. A PSU consists of three main stages: (a) The AC to DC rectification, (b) the power factor correction (PFC) stage, and (c) the DC to DC stage to step-down the voltage to the desired 48 V DC, Figure 1. A μDC should have a capacity of up to 20 kW and thus a modular μDC should have PSU modules of less than 10 kW (at least 2 modules) Pmodule ≤ (Prack-max/2). The rectifier stage of the PSU consists of a bridge rectifier with switches (MOSFETs, IGBT, Thyristors, etc.) or diodes. The power factor correction system is used to ensure conformity with EN61000 and that there are no excessive harmonics in the AC supply from the UPS system. The third stage of a PSU is needed to step-down the voltage from the rectification stage to the desired 48 V DC. The rectification is common in all systems but there are two options used to produce the desired 48 V DC and to satisfy the input power quality requirements. The first option is to use a two-stage process with boost PFC and DC to DC step-down converter. The second option is to use the buck PFC single-stage circuit solution (PFC and DC to DC step-down circuits combined). In a single-stage conversion circuit it is very difficult to control both the input current quality and the output voltage level at different loads, and at the same time achieve high conversion efficiency. The two-stage conversion is therefore preferred as a solution for loads above 1 kW [16,17,18].
where:
- Prec: power losses from the rectification stage;
- Ppfc−loss: losses of the power factor correction stage;
- Pdc−dc loss: losses of the DC-DC converter circuit;
- Psw loss: MOSFET switch losses of the DC converter circuit (conduction and switching losses);
- Ptrans−loss: transformer losses;
- Pind loss: inductor losses;
- Pcap−loss: capacitor losses in DC-DC converter circuit;
- Ptr−con−loss: transformer load and frequency dependent losses;
- Pno load loss: transformer no load loss.
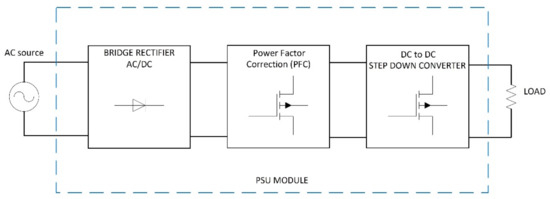
Figure 1.
Block diagram of PSU.
Figure 1.
Block diagram of PSU.
2.1. Single-Stage PSU
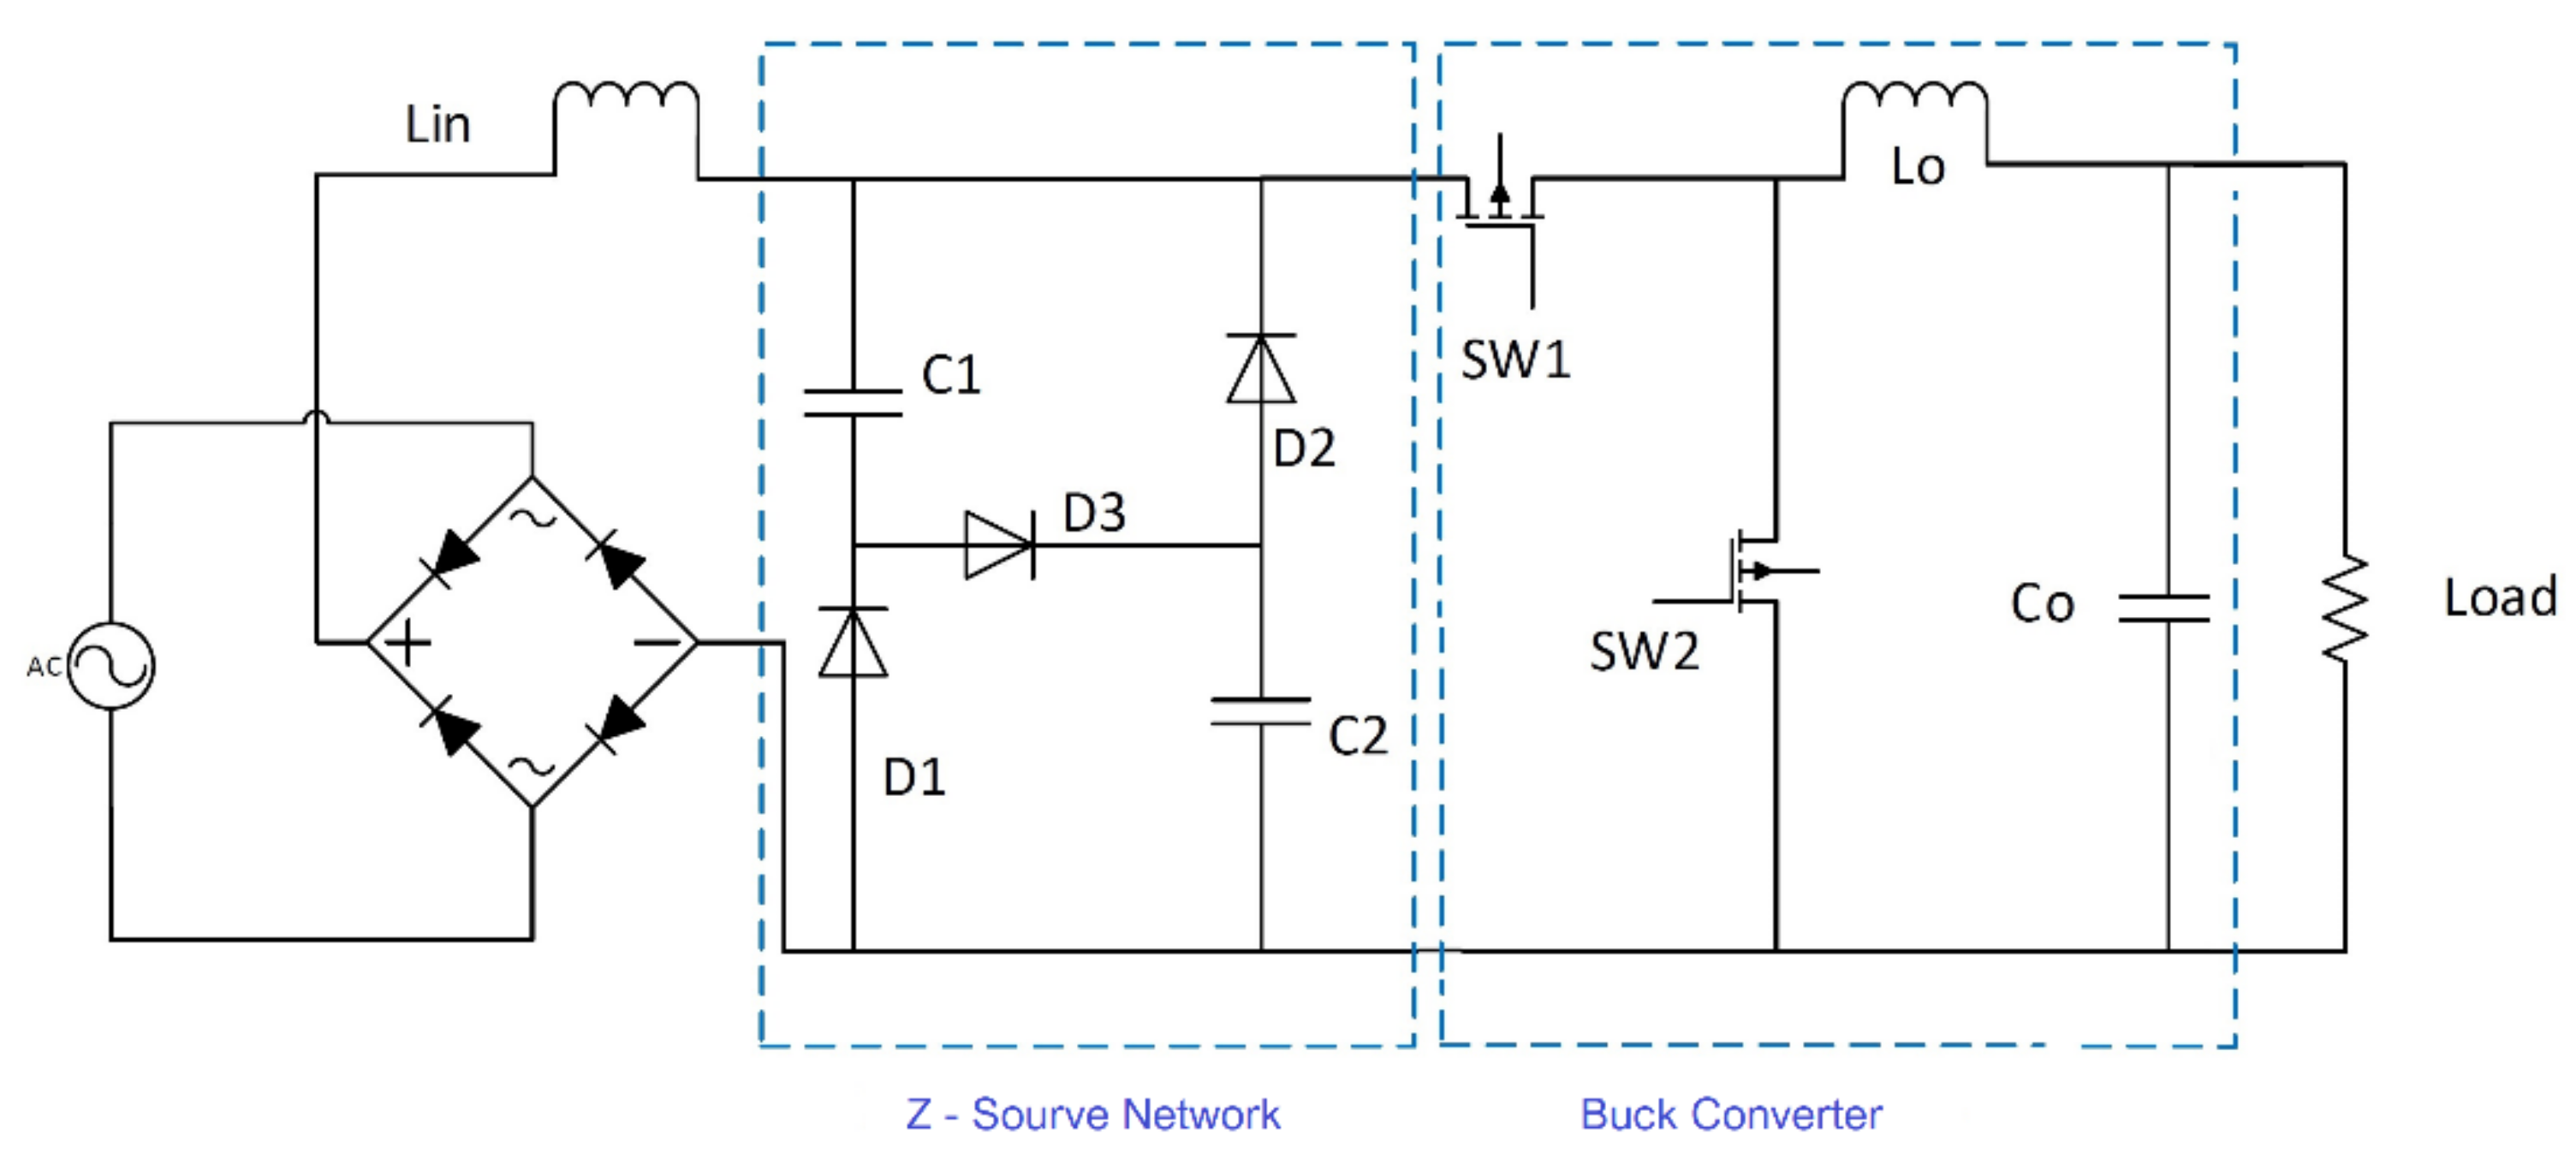
The single-stage PSU is a buck PFC system with a bridge rectifier. Buck PFCs are used in low power applications since their structure creates dead angles at the input current waveform. Dead angles are generated from the switching of the input rectified waveform. Boost PFC circuits have the switching device in the output of the circuit and thus have higher THD, and are therefore preferred for high power applications [16,17]. On the contrary, since buck PFCs are only single-stage conversion systems, they present higher efficiency than boost converters at low power applications. Is not easy to remove dead angles in buck PFCs. Several re-searchers aimed to minimize their impact such as Saeed Sharifi et al. [19], who introduced a new buck PFC circuit with a Z-source network that smooths out the switching effect on the input power quality, Figure 2 The Z-Source circuit was initially proposed by B. Axelrod et al. [20] with its main target to increase the voltage gain in buck converters. Fortunately, the new circuit introduces a new input inductor that not only increases the gain but also minimizes the stress on the switch and smooths out the input current dead zones.
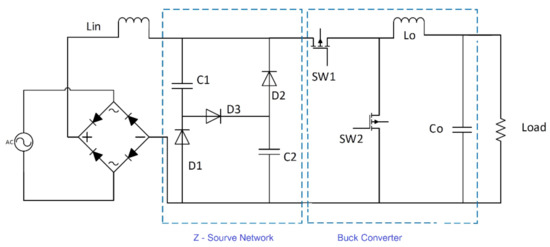
Figure 2.
The Z source buck PFC.
2.2. Two-Stage PSU Solution
The two-stage solution includes the AC to DC boost PFC which converts the AC input voltage to 380–400 V DC and maintains input power quality, and a DC to DC step-down converter to step-down the voltage to the desired level. Due to imperfect switching (especially for high power applications), high switching losses occur in the converters. To step-down the voltage from 380–400 V to 48 V DC as previously described, a DC to DC step-down converter is needed. Since high energy efficiency and power density is required for such converter systems, the most commonly used low power (under 1 kW) converter circuit is the LLC half- or full-bridge converter [21,22,23]. These converters are resonant converters that adopt zero-voltage switching (ZVS) techniques in order to minimize switching losses, something that improves the efficiency of conversion. LLC half- or full-bridge converters, however, incorporate transformers in their structure, which creates no-load losses and therefore has low efficiency on low loads.
3. Multicell Structures
A multicell structure is a structure made of multiple converter systems (cells) which are put together and work in parallel or in series to form a new, larger converter system, as shown in Figure 3.
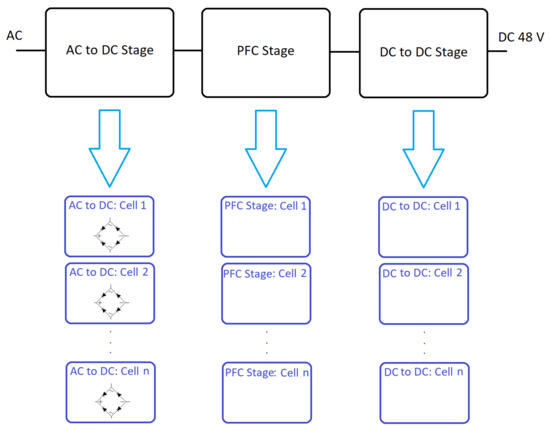
Figure 3.
Block diagram of a multicell structure.
This work aims to prove that combining multiple converters (multicells) in series or in parallel can lead to overall energy efficiency improvements. Since conversion from AC 230 to DC 48 V includes more than one conversion step, multicell efficiency improvements need to be analyzed per stage (AC to DC, PFC stage and DC to DC step-down stage).
3.1. The Multicell AC to DC Rectification Stage
A multicell rectification can be constructed either with diodes or switches (MOSFETs or IGBTs, etc.), as previously mentioned. A strategy to minimize the losses in the rectification stage is to use parallel diode bridge rectifier systems [24]. Considering that each bridge circuit is a cell using multiple bridges, a multicell structure is formed. According to [24], parallel diode bridge rectifiers lead to lower losses because diodes with lower maximum current carrying capacity have less forward voltage drop, although this stands only for specific applications. The power losses are mainly generated as a result of the conduction and the switching of the diodes or the switches. Due to the low switching frequency (50 Hz or 60 Hz), the switching losses are almost negligible and the resultant losses of each of the two bridge rectifier legs arise mainly due to conduction. The use of IGBT switches would not benefit such systems since IGBT losses are similar and higher than diodes for similar power applications. GaN MOSFETs tend to have lower switching losses than silicon MOSFETs despite their higher conduction resistance (on-resistance RDS−On). For the diode case, the conduction losses are given by:
where Vd is the diode voltage drop and Irms is the average current passing through the bridge leg. For the MOSFET switch case, conduction losses are given by:
where RDS−On is the on-resistance of the MOSFET switch.
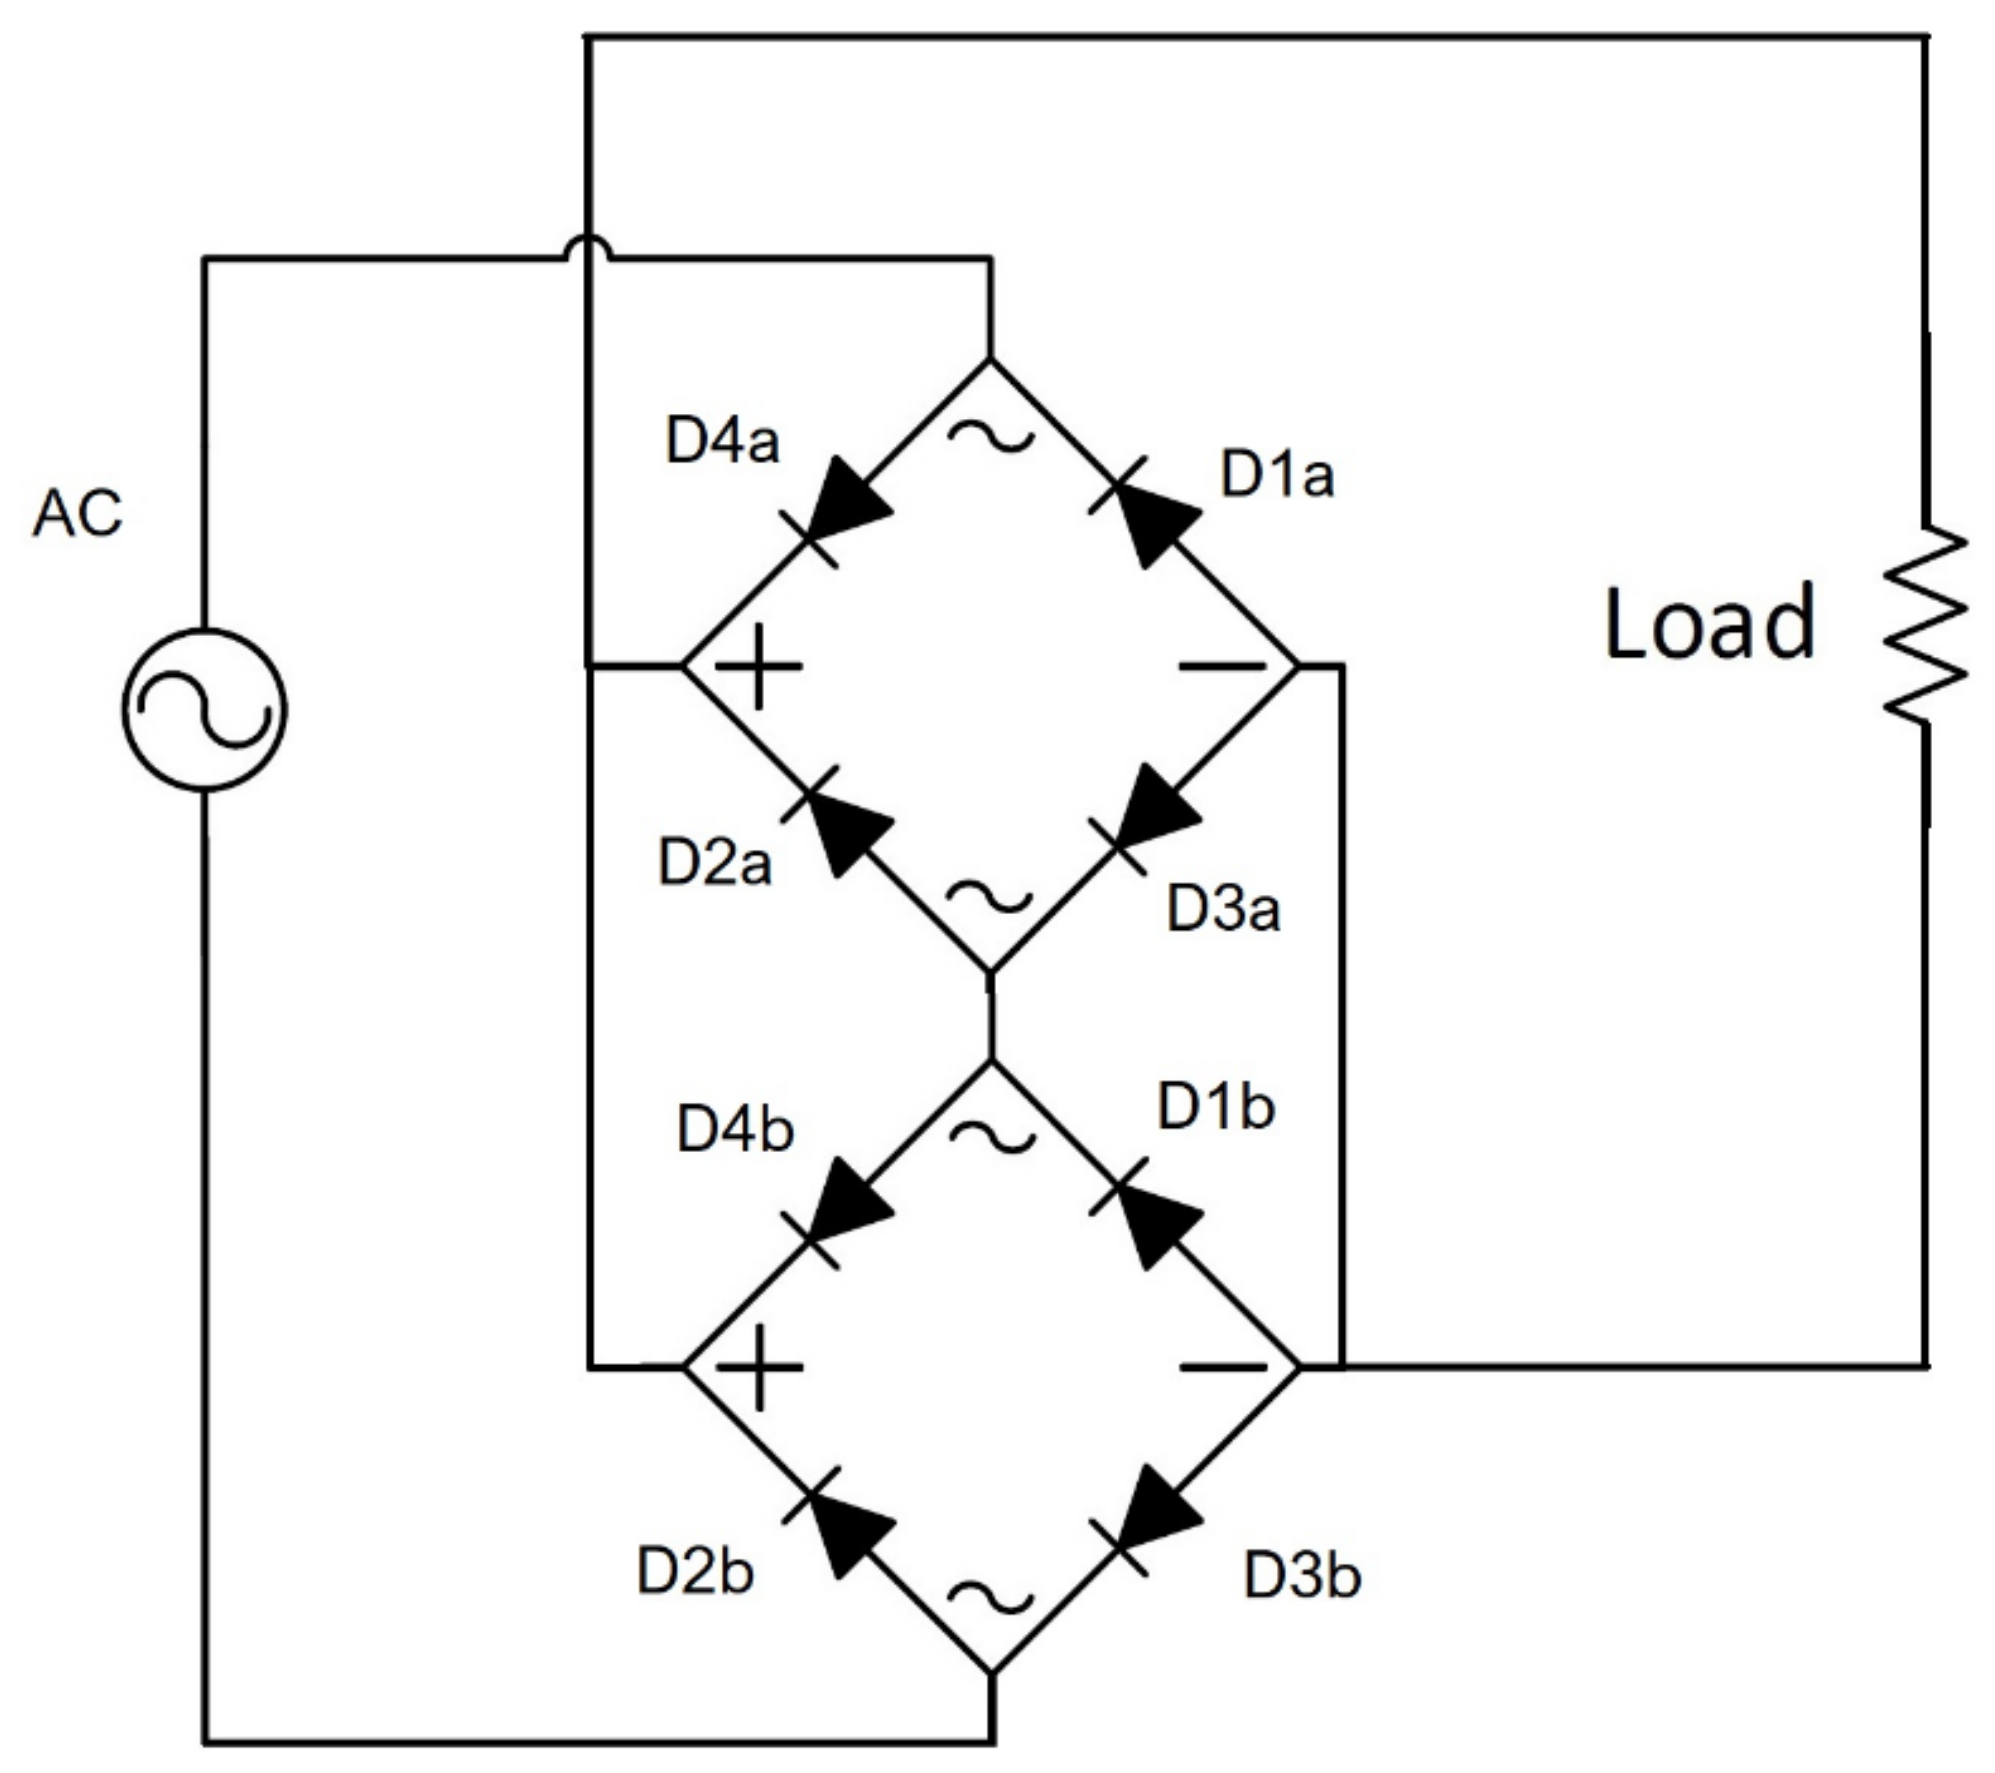
Connecting bridge rectifier cells in ISOS or IPOS would imply that the output voltage is a multiple of 325 V (Vpeak of AC input). This would require a very high gain to reduce it to 48 V and there would thus be higher power losses in the secondary circuits to step down the voltage. Additionally, a high voltage at the output of the bridge rectification stage would need switches that could withstand a higher voltage. Since RDS−On is proportional to the voltage, this would result in higher power losses. Therefore, the multicell bridge would not have better efficiency if connected in ISOS or IPOS. The ISOP structure with MOSFET switches would not improve the efficiency either, since the series switches would increase the conduction losses. Considering however that the breaking voltage is proportional to RDS−On, switches that can withstand a lower voltage would have lower conduction losses. Replacing, therefore, one MOSFET switch with two switches of smaller RDS−On, could in theory result in better efficiency. Examining however the characteristics of available MOSFET switches, those with breaking voltage of 50 V have an RDS−On as low as 3.3 mΩ (IFR3805), while switches with a breaking voltage of 200 V have an RDS−On as low as 4 mΩ (IXFK300N20X 3). Therefore, energy efficiency improvement could not be achieved with ISOP and MOSFETs for this type of power supply. Analyzing the circuit further, it can be seen that the ISOP structure of the bridge rectification part would not provide any energy efficiency improvement with diodes either, since in each cycle of the AC source only two switches/diodes conduct, as seen in Figure 4, as in the single cell structure, namely D1a and D2b in the positive cycle and D3b and D4a in the negative cycle. In the IPOP structure with diodes, the voltage drop increases as the number of cells increases. Efficiency is therefore slightly improved as a result of lower heat dissipation. For the case of the IPOP structure with MOSFETs, the voltage stress on the switches remains the same and the current passing through the system is divided in the parallel cell bridges, something that may lead to significant energy efficiency improvements.

Figure 4.
Multicell bridge ISOP circuit.
For instance, in a two-cell rectifier bridge system, the current in the two legs is halved (assuming MOSFETs with the same RDS−On) and since 2 (I/2)2 < I2, it can be easily proven that parallel bridge structures lead to overall energy savings. For N cells, it can be shown that:
3.2. The Multicell PFC Stage
There are different PFC structures. For single-stage converters, buck PFC can be used. For dual-stage converters, the boost PFC is widely used as well as some modified boost PFC circuits. All PFC circuits always follow the AC to DC rectification, or are incorporated into it.
3.2.1. Multicell Buck PFC
As discussed in the previous sections, to improve the power factor of the buck PFC circuits, the Z-source buck PFC circuit is proposed in [14] by adding a Z-source network in front of the buck converter. As seen in Figure 2, the circuit has two switches, SW1 and SW2. The losses arising in such a circuit are mainly as a result of conduction and switching, as well as due to the inductor at the input. Conduction losses are given by Equation (8) and the switching losses are given by Equation (9).
where fsw is the switching frequency, tr is the rising time the transistor needs to switch on and tf is the falling time needed to switch off.
In a multicell parallel input configuration such as IPOP and IPOS, the input peak voltage would be 325 V DC (with ripple). For parallel cell circuits, the current in each of the parallel circuits would be split equally and the conduction losses would therefore decrease. The switching losses on the other hand cannot decrease. Considering the use of switches with a lower drain current, faster response, and thus lower tr and tf, they could potentially lead to better efficiency. However, using switches with lower tr and tf and at the same lower maximum drain current capability may negatively affect the RDS−On (i.e., conduction losses).
Connecting the multiple cells in series would require higher gain at the output. As a result, bigger inductor and capacitor at the output would be required, which would lead to higher losses, especially on low loads. Therefore, the IPOP is the only parallel input configuration that should be examined. In a parallel configuration, the inductor winding losses are also less since the current passing through them is divided by the number of cells and, despite the fact that core losses of inductors can increase, they are negligible compared to winding losses. The inductor size in the split cells would not be affected, since the output and input voltages as well as the switching frequency remain the same. The equation for calculating the inductor size is given by:
where ΔIL is the ripple current and is proportional to the output current of each cell.
Connecting multiple buck PFC cells in series at the input (ISOP or ISOS) causes higher overall RDS−On resistance during the ON state. The switching losses, on the other hand, are multiplied by the number of cells but the voltage input is divided by the number of cells (assuming the case of exactly the same RDS−On). The rising and falling times of the switches in the multicell ISOP and ISOS structures can be minimized since switches with lower voltage breaking capacity tend to have lower falling and rising times. Silicon MOSFETs can have RDS−On as low as 3.5 mΩ, with rising and falling times of about 170 nS (IXFN300N20X3), while GaN MOSFETs can have 12.4 ns rising and 24 ns falling time with RDS−On of 25mΩ (GS66516). On the other hand, inductor losses increase if the inductor size is not reduced from the single cell design. Since voltage gain is reduced in the ISOP and ISOS structures, the inductor size can also be significantly reduced. Therefore, ISOP or ISOS structures lead to reduced inductor losses but with insignificant switching loss improvement. The overall improvements are minor in relation to the complexity and increase in cost.
3.2.2. Multicell Boost PFC
The losses in the boost PFC circuit (as in the buck PFC) are mainly due to switching and conduction loss of the MOSFETs, the input inductor and the output capacitor. However, because of the higher voltage stress applied on the switches of the boost PFC compared with that applied on the buck PFC, higher conduction losses occur. An ISOS and ISOP structured boost PFC would lead to increased losses in MOSFET devices since they would be connected in series, even if lower RDS−On MOSFET switches are used. Since the inductors are in series in ISOP and ISOS structures, the overall DC resistance and hence inductor losses will increase. Considering the inductor size needed to form a multicell ISOP or ISOS structure compared to a single cell, it can be concluded that the ISOP case would lead to reduced losses compared to ISOS, but both cases would not lead to a significant reduction in the inductor’s overall size and power losses (6), (7) and (8). The single cell boost PFC inductor value is given by [24]:
In a multicell ISOP boost PFC, the inductor value per cell is calculated by:
In a multicell ISOS boost PFC, the inductor value per cell is:
For IPOS and IPOP structures as in the buck PFC case, the current is split between cells and, as previously mentioned, reduces both inductor and MOSFET losses.
3.3. The Multicell DC to DC Voltage Step-Down in Two-Stage Conversions
The PSUs used in the ICT industry are converting AC 230 V to DC 48 V, and therefore high gain DC to DC step-down conversion stage is needed. The most common type of circuit for high efficiency DC to DC step-down conversion is the resonant converter such as LLC [21,22] and phase shift full bridge converters (PSFB). The presence of the transformer in these circuits provides magnetic isolation to the connected load. The losses for these types of converter circuits are again down to the switches, the inductors, the capacitors and the transformers. These circuits use zero-voltage switching (ZVS) techniques to minimize the switching losses. However, these techniques do not influence the conduction losses. The losses because of the inductors and the transformers are a result of the core and I2 R of windings. The core losses are given by:
where Ke and Kh are the eddy and hysteresis loss constants, Peddy is the eddy current power loss (W), B is the flux density (Wb/m2), f is the frequency of magnetic reversals per second (Hz), t is the core material thickness (m), V is the volume of core (m3) and n is the Steinmetz exponent (ranging from 1.5 to 2.5 depending on the material).
Core losses are not proportional to the current passing through the coils. In inductors, the core losses are proven to be negligible compared to winding losses. In transformers, however, the larger the core size, the higher the core losses, even without any load. Paralleling transformers would reduce winding losses but would increase core losses and the overall losses would therefore also increase.
4. Experimental Verification of Multicell Structures
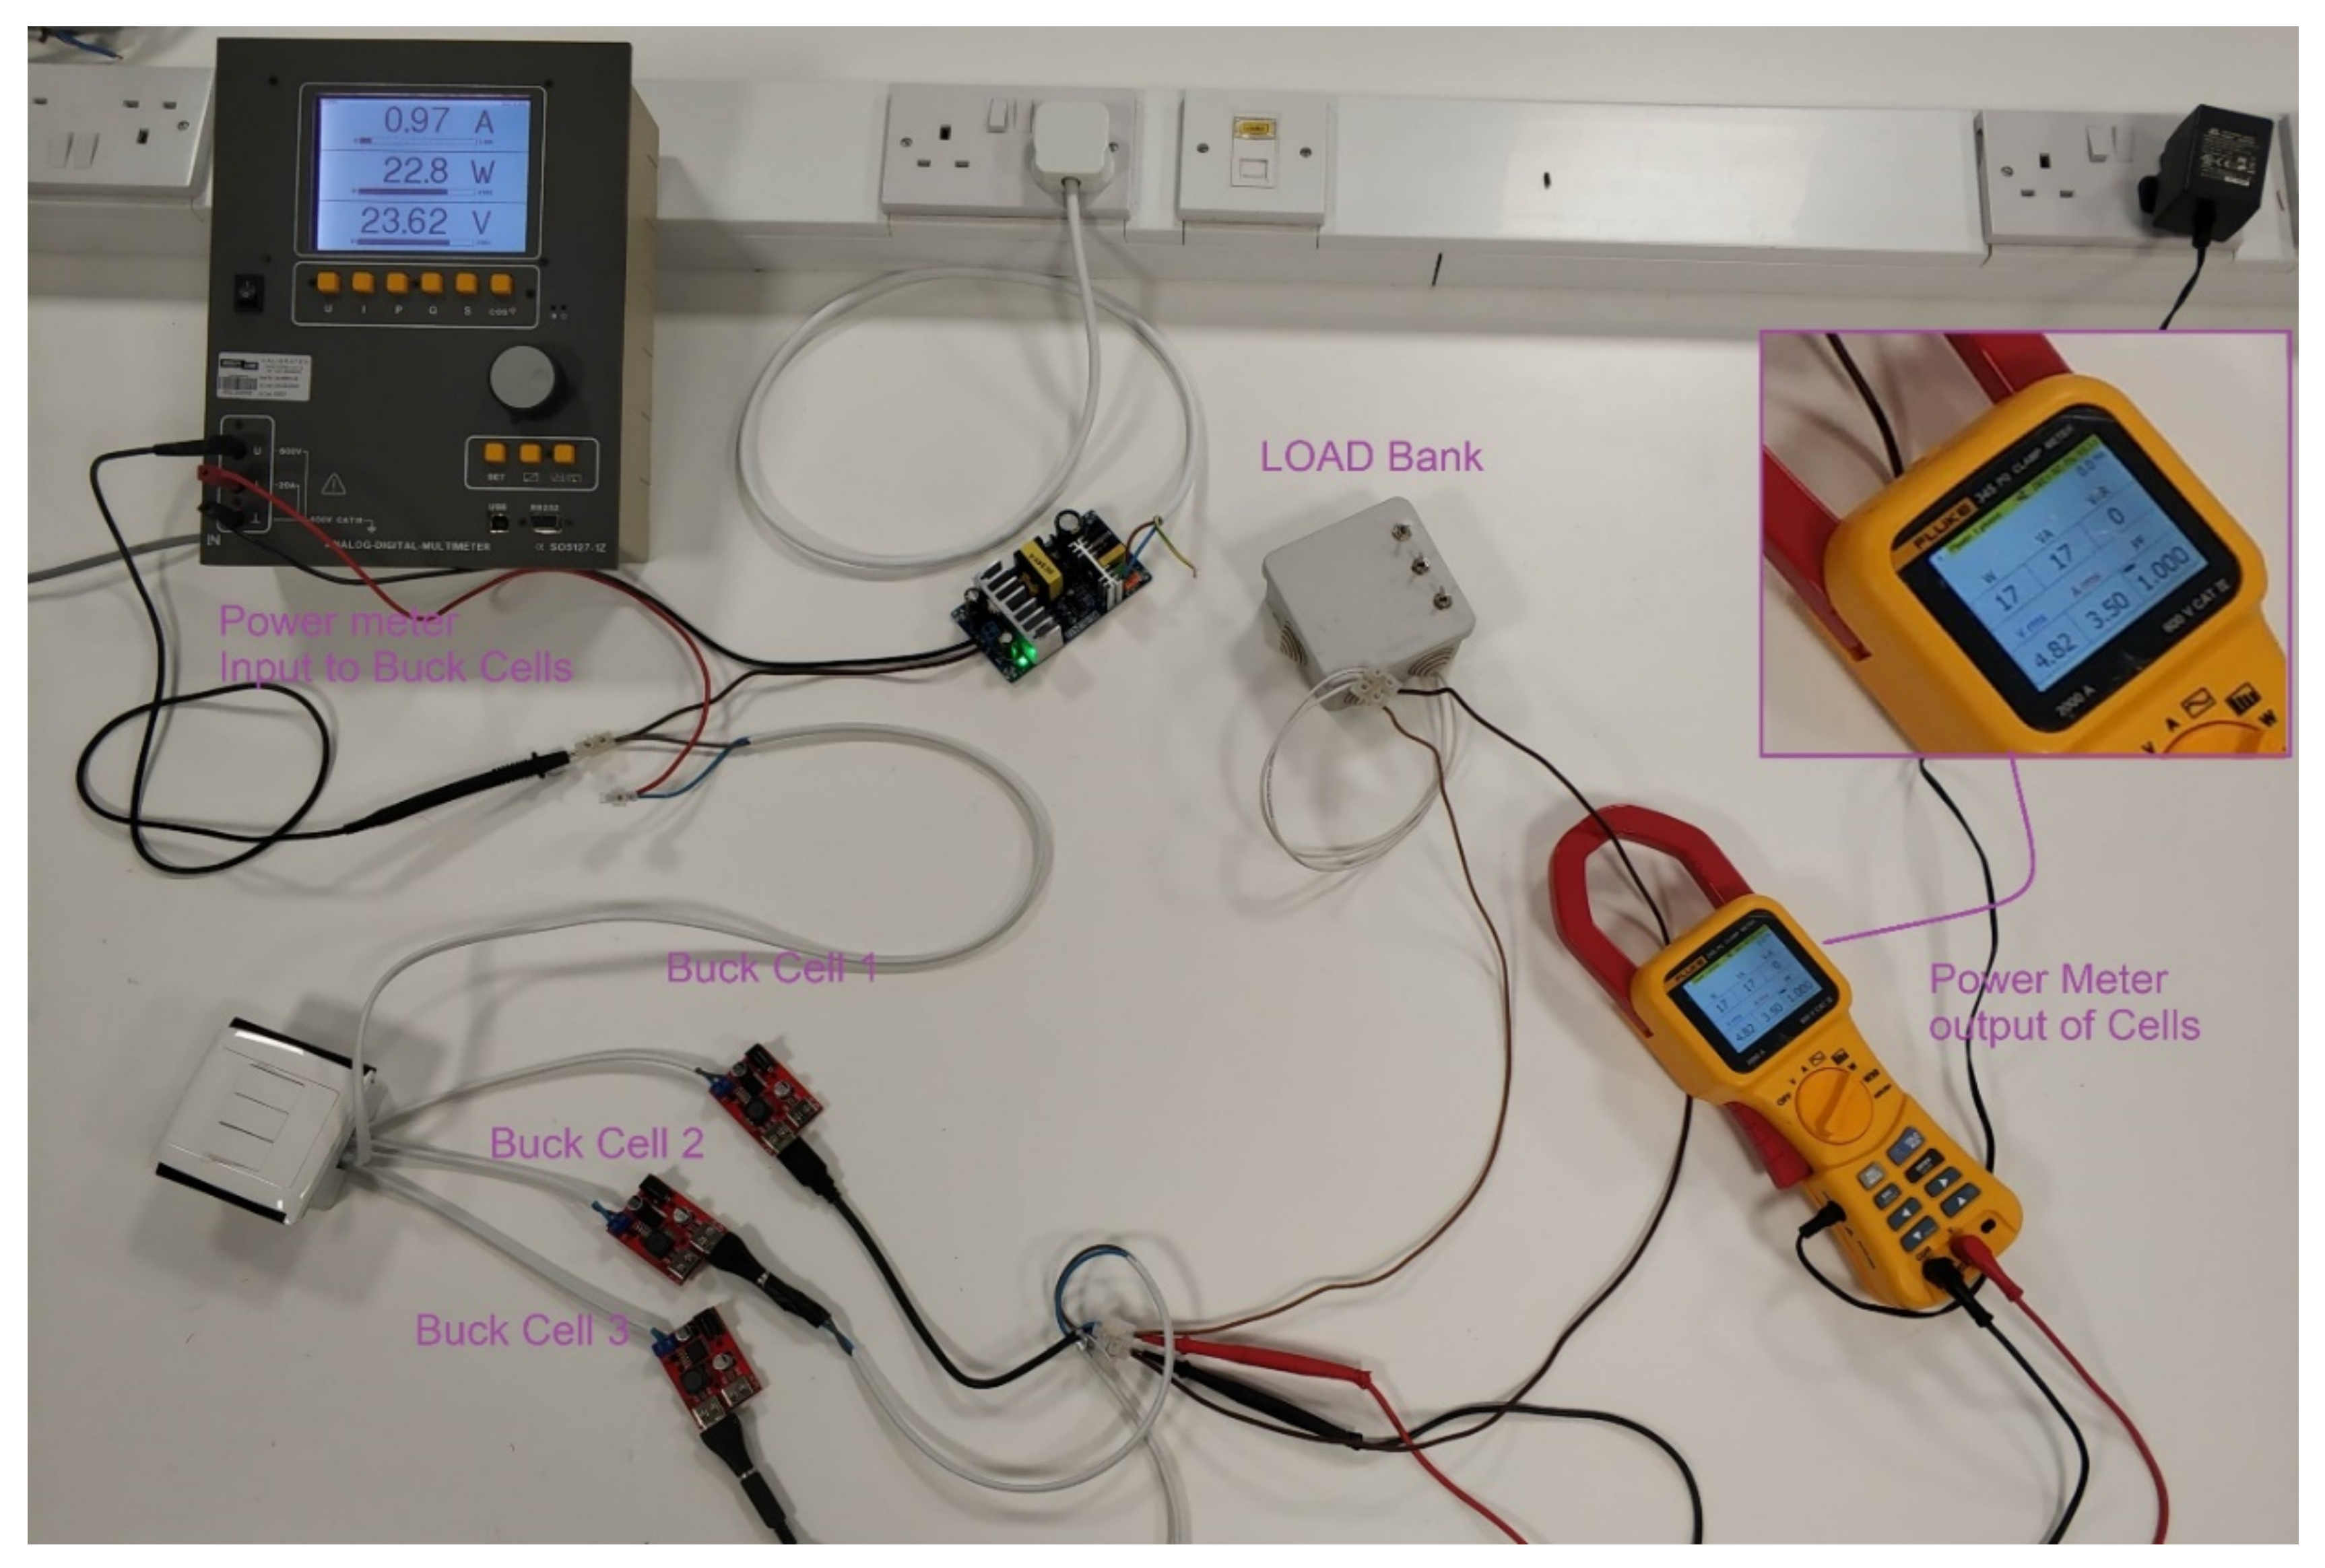
This experimental verification work validates the use of parallel converter cells within a PSU system for improved overall energy efficiency. To experimentally validate this proposal, a small-scale experimental setup was implemented with 3 buck conversion cells of a maximum power output of 18 W, input voltage of 24 V DC and output 5 V DC, connected in an IPOP structure.
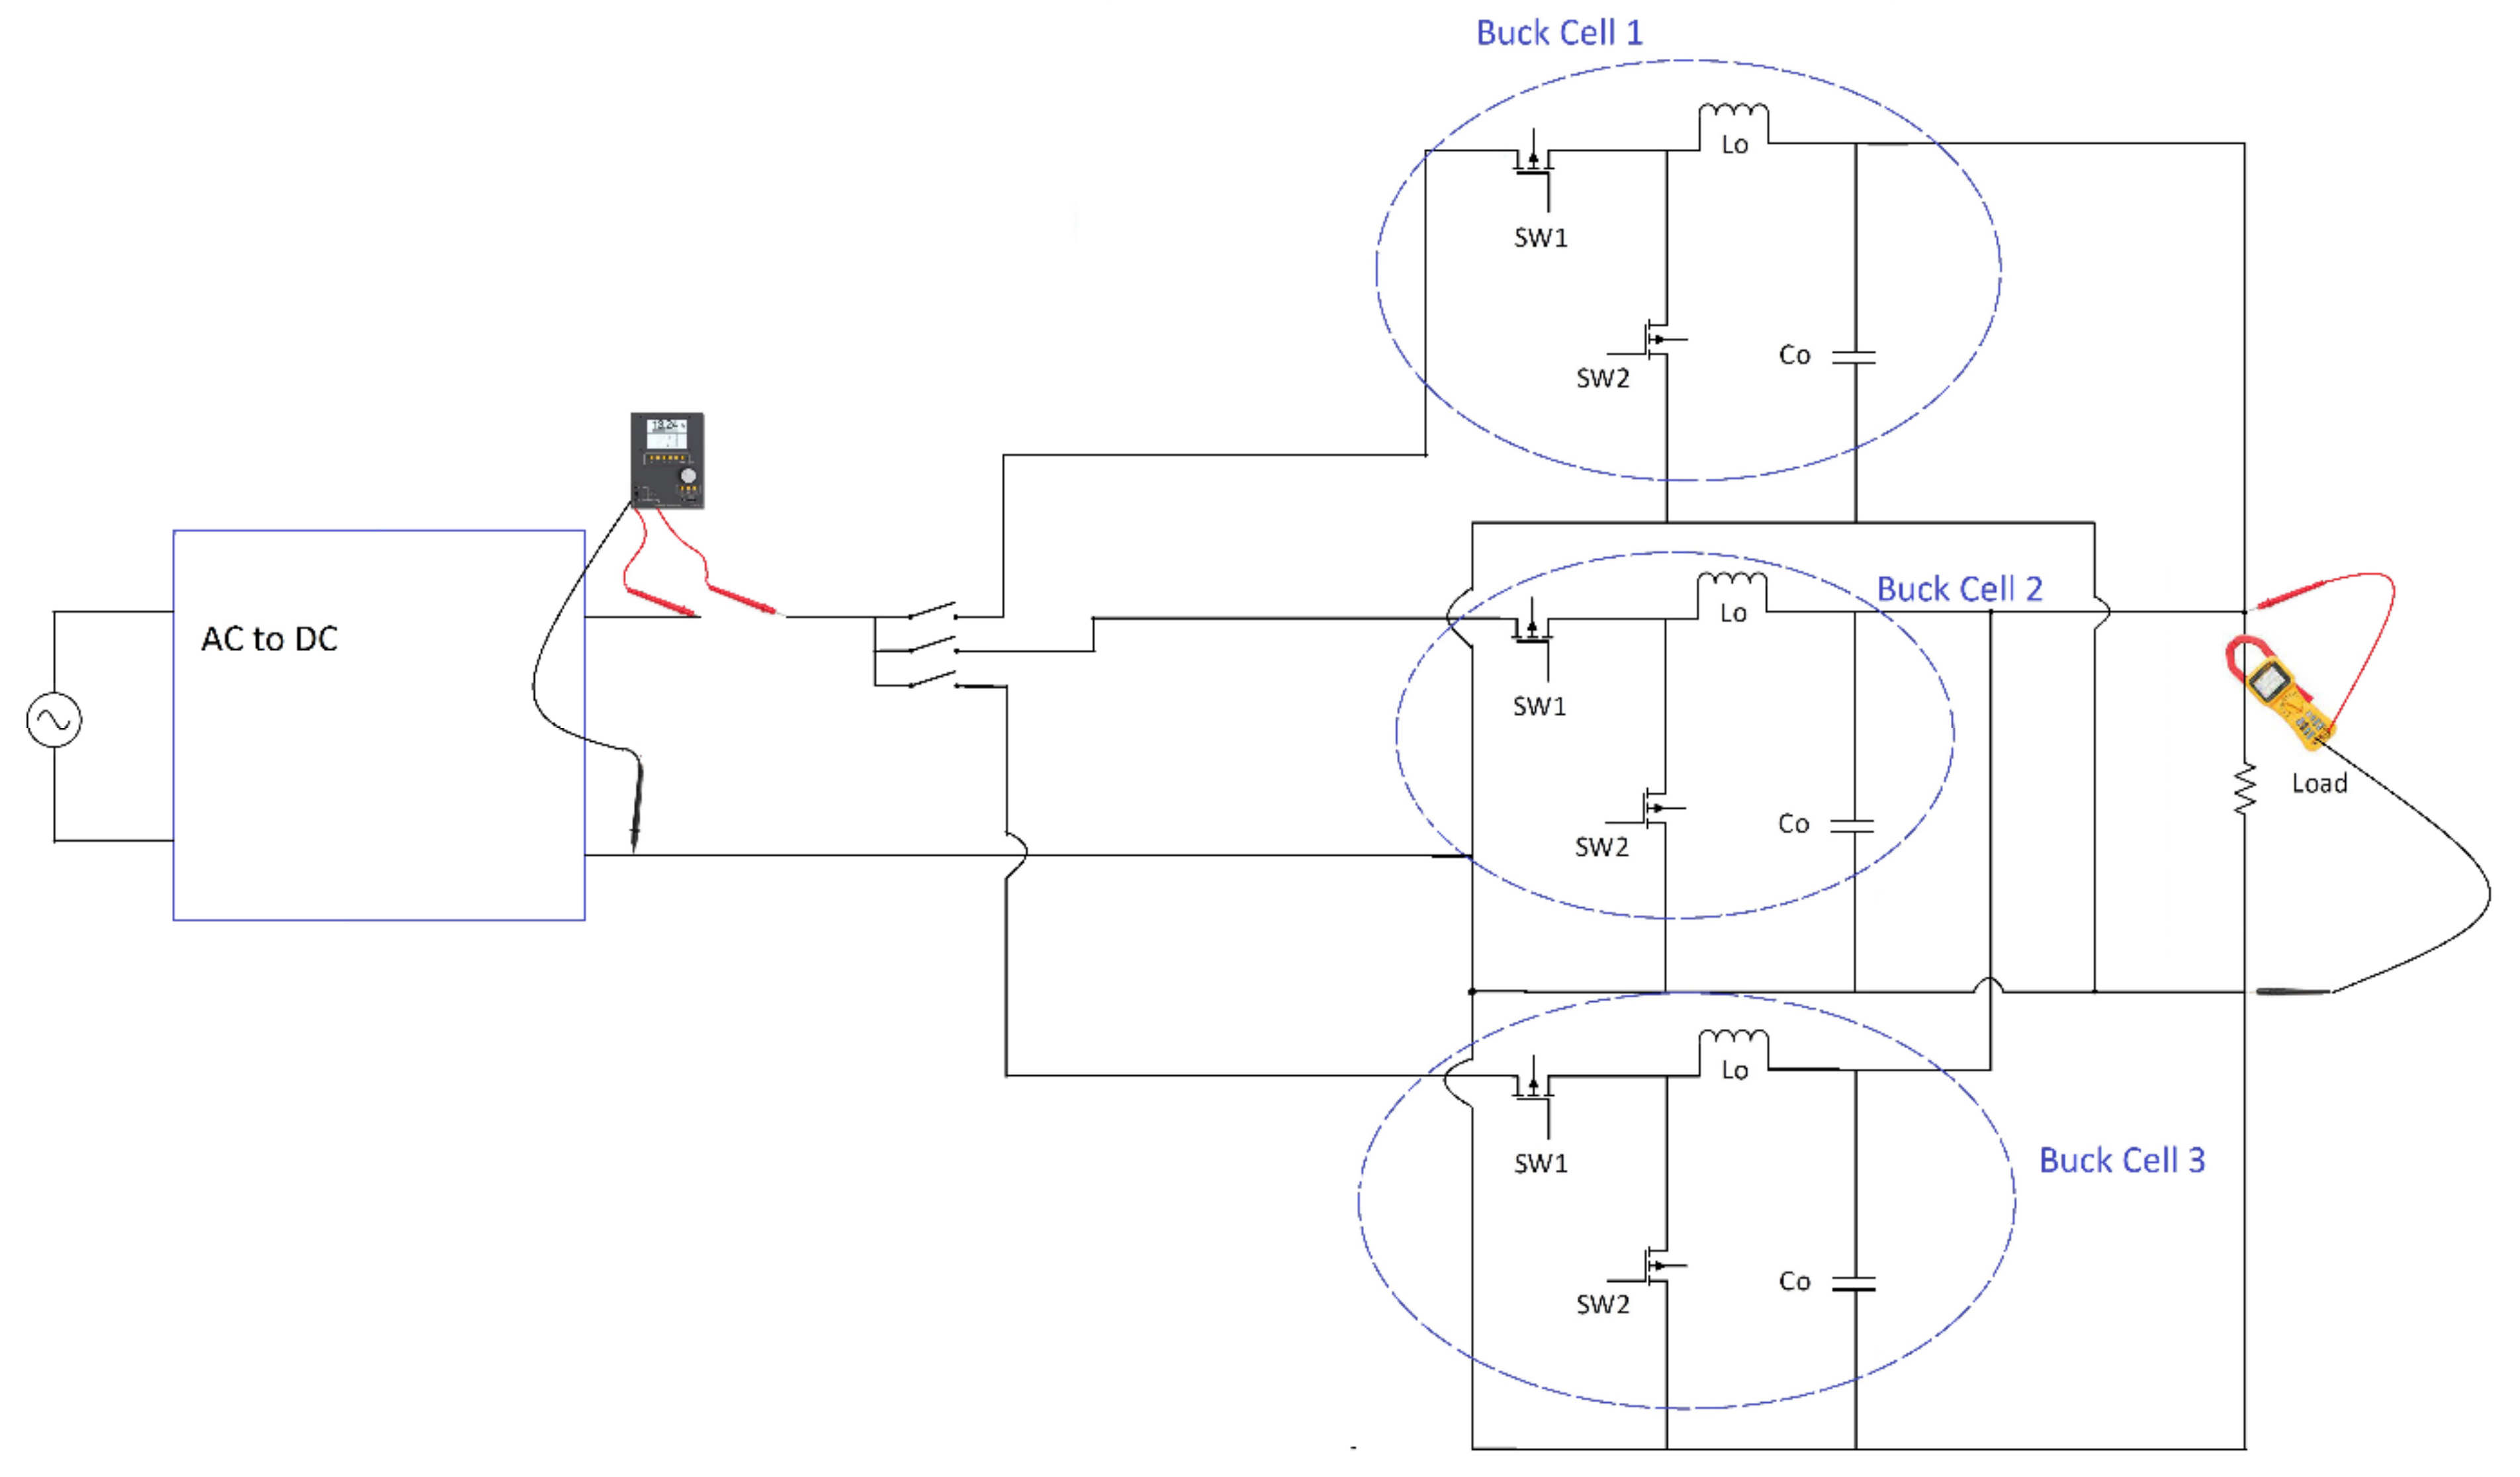
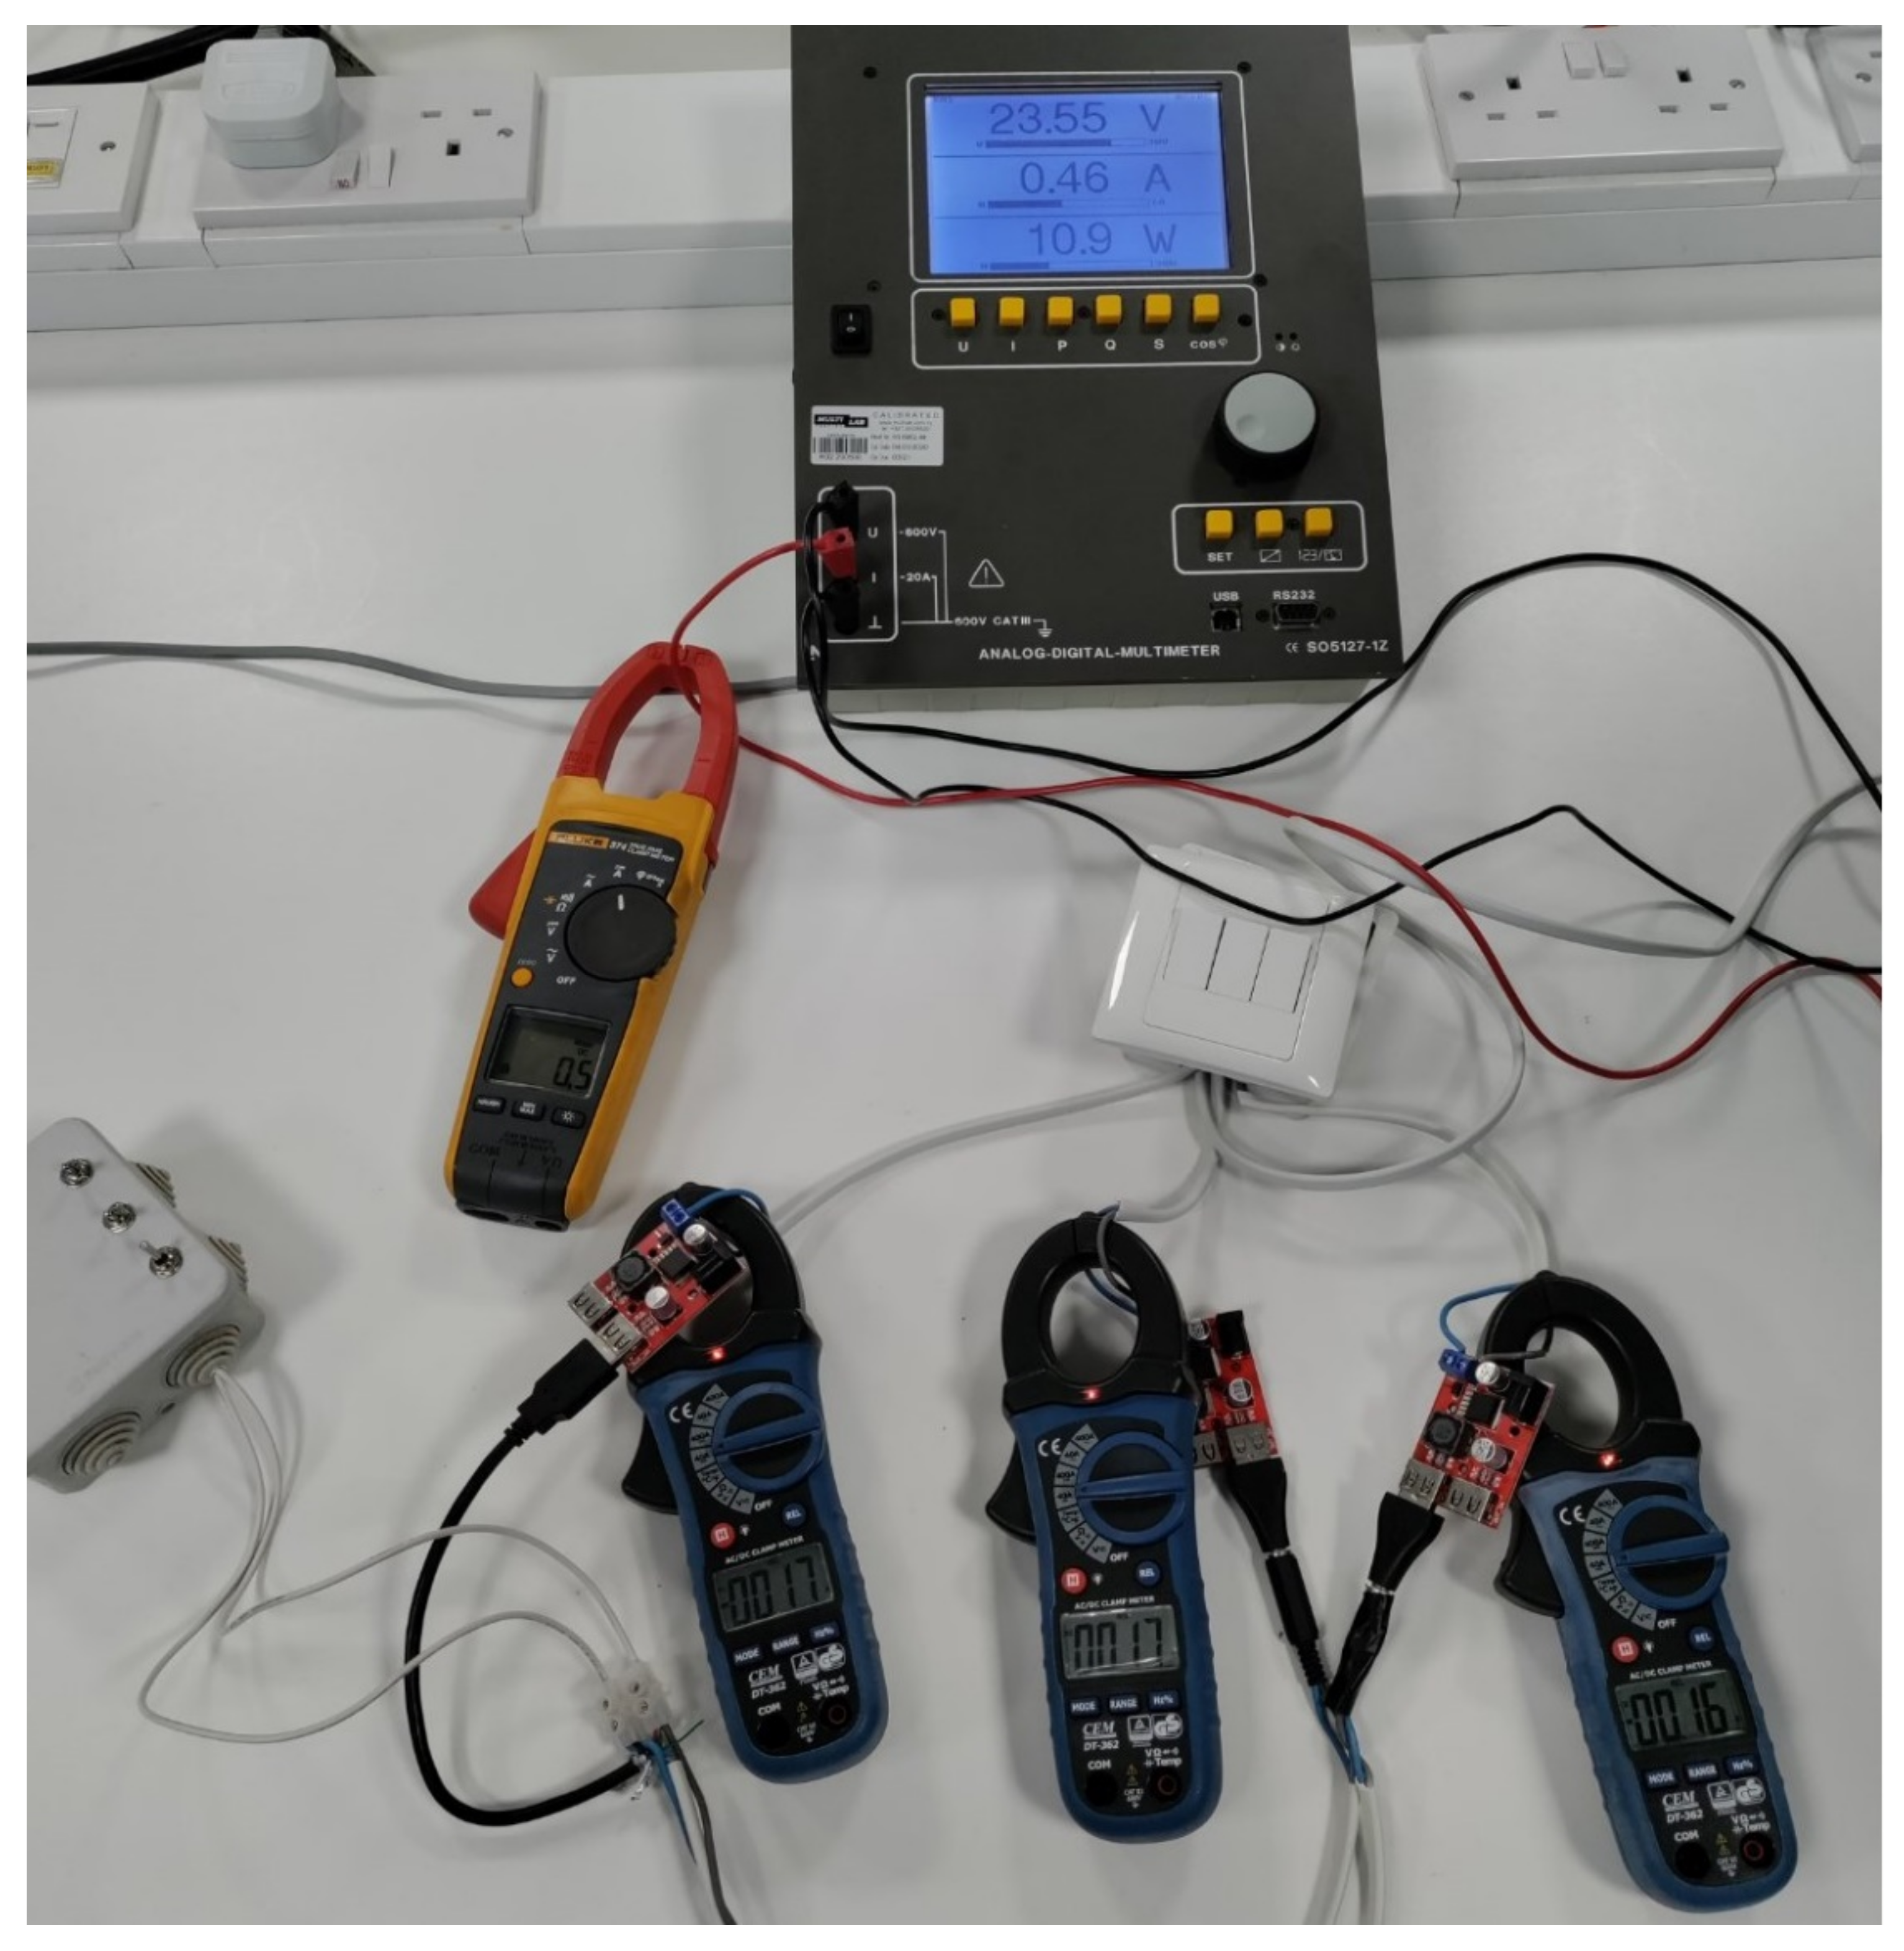
Initially the setup was simulated in PSIM thermal module (version 12.0.3.) for comparison of theoretical and experimental results. The setup consists of 3 buck converter cells, a 3-pole switch for switching of the 3 parallel cells, variable loads, and two power meters measuring input and output voltage, and current and power. The buck cells used are commercially available and they employ the LM2596 controller. A photo of the experimental setup is shown in Figure 5 and Figure 6, showing the respective schematic diagram. The input power meter used is a Lucas-Nuelle analog/digital multimeter, which is the wattmeter and power-factor meter model SO5127-1Z, which has a measurement accuracy of 2%, and a capability to work with voltages of up to 600 V and a current range of 0–20 A. The meter used in the output of the multicell conversion system is a Fluke 345 PQ meter with an accuracy in current measurements of ±0.2 A or ±1.5% and an accuracy of voltage measurements of ±1%. It is worth mentioning here that since the measurements with 3 cells, 2 cells and 1 cell are comparative, the efficiency improvement could easily be verified. As it can be seen in Figure 5, for 17 W load output, the power input with 3 buck cells is 22.8 W. For instance, at the same load (of 17 W) with 2 cells, the input power was 23.1 W. The voltage input to the 3 cells was 23.56 V and current input 0.97 A.
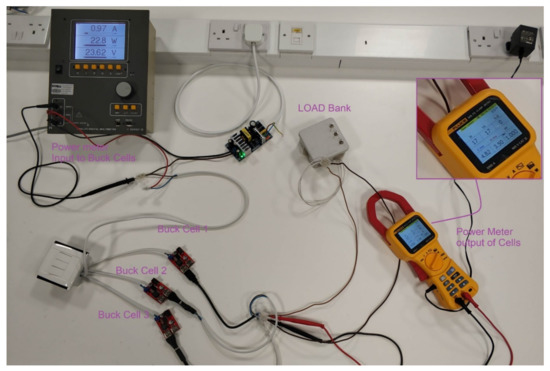
Figure 5.
Experimental setup with parallel buck converter cells.
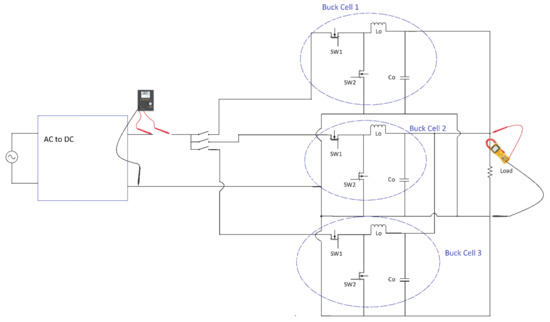
Figure 6.
Circuit diagram of experimental setup.
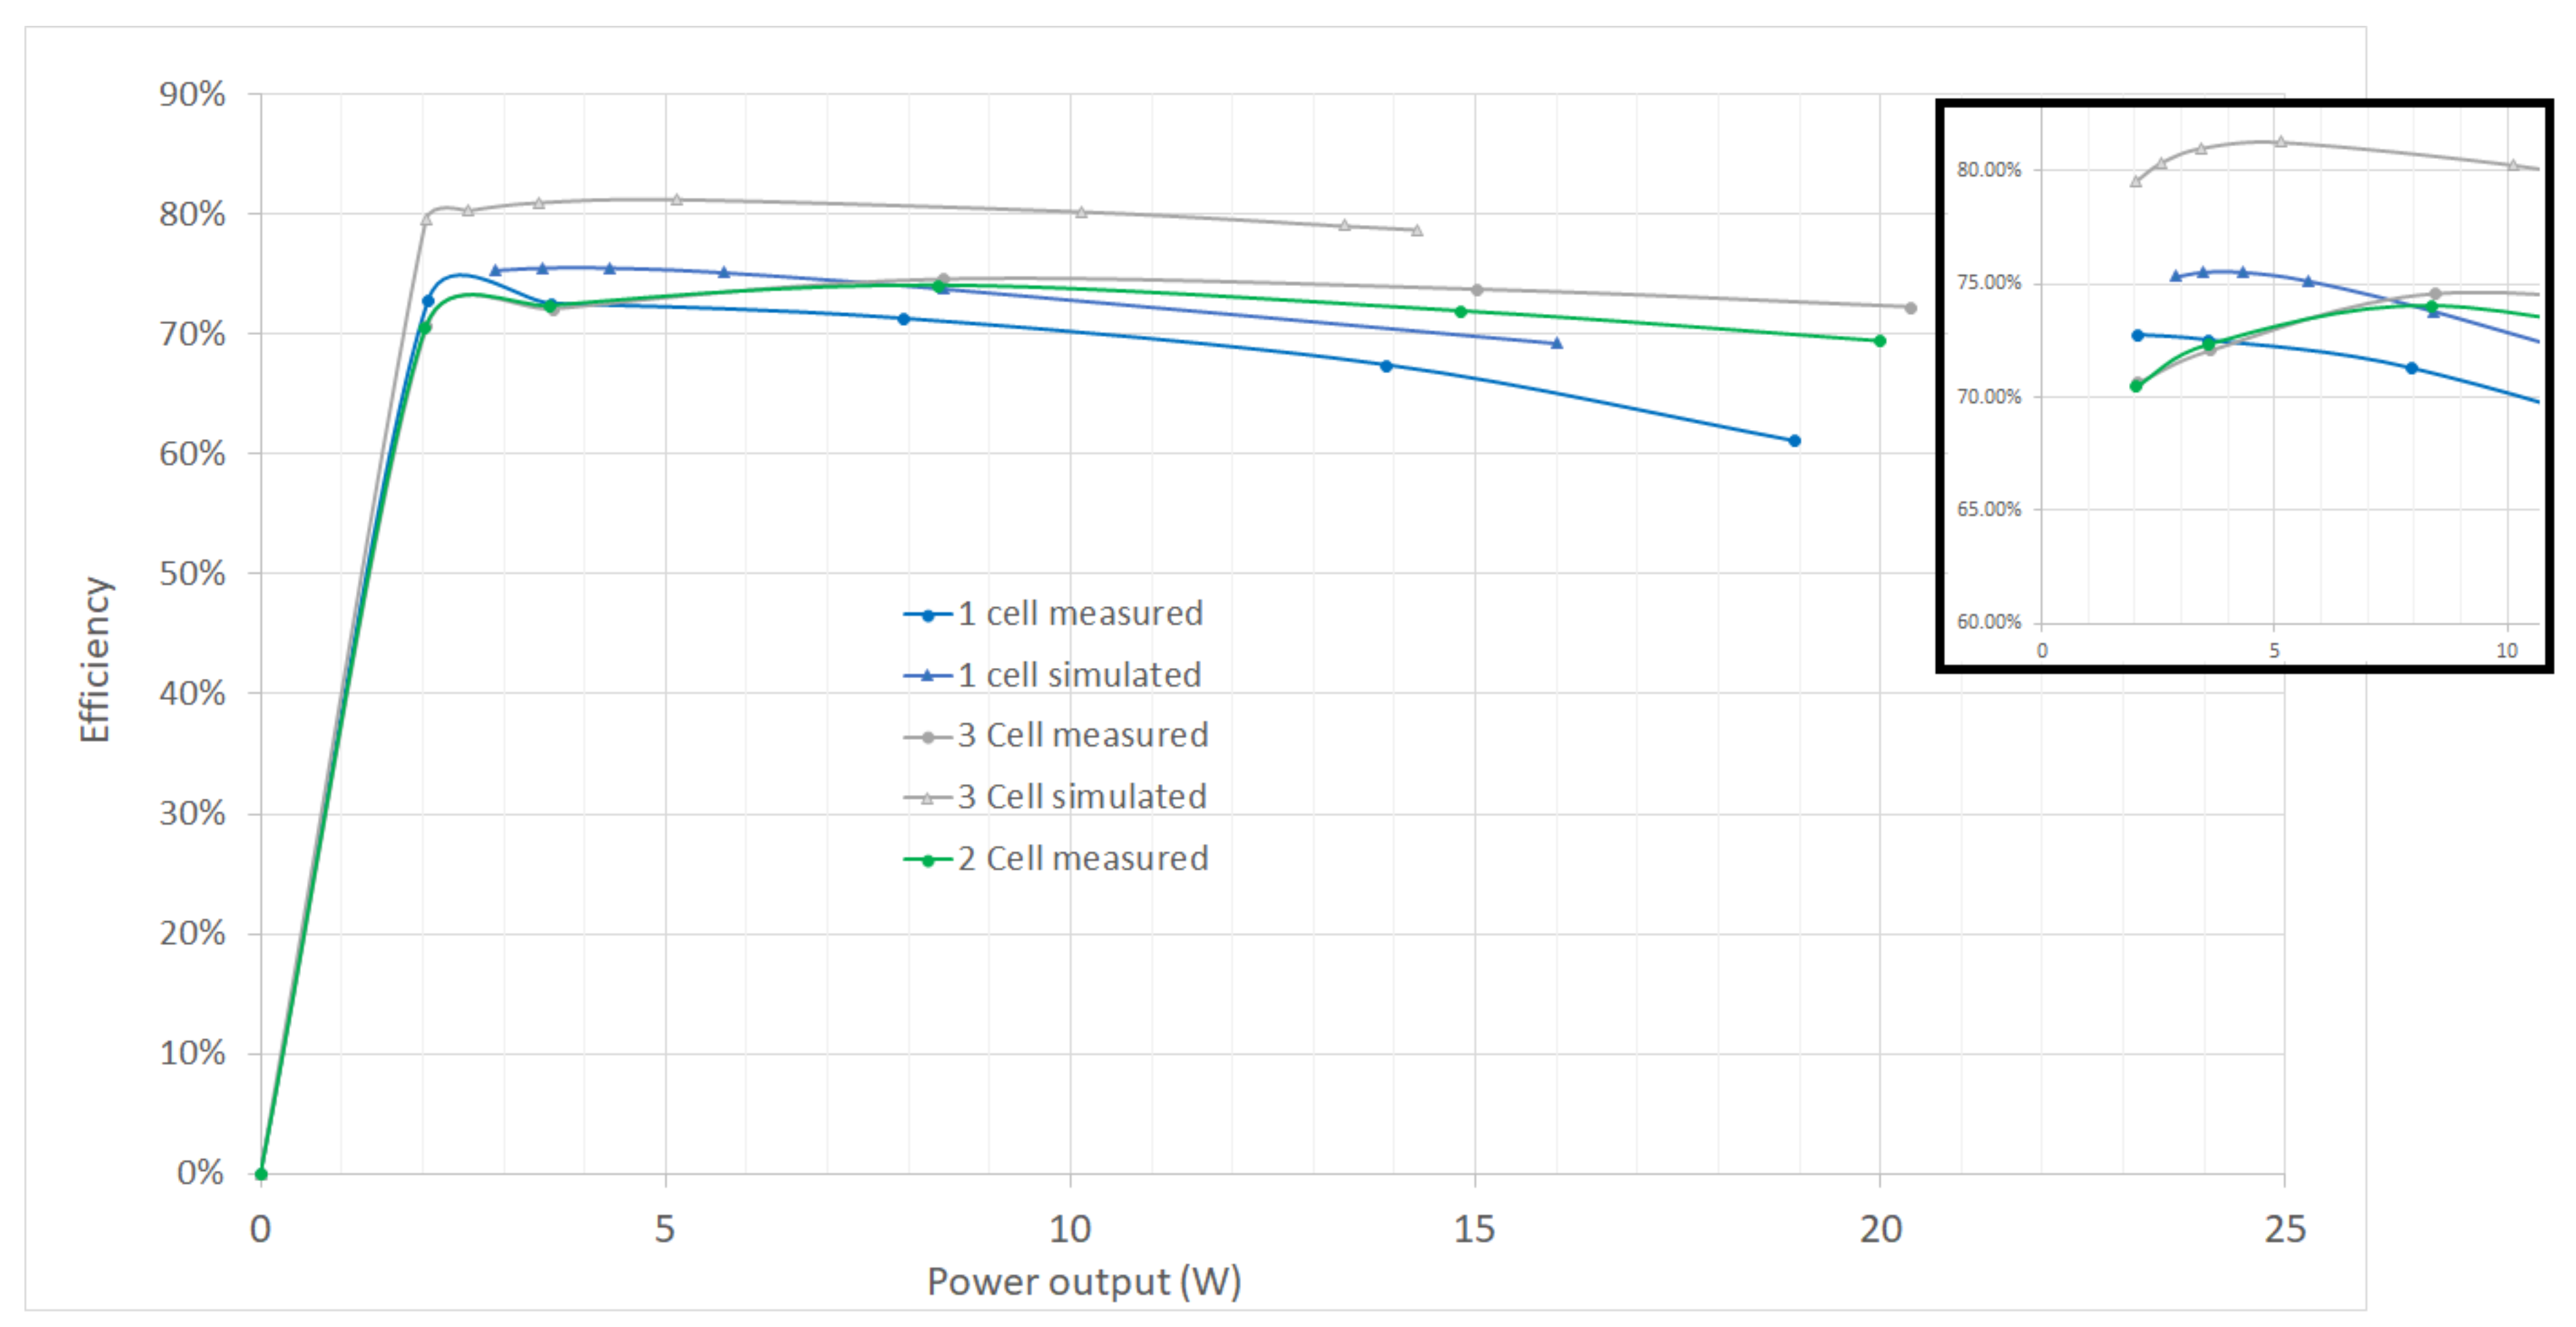
The efficiency of the single buck cell at different load conditions was measured, graphically analyzed and used as a baseline for energy efficiency. Following the experimental measurements with one buck converter cell, two and then subsequently three similar buck converter cells were used. Repeating the same methodology and measurement strategy, the load-efficiency curve was constructed, as seen in Figure 7. It is worth mentioning that the no-load consumption of one, two and three PFC circuits have an effect on the load-efficiency curves. As it can be seen in Figure 7, for loads corresponding to 10–20% of the full load (i.e., 1.8–3.6 W), the efficiency of one buck converter cell is higher than in the case with two and three buck converter cells. For instance, on 2 W load, the efficiency of 1 cell was 72.76% and with 3 cells it was 70.63%. Additionally, on 3.6 W load, the efficiency with 1 cell was 72.5%, with 2 cells 72.32% and with 3 cells 72.07%. This is due to the no-load losses of the PSU modules arising mainly from the inductors and the control circuitry. The no-load loss of a single buck converter cell is found to be 0.1904 W, that of two cells was equal to 0.238 W and for three cells 0.3094 W.
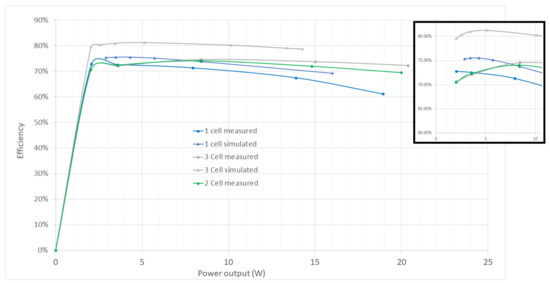
Figure 7.
Efficiency comparison of 1-cell and 3-cell multicell buck converters.
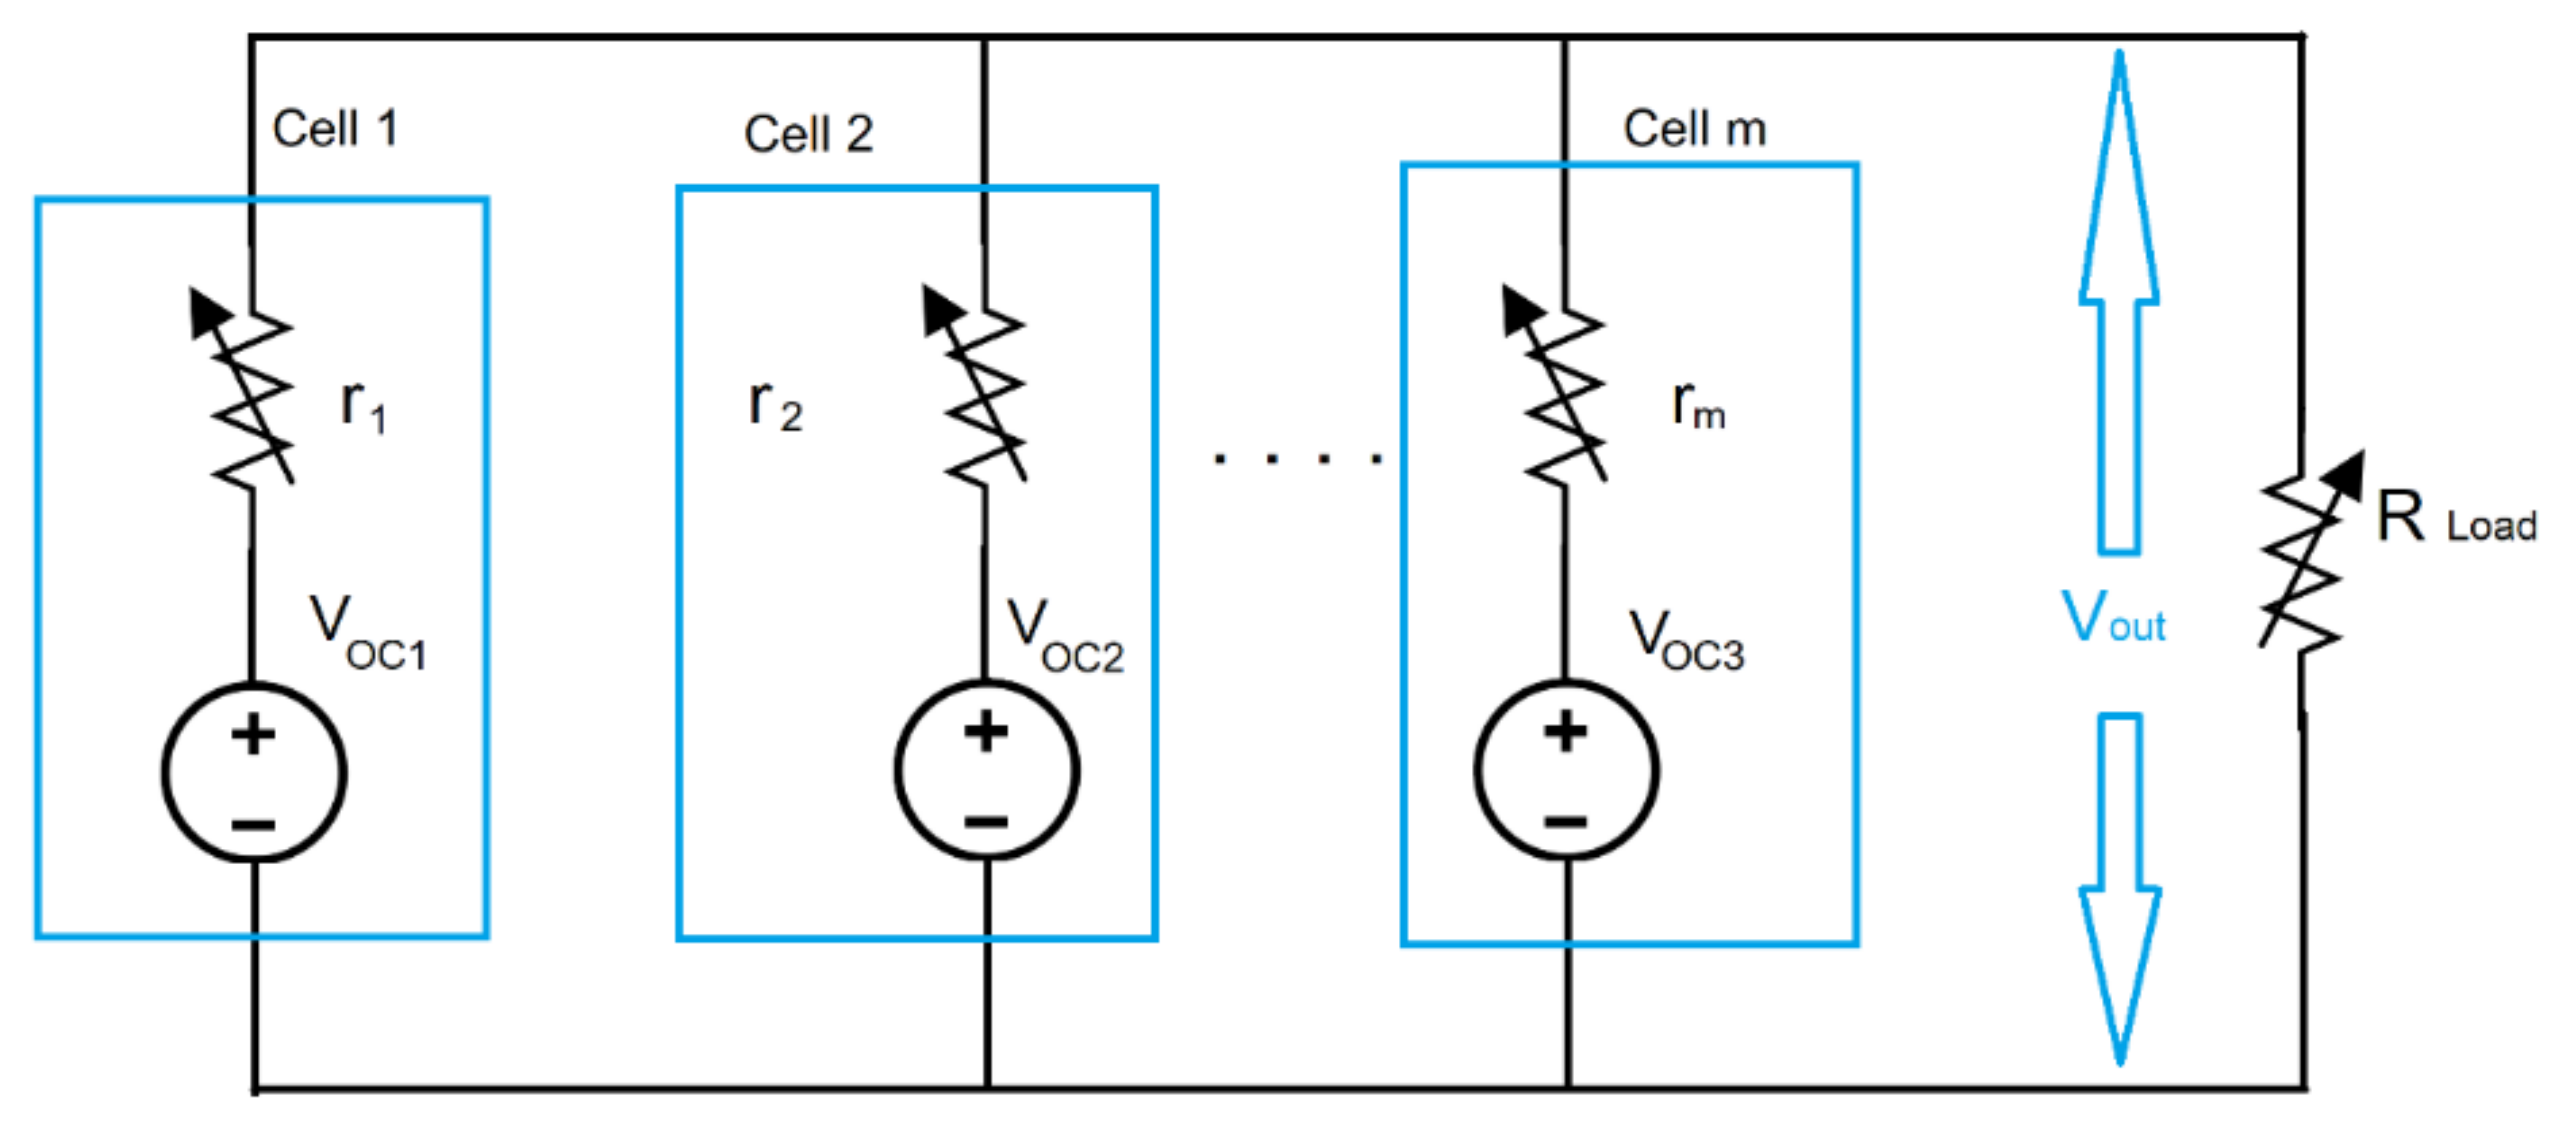
It can be theoretically and experimentally shown that when using parallel cells of the same converter type, size and brand, the load is equally shared between the number of parallel cells. Power converters or PSUs are voltage-controlled systems in which the controller must maintain the output voltage level within certain values for different loading conditions. Either in continuous conduction mode (CCM) or discontinuous conduction mode (DCM), the small signal model of the buck converter in the secondary (output) side of the converter consists of DC sources and a series impedance/resistance. The voltage and resistance of CCM and DCM modes is of course different when analyzing the small signal model. The equivalent simplified circuit for DC power supplies proposed from this work is shown in Figure 8.
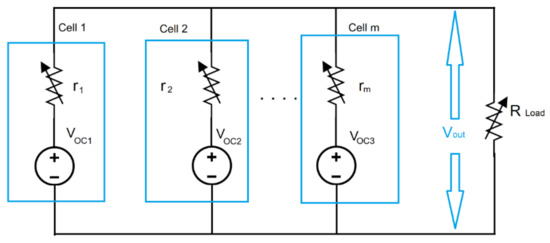
Figure 8.
Equivalent simplified circuit of parallel DC cells connected to a common variable load.
Using the circuit proposed, the equation of output power as a function of output voltage, load and internal resistance can be derived for different cells and is given by:
For cells which are multiple and dissimilar in size and type, it can be shown that connecting “w” number of cells of type A and “q” number of cells of type B in parallel supplying a common load, the voltage at the output is given by:
where: Voc1 and Voc2 are the cell type A and cell type B, open circuit voltage, Vout is the output voltage of the system, r1 is the internal resistance of type A buck-cell and w & q are the number of buck-cells of type A and B connected to the system, respectively. The power output of the system consisting of “w” cells of type A and “q” cells of type B is given by:
It is obvious from (12), (13), and (14), that each cell shares a portion of the output load based on the internal resistance, the open circuit voltage and the total load. For IPOP structures with the same type of converter cells, (in ideal conditions) it can be realized from equation (12) that the output power of each cell is equal. Measurements results for load sharing between cells are shown in Table 1. The current was measured using three clamp-on ammeters, which were the brand and type CEM, DT-362. The input power is measured through a Lucas-Nuelle analog/digital multimeter called SO5127-1Z. The experimental set-up is shown in Figure 9.

Table 1.
Load sharing between three buck cells.

Figure 9.
Experimental set-up of load sharing between parallel buck cells.
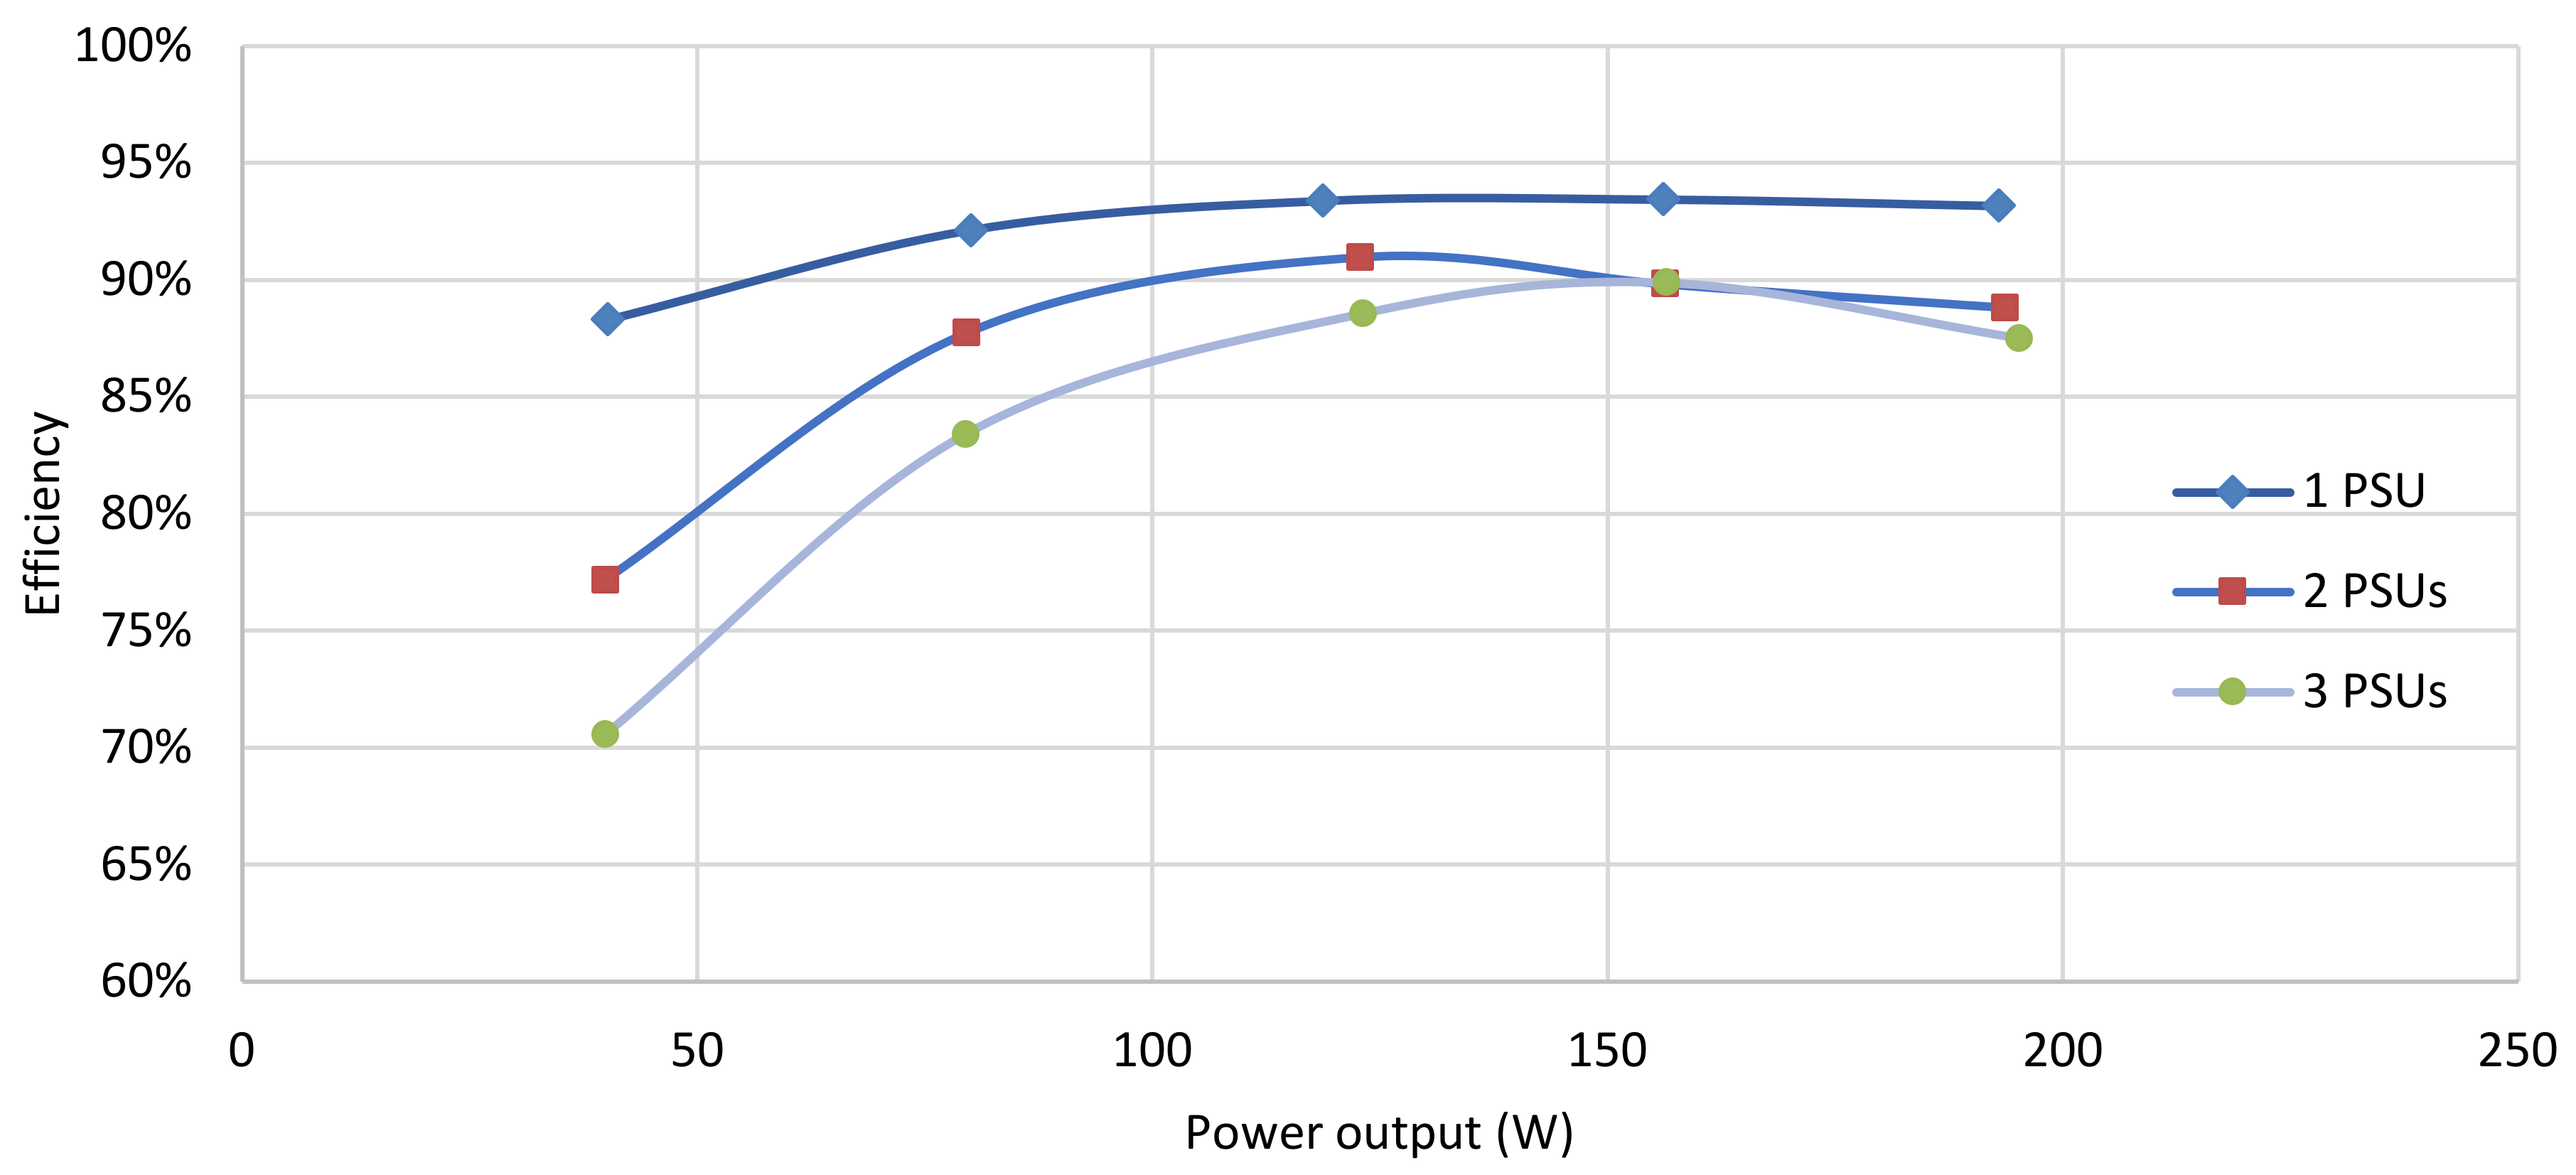
The no-load losses could not be measured by PSIM and this is why, in Figure 7, the simulation results show higher efficiency in all load levels compared with the respective experimental ones. Under full load, an impressive 11.18% higher efficiency was measured with three cells compared to one cell. In addition to no-load losses, PSIM is unable to measure the capacitor losses, control system consumption and other losses arising from cabling or connections, etc. Most industrial power supply units require high frequency transformers for isolation purposes that generate, however excessive, no-load losses. A single centralized transformer should be used in PSUs adopting the multicell circuitry structure. If each cell uses its own transformer, this would result in increased losses and lower overall conversion efficiency. This can be proven experimentally by combining in parallel three complete PSUs, including their individual transformer, and measuring the efficiency for the different loads. Three Eltek Valere Micro pack 250 W, 230 V AC input/48 V DC output PSUs are used to perform this experiment. The input to the three PSUs was measured using a Lucas-Nuelle analog/digital multimeter measuring the input current, applied voltage and consumed power of the system. Each of the three PSU outputs was connected to “dummy loads” of different load values whilst measuring the output current and voltage. For every different load case, input and output parameters were measured so that the efficiency could be subsequently evaluated. The plot of efficiency versus load output is shown in Figure 10, from which is it seen that the efficiency decreases as the number of PSUs connected in parallel increases. The no-load consumption of the PSUs (mainly as a result of the transformers) was measured and found to be 5 W per PSU (i.e., 2% of efficiency at full load).
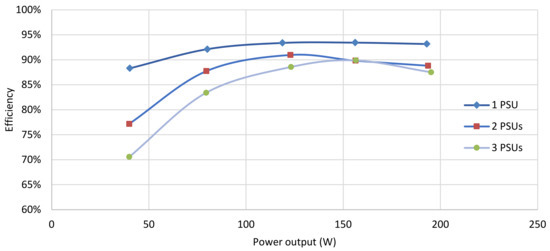
Figure 10.
Efficiency against power output of 1, 2 and 3 PSUs working in parallel (with transformer).
5. Proposed Multicell Buck PFC Converter
5.1. Justification of AC to DC Multicell Selection
In order to justify the selection and advantages of multicell structures, a high efficiency Z-source buck PFC with a power output of 1000 W was initially simulated. The proposed converter is an AC to DC step-down conversion circuit with improved efficiency. Despite its single-stage conversion structure, due to the Z-source filtering, it satisfies power supply regulation EN 61000-6-3. As a result, it is a transformer-less, single-stage conversion system that can be used with IPOP structures and produces an improved energy conversion efficiency.
The results with the losses at different power output levels are shown in Table 2. It should be noted that the input inductor was 3 mH and the one at the output was 92.4 μH. The output inductor design was optimized to minimize losses based on [25,26]. Table 1 shows that the total converter losses for the 200 W load output are 8.38 W and the efficiency is therefore 95.81%. For the 1000 W load case, the total losses are 55.15 W and the efficiency is 94.485%. It is interesting to note that the losses for switch 1 are lower than those of switch 2 for small loads, however, as the load increases, the losses of switch 2 become greater. Furthermore, the losses of the PFC stage are more than 40% of the total circuit loss and the output inductor losses are negligible.
Table 2.
Simulated single cell buck PFC results.
Initially, the AC to DC part of the multicell rectifier was simulated with the remaining parts of the PSU in a single-cell structure. The results are shown in Table 3. The results are very promising, since the load losses at 1000 W are considerably minimized. As expected, since, for both inductors and MOSFET switches, the main losses are due to the internal resistance (Rindutor and RDS−On, respectively), the three-cell buck PFC has significantly lower losses (since N(I/N)2 × R < I2 × R).
Table 3.
Comparison of 1-cell and 3-cell rectifier system.
The significant savings affect the overall PSU energy efficiency by up to 0.79%, as demonstrated in Table 3. In the proposed multicell bridge simulation that consists of a three-cell system, it is shown that, when increasing the number of cells, the efficiency improves. The efficiency improvement is significant, especially under bigger load conditions, but as the load decreases, the efficiency gains are relatively reduced.
5.2. Multicell Buck PFC
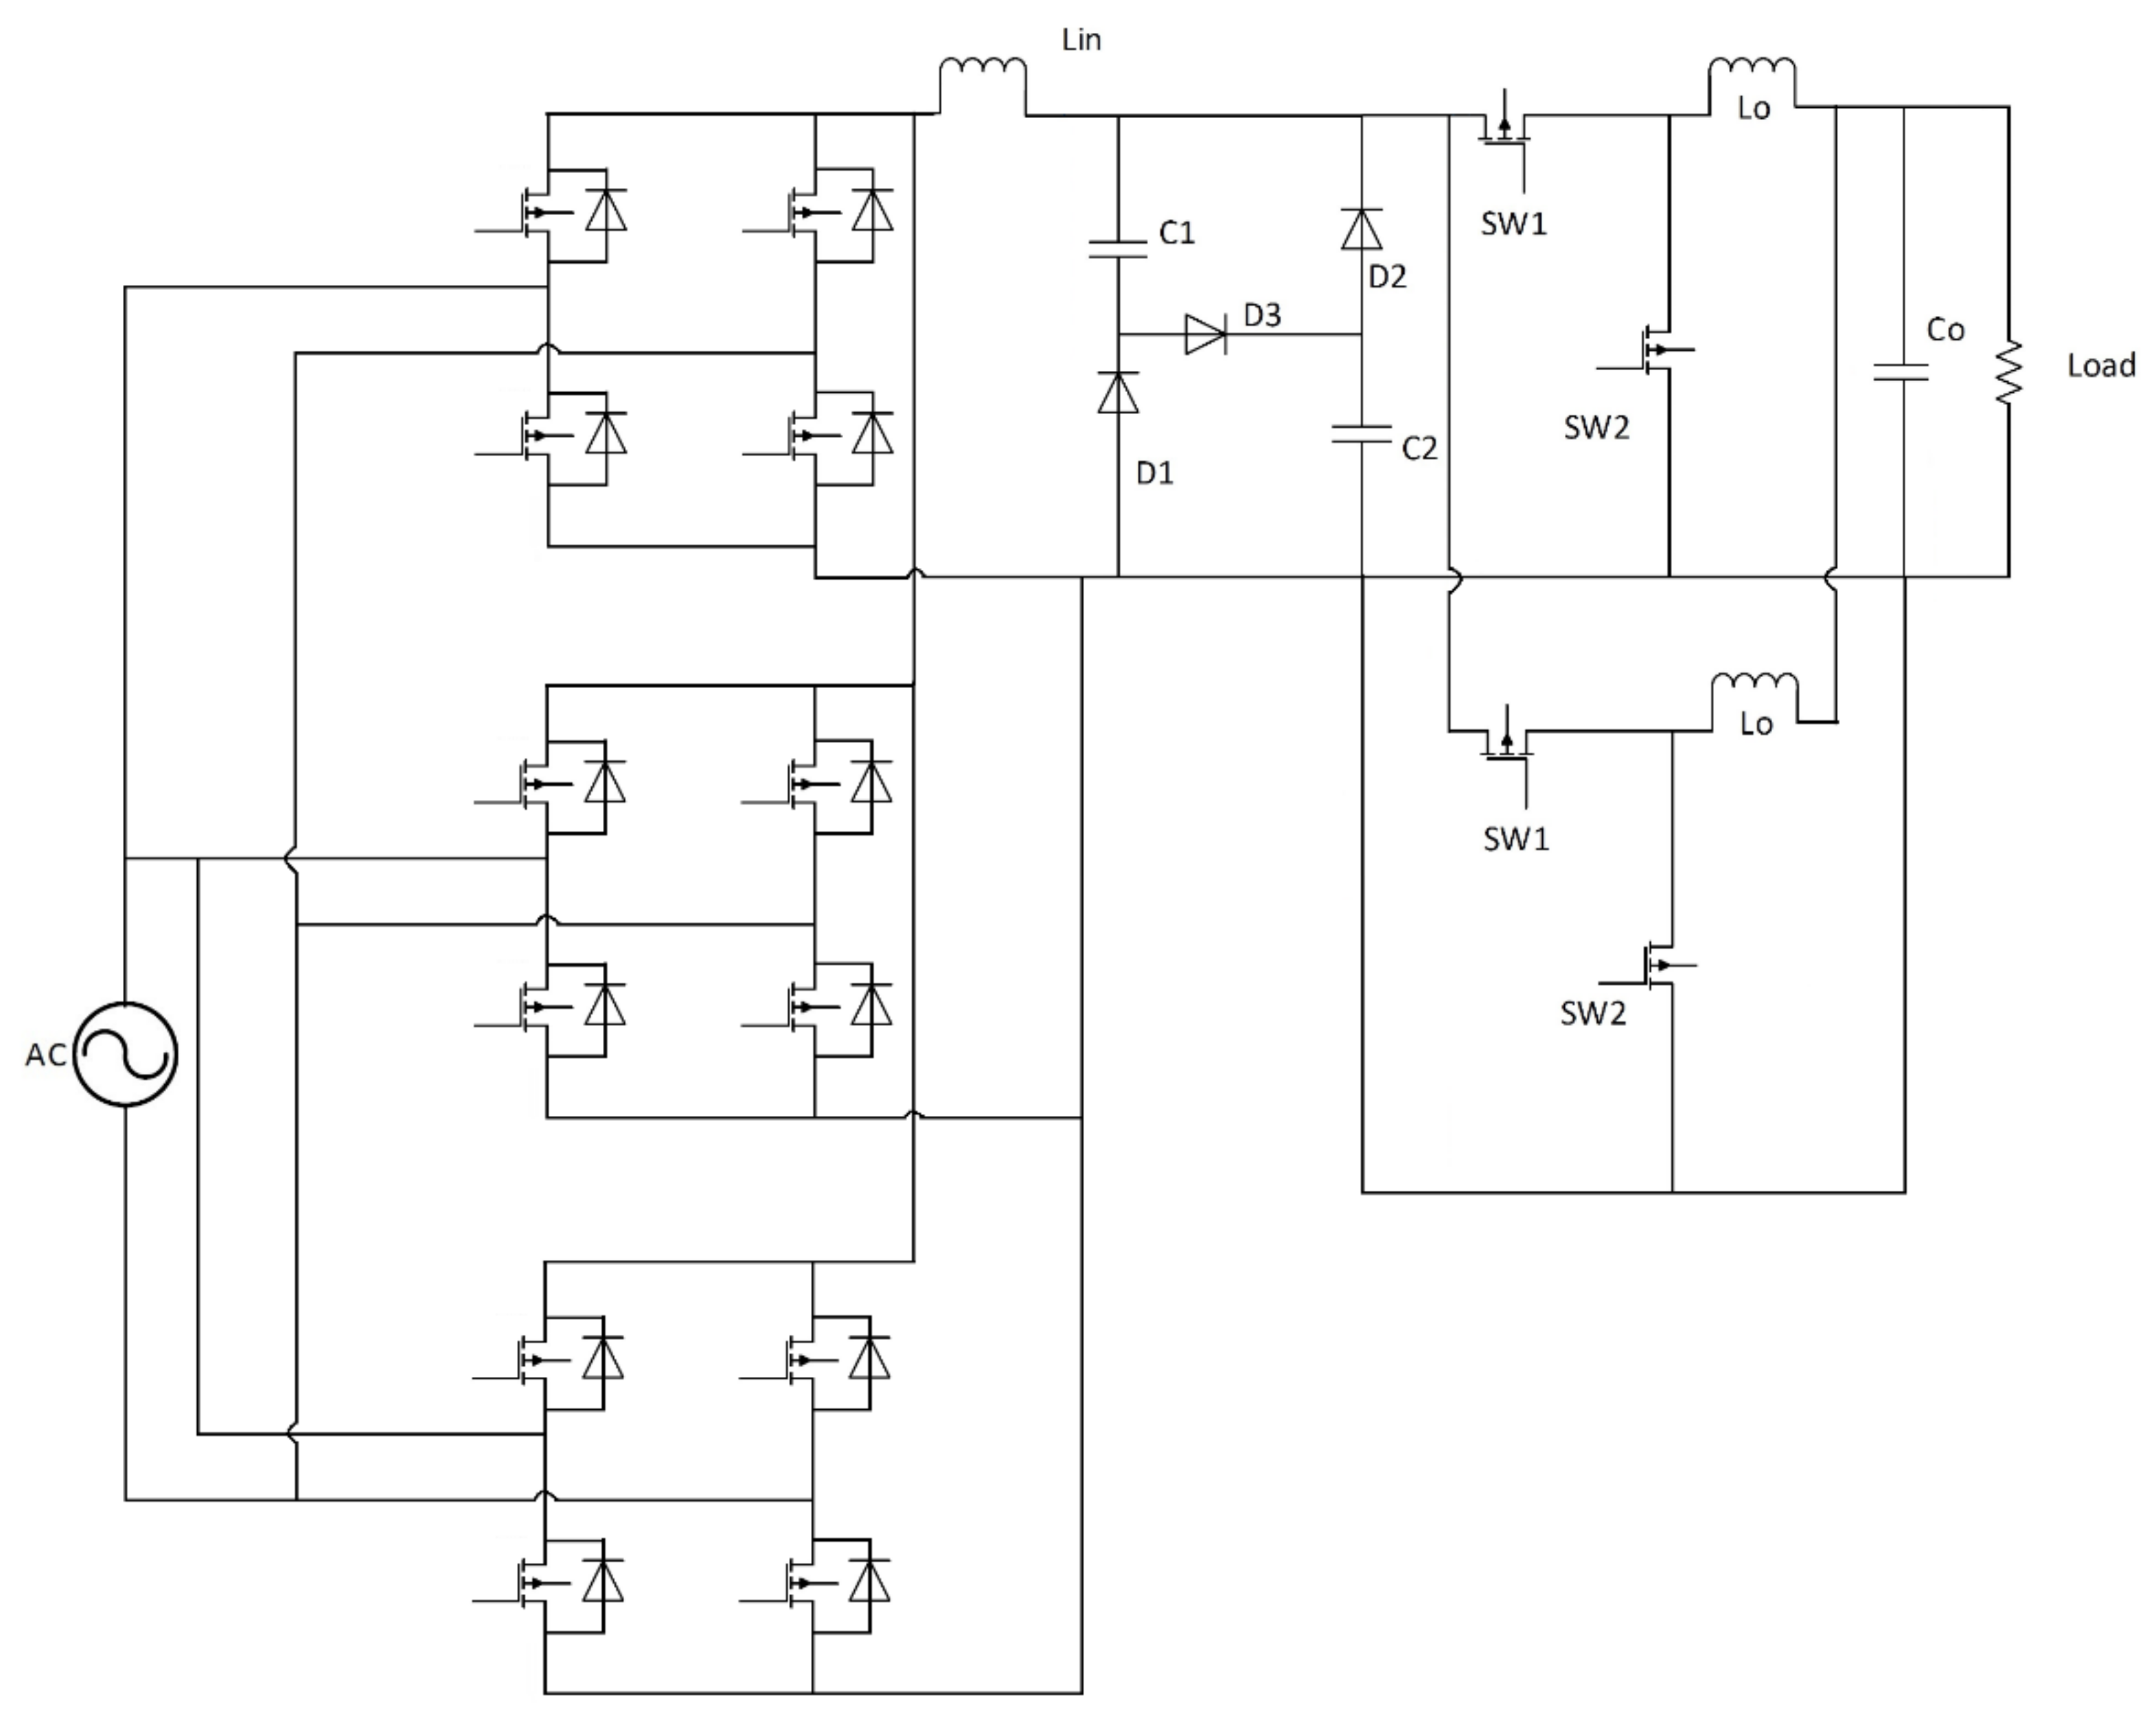
Simulating a two-cell buck PFC in PSIM’s thermal module, it is revealed that inductor losses were minimized by about 50%, as shown in Table 4. The switching losses remained about the same in the case of those of a single cell system; conduction losses, however, were minimized by 52–57% for different loads, and inductor losses were improved by 50%.The overall results of the new system are shown in Figure 11. The results indicate that when increasing the number of parallel cells, the conduction and inductor losses decrease proportionally. Switching losses, on the other hand, are not affected. Therefore, using GaN switches that have low switching losses compared to silicon MOSFETs, and also minimizing conduction losses through multicells, leads to considerable efficiency improvement. The simulated system diagram is shown in Figure 12.
Table 4.
Comparison of cost per watt for different PSU systems.
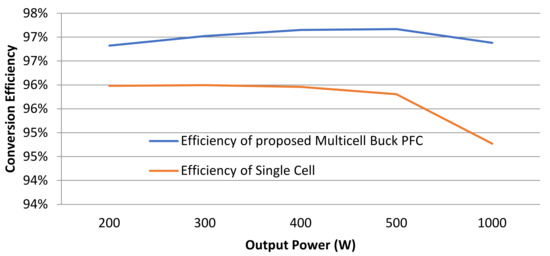
Figure 11.
Efficiency comparison of single-cell and multicell PSU.
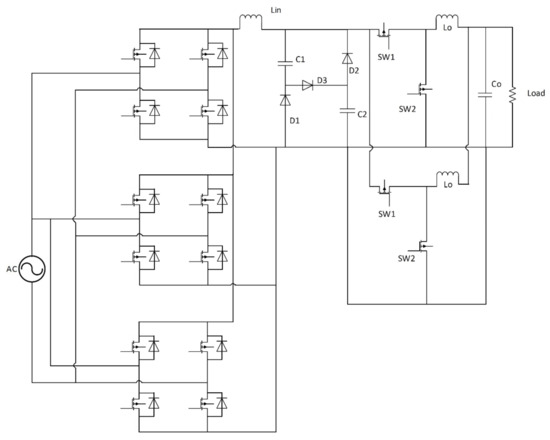
Figure 12.
Multicell PSU circuit proposed.
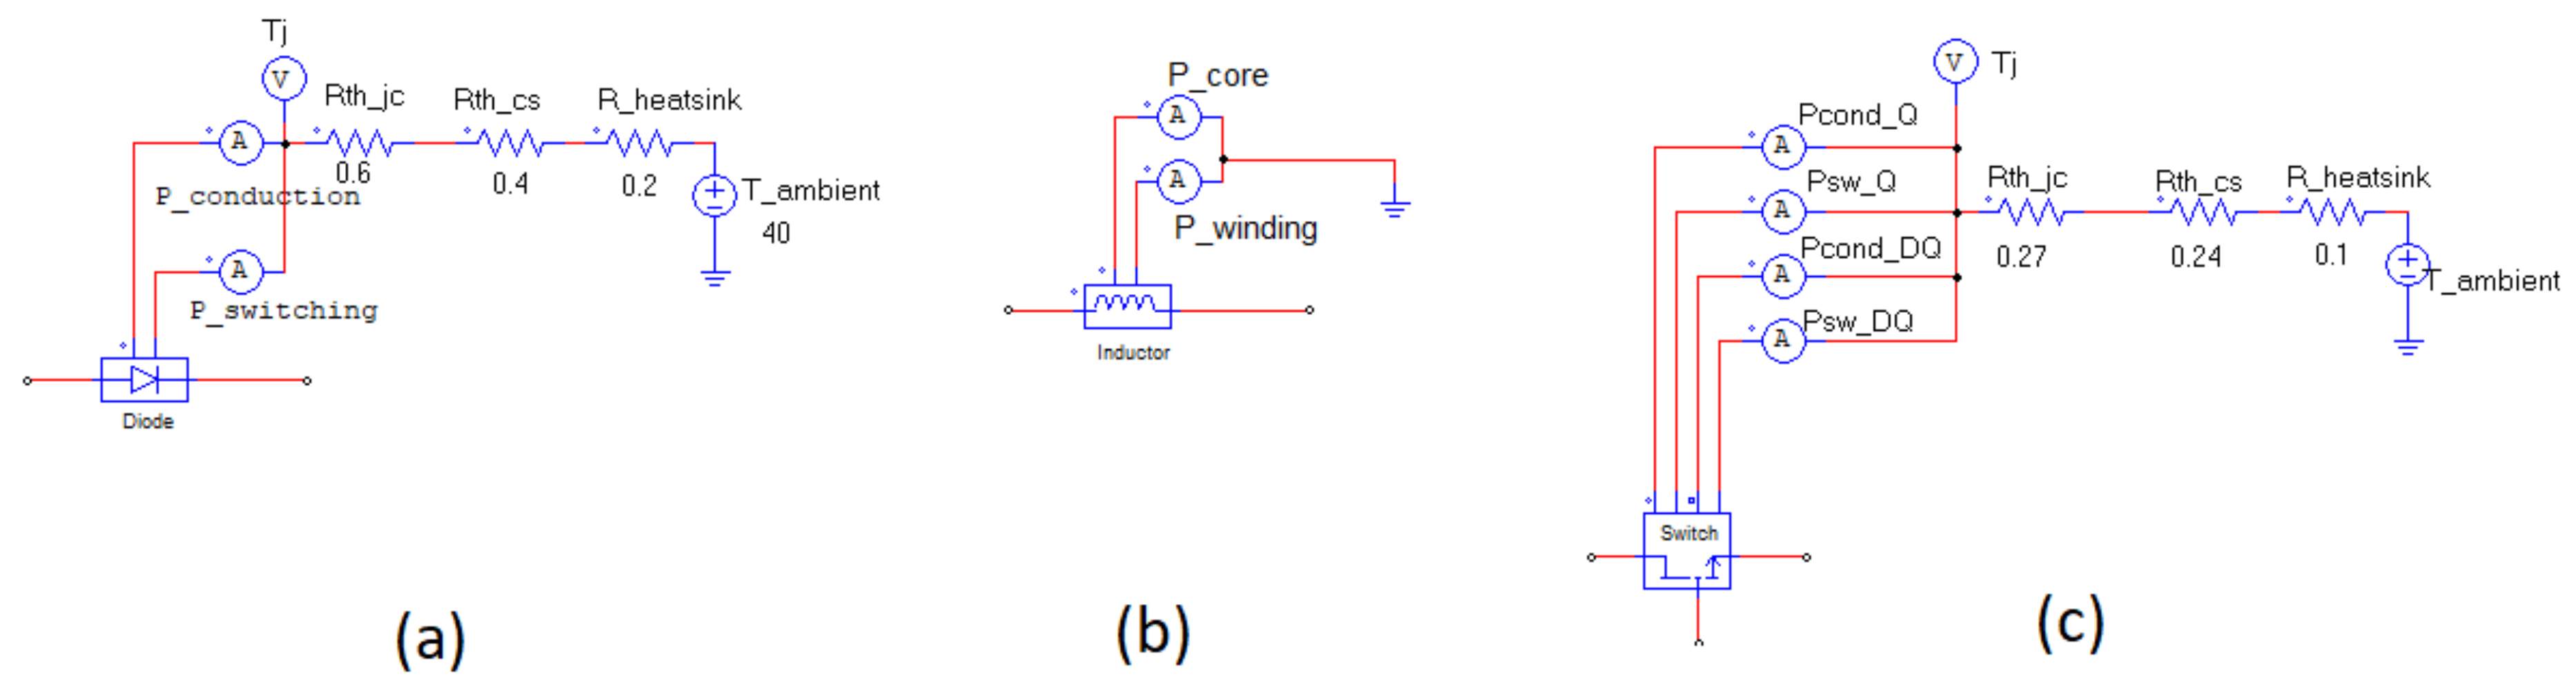
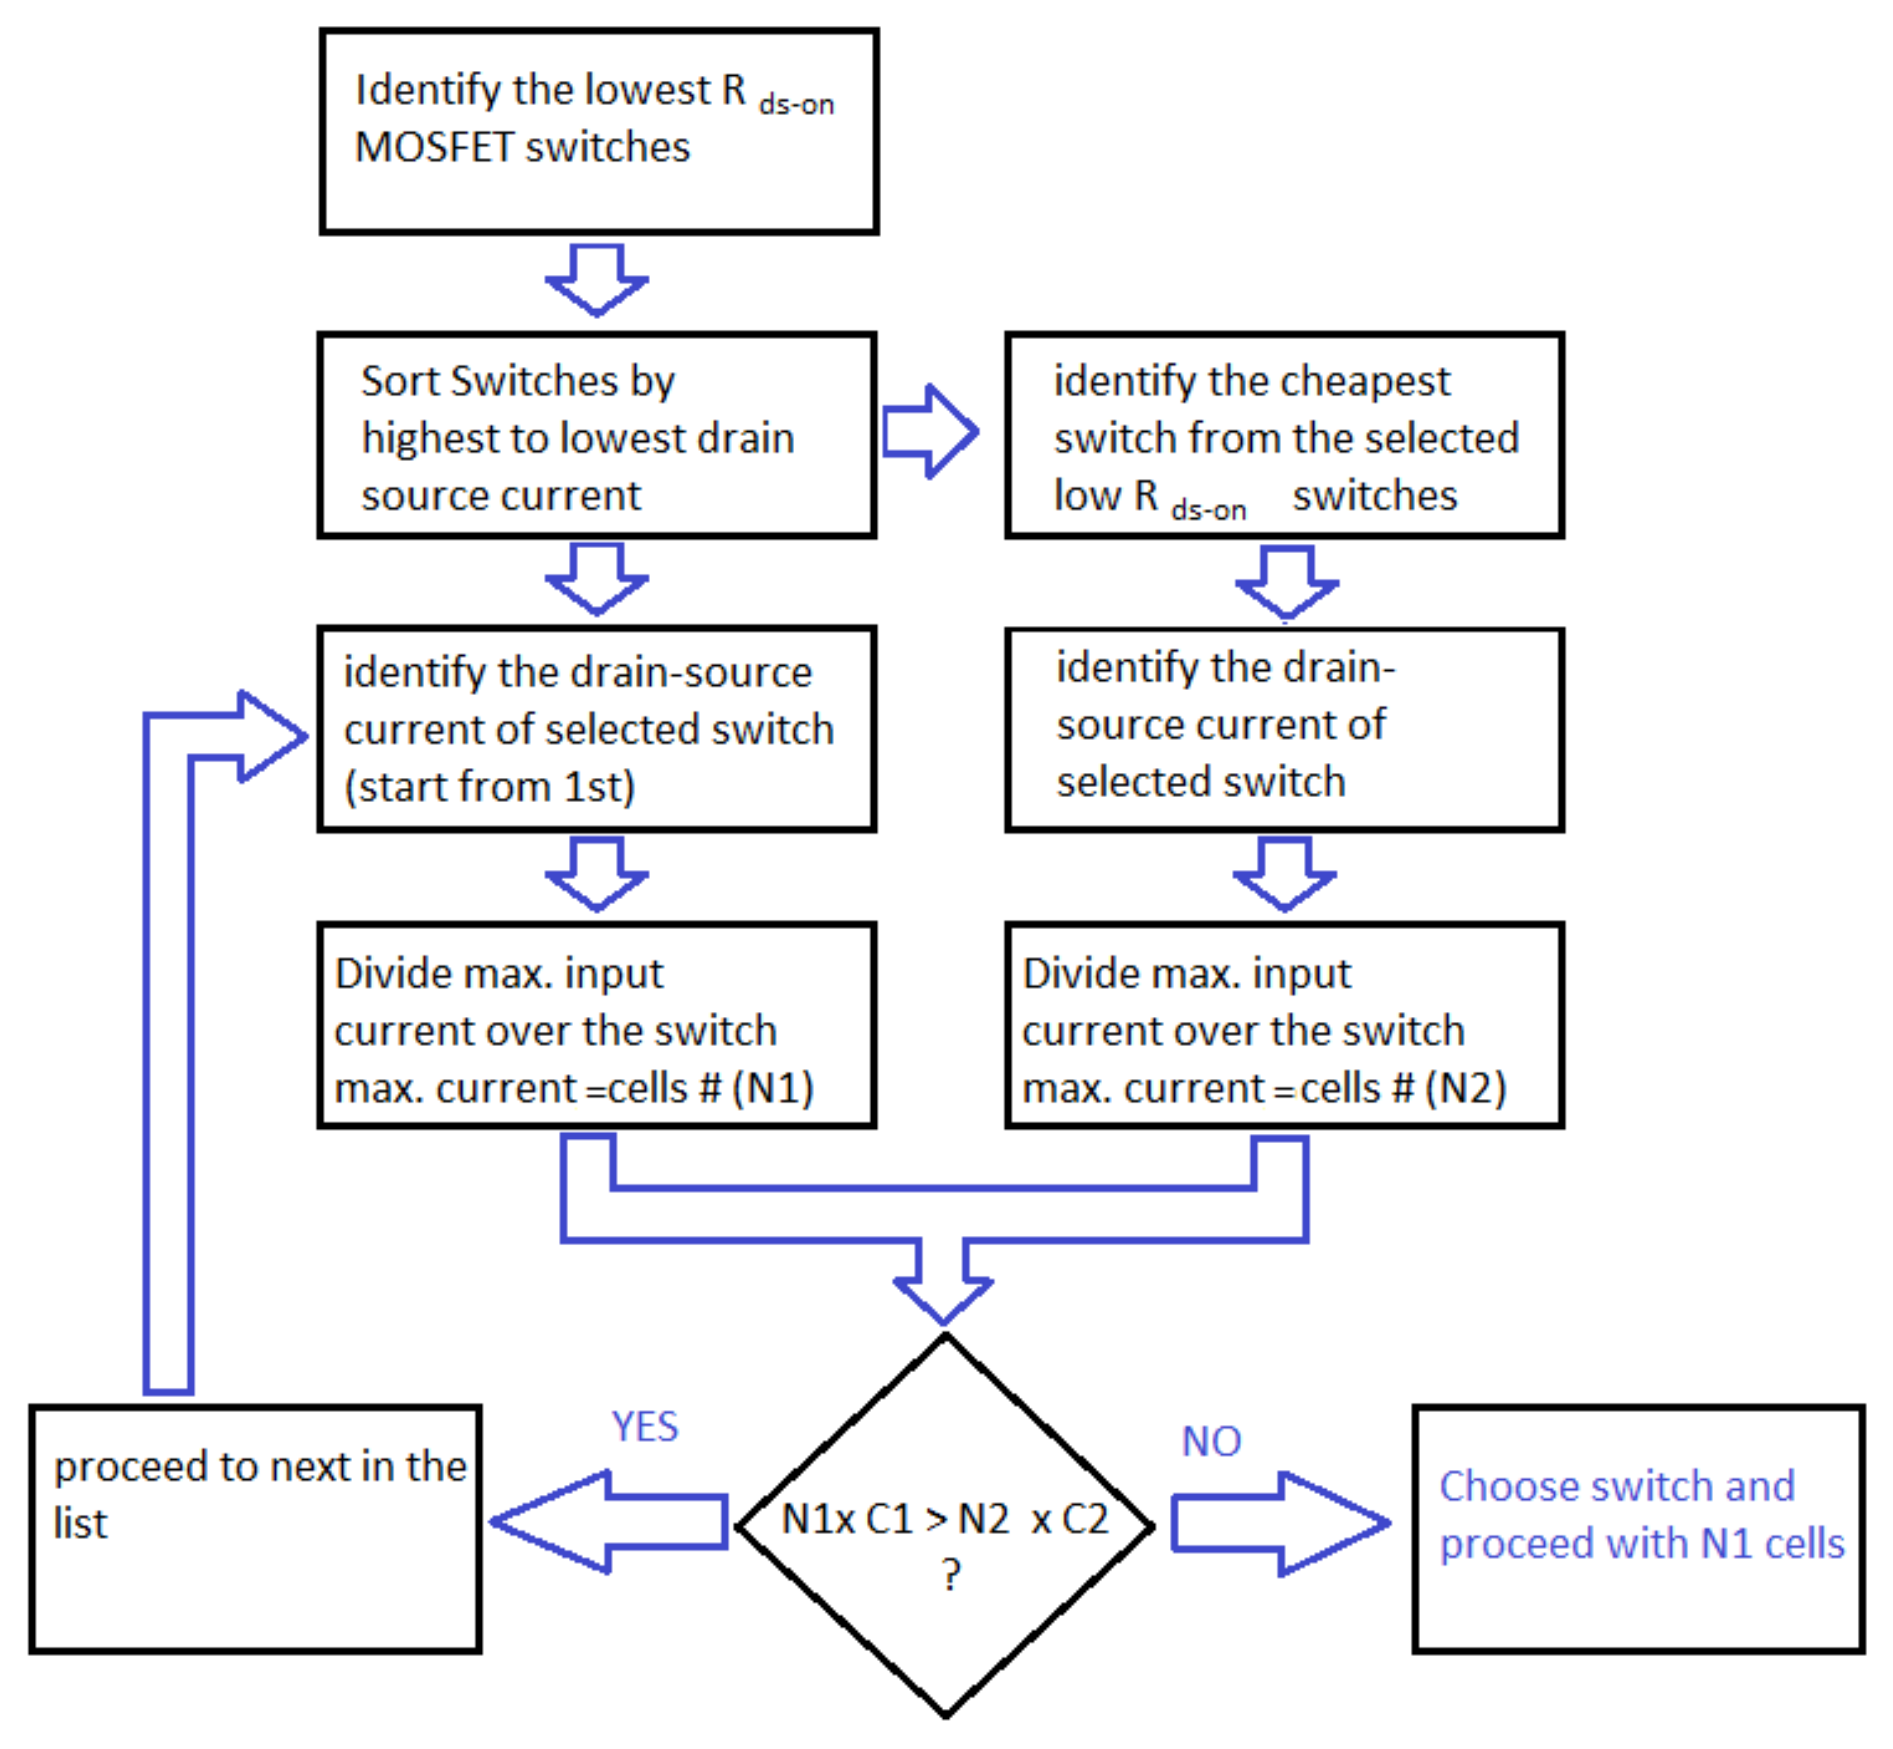
In order to simulate the thermal losses of the individual components of the circuit using PSIM’s thermal module, each component was modeled with its equivalent circuit, as shown in Figure 13. In the simulation, the ambient temperature and the thermal resistance of each of the components is also taken into account. The flowchart in Figure 12 illustrates the procedure used for selecting the number of cells in the multicell structure, ensuring no excessive cells are used. The first step is to identify the MOSFET switches with the lowest on-resistance (RDS−On).

Figure 13.
Equivalent circuits in PSIM thermal module for (a) diode, (b). inductor, (c). MOSFET.
All switches should have a reverse voltage breaking capacity higher than the input voltage of the source. Since the price of the switches tends to be proportional to the output current, the flowchart in Figure 14 compares the system cost with the lowest cost switch and the system cost of a multicell structure with the lowest RDS−On switches. The solution with the lowest system cost is selected from the product of the number of cells and the cost of the switches.

Figure 14.
Procedure for cell/switch selection.
6. Discussion
The results of the research have shown that parallel cells in multicell PSU structures can lead to significant overall energy efficiency improvements in PSUs. According to [27], currently, 1.8% of global energy is supplied to the ICT industry, such as datacenters and micro-datacenters. More than 50% of this energy is supplied to the power supply units of the ICT equipment. Therefore, the impact of PSUs with improved energy efficiency could lead to significant energy savings in the ICT industry globally, and could contribute to the efforts and targets set for global energy decrease, through more efficient systems. Of course, the improvement in efficiency comes at an extra cost, as a result of the additional components used. The total manufacturing cost of a PSU system consists of the electronic components, the controller, the mounting, the enclosure, and labor costs. A PSU consisting of multicell parts would have an increased cost on components (cells) and labor costs but would not have an increased cost on the controller, the mounting and the enclosure systems. Additionally, as mentioned earlier, the transformer systems which lead to a significant cost in PSU systems should be single (centralized) and thus no additional cost should arise.
Analyzing the industry’s readymade PSU prices, it can be observed that when using smaller units (as in those in multicell structures) for a 20 kW PSU (1 full rack), the cost is slightly higher. Table 4 compares the cost per watt using smaller PSUs for the same type and brand PSUs for different capacities.
The cost variation is in the order of 1–11%. For example, constructing a 20 kW power supply system with 20 pieces of RCP-1000-48 would cost 10.78% more than using 10 pieces of RCP-2000-48. Using 4 Mean Well RST-5000-48 instead of 2 RST-10000-48, would cost 0.8% more, but using Jetpower SP60-48/CR4830 instead of SPS200-48/SR4850 systems would cost less per installed Watt.
Finally, the proposed multicell IPOP structures have limited applicability for circuits that incorporate transformers. As stated in previous sections, transformers have no-load losses that do not favor decentralization (multicell structure). Centralization via the transformer part only of a multicell structure could overcome such limitations.
Further research will focus on multicell structures with planar transformers in matrix forms. Studies have shown that such transformers offer reduced no-load losses.
7. Conclusions
The results presented in this study demonstrate that using low-power modules such as the multicell structure for high-power PSU systems improves the energy efficiency. Using three rectifier cells and two buck PFC cells, a more efficient power supply system can be constructed for the same power output. Efficiency improvements of more than 1.2% can be achieved for 50% of the load and more than 2.1% efficiency improvement under full load. The concept of multicell efficiency improvement is experimentally proven through the testing of a three-cell, a two-cell and a single-cell buck converter system. It is shown that an efficiency improvement of up to 10% can be achieved for particular loads in the DC to DC conversion part. Energy efficiency improvements in PSUs leads directly to energy consumption minimization for the ICT industry.
The initial cost of a power supply system in a datacenter is about 5% of the total capital cost. A 10.78% increase in the power supply unit (i.e., the worst-case scenario) due to a multicell structure compared to a single cell one, corresponds to an additional 0.5% increase in relation to the total capital cost. The respective savings, however, are in the order of 2.1%, as previously mentioned. Looking ahead in the long-term, the cost benefit for this investment is viable, as with simple calculations the payback period is in the order of just 3.3 years.
Author Contributions
Conceptualization, M.C. and N.C.; methodology, M.C.; software, M.C.; validation, N.C., S.I. and A.P.; formal analysis, A.P.; investigation, M.C.; resources, A.P.; writing—original draft preparation, M.C.; writing—review and editing, N.C. and A.P.; visualization, S.I.; supervision, N.C.; funding acquisition, A.P. All authors have read and agreed to the published version of the manuscript.
Funding
This research received no external funding.
Institutional Review Board Statement
Not applicable.
Informed Consent Statement
There is no research on humans in this work.
Conflicts of Interest
The authors declare no conflict of interest.
References
- Miller, R. What 5G Will Mean to the Data Center Industry. Datacenter Frontier, 19 February 2019. [Google Scholar]
- Tuffaha, N. Evolution of 5G and the Impact on Data Center Infrastructure. Digital Reality, 29 January 2019. [Google Scholar]
- Shehabi, A.; Smith, S.; Sartor, D.; Brown, R.; Herrlin, M.; Koomey, J.; Masanet, E.; Horner, N.; Azevedo, I.; Lintner, W. United States Data Center Energy Usage Report; LBNL-1005775; Lawrence Berkeley National Laboratory: Berkeley, CA, USA, 2016.
- Xiao, Z.; Liu, H.; Havyarimana, V.; Li, T.; Wang, D. Analytical Study on Multi-Tier 5G Heterogeneous Small Cell Networks: Coverage Performance and Energy Efficiency. Sensors 2016, 16, 1854. [Google Scholar] [CrossRef] [PubMed] [Green Version]
- Zeng, F.; Li, Q.; Xiao, Z.; Havyarimana, V.; Bai, J. A Price-Based Optimization Strategy of Power Control and Resource Allocation in Full-Duplex Heterogeneous Macrocell-Femtocell Networks. IEEE Access 2018, 6, 42004–42013. [Google Scholar] [CrossRef]
- Jiang, H.; Xiao, Z.; Li, Z.; Xu, J.; Zeng, F.; Wang, D. An Energy-Efficient Framework for Internet of Things Underlaying Heterogeneous Small Cell Networks. IEEE Trans. Mob. Comput. 2020. [Google Scholar] [CrossRef]
- Energystar. Reduce Energy Losses from Uninterruptable Power Supply (UPS) Systems. Available online: https://www.energystar.gov/products/ (accessed on 11 October 2021).
- EPRI, 80 Plus Certified Power Supplies and Manufacturers. Available online: https://www.plugloadsolutions.com/80PlusPowerSuppliesDetail.aspx?id=0type=1 (accessed on 11 October 2021).
- STMicroelectronics. 48 v Direct Power Conversion. 2018. Available online: https://www.st.com/en/power-management/48-v-direct-power-conversion.html (accessed on 11 October 2021).
- Taranovich, S. Data Center Next Generation Power Supply Solutions for Improved Efficiency. EDN Network, 16 April 2016. [Google Scholar]
- Kasper, M.; Bortis, D.; Deboy, G.; Kolar, J.W. Design of a highly efficient (97.7%) and very compact (2.2 kw/dm_3) isolated ac–dc telecom power supply module based on the multicell isop converter approach. IEEE Trans. Power Electron. 2016, 32, 7750–7769. [Google Scholar] [CrossRef]
- Fekik, A.; Azar, A.T.; Kamal, N.A.; Serrano, F.E.; Hamida, M.L.; Denoun, H.; Yassa, N. Maximum Power Extraction from a Photovoltaic Panel Connected to a Multi-cell Converter. In Proceedings of the International Conference on Advanced Intelligent Systems and Informatics, Cairo, Egypt, 19–21 October 2020; pp. 873–882. [Google Scholar]
- Yuan, J.; Chen, Y.; Yang, Y.; Blaabjerg, F.; Chen, M. High Frequency Multicell Cascaded Quasi-Square-Wave Boost Converter. In Proceedings of the 2020 IEEE 21st Workshop on Control and Modeling for Power Electronics (COMPEL), Aalborg, Denmark, 9–12 November 2020. [Google Scholar]
- Luo, X.; Kang, L.; Lu, C.; Linghu, J.; Lin, H.; Hu, B. An Enhanced Multicell-to-Multicell Battery Equalizer Based on Bipolar-Resonant LC Converter. Electronics 2021, 10, 293. [Google Scholar] [CrossRef]
- Gupta, R.; Kumar, A. Control of Multi-cell AC/DC and Cascaded H-bridge DC/AC-basedAC/DC/AC Converter. Taylor and Francis. IETE J. Res. 2021. [Google Scholar] [CrossRef]
- Hosseinabadi, F.; Adib, E. A soft-switching step-down pfc converter with output voltage doubler and high power factor. IEEE Trans. Power Electron. 2019, 34, 416–424. [Google Scholar] [CrossRef]
- Rashid, M.H. Power Electronics Handbook; Butterworth-Heinemann: Oxford, UK, 2017. [Google Scholar]
- Chrysostomou, M.; Christofides, N.; Ioannou, S.; Marouchos, C. Design Guidelines for Energy Efficient AC to DC Power Supplies. In Proceedings of the IEEE IECON, Toronto, ON, Canada, 13–16 October 2021. [Google Scholar]
- Sharifi, S.; Babaei, M.; Monfared, M. A high gain buck PFC synchronous rectifier. In Proceedings of the Iranian Conference on Electrical Engineering (ICEE), Mashhad, Iran, 8–10 May 2018. [Google Scholar]
- Axelrod, B.; Berkovich, Y.; Ioinovici, A. Switched capacitor/switched-inductor structures for getting transformerless hybrid dc–dc pwm converters. IEEE Trans. Circuits Syst. 2008, 55, 687–696. [Google Scholar] [CrossRef]
- Fei, C.; Lee, F.C.; Li, Q. High-efficiency high-power-density llc converter with an integrated planar matrix transformer for high-output current applications. IEEE Trans. Ind. Electron. 2017, 64, 9072–9082. [Google Scholar] [CrossRef]
- Kim, D.K.; Moon, S.; Yeon, C.O.; Moon, G.W. High-efficiency llc resonant converter with high voltage gain using an auxiliary lc resonant circuit. IEEE Trans. Power Electron. 2016, 31, 6901–6909. [Google Scholar] [CrossRef]
- Mu, M.; Lee, F.C. Design and optimization of a 380–12 v high-frequency, high current llc converter with gan devices and planar matrix transformers. IEEE J. Emerg. Sel. Top. Power Electron. 2016, 4, 854–862. [Google Scholar]
- Abdel-Rahman, S.; Stückler, F.; Siu, K. Infineon Technologies: PFC Boost Converter Design Guide; Infineon Technologies AG: Munich, Germany, 2016. [Google Scholar]
- Ioannou, S.; Argyrou, M.C.; Marouchos, C.; Darwish, M. Efficiency investigation of a grid connected pv system with power smoothing. In Proceedings of the 54th International Universities Power Engineering Conference (UPEC), Bucharest, Romania, 3–6 September 2019; pp. 1–6. [Google Scholar]
- Ioannou, S.; Marouchos, C.; Darwish, M.; Putrus, G. Efficiency investigation of a protection and correction solid state device for low-voltage distribution networks. In Proceedings of the 54th International Universities Power Engineering Conference (UPEC), Bucharest, Romania, 3–6 September 2019; pp. 1–6. [Google Scholar]
- Bertoldi, P.; Avgerinou, M.; Castellazzi, L. Trends in Data Centre Energy Consumption under the European Code of Conduct for Data Centre Energy Efficiency; JRC Technical Report; Publications Office of the European Union: Luxembourg, 2017; ISBN 978-92-79-76445-5. [Google Scholar]

Publisher’s Note: MDPI stays neutral with regard to jurisdictional claims in published maps and institutional affiliations. |
© 2021 by the authors. Licensee MDPI, Basel, Switzerland. This article is an open access article distributed under the terms and conditions of the Creative Commons Attribution (CC BY) license (https://creativecommons.org/licenses/by/4.0/).