
Assessment of Solar Photovoltaic Water Pumping of WASA Tube Wells for Irrigation in Quetta Valley Aquifer

 , , , , , and
Abstract
:1. Introduction
2. Related Work
2.1. Overview of SPVWP Technology
2.2. Potential of Solar Irradiation
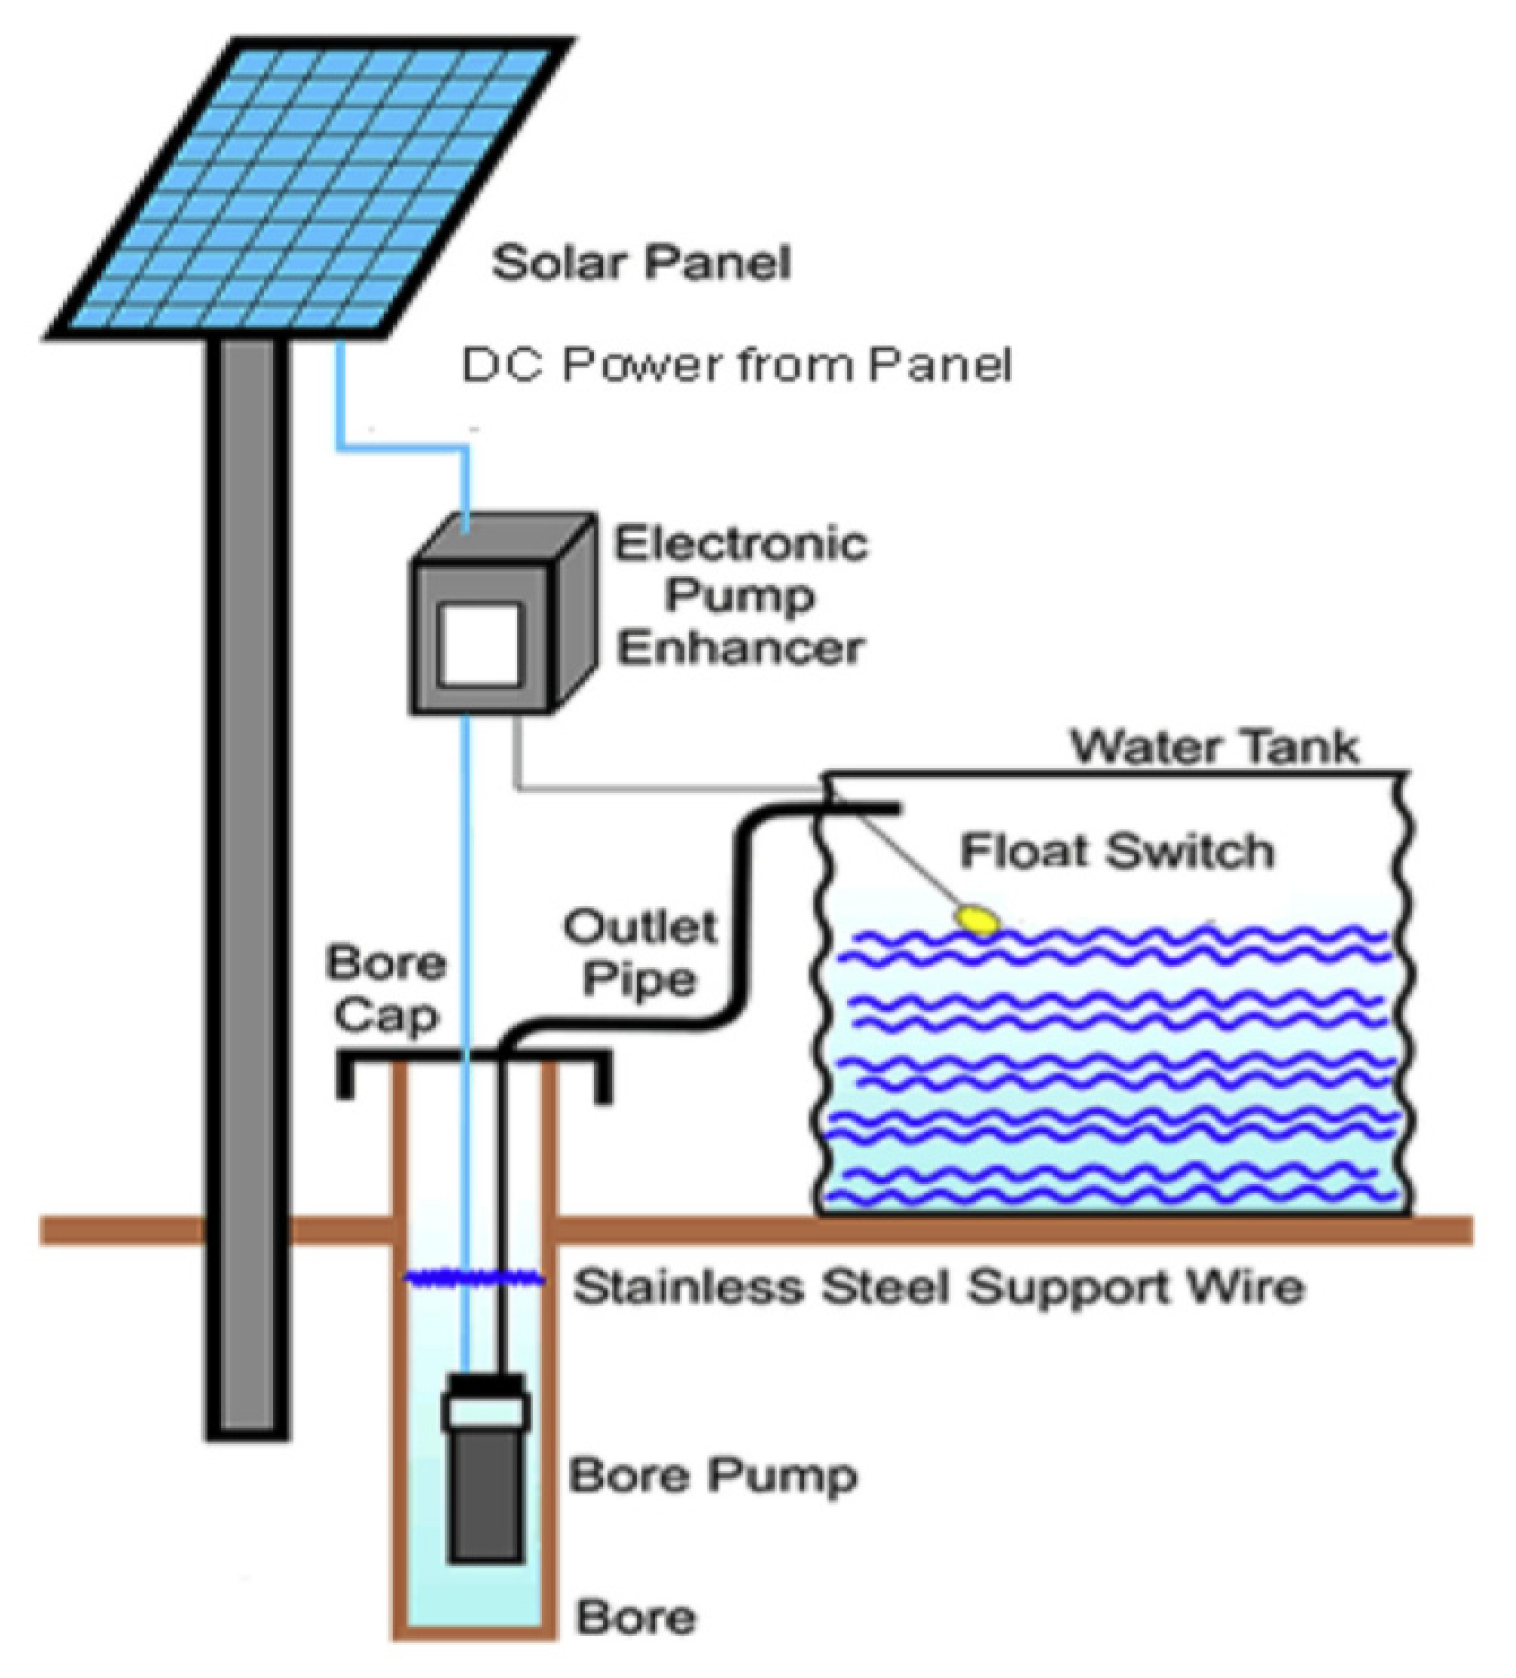
2.3. Groundwater Extraction System
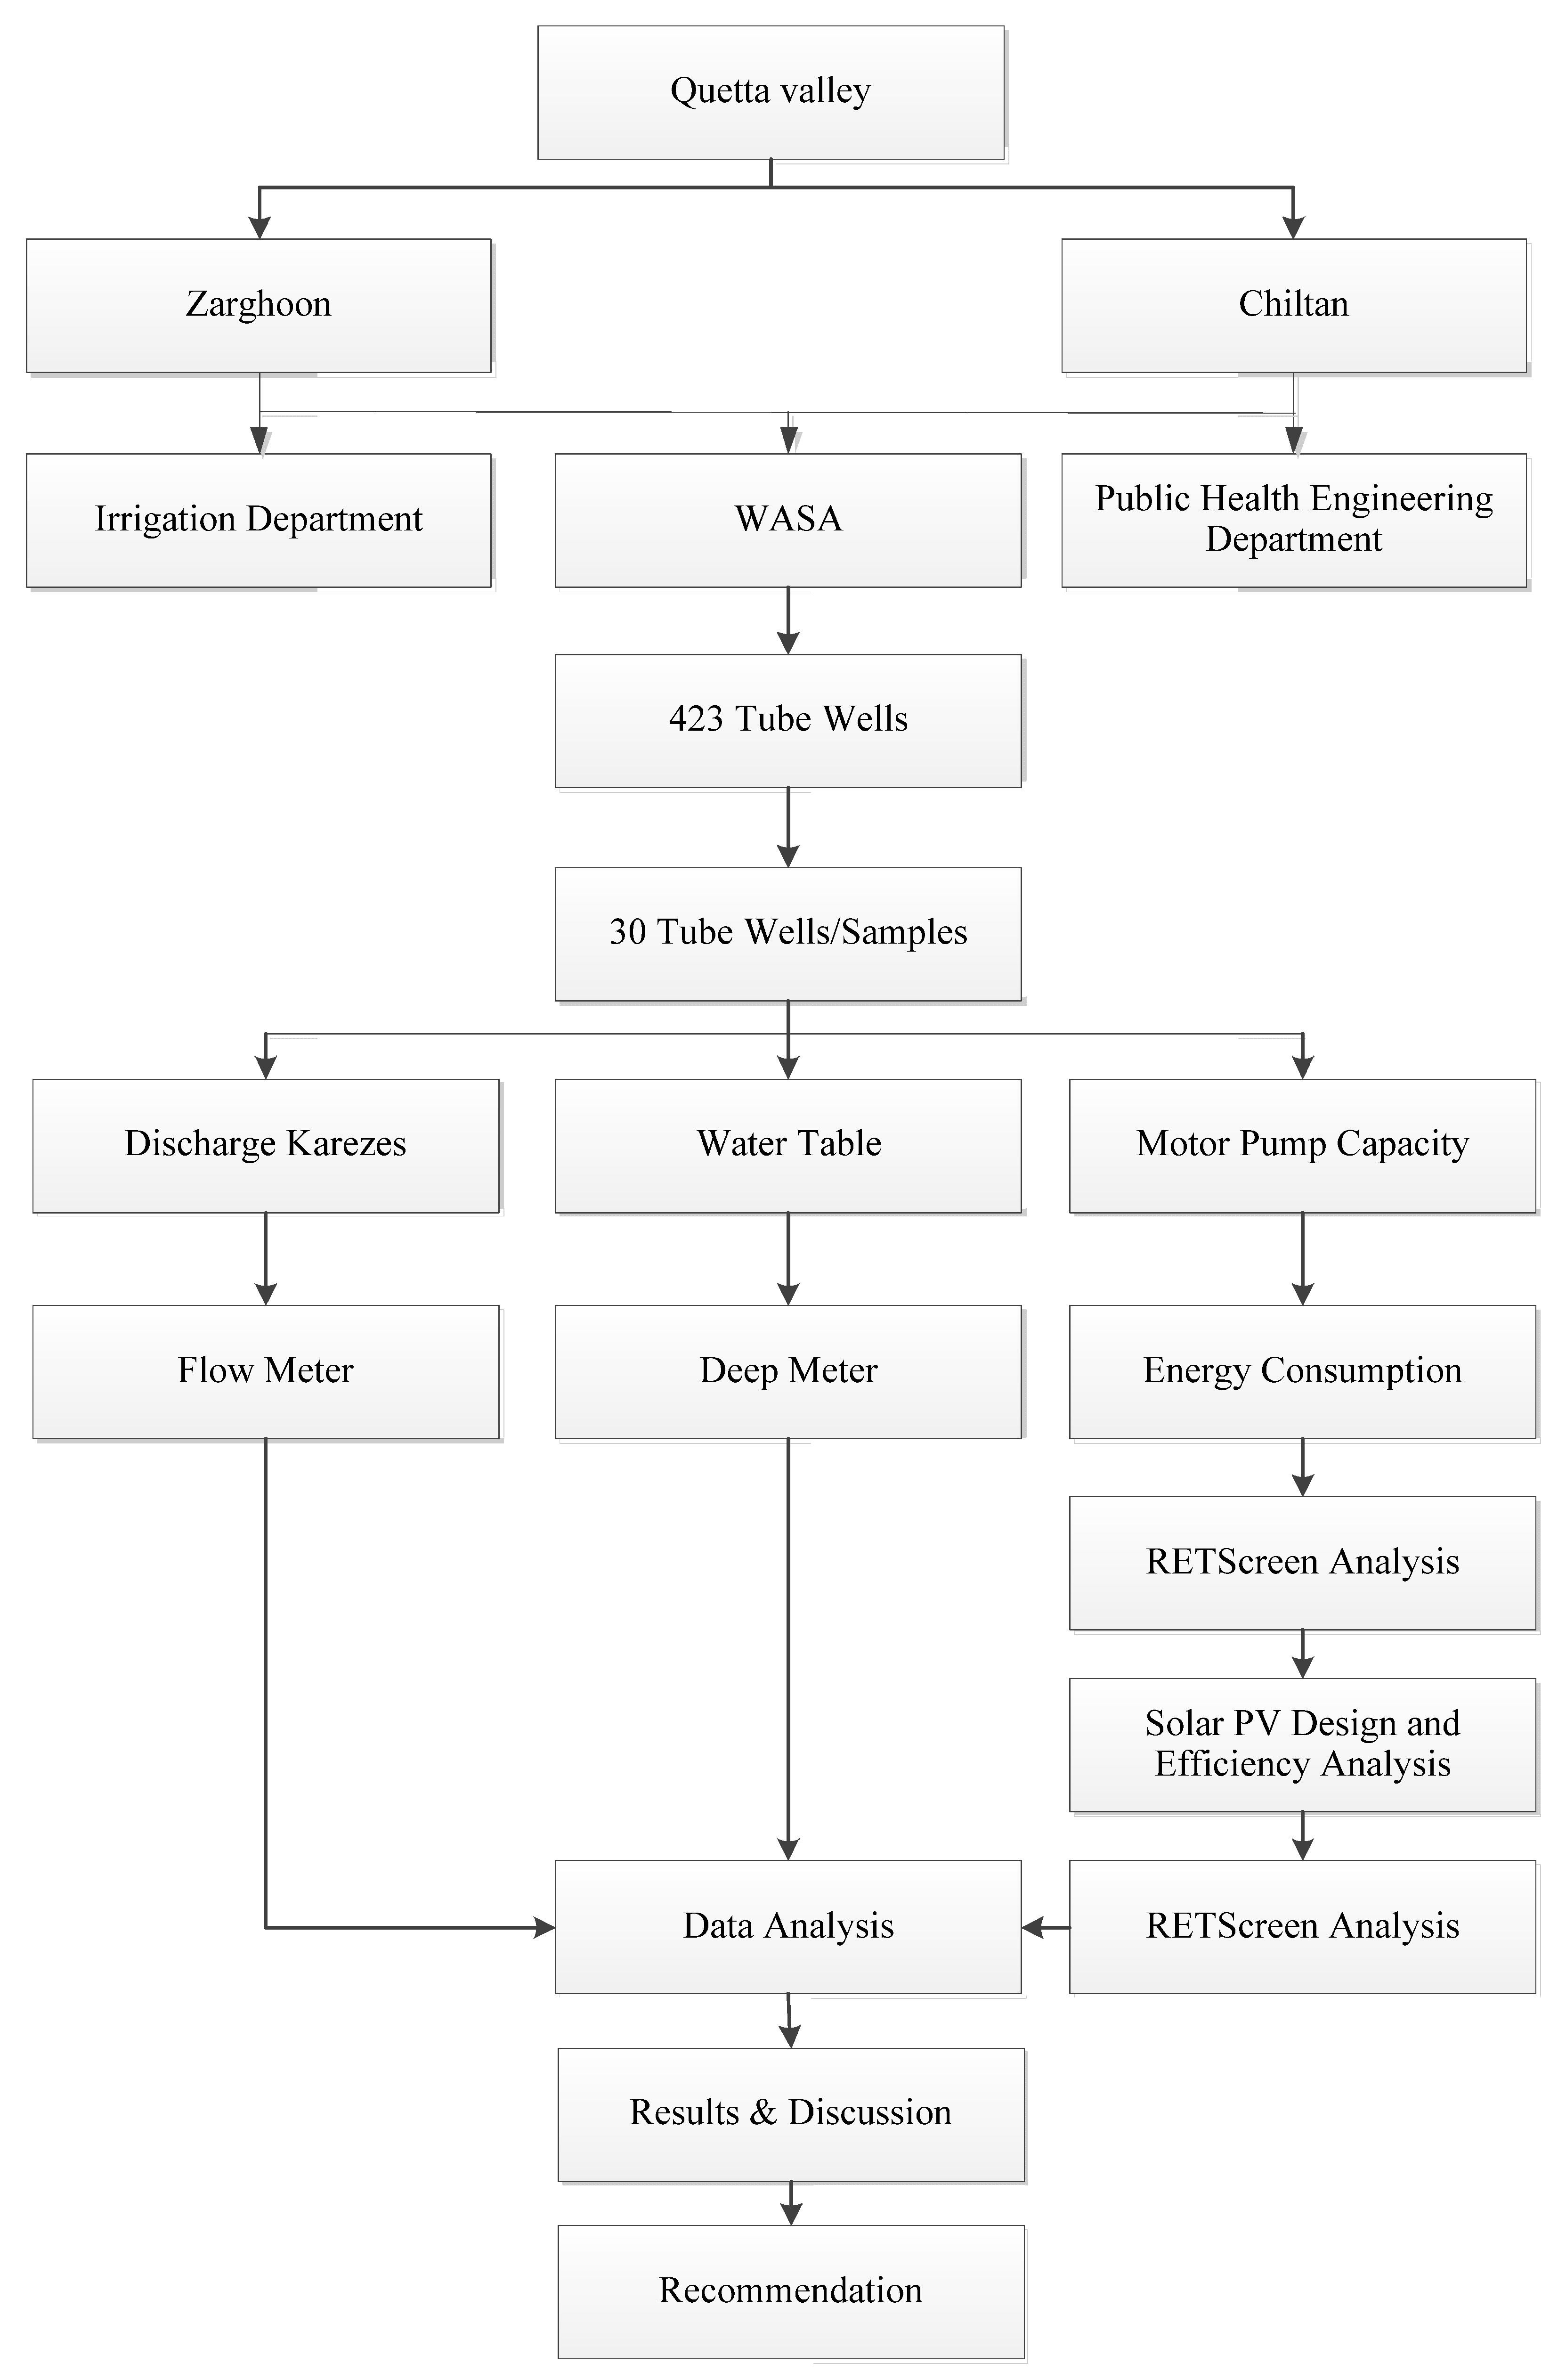
3. Material and Methods
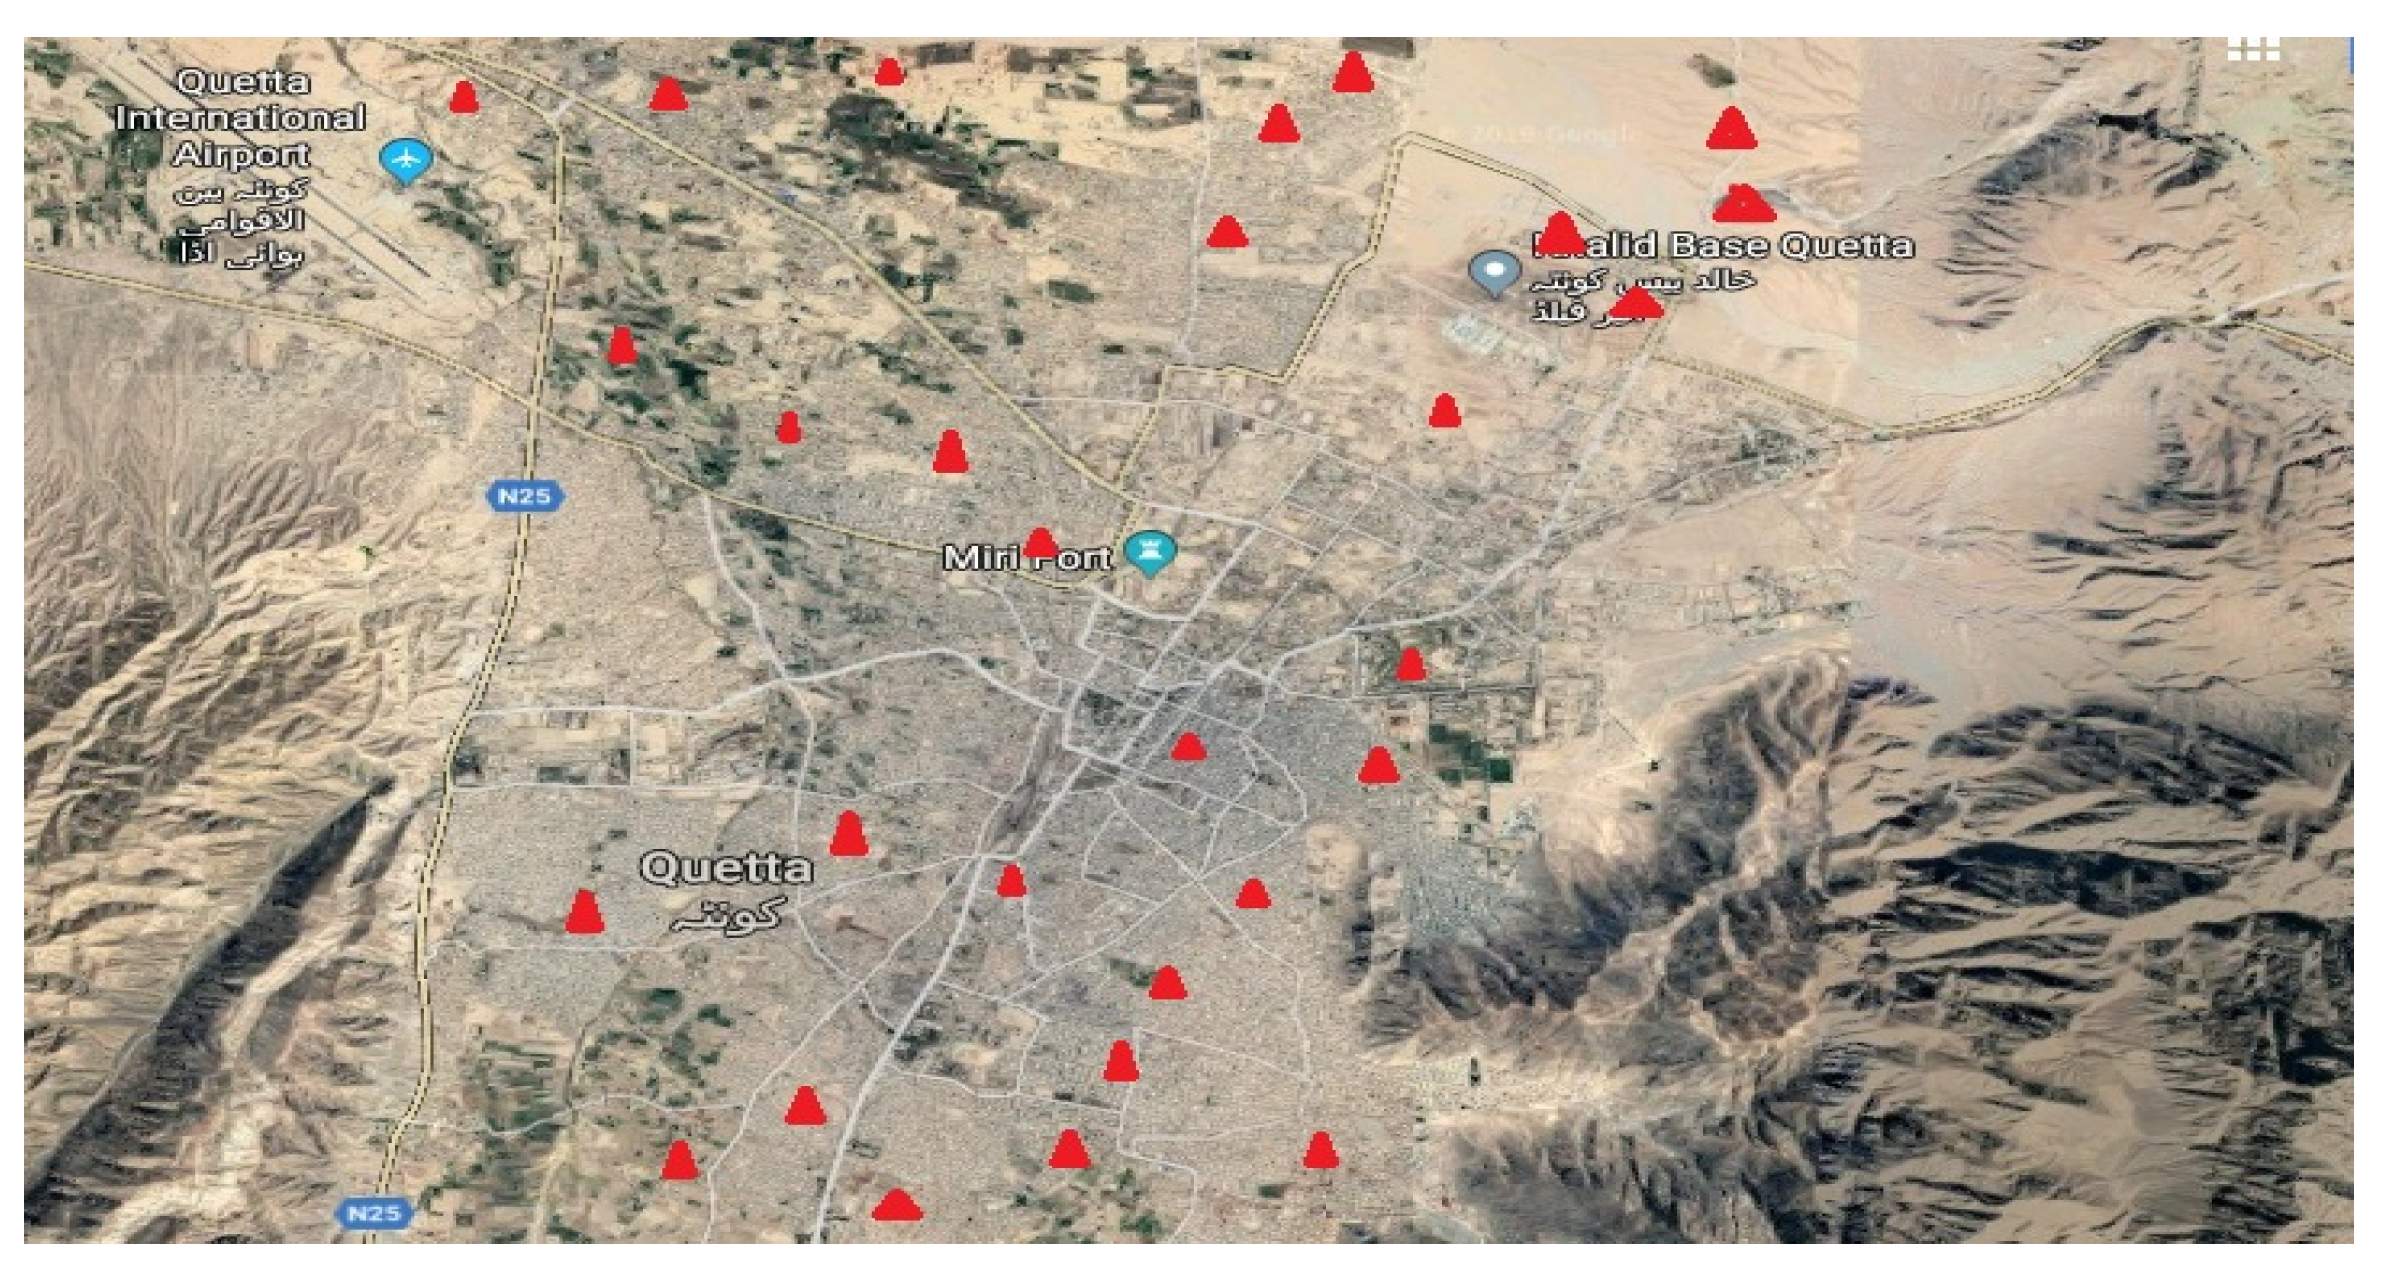
3.1. Study Area
3.2. Sampling Procedure of Different Parameter for the Study
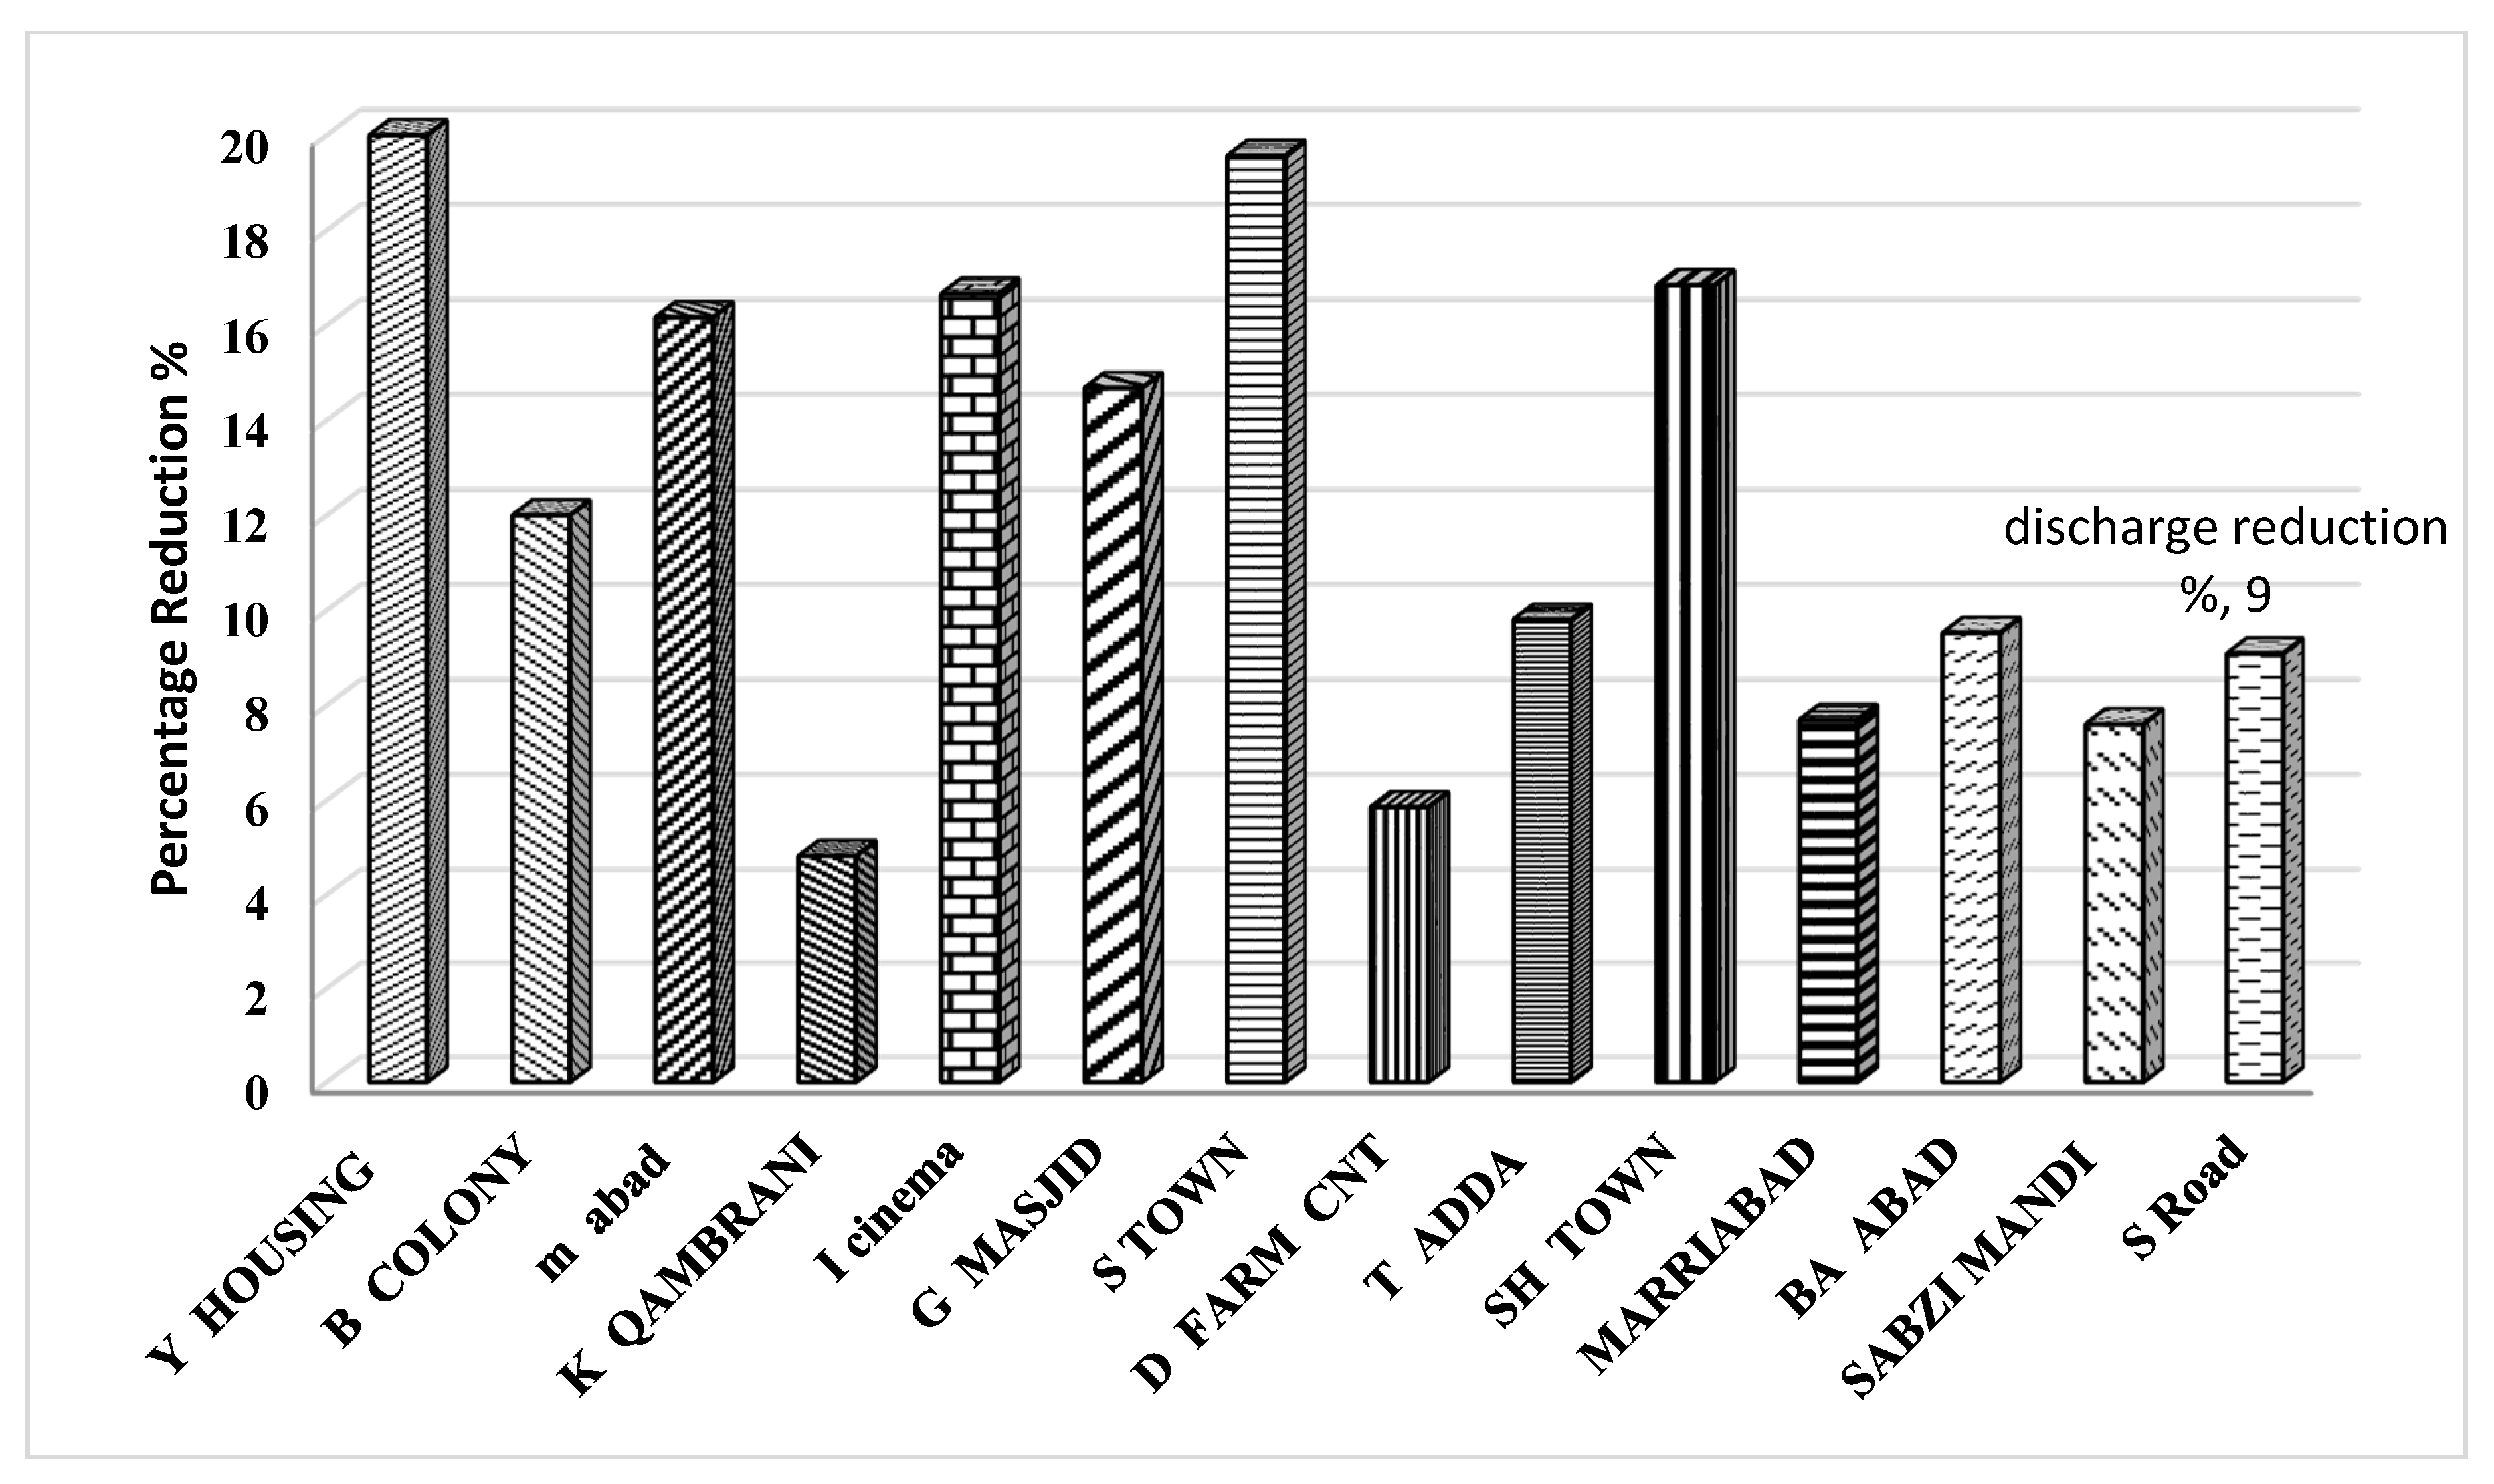
4. Results and Discussion
- The SPVWP should be recommended in the water deficit zone of Pakistan because of their efficiency, reliability, and cost-benefit ratio;
- The efficiency of SPV should be increased to achieve better results;
- The SPV system requires a large area, so compact systems should be preferred;
- The SPV system requires regular cleaning and minuteness for high efficiency;
- The temperature of SPV should be maintained by sprinkling water;
- The solar water pump should extract water at daytime so the low yielding borehole has time to refill.
5. Conclusions
Author Contributions
Funding
Data Availability Statement
Conflicts of Interest
References
- Chatzopoulos, T.; Domínguez, I.P.; Zampieri, M.; Toreti, A. Climate extremes and agricultural commodity markets: A global economic analysis of regionally simulated events. Weather Clim. Extrem. 2020, 27, 100193. [Google Scholar] [CrossRef]
- Yokomatsu, M.; Ishiwata, H.; Sawada, Y.; Suzuki, Y.; Koike, T.; Naseer, A.; Cheema, M.J.M. A multi-sector multi-region economic growth model of drought and the value of water: A case study in Pakistan. Int. J. Disaster Risk Reduct. 2020, 43, 101368. [Google Scholar] [CrossRef]
- Haider, S.; Ullah, K. Projected crop water requirement over agro-climatically diversified region of Pakistan. Agric. For. Meteorol. 2020, 281, 107824. [Google Scholar] [CrossRef]
- Mehmood, Q.; Mahmood, W.; Awais, M.; Rashid, H.; Rizwan, M.; Anjum, L.; Muneer, M.A.; Niaz, Y.; Hamid, S. Optimizing groundwater quality exploration for irrigation water wells using geophysical technique in semi-arid irrigated area of Pakistan. Groundw. Sustain. Dev. 2020, 11, 100397. [Google Scholar] [CrossRef]
- Bhutta, M.N.; Alam, M.M. Prospectives and limits of groundwater use in Pakistan. In Groundwater Research and Management: Integrating Science into Management Decisions; Sharma, B.R., Villholth, K.G., Sharma, K.D., Eds.; Malhotra Publishing House: New Delhi, India, 2006; pp. 105–114. [Google Scholar]
- Fienen, M.N.; Arshad, M. The international scale of the groundwater issue. In Integrated Groundwater Management; Springer: Berlin/Heidelberg, Germany, 2016; pp. 21–48. [Google Scholar]
- Khan, A.S.; Khan, S.D.; Kakar, D.M. Land subsidence and declining water resources in Quetta Valley, Pakistan. Environ. Earth Sci. 2013, 70, 2719–2727. [Google Scholar] [CrossRef]
- Hakhoo, N.; Bhat, G.M.; Pandita, S.; Hussain, G.; Haq, A.U.; Hafiz, M.; Ahmed, W.; Singh, Y.; Thusu, B. Natural hazards-their drivers, mechanisms and impacts in the Shyok-Nubra Valley, NW Himalaya, India. Int. J. Disaster Risk Reduct. 2019, 35, 101094. [Google Scholar] [CrossRef]
- Allouhi, A.; Buker, M.S.; El-houari, H.; Boharb, A.; Amine, M.B.; Kousksou, T.; Jamil, A. PV water pumping systems for domestic uses in remote areas: Sizing process, simulation and economic evaluation. Renew. Energy 2019, 132, 798–812. [Google Scholar] [CrossRef]
- Mukherjee, P.; Sengupta, T.K. Design and Fabrication of Solar-Powered Water Pumping Unit for Irrigation System. In Computational Advancement in Communication Circuits and Systems; Springer: Berlin/Heidelberg, Germany, 2020; pp. 89–102. [Google Scholar]
- Khair, S.M.; Mushtaq, S.; Reardon-Smith, K. Groundwater Governance in a Water-Starved Country: Public Policy, Farmers’ Perceptions, and Drivers of Tubewell Adoption in Balochistan, Pakistan. Groundwater 2015, 53, 626–637. [Google Scholar] [CrossRef] [PubMed] [Green Version]
- Khair, S.M.; Mushtaq, S.; Culas, R.J.; Hafeez, M. Groundwater markets under the water scarcity and declining watertable conditions: The upland Balochistan Region of Pakistan. Agric. Syst. 2012, 107, 21–32. [Google Scholar] [CrossRef] [Green Version]
- Owolabi, A.B.; Nsafon, B.E.K.; Roh, J.W.; Suh, D.; Huh, J.-S. Validating the techno-economic and environmental sustainability of solar PV technology in Nigeria using RETScreen Experts to assess its viability. Sustain. Energy Technol. Assess. 2019, 36, 100542. [Google Scholar] [CrossRef]
- Rathore, P.K.S.; Das, S.S.; Chauhan, D.S. Perspectives of solar photovoltaic water pumping for irrigation in India. Energy Strategy Rev. 2018, 22, 385–395. [Google Scholar] [CrossRef]
- Sharma, R.; Goel, S. Performance analysis of a 11.2 kWp roof top grid-connected PV system in Eastern India. Energy Rep. 2017, 3, 76–84. [Google Scholar] [CrossRef]
- Saleem, M. Benchmarking and Regulation for the Electricity Distribution Sector in Pakistan: Lessons for Developing Countries. South Asia Econ. J. 2007, 8, 117–138. [Google Scholar] [CrossRef]
- Mohanraj, M.; Chandramohan, P.; Sakthivel, M.; Kamaruzzaman, S. Performance of photovoltaic water pumping systems under the influence of panel cooling. Renew. Energy Focus 2019, 31, 31–44. [Google Scholar]
- Meunier, S.; Heinrich, M.; Quéval, L.; Cherni, J.A.; Vido, L.; Darga, A.; Dessante, P.; Multon, B.; Kitanidis, P.K.; Marchand, C. A validated model of a photovoltaic water pumping system for off-grid rural communities. Appl. Energy 2019, 241, 580–591. [Google Scholar] [CrossRef] [Green Version]
- Chandel, S.S.; Naik, M.N.; Chandel, R. Review of performance studies of direct coupled photovoltaic water pumping systems and case study. Renew. Sustain. Energy Rev. 2017, 76, 163–175. [Google Scholar] [CrossRef]
- Benghanem, M.; Daffallah, K.O.; Almohammedi, A. Estimation of daily flow rate of photovoltaic water pumping systems using solar radiation data. Results Phys. 2018, 8, 949–954. [Google Scholar] [CrossRef]
- Chilundo, R.J.; Neves, D.; Mahanjane, U.S. Photovoltaic water pumping systems for horticultural crops irrigation: Advancements and opportunities towards a green energy strategy for Mozambique. Sustain. Energy Technol. Assess. 2019, 33, 61–68. [Google Scholar] [CrossRef]
- Urban, F.; Geall, S.; Wang, Y. Solar PV and solar water heaters in China: Different pathways to low carbon energy. Renew. Sustain. Energy Rev. 2016, 64, 531–542. [Google Scholar] [CrossRef] [Green Version]


| Month | KWH | Bill (PKR) |
|---|---|---|
| January | 19,320 | 239,124 |
| February | 19,950 | 257,496 |
| March | 17,360 | 225,706 |
| April | 18,240 | 477,545 |
| May | 15,200 | 289,342 |
| June | 15,720 | 280,769 |
| July | 14,050 | 255,308 |
| August | 18,960 | 603,296 |
| September | 16,240 | 283,701 |
| October | 14,720 | 597,234 |
| November | 16,840 | 661,389 |
| December | 15,200 | 966,765 |
| Months | Solar Radiation (KWh/m2/d) | Surface Temperature (°C) |
|---|---|---|
| 1 | 3.42 | 6.45 |
| 2 | 4.25 | 9.17 |
| 3 | 4.78 | 15.61 |
| 4 | 6.25 | 23.63 |
| 5 | 7.03 | 29.51 |
| 6 | 7.75 | 33.75 |
| 7 | 7.00 | 34.04 |
| 8 | 6.64 | 32.11 |
| 9 | 6.42 | 28.90 |
| 10 | 5.42 | 21.46 |
| 11 | 4.11 | 14.51 |
| 12 | 3.33 | 8.73 |
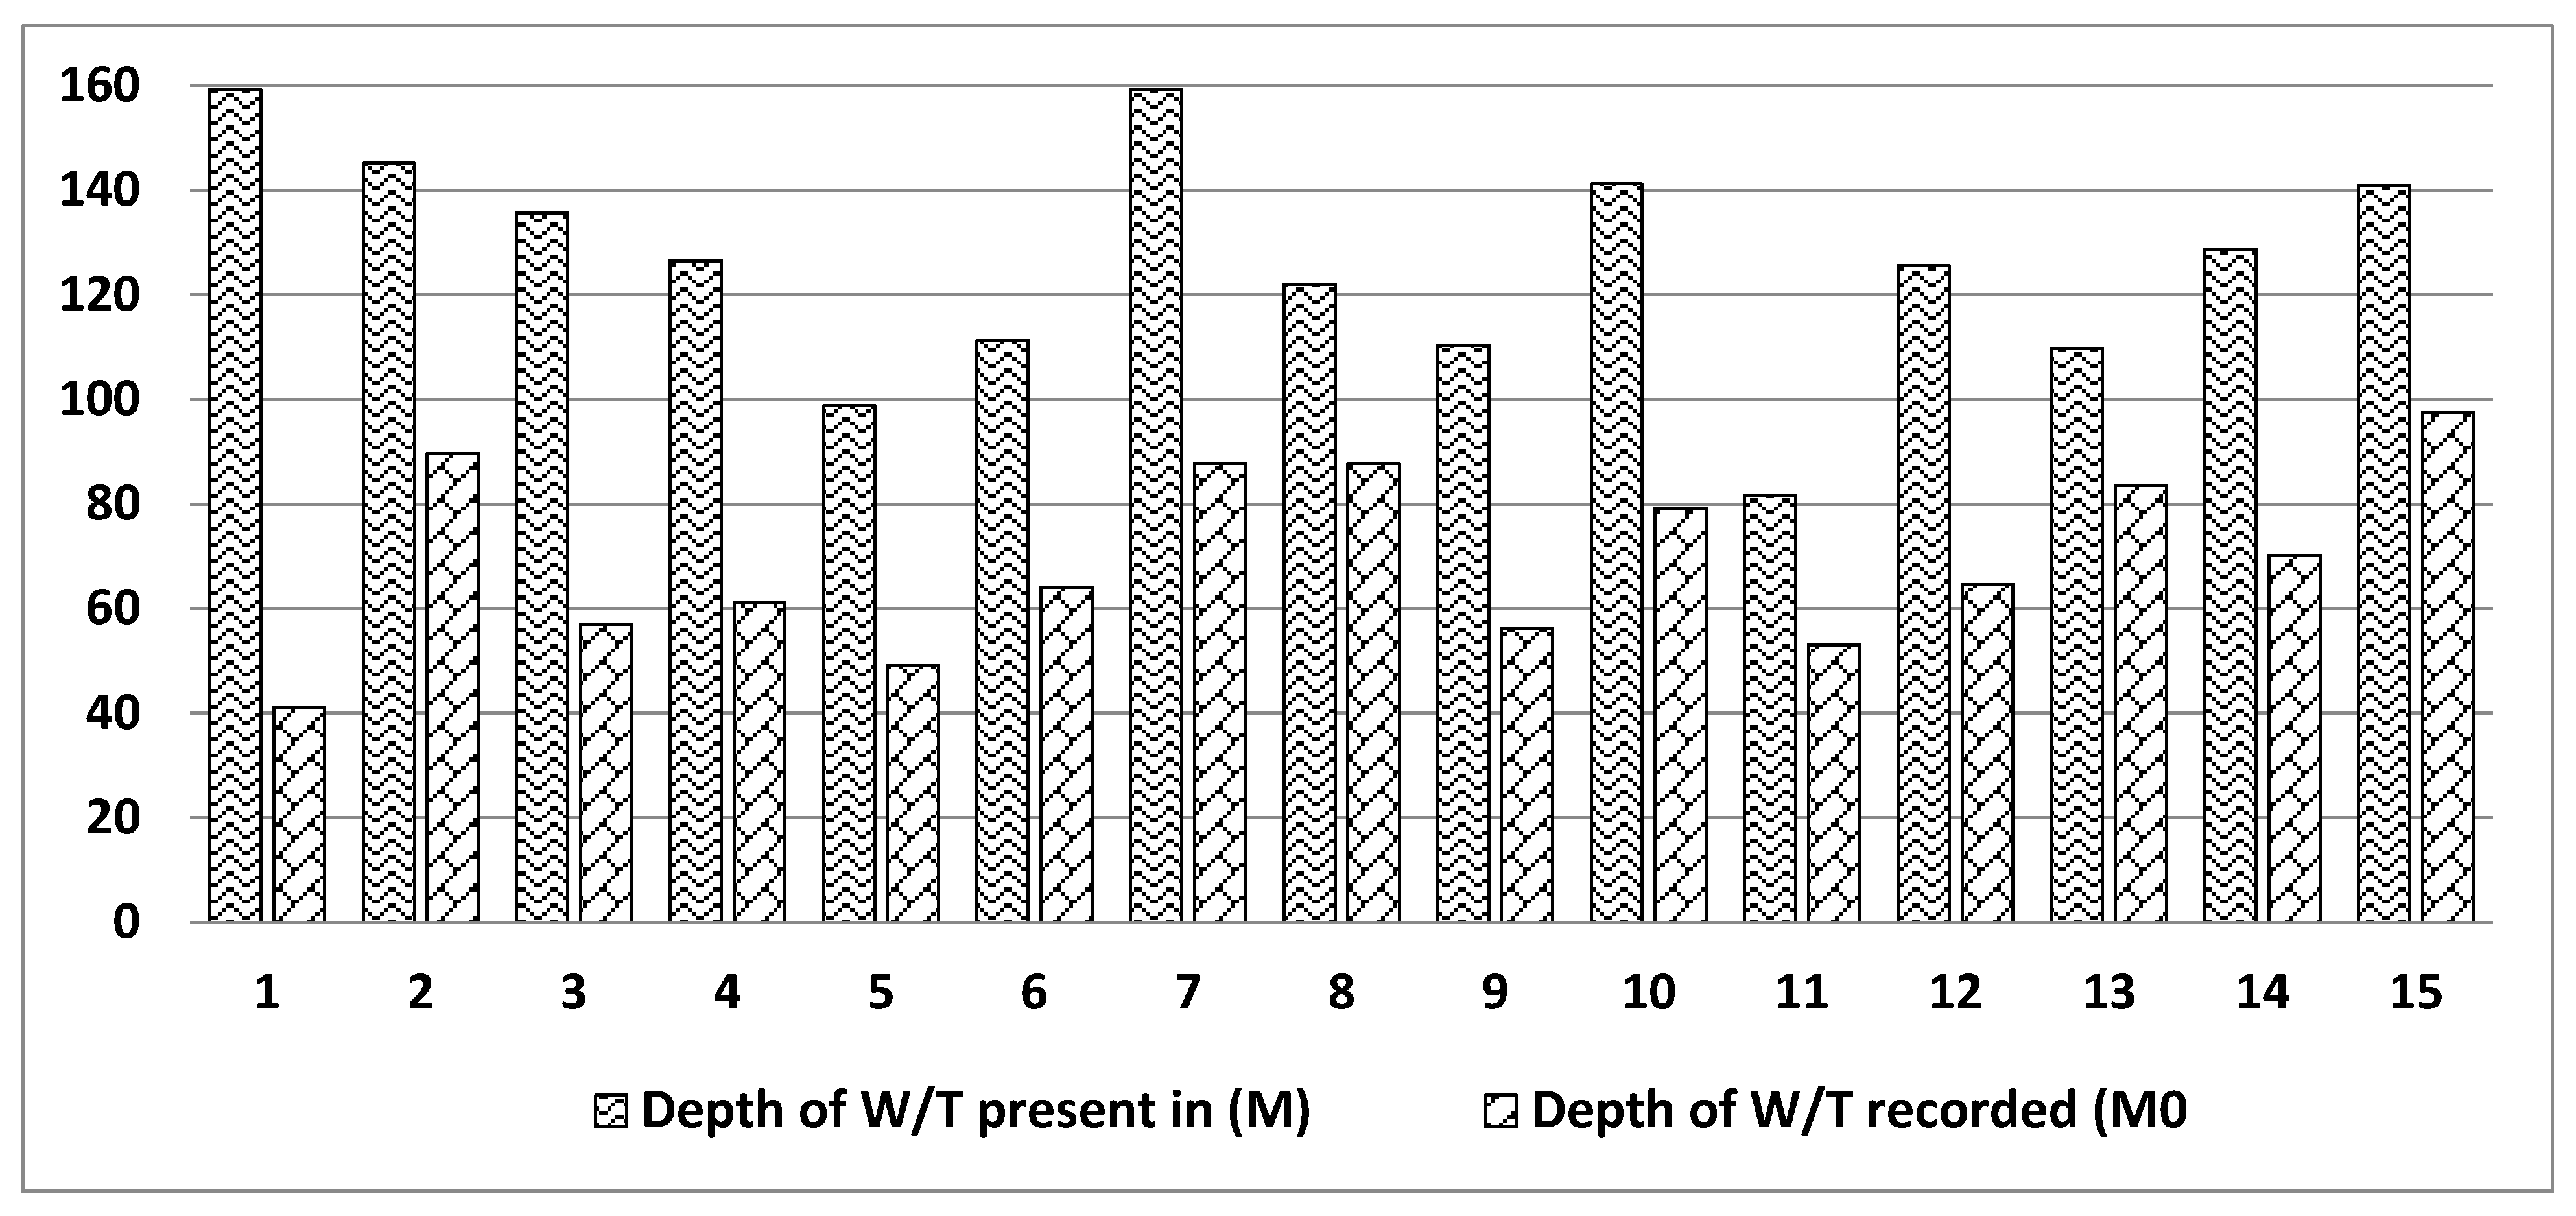
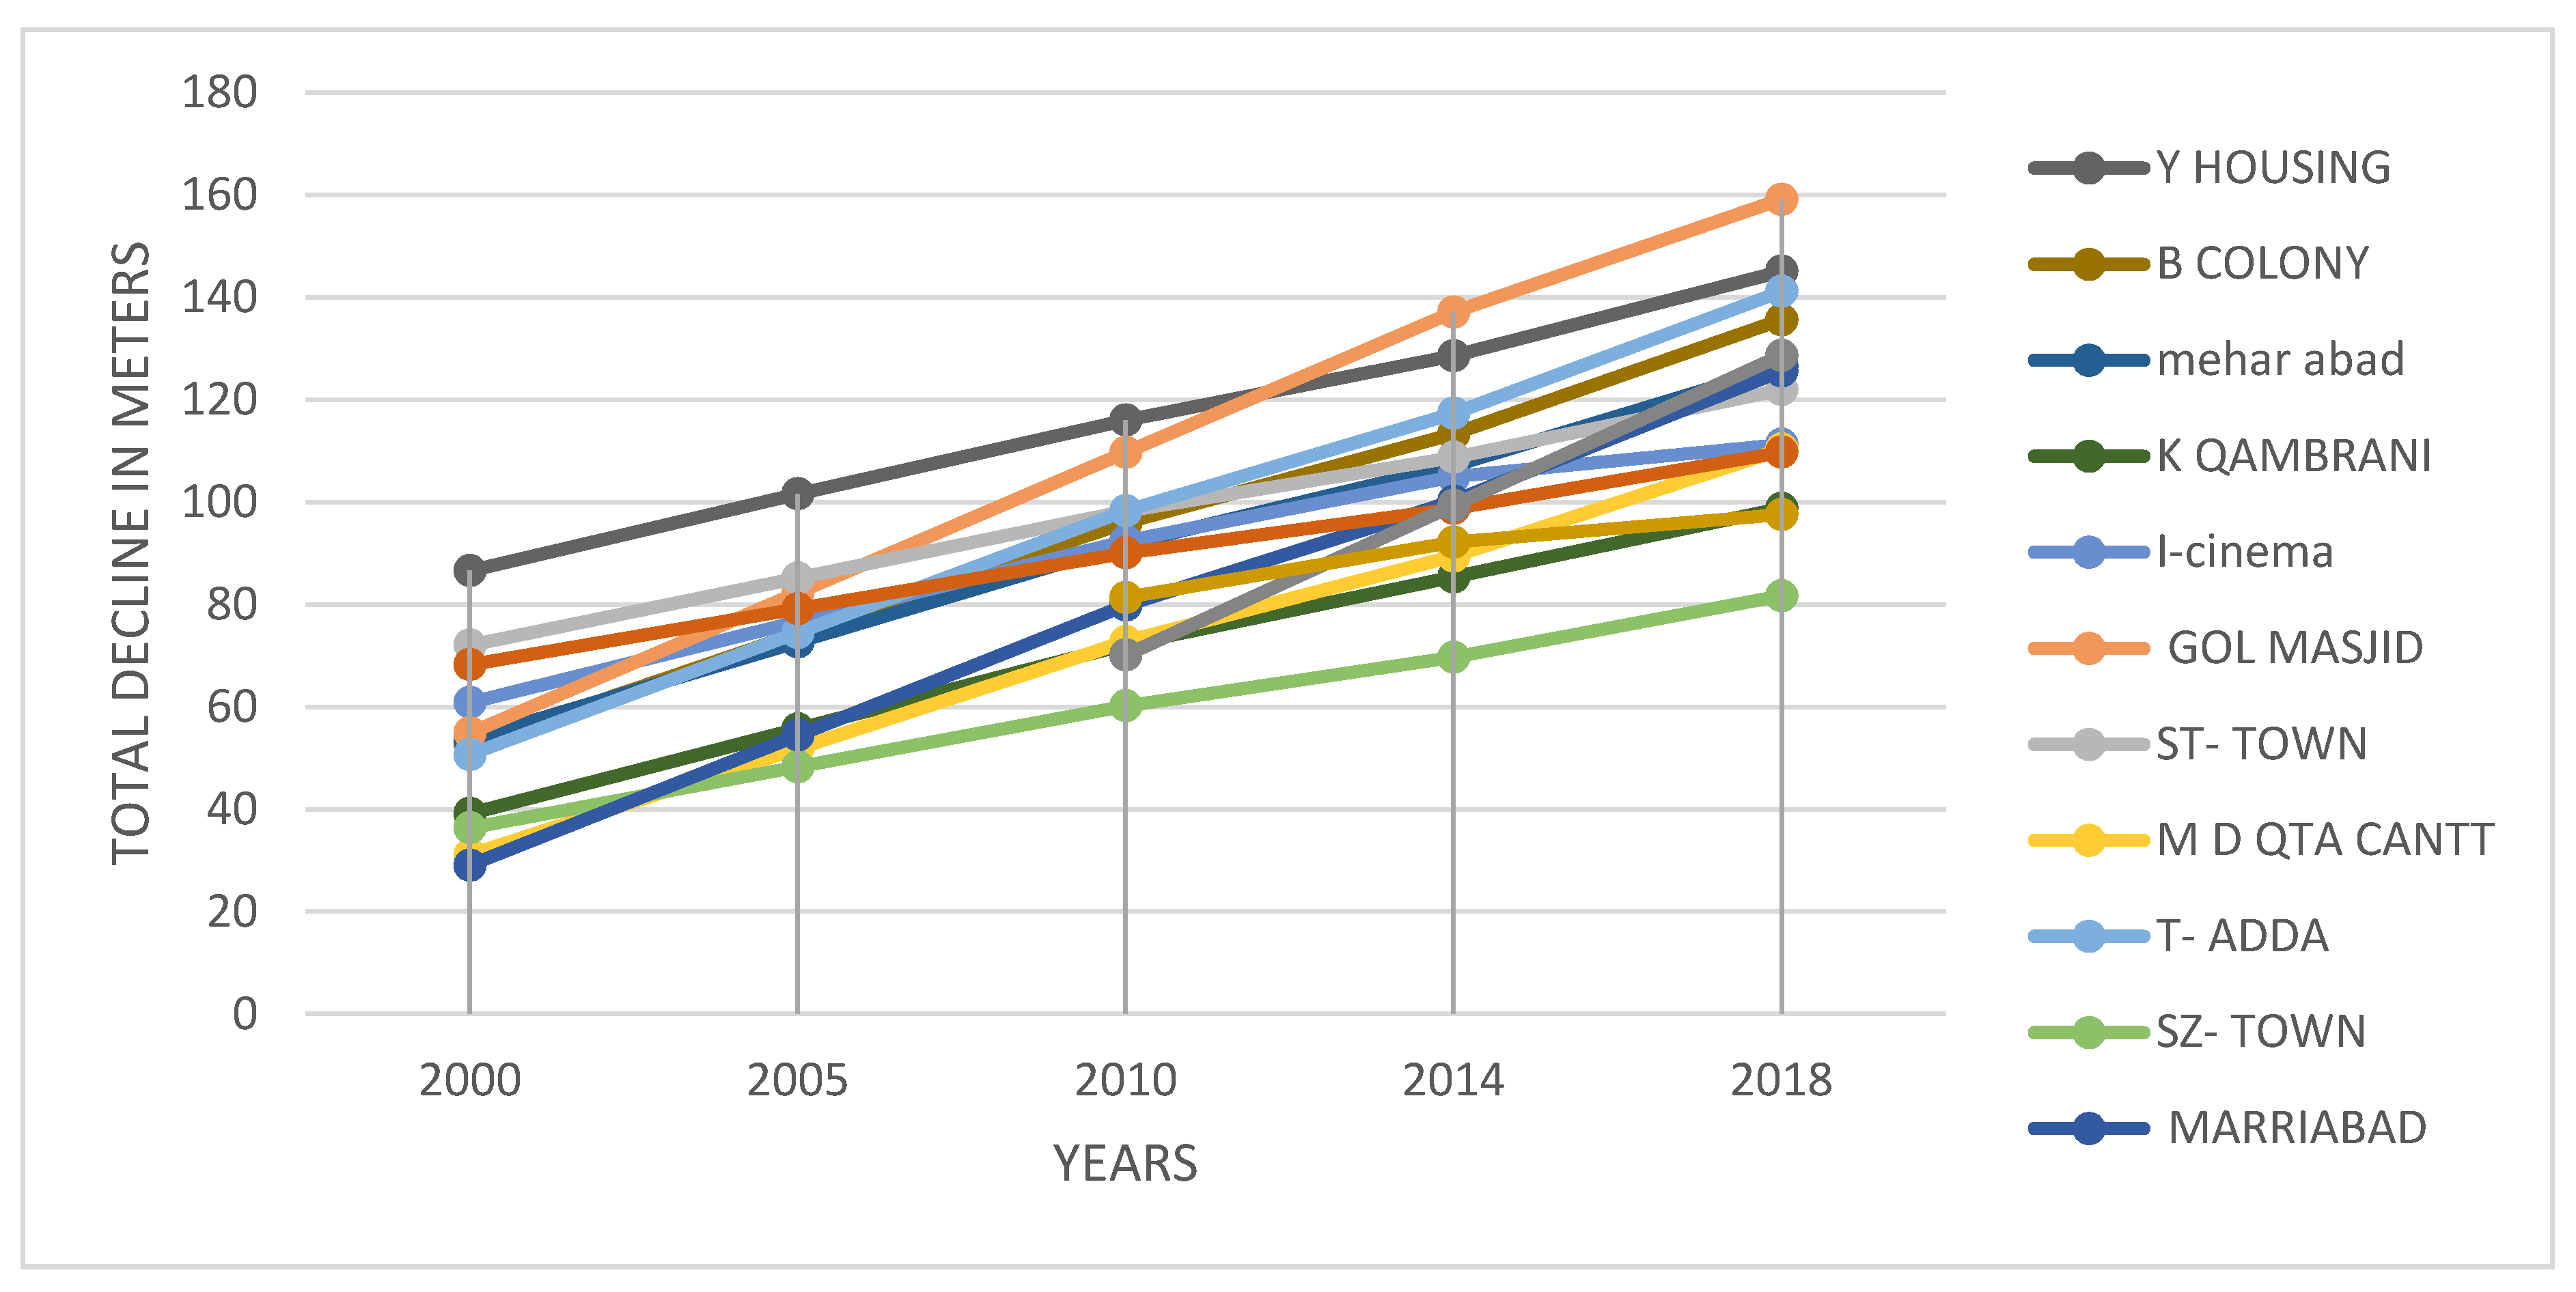
| S.NO | Name of T/W | Date of Installation | Present Discharge GPM (US) | Initial Discharge GPM (US) | Depth of W/T Present (M) | Depth of W/T Recorded (M) | Total Decline (M) |
|---|---|---|---|---|---|---|---|
| 1 | P Abad | 1987 | 240 | 159 | 41 | 118 | |
| 2 | Y Housing | 2001 | 60 | 75 | 145 | 89 | 56 |
| 3 | B Colony | 2001 | 132 | 150 | 135 | 57 | 78 |
| 4 | M Abbad | 2002 | 140 | 167 | 126 | 61 | 65 |
| 5 | K Qambrani | 2003 | 138 | 145 | 98 | 49 | 49 |
| 6 | I Cinema | 2004 | 75 | 90 | 111 | 64 | 47 |
| 7 | G Masjid | 2006 | 93 | 109 | 159 | 87 | 72 |
| 8 | S Town | 2006 | 74 | 92 | 121 | 87 | 34 |
| 9 | D Farm Cnt | 2006 | 193 | 205 | 110 | 56 | 54 |
| 10 | T Adda | 2006 | 92 | 102 | 141 | 79 | 62 |
| 11 | Sh Town | 2007 | 79 | 95 | 81 | 53 | 28 |
| 12 | Marriabad | 2007 | 60 | 65 | 125 | 64 | 61 |
| 13 | Ba Abad | 2007 | 76 | 84 | 109 | 83 | 26 |
| 14 | Sabzi Mandi | 2010 | 231 | 250 | 128 | 70 | 58 |
| 15 | S Road | 2015 | 30 | 33 | 140 | 97 | 43 |
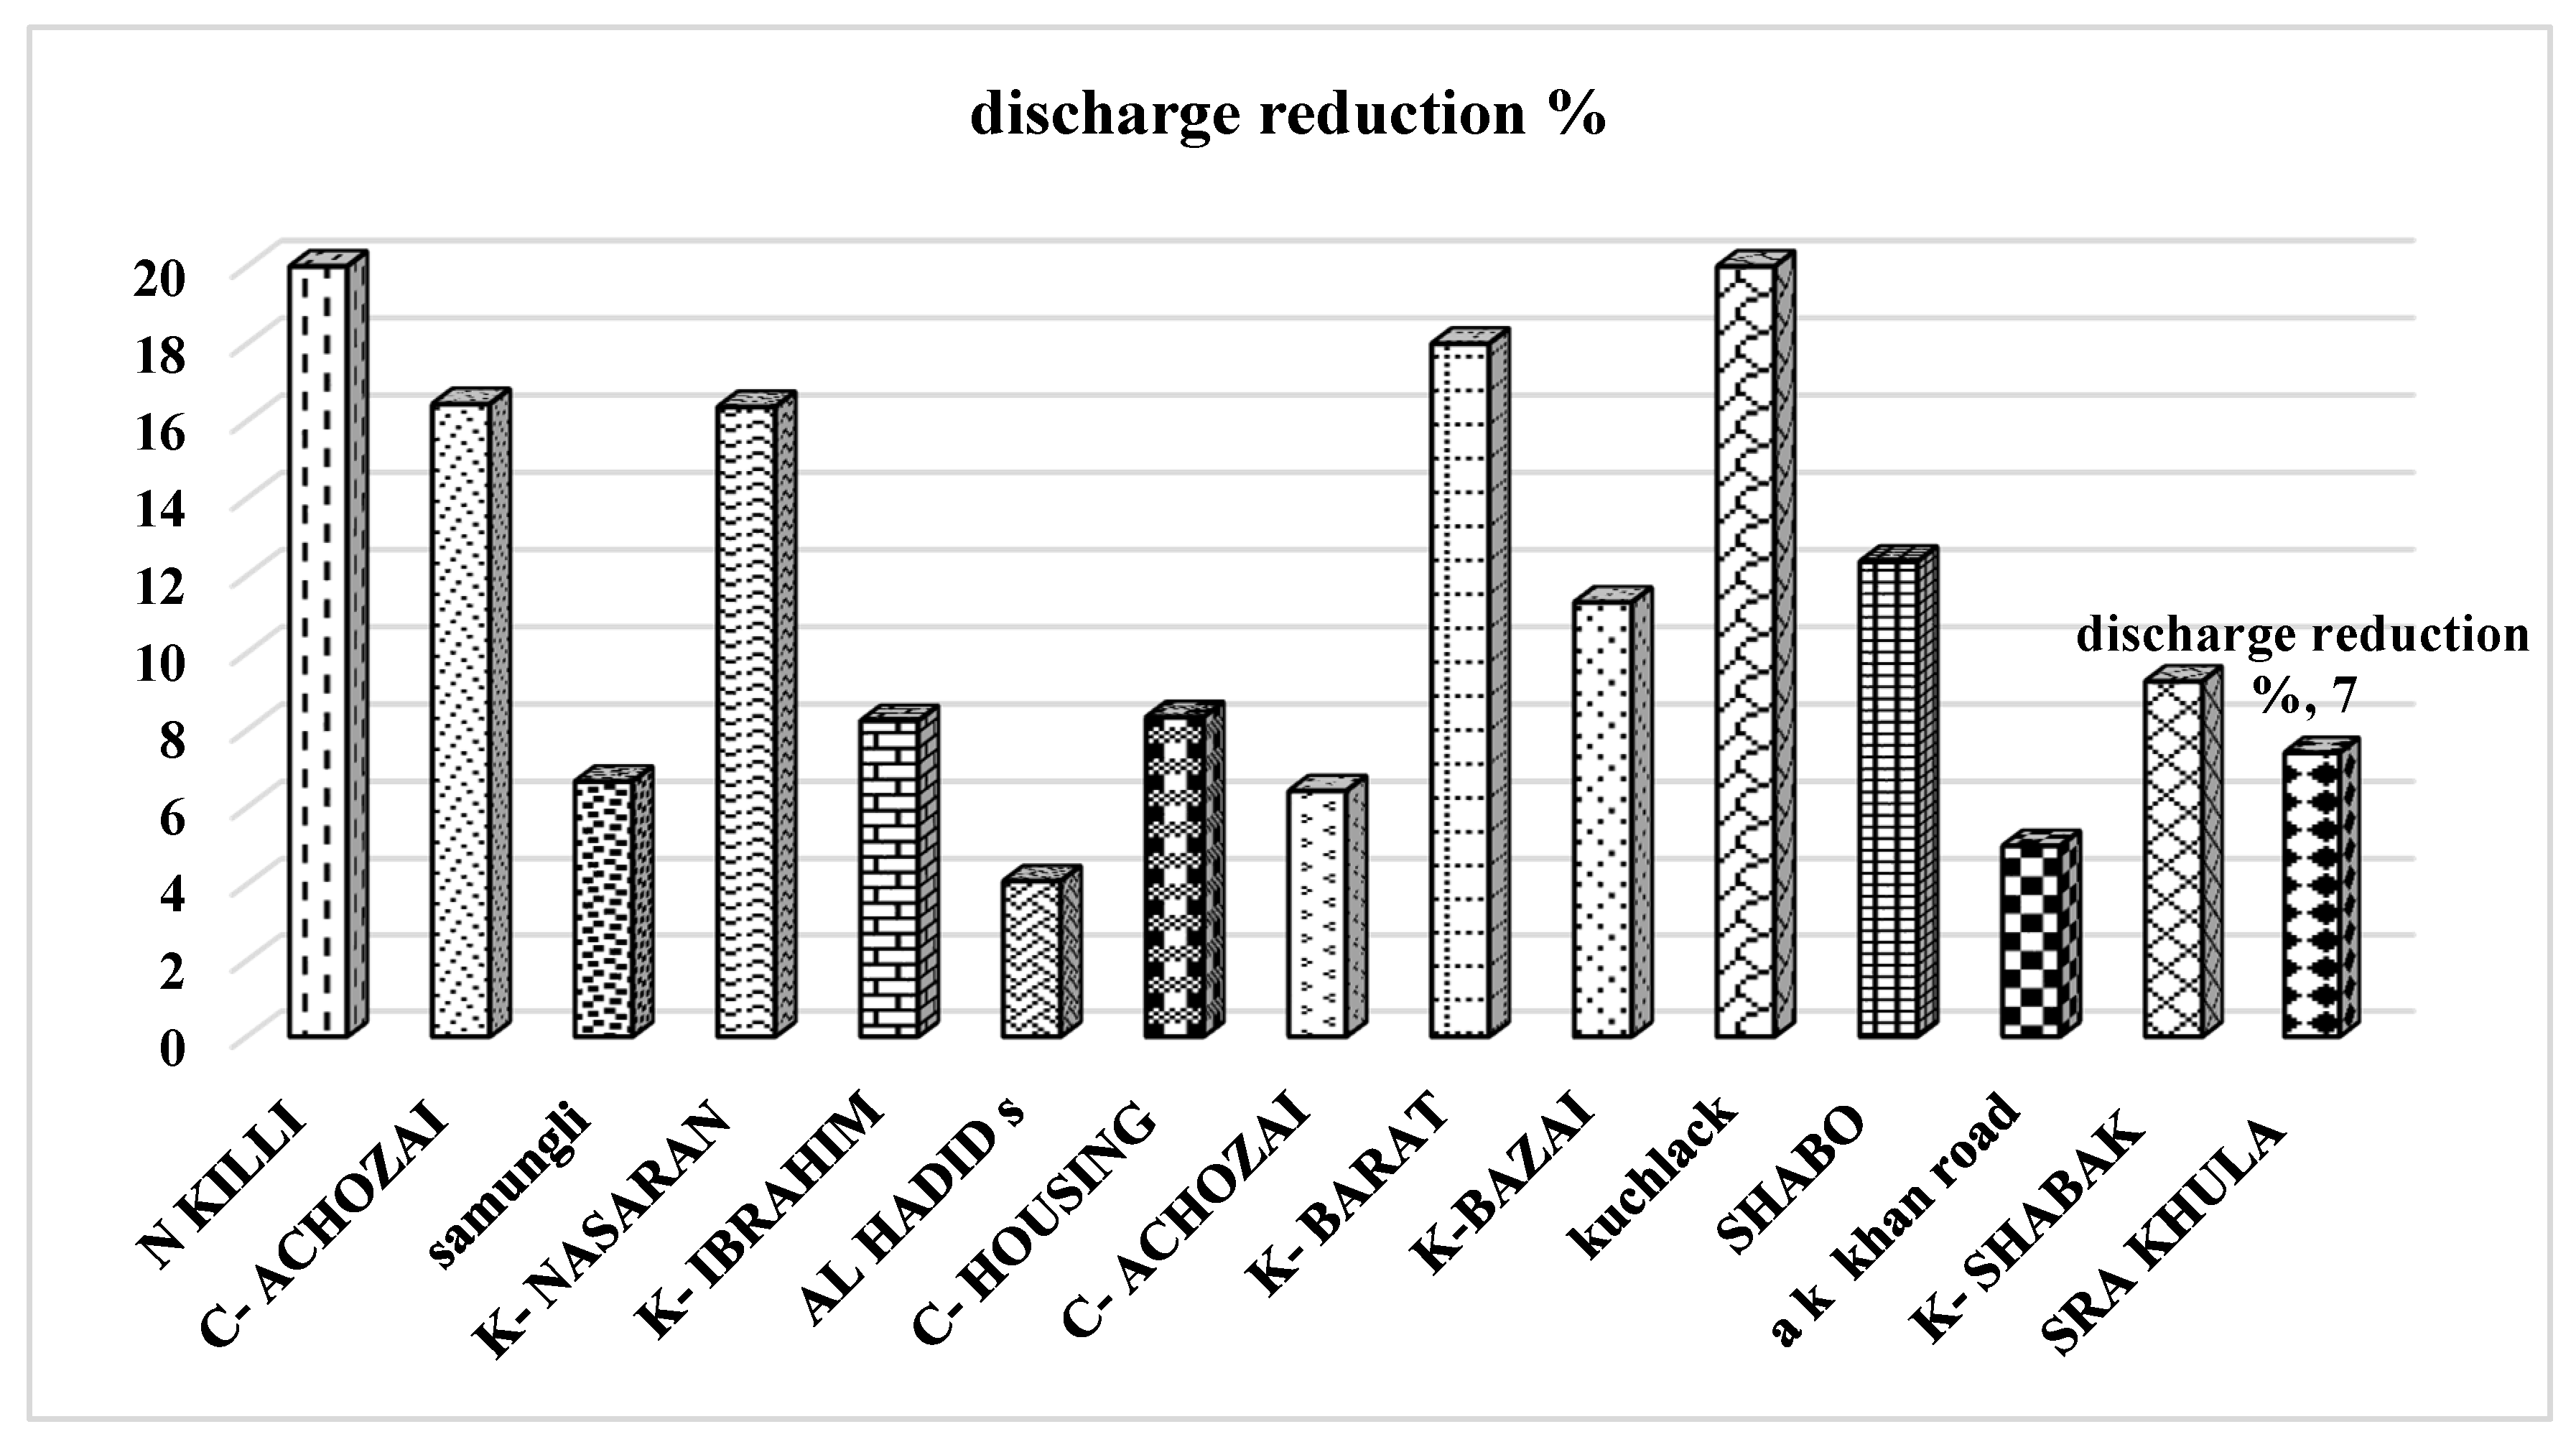
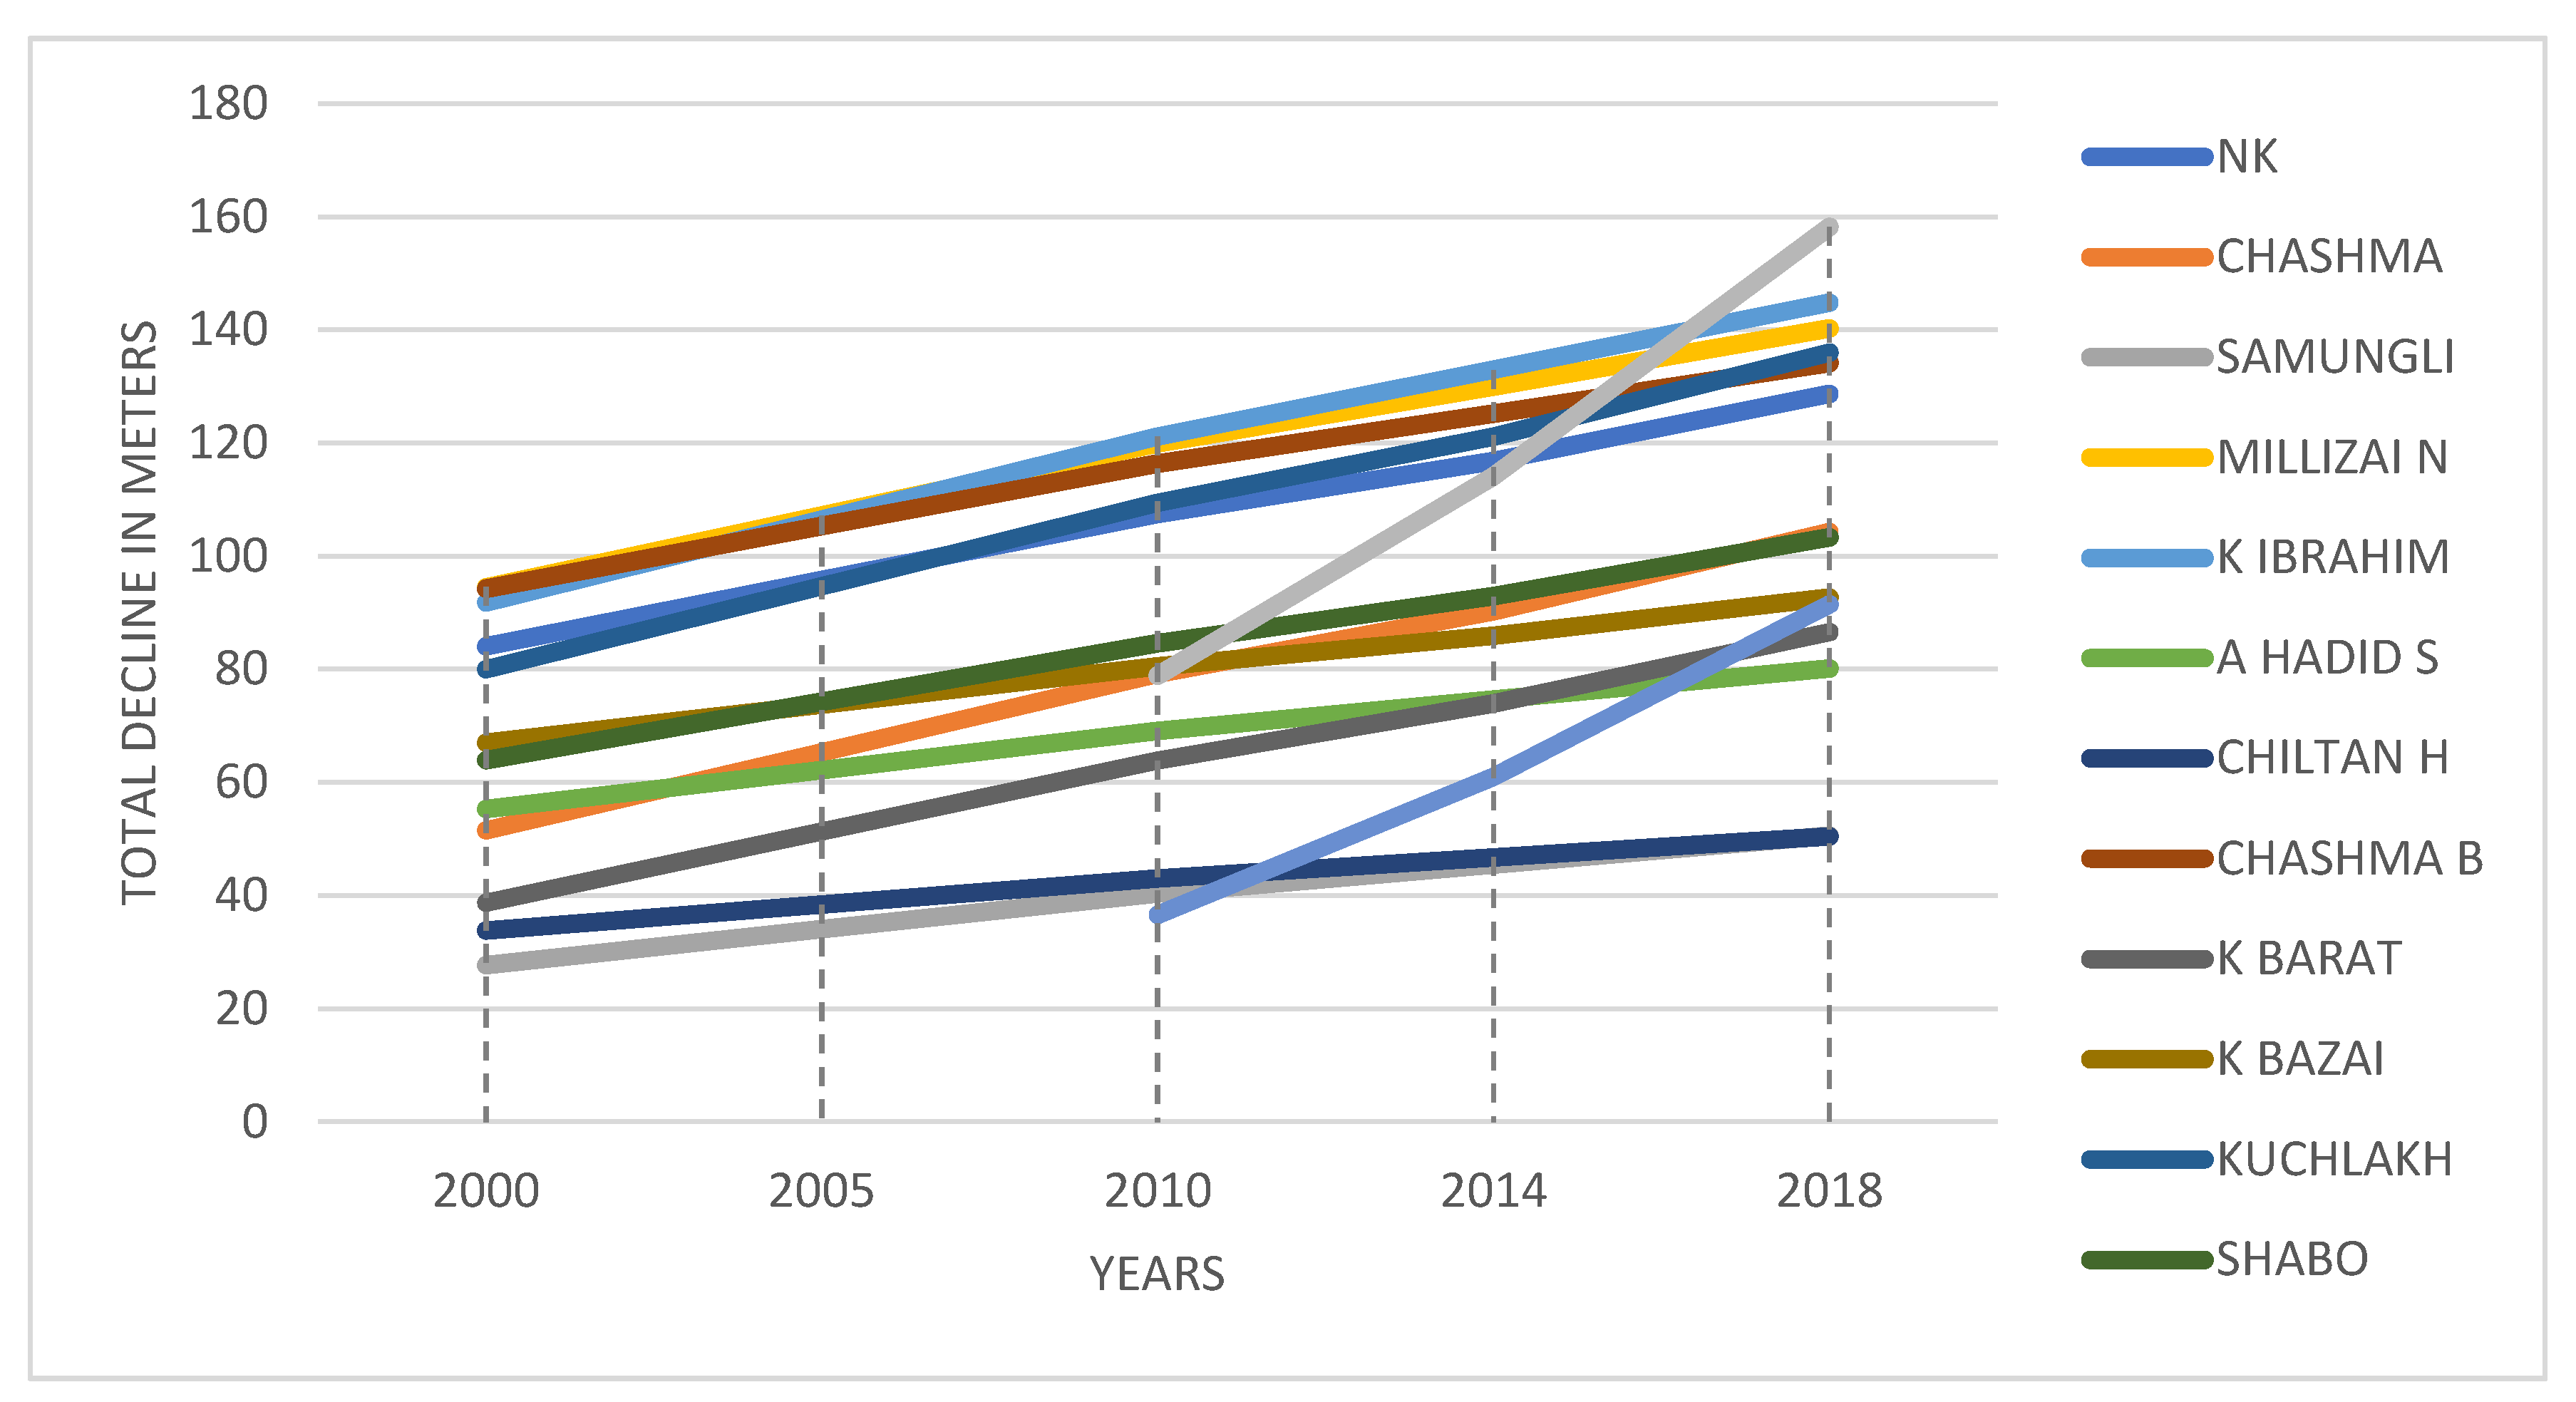
| S.NO | Name of T/W | Date of Installation | Present Discharge GPM (US) | Initial Discharge GPM (US) | Depth of W/T Present (M) | Depth of W/T Recorded (M) | Total Decline (M) |
|---|---|---|---|---|---|---|---|
| 1 | N Killi | 1999 | 24 | 30 | 128 | 81 | 47 |
| 2 | C-Achozai | 2000 | 61 | 73 | 104 | 51 | 53 |
| 3 | Samungli | 2001 | 112 | 120 | 51 | 28 | 23 |
| 4 | K-Nasaran | 2003 | 92 | 110 | 140 | 102 | 38 |
| 5 | K-Ibrahim | 2003 | 78 | 85 | 144 | 100 | 44 |
| 6 | Al Hadid S | 2003 | 94 | 98 | 80 | 59 | 21 |
| 7 | C-Housing | 2003 | 110 | 120 | 50 | 36 | 14 |
| 8 | C-Achozai | 2003 | 102 | 109 | 134 | 100 | 34 |
| 9 | K-Barat | 2004 | 82 | 100 | 86 | 48 | 38 |
| 10 | K-Bazai | 2005 | 102 | 115 | 92 | 73 | 19 |
| 11 | Kuchlack | 2007 | 20 | 25 | 135 | 100 | 35 |
| 12 | Shabo | 2008 | 78 | 89 | 103 | 80 | 23 |
| 13 | AK road | 2013 | 38 | 40 | 91 | 60 | 31 |
| 14 | K-Shabak | 2013 | 98 | 108 | 158 | 131 | 27 |
| 15 | Sra Khula | 2016 | 100 | 108 | 304 | 292 | 12 |
| Specifications | Load (KW) | |||||
|---|---|---|---|---|---|---|
| 5.5 | 11 | 15 | 18.5 | 30 | ||
| Energy consumption | Electricity Rate, Base Case (14 PKR/kWh) (Annual) | 224,840 | 449,680 | 613,200 | 756,280 | 1,226,400 |
| Electricity Daily Consumption (kWh) (8 h) | 44 | 88 | 120 | 148 | 240 | |
| Electricity Annual Consumption (MWh) | 16.06 | 32.12 | 43.8 | 54.02 | 87.6 | |
| Inverter Capacity (kW) | 8 | 15 | 21 | 25 | 37 | |
| Inverter Efficiency | 98% | 98% | 98% | 98% | 98% | |
| Load (in hp) | 7.37561 | 14.751 | 20.1153 | 24.8089 | 40.2306 | |
| Specifications | Load (kW) | |||||
|---|---|---|---|---|---|---|
| 5.5 | 11 | 15 | 18.5 | 30 | ||
| Cost analysis (PKR) | Development | 200,000 | ||||
| Well Pump | 100,000 | 120,000 | 130,000 | 140,000 | 150,000 | |
| Inverter | 48,000 | 64,000 | 72,000 | 99,200 | 120,000 | |
| Collector Support and Installation | 5986 | 9335 | 11,737 | 13,777 | 20,641 | |
| Labor Cost | 50,000 | |||||
| Miscellaneous | 100,000 | |||||
| Financial analysis (PKR) | Inflation Rate | 9% | ||||
| Discount Rate | 7.50% | |||||
| Project Life | 25 | |||||
| Total Initial Cost | 1,093,935 | 1,701,519 | 2,003,910 | 2,449,279 | 3,545,902 | |
| Financial viability (PKR) | Simple Payback (years) | 5.1 | 3.6 | 3.6 | 3.6 | 3.2 |
| Equity Payback (years) | 5.2 | 3.6 | 3.6 | 3.7 | 3.2 | |
| NPV (Net Present Value) | 1,149,784 | 4,291,810 | 3,953,249 | 3,728,784 | 69,981,325 | |
| Annual Life Cycle Savings | 98,664 | 368,282 | 339,230 | 319,784 | 599,071 | |
| Cost-Benefit Ratio | 2.05 | 3.52 | 2.92 | 2.52 | 2.97 | |
| GHG Reduction Cost | 32,957 | 61,509 | 41,548 | 31,775 | 36,686 | |
| Load (KW) | Photovoltaics (Units) | PV Power Capacity (KW) | Total Initial Cost (PKR) | Cost-Benefit Ratio |
|---|---|---|---|---|
| 5.5 | 36 | 9.54 | 1,093,935 | 2.05 |
| 11 | 72 | 19.08 | 1,701,519 | 3.52 |
| 15 | 98 | 25.97 | 2,003,910 | 2.92 |
| 18.5 | 120 | 31.8 | 2,449,279 | 2.52 |
| 30 | 194 | 51.41 | 3,545,902 | 2.97 |
Publisher’s Note: MDPI stays neutral with regard to jurisdictional claims in published maps and institutional affiliations. |
© 2021 by the authors. Licensee MDPI, Basel, Switzerland. This article is an open access article distributed under the terms and conditions of the Creative Commons Attribution (CC BY) license (https://creativecommons.org/licenses/by/4.0/).
Share and Cite
Khan, M.S.; Tahir, A.; Alam, I.; Razzaq, S.; Usman, M.; Tareen, W.U.K.; Baig, N.A.; Atif, S.; Riaz, M. Assessment of Solar Photovoltaic Water Pumping of WASA Tube Wells for Irrigation in Quetta Valley Aquifer. Energies 2021, 14, 6676. https://doi.org/10.3390/en14206676
Khan MS, Tahir A, Alam I, Razzaq S, Usman M, Tareen WUK, Baig NA, Atif S, Riaz M. Assessment of Solar Photovoltaic Water Pumping of WASA Tube Wells for Irrigation in Quetta Valley Aquifer. Energies. 2021; 14(20):6676. https://doi.org/10.3390/en14206676
Chicago/Turabian StyleKhan, Muhammad Saydal, Ali Tahir, Imtiaz Alam, Sohail Razzaq, Muhammad Usman, Wajahat Ullah Khan Tareen, Nauman Anwar Baig, Salman Atif, and Mehwish Riaz. 2021. "Assessment of Solar Photovoltaic Water Pumping of WASA Tube Wells for Irrigation in Quetta Valley Aquifer" Energies 14, no. 20: 6676. https://doi.org/10.3390/en14206676
APA StyleKhan, M. S., Tahir, A., Alam, I., Razzaq, S., Usman, M., Tareen, W. U. K., Baig, N. A., Atif, S., & Riaz, M. (2021). Assessment of Solar Photovoltaic Water Pumping of WASA Tube Wells for Irrigation in Quetta Valley Aquifer. Energies, 14(20), 6676. https://doi.org/10.3390/en14206676