Article

Experimental Investigation on Flow Boiling Heat Transfer and Pressure Drop of a Low-GWP Refrigerant R1234ze(E) in a Horizontal Minichannel

Key Laboratory of Aircraft Environment Control and Life Support, MIIT, Nanjing University of Aeronautics and Astronautics, 29 Yudao St., Nanjing 210016, China
*
Author to whom correspondence should be addressed.
Energies 2021, 14(18), 5972; https://doi.org/10.3390/en14185972
Submission received: 26 August 2021 / Revised: 16 September 2021 / Accepted: 17 September 2021 / Published: 20 September 2021

Abstract

:
To protect the environment, a new low-GWP refrigerant R1234ze(E) was created to substitute R134a. However, its flow boiling performances have not received sufficient attention so far, which hinders its popularization to some extent. In view of this, an experimental investigation was carried out in a 1.88 mm horizontal circular minichannel. The saturation pressures were maintained at 0.6 and 0.7 MPa, accompanied by mass flux within 540–870 kg/m2 s and heat flux within 25–65 kW/m2. For nucleate boiling, a larger heat flux brings about a larger heat transfer coefficient (HTC), while for convective boiling, the mass flux and vapor quality appear to take the lead role. The threshold vapor quality of different heat transfer mechanisms is around 0.4. Additionally, larger saturation pressure results in large HTC. As for the frictional pressure drop (FPD), it is positively influenced by mass flux and vapor quality, while negatively affected by saturation pressure, and the influence of heat flux is negligible. Furthermore, with the measured data, several existing correlations are compared. The results indicate that the correlations of Saitoh et al. (2007) and Müller-Steinhagen and Heck (1986) perform best on flow boiling HTC and FPD with mean absolute deviations of 5.4% and 10.9%.

1. Introduction

With the increasing concerns on environment protection, the demand for environment-friendly refrigerants in many fields is becoming more and more urgent. As a low-GWP refrigerant, R1234ze(E) is created to supplant R134a, one of the most frequently utilized refrigerants, and its GWP value is 1430 [1,2,3,4]. However, the flow boiling characteristics of this new refrigerant are still not exceptionally clear, due to the fact that studies focused on this issue are still insufficient.
Several experimental studies are concerned over the R1234ze(E) flow boiling inside single circular pipes. Longo et al. [3] observed the flow boiling of R1234ze(E) and R134a, and quantified their heat transfer coefficient (HTC) and frictional pressure drop (FPD). Heat was imposed to a 4 mm horizontal circular pipe through refrigerated water. The saturation temperature (tsat) was maintained at 10–20 °C, mass flux (G) was controlled within 200–600 kg/m2 s, and heat flux (q) was kept within 10–30 kW/m2. HTC was influenced by vapor quality positively, and the influence was enhanced by rising mass flux but weakened by rising heat flux. Additionally, FPD was affected by saturation temperature and vapor quality significantly, but by heat flux slightly. Through the comparisons between measured and predicted data, the correlations of Kim and Mudawar [5] and Friedel [6] presented the smallest mean absolute deviations around 6% and 12%. Bortolin et al. [7] explored R1234ze(E) flow boiling heat transfer performances experimentally. Heat was imposed though liquid heating methods rather than the Joule effect method to working fluid in a microchannel with D = 0.96 mm. Instead of vapor quality and mass flux, HTC mainly depended upon heat flux. On the strength of the experimental HTC, an evaluation of five two-phase HTC correlations proposed for microchannels was performed, and the results revealed that the Sun and Mishima [8] and Bertsch et al. [9] correlations could approach the experimental trend. Sempértegui-Tapia and Ribatski [10] observed HTC of R1234ze(E) as well as R134a, R1234yf, and R600a. A 1.1 mm circular channel was utilized, with tsat = 31 and 41 °C, G = 200–800 kg/m2 s, and q = 15–145 kW/m2. The influences of these variables were identified and attributed to nucleate boiling and convective boiling. With the measured HTC, predictive correlations were assessed, and those of Kanizawa et al. [11] and Kim and Mudawar [12] generated the best predictions.
Some other investigations of R1234ze(E) flow boiling were implemented in multiport tubes. Jige et al. [13] studied the HTC of R1234ze(E) and R32 by using a horizontal multiport channel with 12 parallel rectangular minichannels (0.82 mm × 0.82 mm). The experimental conditions were set as tsat = 15 °C, G = 50–400 kg/m2 s, and q = 5–40 kW/m2. The heat transfer was mainly regulated by convective boiling, nucleate boiling, and thin liquid film evaporation. Based on these mechanisms and flow patterns, a new HTC correlation was deduced, which performed much better than the correlations of Gungor and Winterton [14], Saitoh et al. [15], and Kim and Mudawar [16]. Vakili-Farahani et al. [17] explored the upward HTC of R1234ze(E) and R245fa by using a flat extruded 7-port pipe with each channel size of 1.1 mm × 2.1 mm. The working conditions of tsat = 30–70 °C, G = 50–400 kg/m2 s, and q = 3–107 kW/m2 were applied. Larger HTC mainly depended on larger saturation temperature and heat flux, demonstrating the domination of convective boiling. The experimentally obtained HTC was compared with predictive correlations, and the comparison results showed that the three-zone model established by Thome et al. [18] performed best when the minimum liquid film thickness was modified. Li and Hrnjak [19] conducted R1234ze(E) flow boiling in a 24-port microchannel having a hydraulic diameter (Dh) of 0.643 mm. HTC augmented with heat flux and mass flux declined with saturation pressure and augmented with vapor quality first, and then dropped. Then, they evaluated the existing correlations based on the acquired HTC and uncovered that the Bertsch et al. [9] correlation yielded the smallest deviation.
Except for the studies in single and multiport tubes, some studies on R1234ze(E) flow boiling in enhanced channels were also conducted. Diani et al. [1] measured the R1234ze(E) flow boiling FPD in a 3.4 mm microfin pipe with tsat = 30 °C, G = 190–940 kg/m2 s and q = 10–50 kW/m2. FPD increased with vapor quality until a peak and then fell, while it rose with mass flux monotonously. Later, Diani et al. [4] explored FPD characteristics by using a 2.4 mm microfin pipe. The working conditions as well as the impacts of vapor quality and mass flux on FPD were both similar to those of Diani et al. [1]. Additionally, Mancin et al. [20] and Diani et al. [21] examined FPD variations of R1234ze(E), R1234yf, and R134a in a copper foam with tsat = 30 °C, G = 50–200 kg/m2 s and q = 50–100 kW/m2. They found that for larger mass flux and vapor quality, the corresponding pressure drop was also larger.
The above brief review demonstrates that the flow boiling investigations on R1234ze(E) are still insufficient, and different predictive correlations were recommended by different studies. Since understanding the flow boiling characteristics of R1234ze(E) more clearly and choosing suitable predictive correlations is essential to practical applications, an experimental investigation is conducted in a horizontal circular minichannel in this paper. The influences of different factors on HTC and FPD are analyzed. Moreover, with the experimentally acquired data, several well-known predictive correlations of HTC and FPD are compared, and the best ones are revealed.

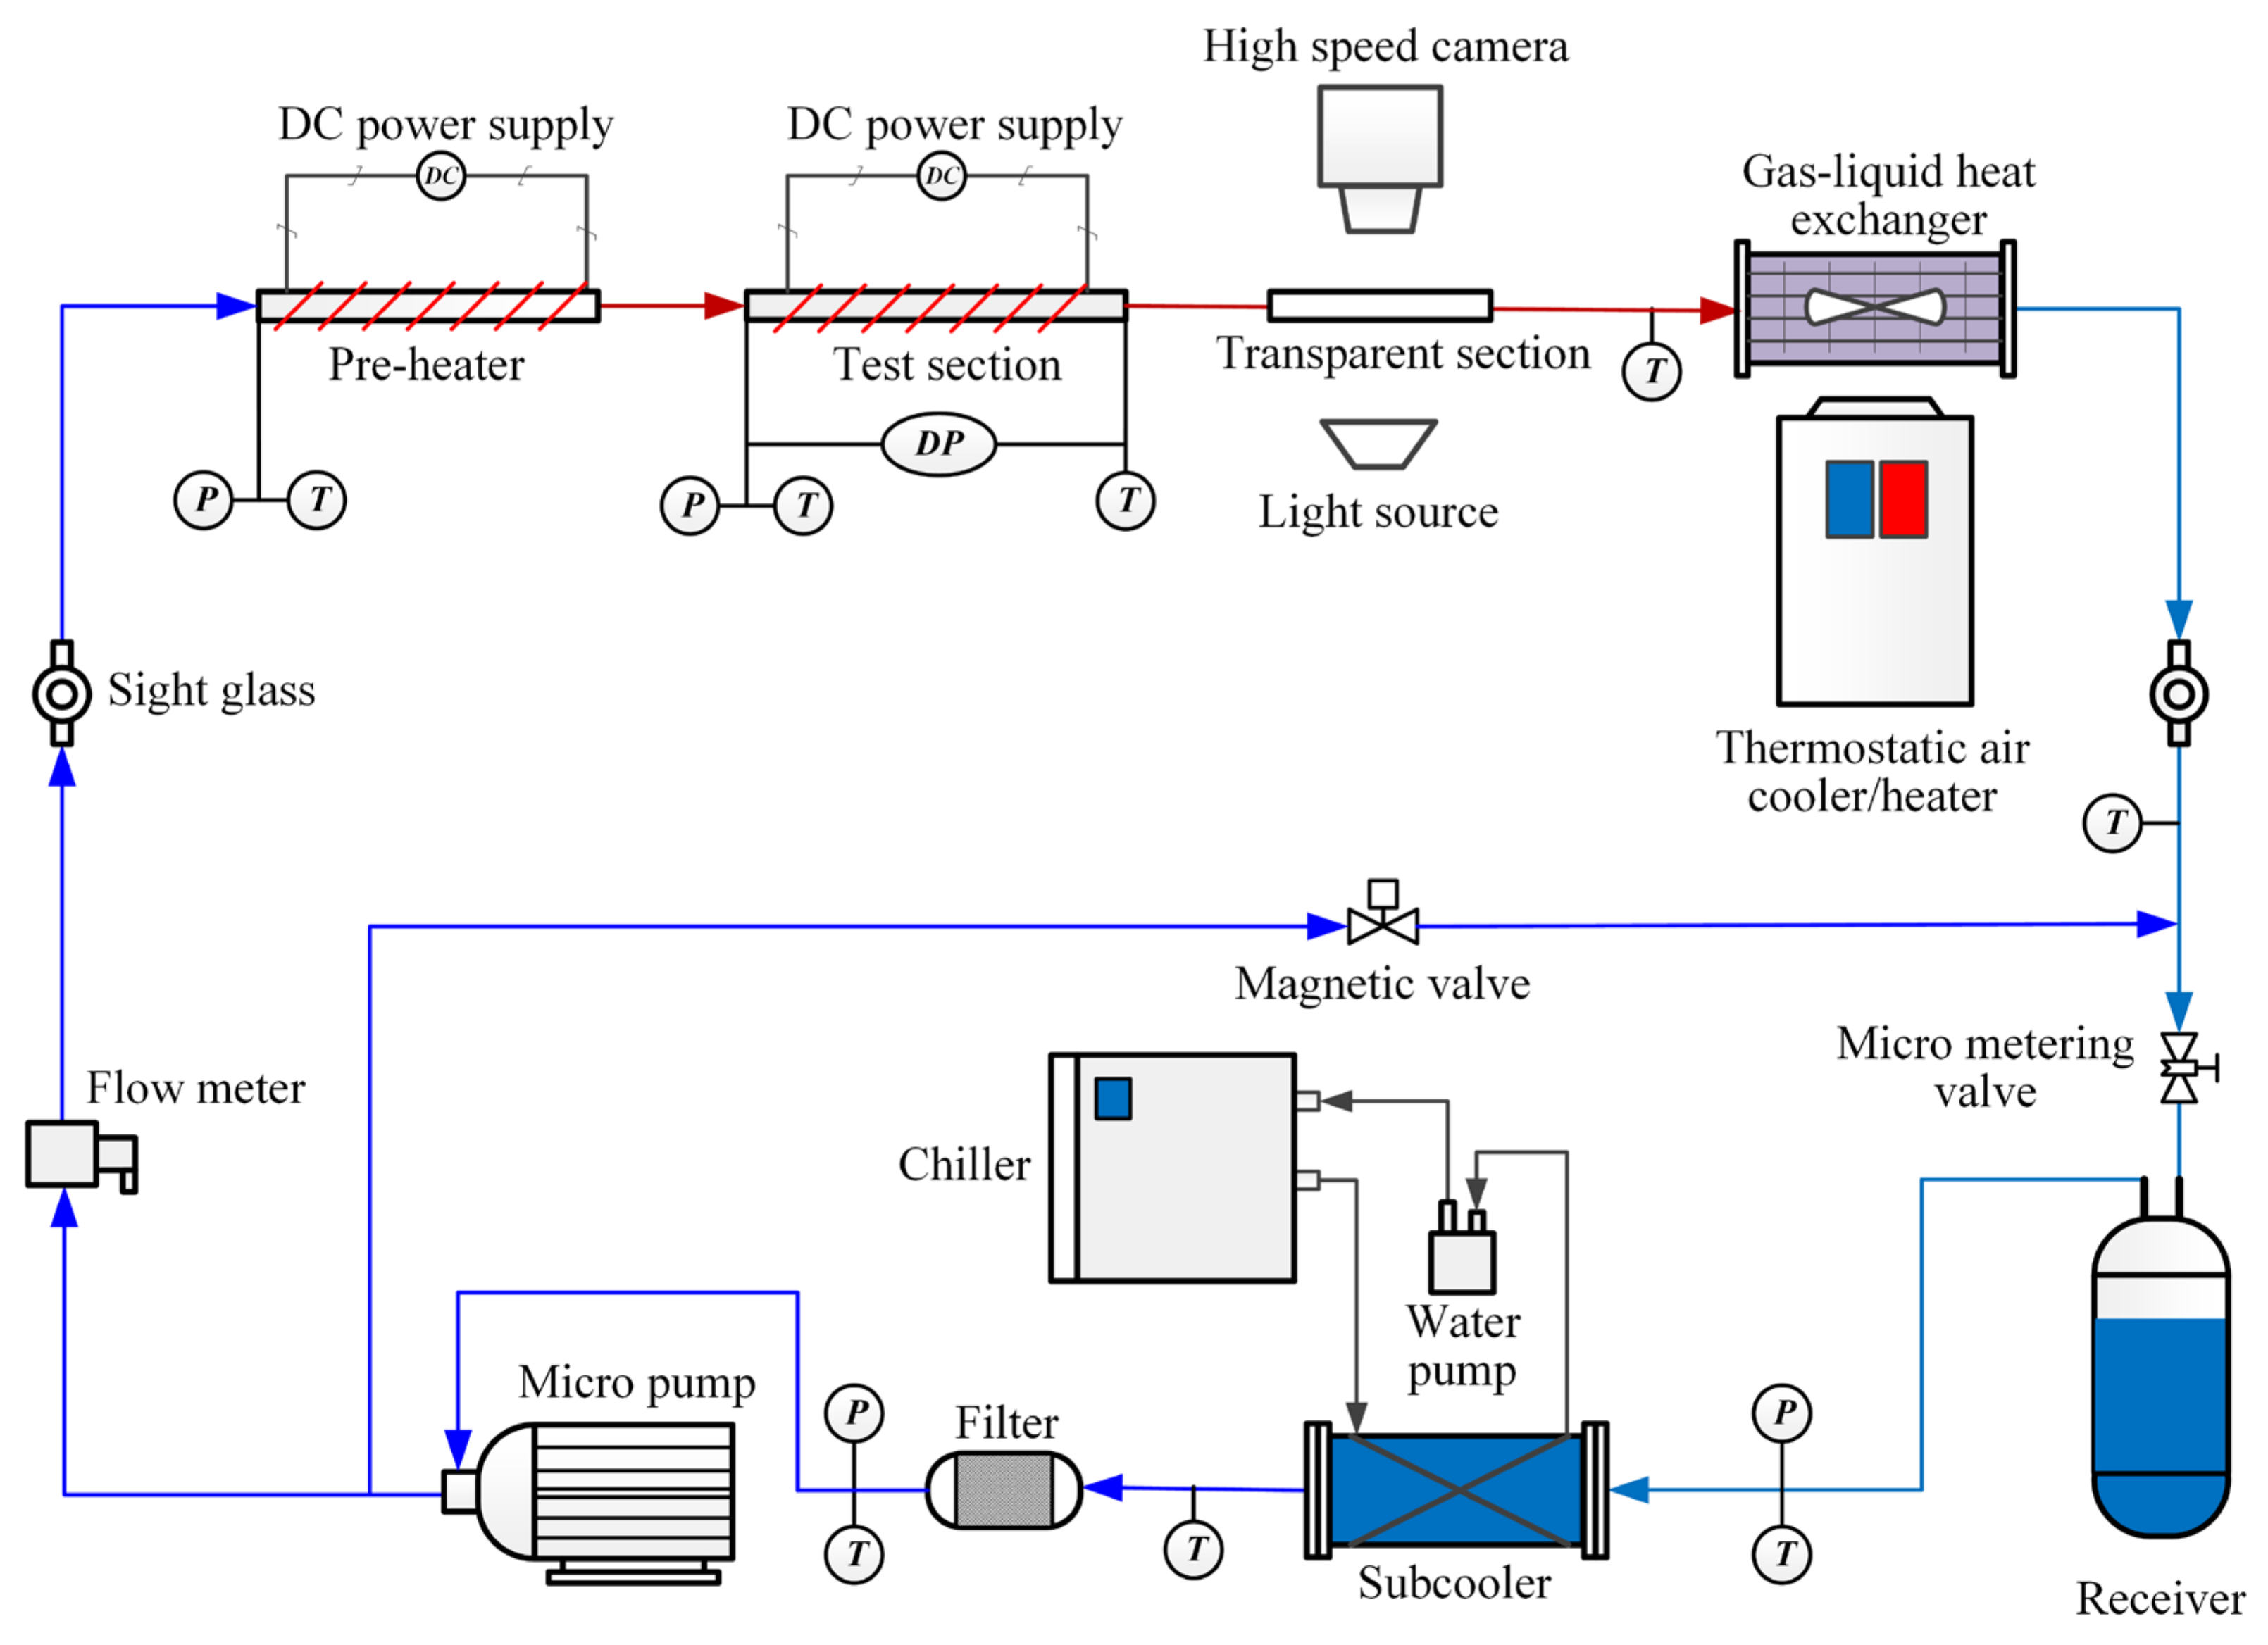
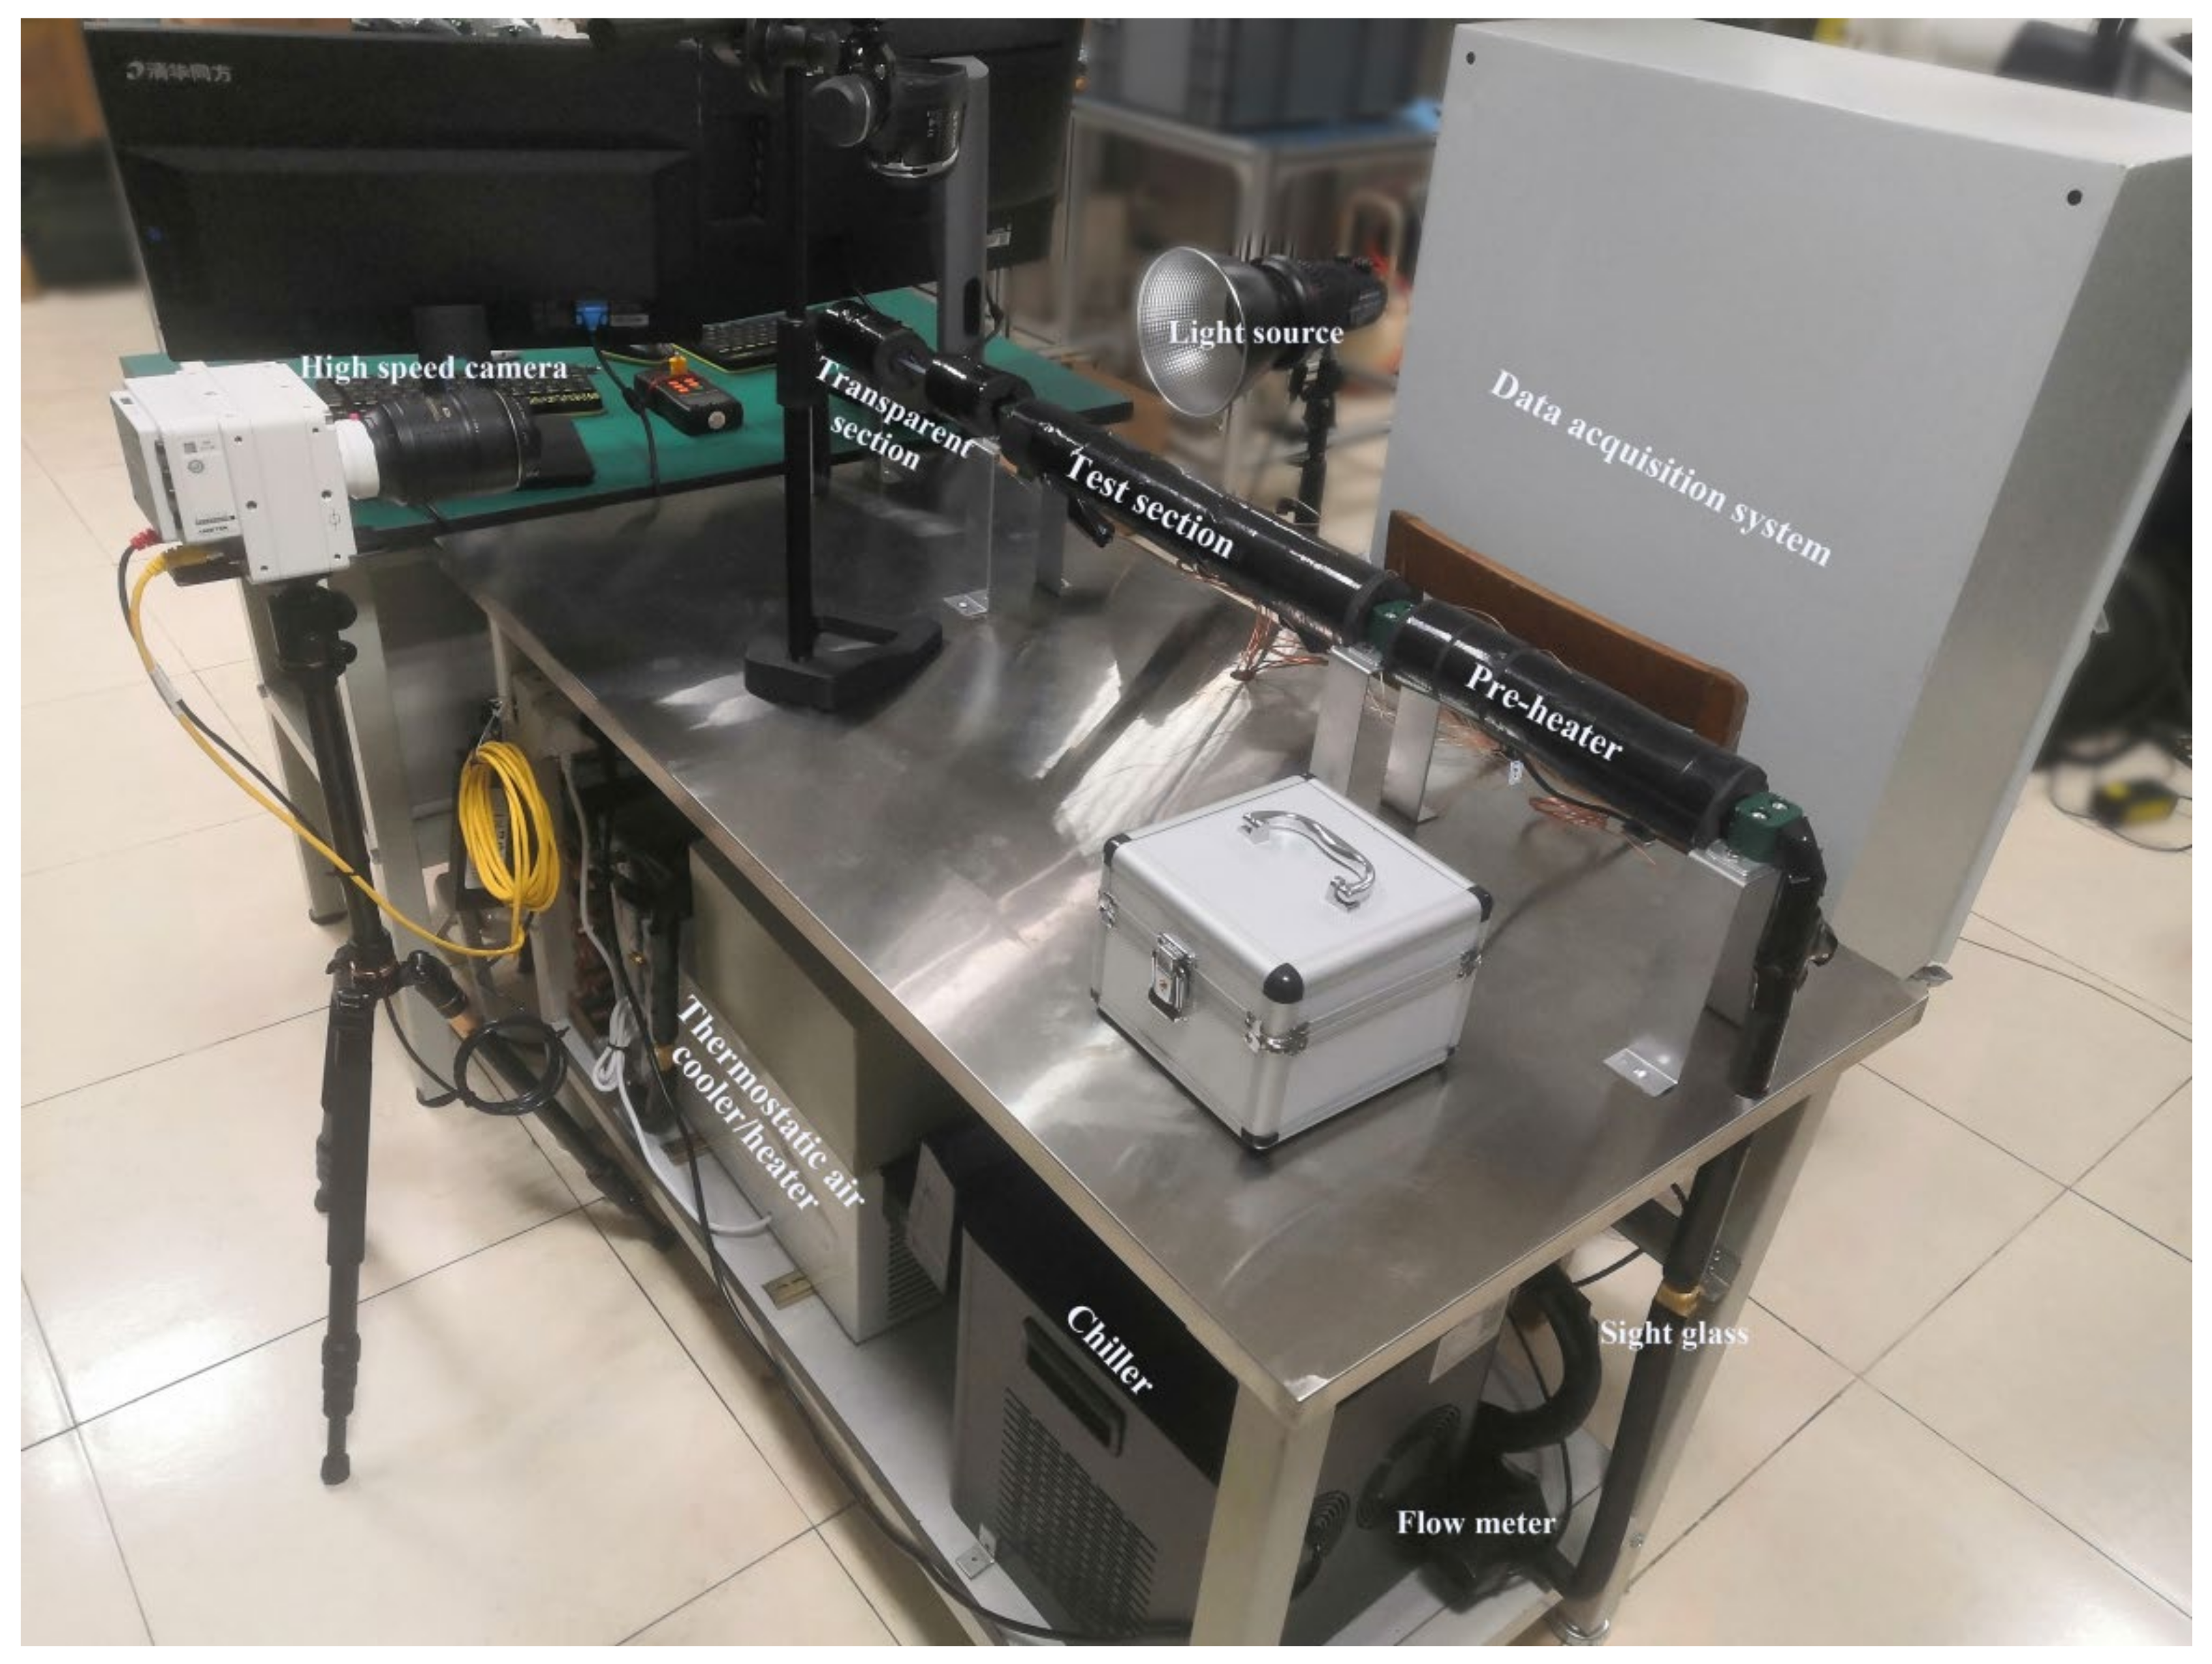
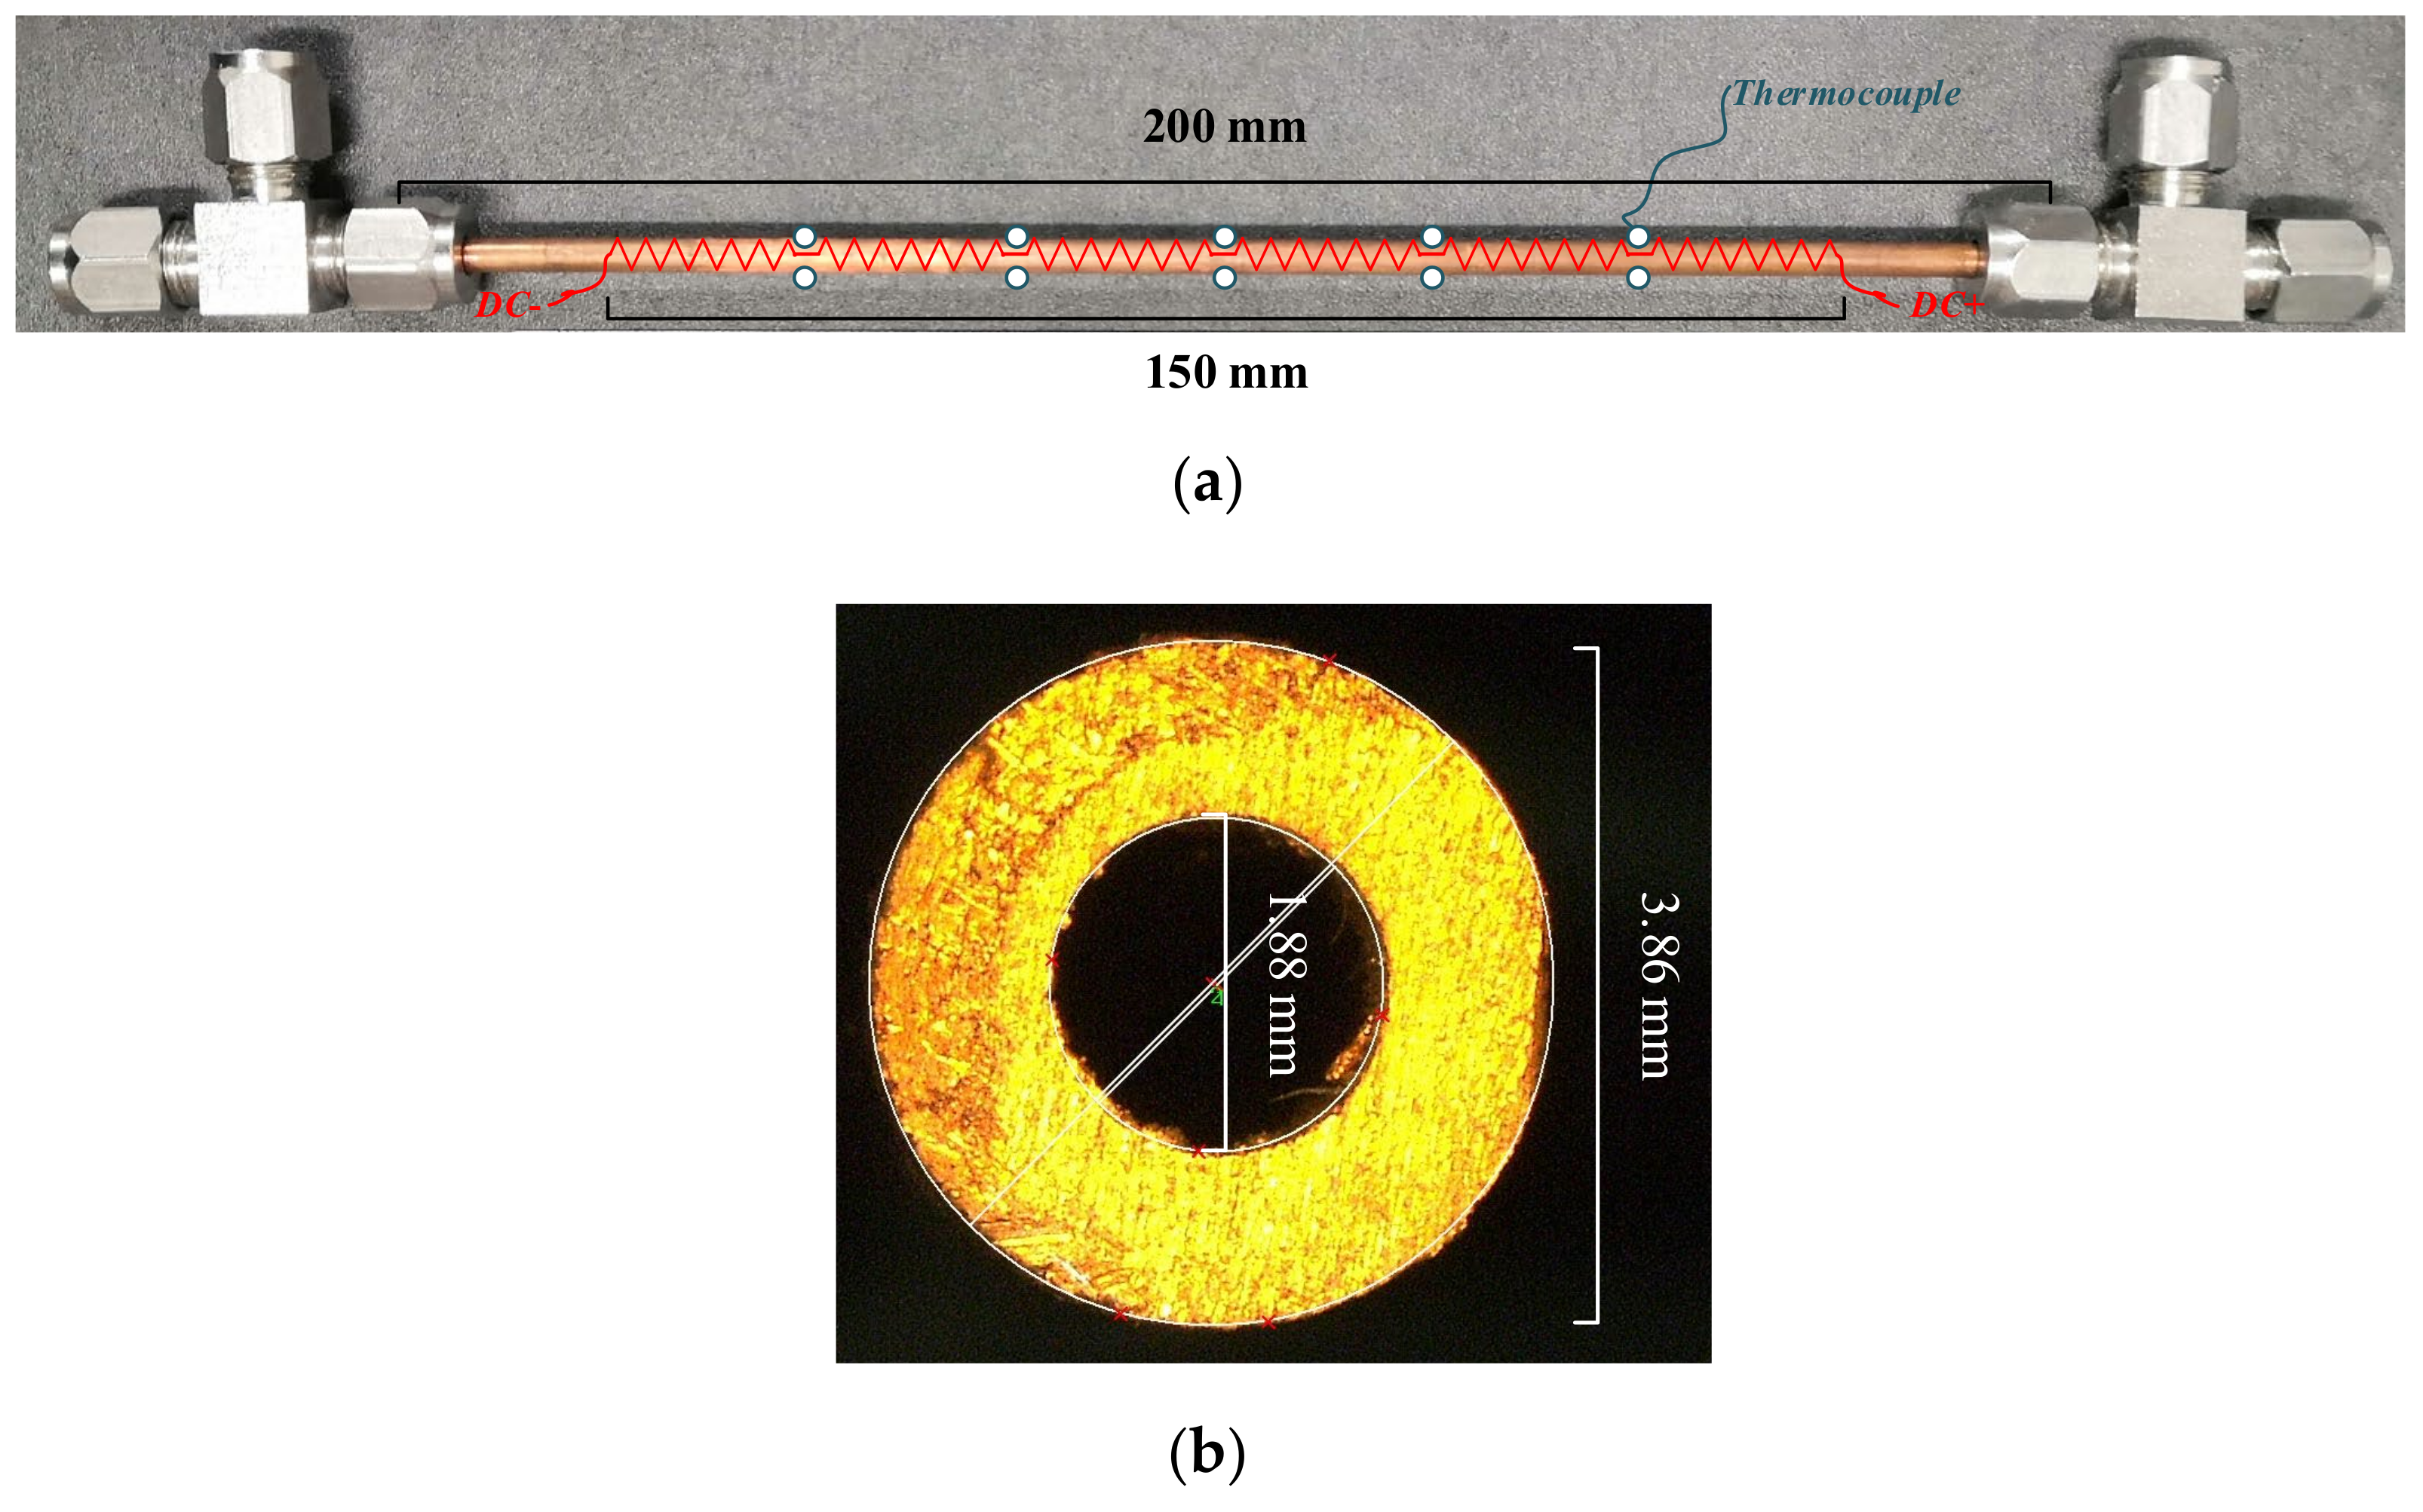
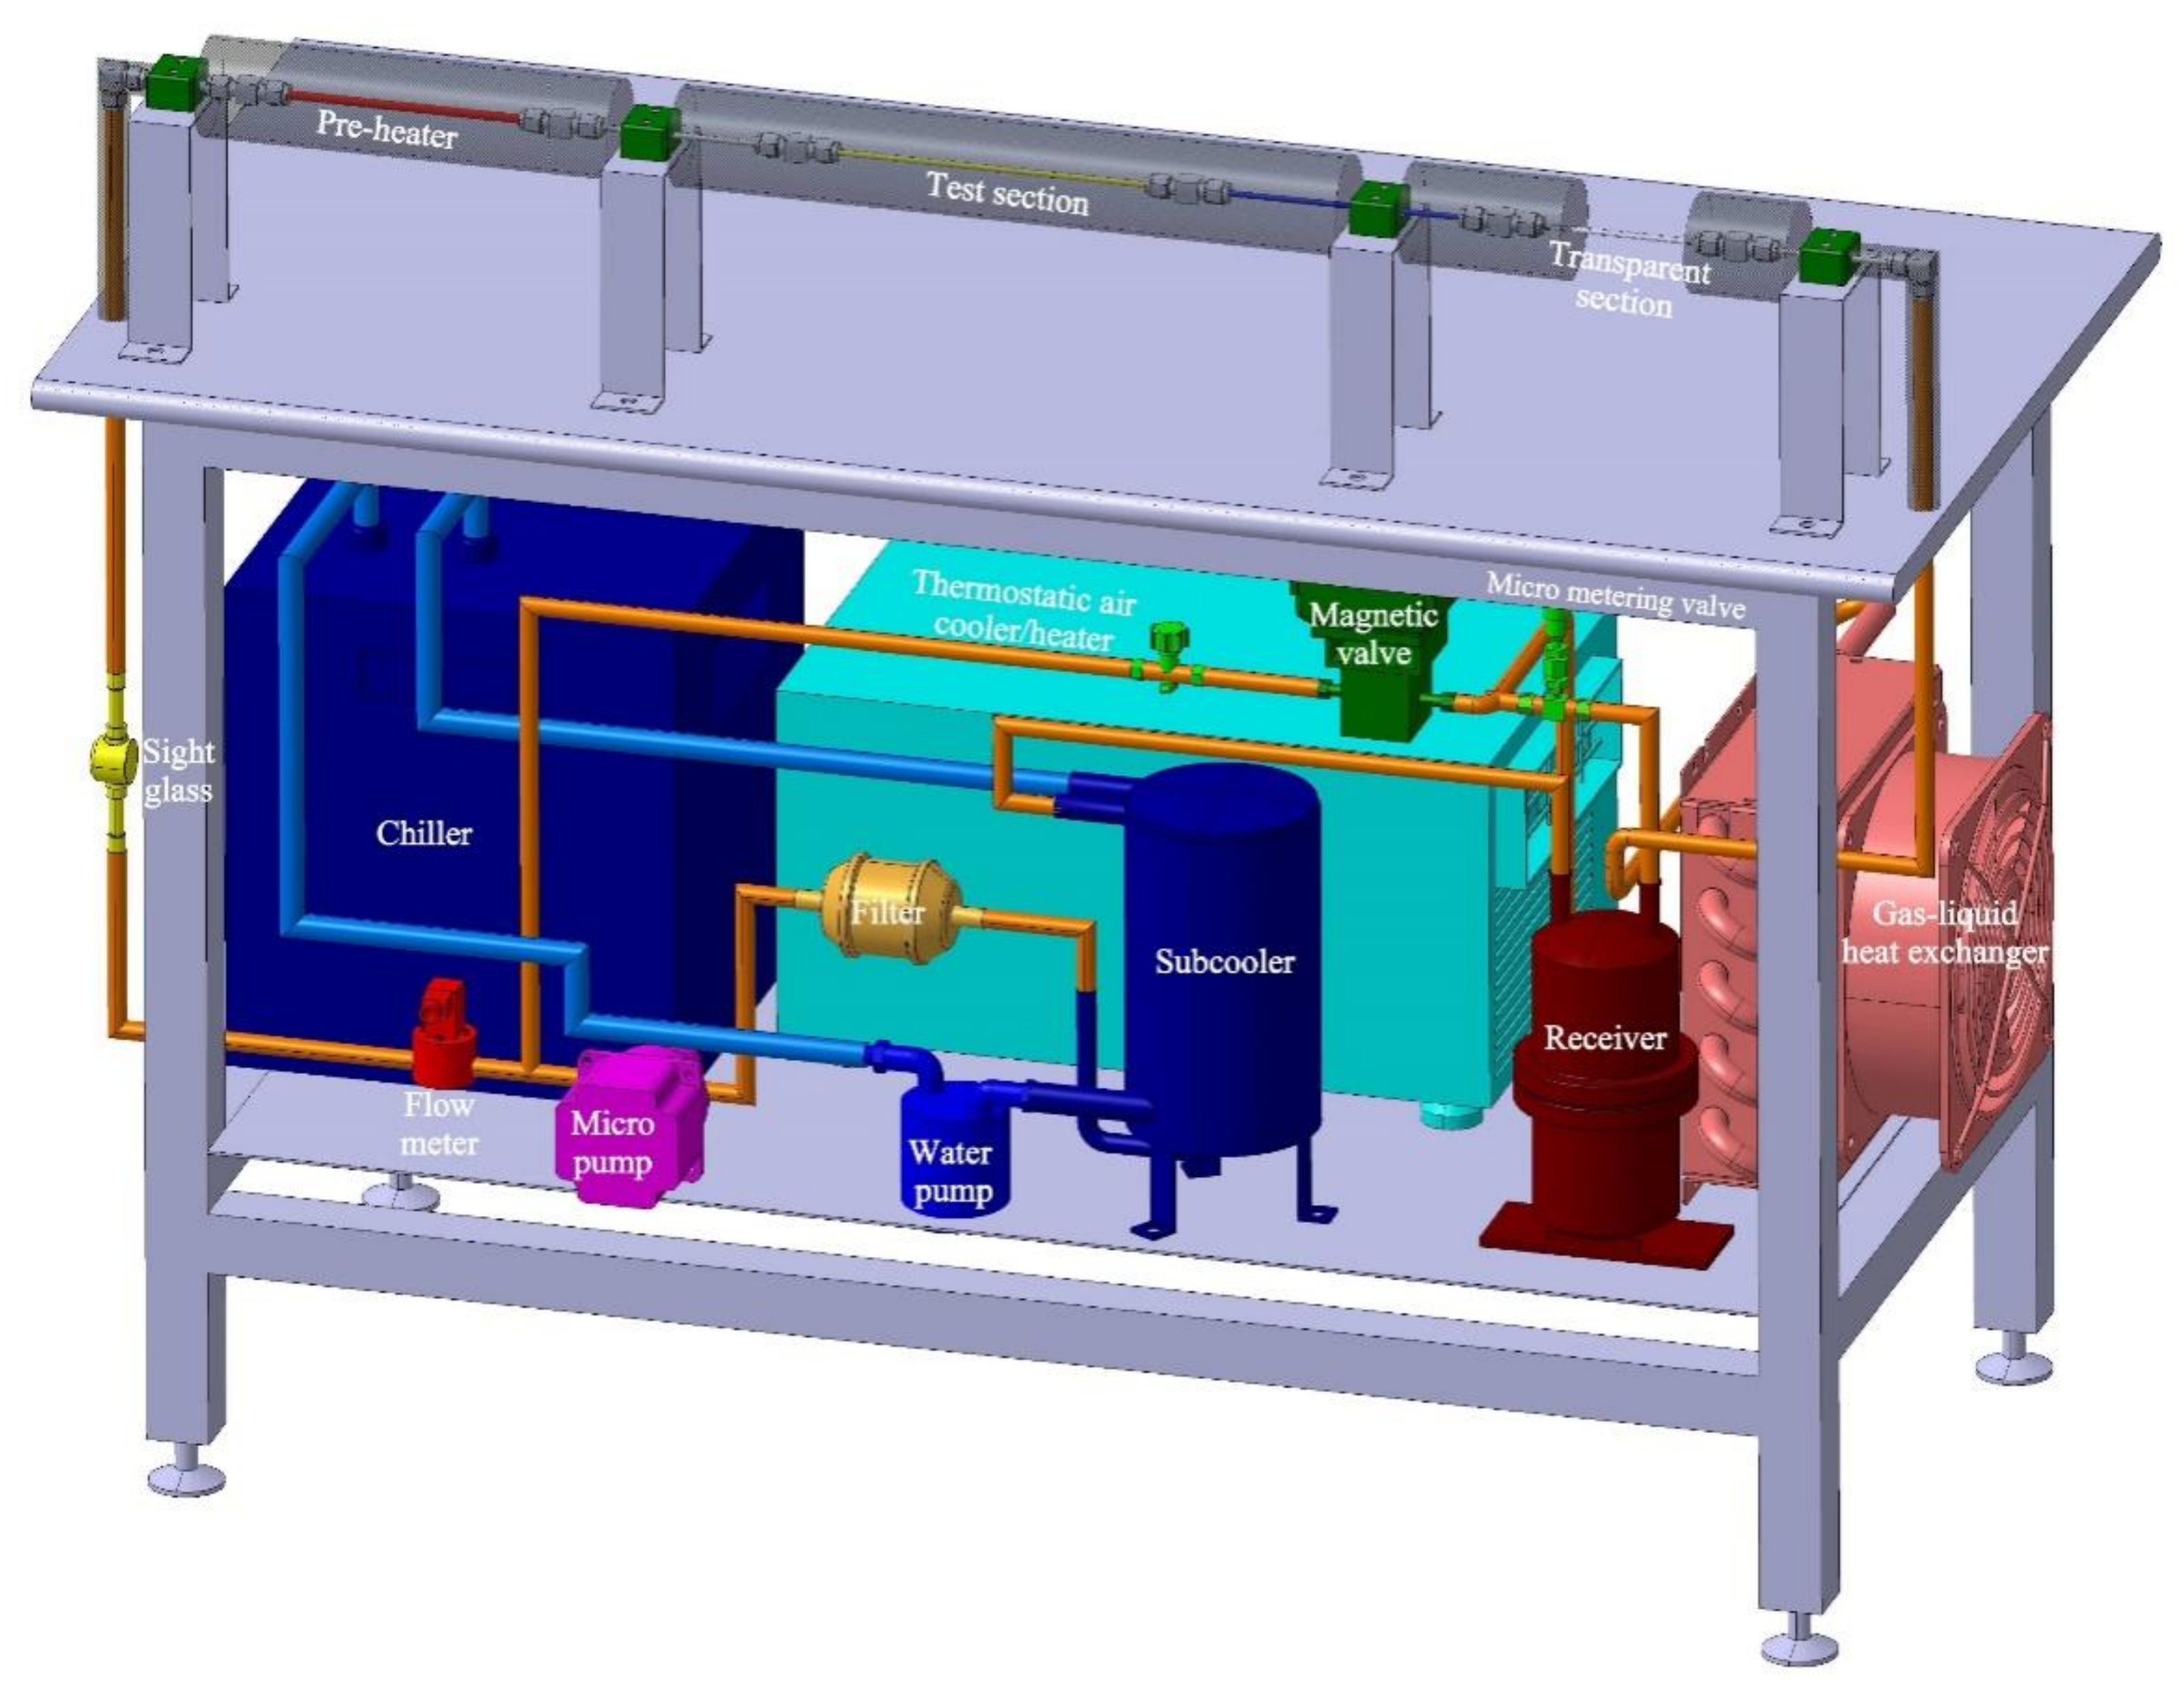
2. Experimental Apparatus

The experimental system schematic regrading to R1234ze(E) flow boiling is presented in Figure 1. The refrigerant, water, and air flow were in three different loops separately, among which the water loop was applied to regulate the refrigerant temperature, and the air loop was utilized to adjust the refrigerant pressure. The 3D model and photograph of the established experimental system are shown in Figure 2 and Figure 3.
The refrigerant loop is mainly composed of a pump, pre-heater, test section, gas-liquid heat exchanger, and receiver. The liquid refrigerant from the receiver transfers heat to the cold water generated by the chiller in the subcooler. After passing through the filter, micro-gear pump, and volumetric flow meter, the subcooled refrigerant flows into the pre-heater where it is heated to two-phase state via the enameled heating wire. The two-phase refrigerant, with a certain vapor quality, flows into the test section and then is heated to a pre-defined exit vapor quality via the same electrical heating method. Then, the refrigerant flows into the gas–liquid heat exchanger and then is cooled or heated by the regulated air generated by the thermostatic air cooler/heater. Finally, the refrigerant passes through the micro metering valve and returns to the receiver. Additionally, a flow branch connects the outlet of the pump and inlet of the micro metering valve, and is controlled through the magnetic valve.
The inlet subcooling degree of the pre-heater can be controlled within 3–20 °C via the chiller and the thermostatic air cooler/heater which can produce 5–20 °C cold water and 10–60 °C outlet air. Two sight glasses were mounted before the pre-heater and after the gas–liquid heat exchanger to observe the refrigerant states as well as the refrigerant charge directly. The leakage of the refrigerant loop was examined through a 48-hour pressure maintaining test with high-pressure nitrogen around 1.4 MPa.
The test section is a 200 mm long horizontal circular cooper tube. Its inner diameter (D) and outer diameter (Do) are 1.88 and 3.86 mm, which were measured by a high-precision optical microscope with an accuracy of 1 µm, as shown in Figure 4. Its outer wall temperature was measured by uniformly spaced thermocouples fixed on the top and bottom locations with calibrated accuracies of 0.1 °C. Its pressure drop was obtained through a differential gauge connected to the inlet and outlet with an accuracy of ±0.075%FS (0–100 kPa). The transparent section is a transparent polytetrafluoroethylene tube having a length of 100 mm. and is connected with cooper tubes with specially-made joints to avoid refrigerant leakage. The thermophysical properties of the working fluid R1234ze(E) under specific saturation pressures are listed in Table 1.
The temperatures and pressures at the test section inlet, as well as other locations, shown in Figure 1 were also measured via thermocouples and relative pressure transducers with accuracies of ±0.3%FS (0–1.6 MPa). The volume flow rate was obtained via an oval gear flow meter. Additionally, to obtain the heat dissipation, thermocouples were embedded in different radial positions of the thermal insulation layer. To avoid the burnout of the heating wires with tolerable temperatures of 180 °C, other thermocouples were connected with the wires directly. The refrigerant pressure was regulated through adjusting the outlet air temperature of the gas–liquid heat exchanger, and the opening of the micro-metering valve. The refrigerant flow rate was regulated through controlling the pump speed and the micro-metering valve and magnetic valve openings.
All the measuring signals, including temperature, pressure, pressure drop, flow rate, and heating power, were recorded in real time by a data acquisition system which was established based on data acquisition modules (ADAM-4000 series) and a piece of configuration software (Force Control 7.1). All the controls of the micro pump, DC power supply, thermostatic air cooler/heater, chiller, and magnetic valve were all achieved through the data acquisition system, except the micro-metering valve which was regulated manually.

3. Data Reduction and Uncertainty Analysis

The mass flux is calculated by:
G = V A ρ p r e , i n
where V represents the volume flow rate, A means the test section flow area, and ρpre,in means the subcooled liquid density at the pre-heater inlet.
The saturation pressure is calculated by:
p s a t = p i n 1 2 Δ p t
where pin and Δpt are the test section inlet pressure and total pressure drop, respectively.
The axial heat diffusion is determined by the fin analysis method. Assuming that the parts without heating wire in the test section are fins connected with the directly heated part, then the fin efficiency is calculated by:
η f = tahn m H m H
where m is the fin parameter, H′ is the modified fin length.
m = α P λ A c
where α is the HTC, P is the equivalent cross-sectional perimeter of the fin, and Ac is the cross-sectional area of the fin.
P = π D o + D i / 2
A c = π D o 2 D i 2 / 4
where Do and Di are the outer and inner diameter of the test section.
H = H + δ / 2
where H is the length of the fin, and δ is the thickness of the fin.
H = L L h e a t / 2
δ = D o D i / 2
where L is the length of the test section, and Lheat is the heating length of the test section.
Thus, the modified heating length is determined by:
L h e a t = L h e a t + 2 H η f
The heat flux is calculated by:
q = Q e f f π D i L h e a t
where Qeff and Lheat represent the effective heating power and heating length, respectively.
Qeff = QtQdis
where Qt and Qdis represent the total heating power and heat dissipation, respectively.
Q = 2 π λ i n s L i n s t i n s , 1 t i n s , 2 ln r i n s , 2 / r i n s , 1
where λins, Lins, rins,1, rins,2, tins,1, and tins,2 represent the thermal conductivity, length, radiuses and temperatures of measure points 1 and 2 of the insulating layer, respectively.
HTC is calculated by:
α = q t w t s a t
t w = t w , o q D 2 λ ln D o D i
where tw and tw,o represent the inner and outer wall temperatures, respectively, and they are both the average temperatures along the test section.
The HTC and modified heating length are obtained through the iteration of Equations (3)–(15).
Note that the heating wire resistance varied with the heating power due to the variation of its temperature. The temperature coefficient of resistance (TCR) of the heating wire can be calculated by:
R = R r e f 1 + TCR × t w i r e
where twire is the temperature of the heating wire, and Rref is the resistance at reference temperature.
The calculated TCR is 0.00391, which is almost the same as that of fine copper.
The vapor quality is determined as:
x = 1 2 x i n + x o u t
where xin and xout represent the test section inlet and outlet vapor qualities, respectively.
x i n = 1 h l v , t e s t , i n Q p r e m h l , t e s t , i n h p r e , i n
x o u t = 1 h l v , t e s t , o u t Q t e s t + Q p r e m h l , t e s t , o u t h p r e , i n
where Qpre and Qtest mean the net heating powers, hpre,in means the enthalpy at the pre-heater inlet, hlv,test,in, hlv,test,out, hl,test,in, and hl,test,out mean the latent heat of vaporization and saturated liquid enthalpy at the test section inlet and outlet, respectively.
For horizontal flow, FPD is determined as:
Δ p f = Δ p t Δ p m Δ p i n Δ p o u t
where Δpt, Δpm, Δpin and Δpout represent the total, momentum, inlet, and outlet pressure drop, respectively.
Δ p m = G 2 x 2 ρ v   ε + 1 x 2 ρ l 1 ε o u t x 2 ρ v   ε + 1 x 2 ρ l 1 ε i n
where ε is the void fraction, and is calculated from Xu and Fang [22].
The inlet contraction pressure drop and outlet expansion pressure drop is determined from Collier and Thome [23], Fu et al. [24], and Kim and Mudawar [25].
Δ p i n = G 2 2 p l 1 C c 1 2 + 1 σ c 2 1 + x i n ρ i ρ v 1
where Cc is the contraction coefficient and equal to 1 for two-phase flow according to Schmidt and Friedel [26] and Abdelall et al. [27], and σc is the contraction area ratio.
Δ p o u t = G 2 σ e 1 σ e ρ l 1 x o u t 2 1 ε o u t + ρ l x o u t 2 ρ v ε o u t
where σe is the expansion area ratio, and εout is calculated from Kawahara et al. [28].
Note that both σc and σe are defined as the ratio of the cross-sectional area in the test section to that in the joint and less than or equal to 1.
As listed in Table 2, the uncertainties related to the measuring apparatus and calculated parameters are obtained by utilizing the Kline and McClintock [29] approach.

4. Experimental Results and Discussion

The flow boiling HTC and FPD were measured with psat = 0.6 and 0.7 MPa (tsat = 31.3 and 36.7 °C, pr = 0.165 and 0.193), G = 540–870 kg/m2 s, and q = 25–65 kW/m2. Since the flow boiling characteristics were planned for the cooling design of electronic equipment via heat sinks, the saturation temperatures were higher than those used for absorbing heat from air via evaporators. Flow boiling characteristics of R1234ze(E) under high-reduced pressures will be tried in our next-step experiments through leveraging the details in [30]. To obtain “quasi-local” experimental data, the vapor quality variation (xout–xin) was controlled within 0.05–0.24. To minimize the impact of temperature accuracy on HTC, the measured data having a temperature difference (tw–tsat) less than 4 °C were neglected. Thus, 253 experimental data points on flow boiling HTC and 475 ones on FPD were taken.

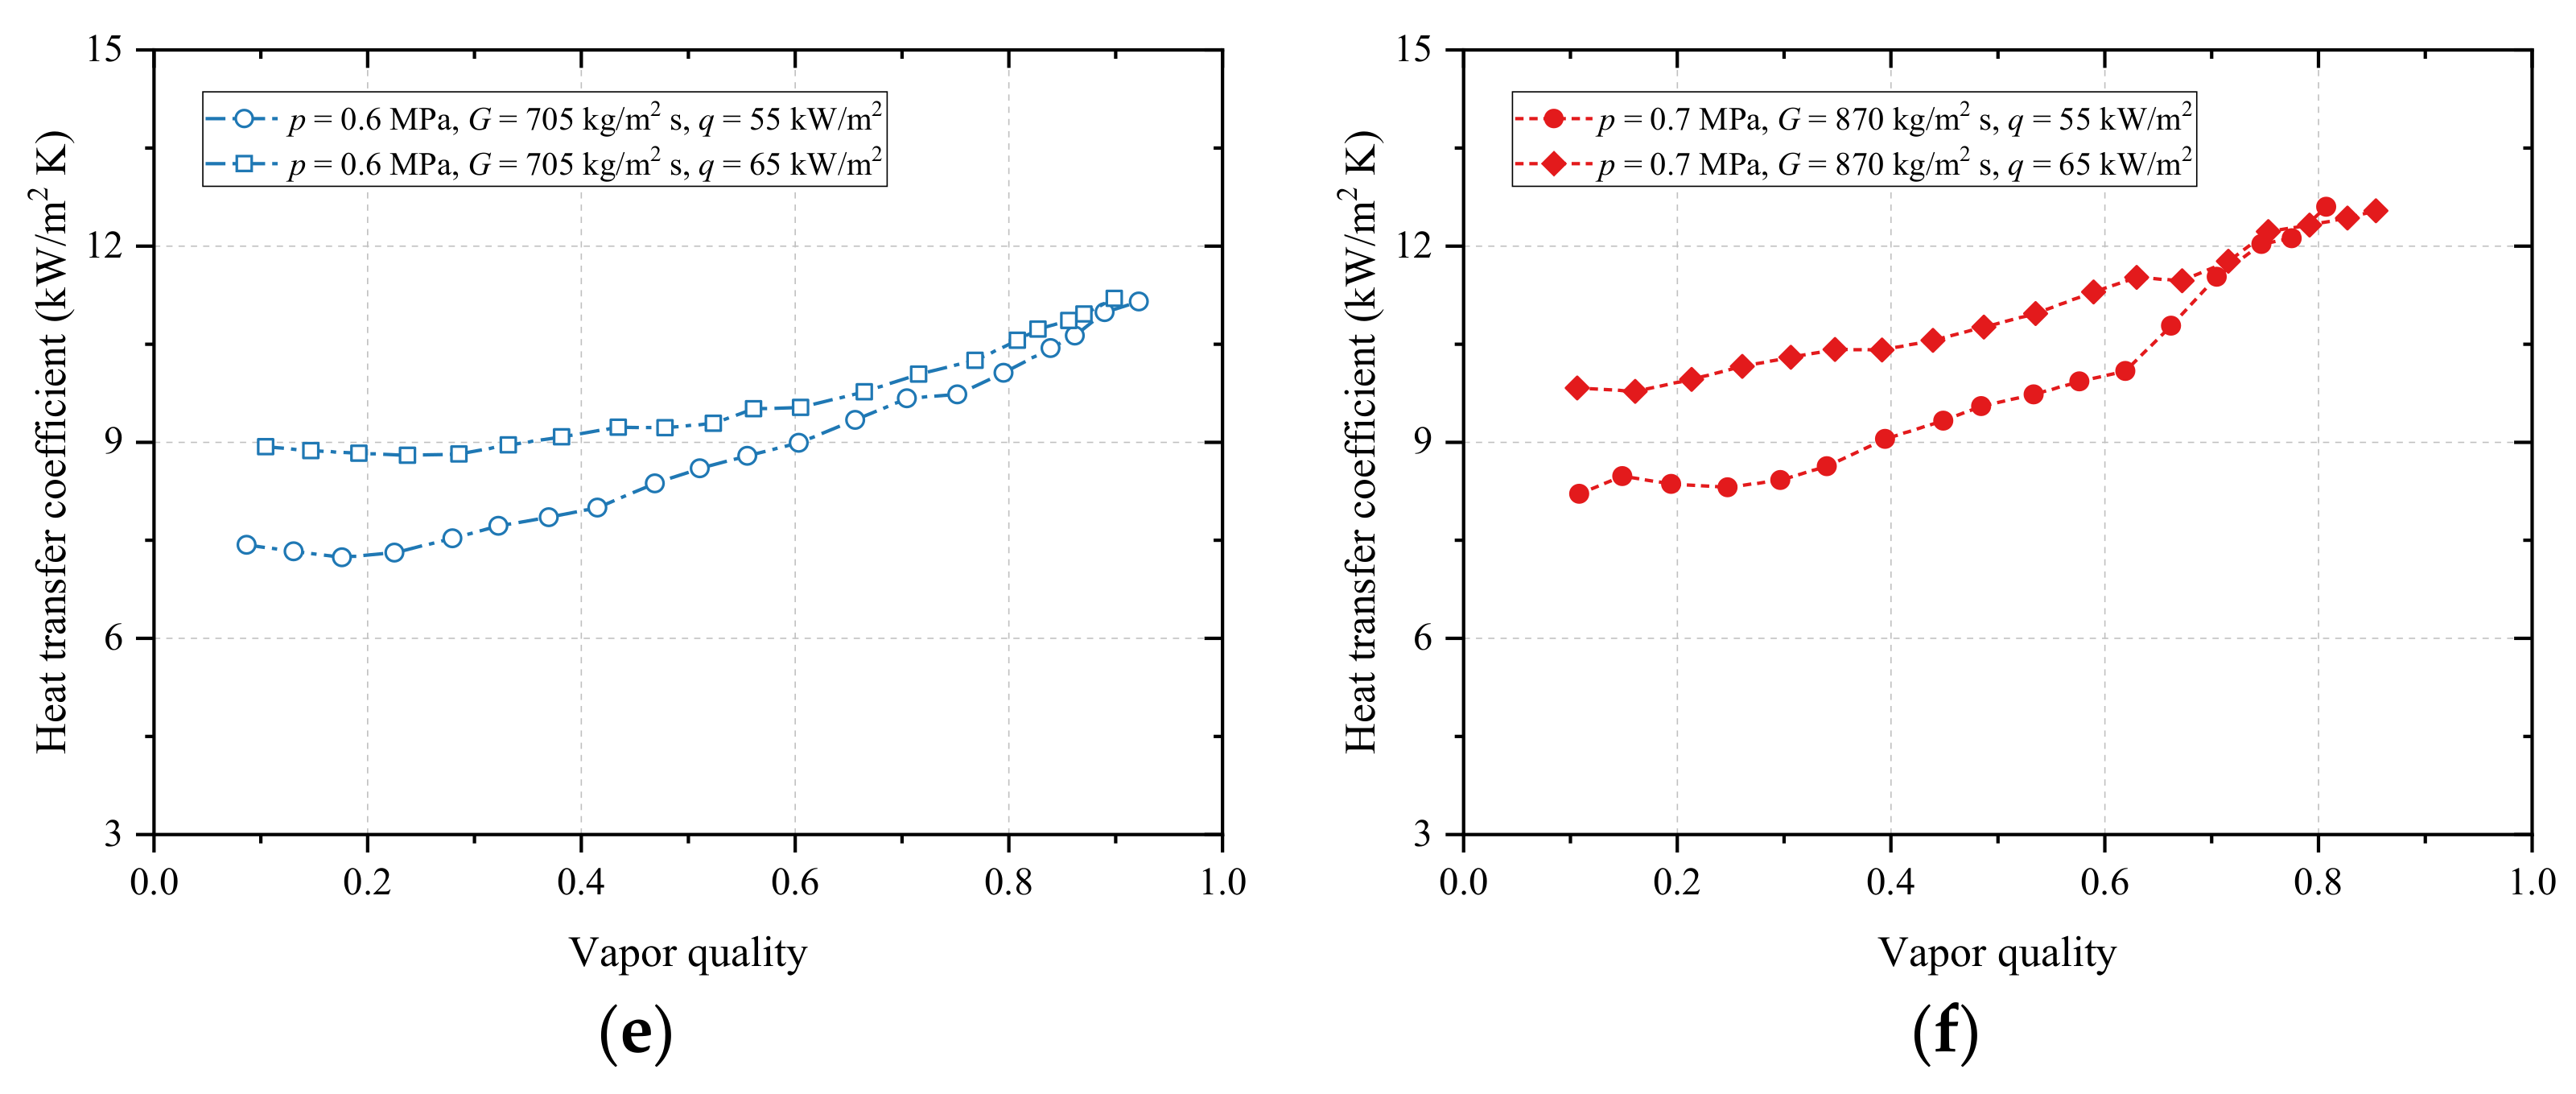
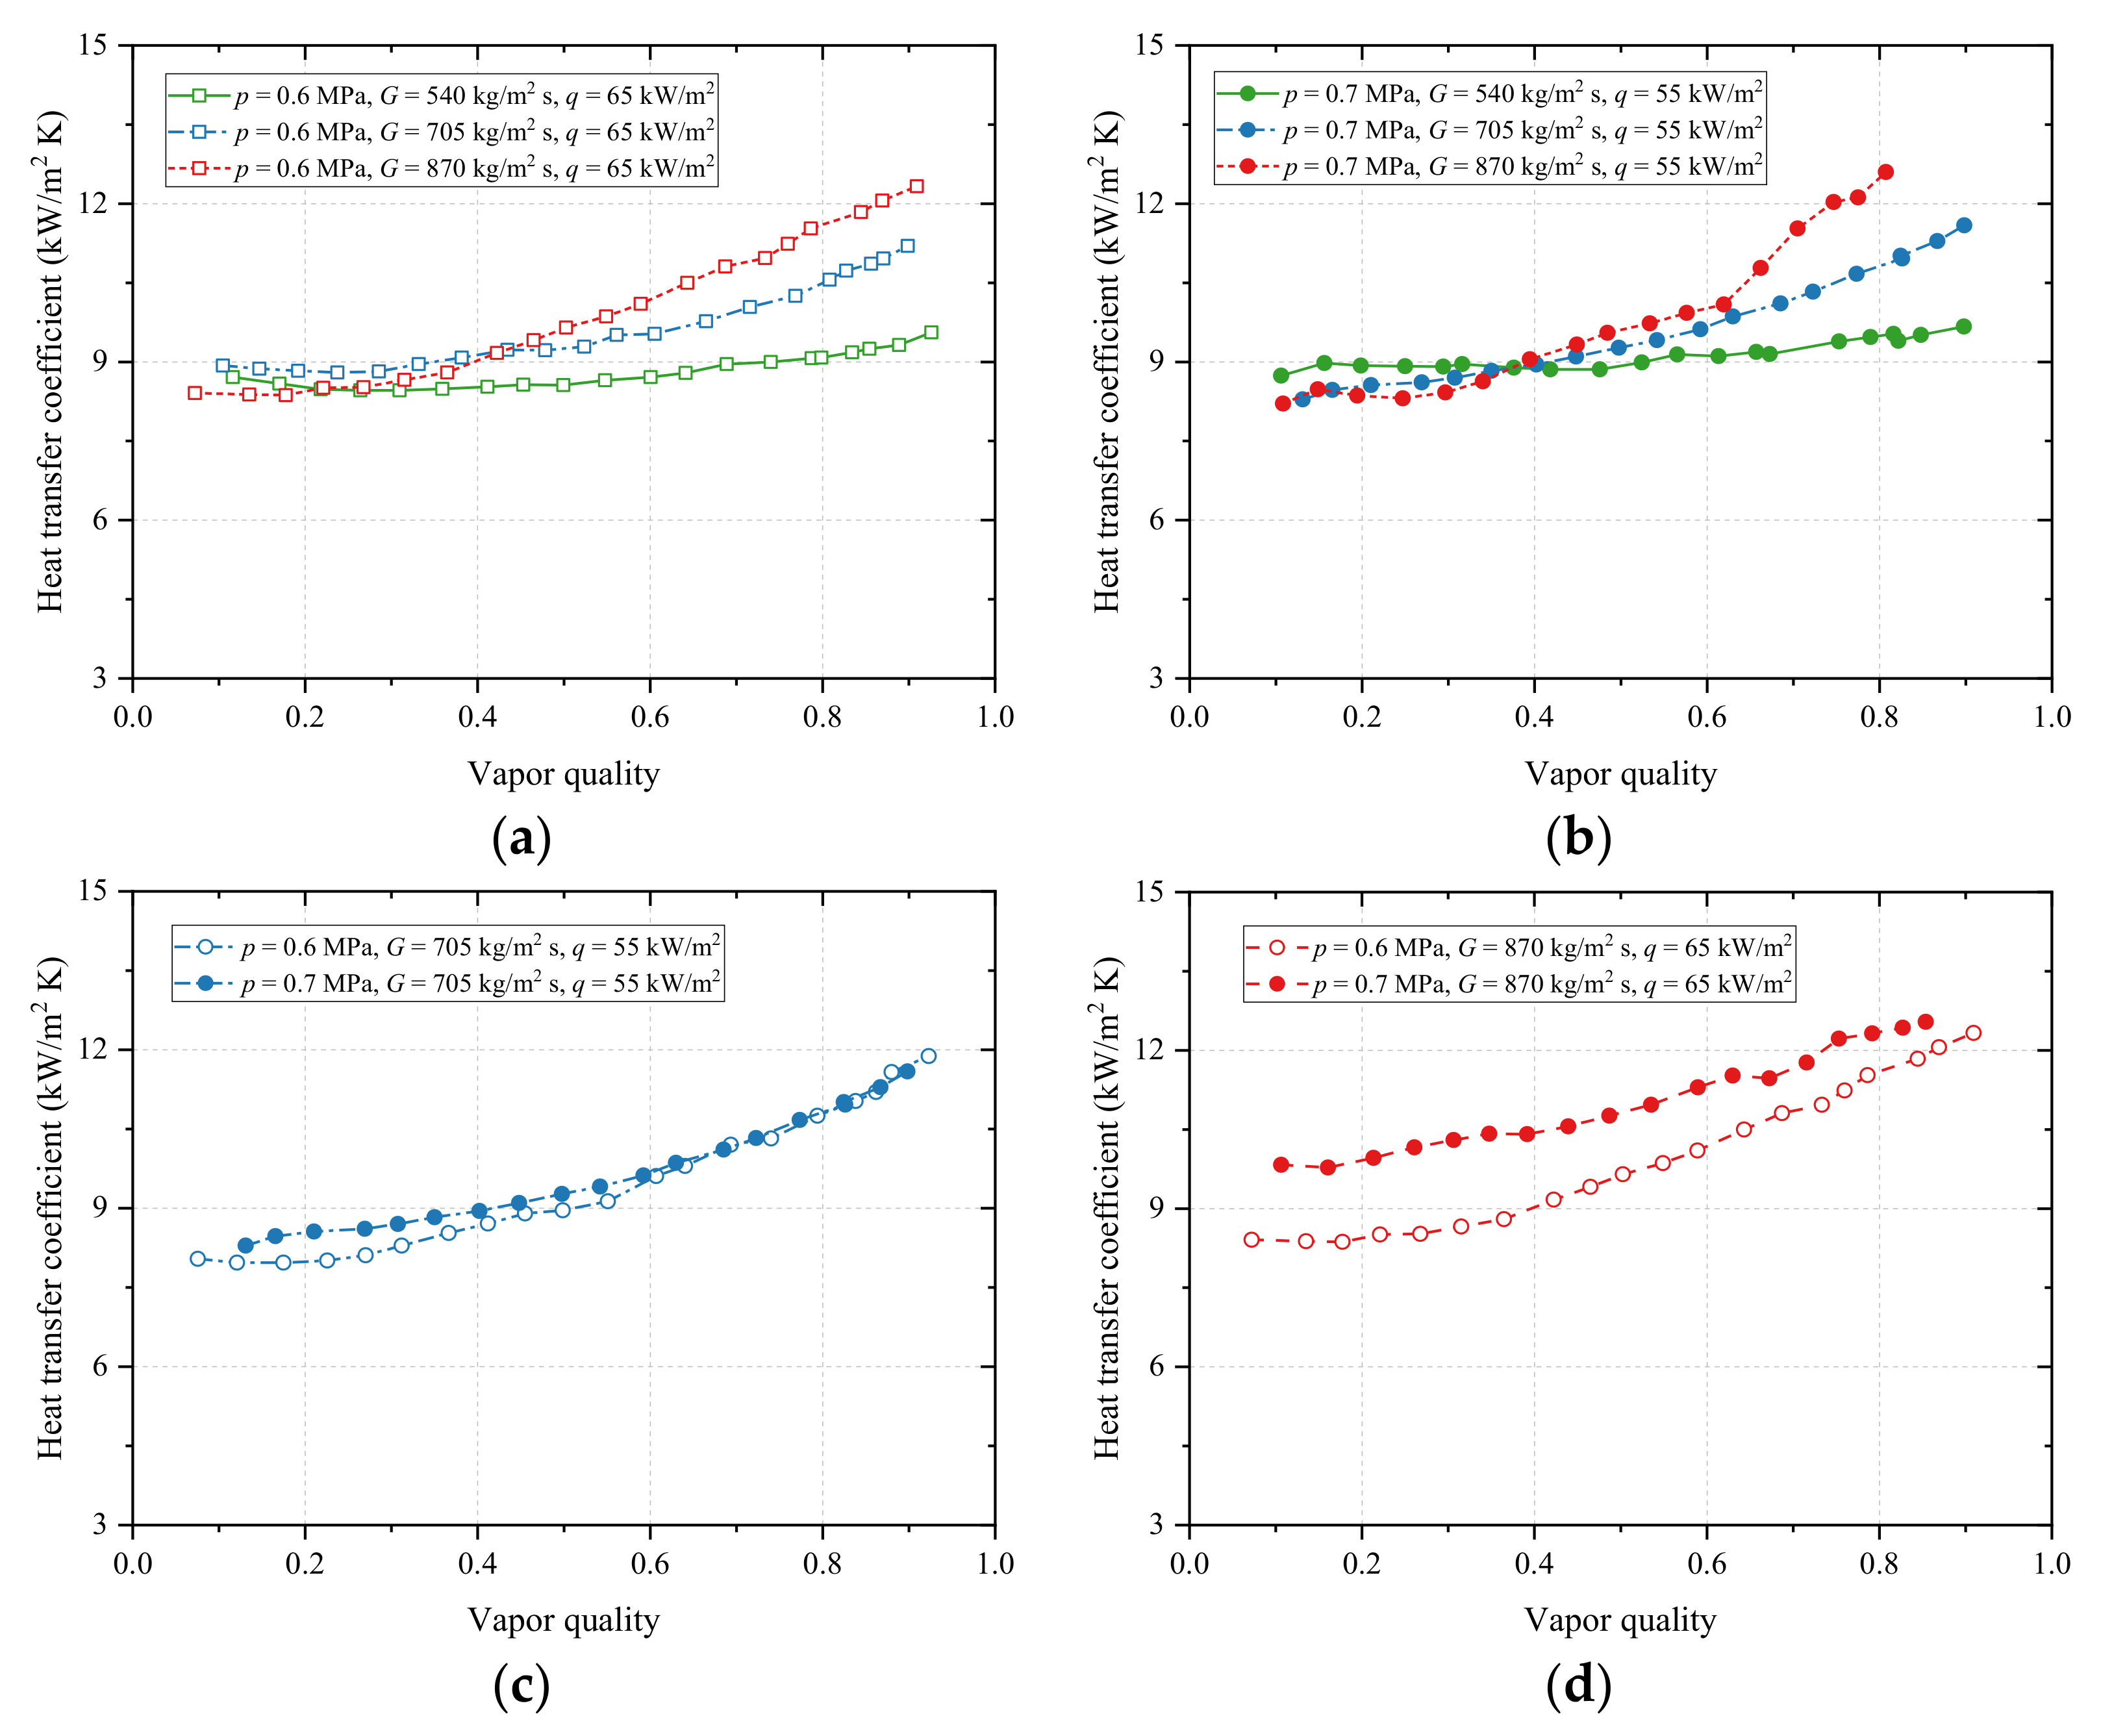
4.1. Flow Boiling HTC of R1234ze(E)

The effect of mass flux on HTC is displayed in Figure 5a,b. At lower vapor quality (x < 0.4), HTC alters with mass flux not obviously, because nucleate boiling plays a major role. However, at larger vapor quality (x ≥ 0.4), it is correlated with mass flux positively, because convective boiling dominates this region, and the increase of mass flux enhances convective boiling and then HTC. For example, when psat = 0.6 MPa and q = 65 kW/m2, HTCs corresponding to G = 540, 705, and 870 kg/m2 s are 8.48, 8.80, and 8.51 kW/m2 K for x nearby 0.20, while they are 8.71, 9.53, and 10.10 kW/m2·K for x nearby 0.60, as shown in Figure 5a. A similar explanation based on the heat transfer mechanism was also made by Sempértegui-Tapia and Ribatski [10].
The variation of HTC with saturation pressure is illustrated in Figure 5c,d. Obviously, the larger the saturation pressure is, the larger the HTC is. Moreover, the effect of saturation pressure is more significant at lower vapor quality. For instance, when G = 705 kg/m2 s, and q = 55 kW/m2, HTCs related to psat = 0.6, and 0.7 MPa are similar for x > 0.6, as shown in Figure 5c. On the one hand, this is because of the faster formation rate of bubbles at higher saturation pressure, leading to the nucleate boiling more intense. For another, the saturation pressure variation brings about the refrigerant thermophysical properties variation, affecting HTC through the coupling change of the surface tension and the vapor-liquid density ratio. A similar trend was also found by Vakili-Farahani et al. [17]
Figure 5e,f presents the impact of heat flux on HTC. HTC increases significantly with heat flux, especially at lower vapor quality. The extreme case occurs at psat = 0.7 MPa, and G = 870 kg/m2 s, where HTCs of q = 55, and 65 kW/m2 are close for x > 0.7, as shown in Figure 5f. This is due to the increase of super heat degree of the tube wall for higher heat flux, resulting in the increase of the vaporization core number, and the acceleration of the growth and detachment of bubbles, strengthening the nucleate boiling. At higher vapor quality, the nucleate boiling is inhibited, and the function of heat flux is reduced.
The tendency of HTC with vapor quality can be deduced from Figure 5. Since the nucleate boiling governs the heat transfer at lower vapor quality, HTC mainly relies upon heat flux rather than mass flux and vapor quality, and changes marginally in this region. Conversely, the convective boiling dominates the higher vapor quality region, where HTC rises with mass flux and vapor quality.

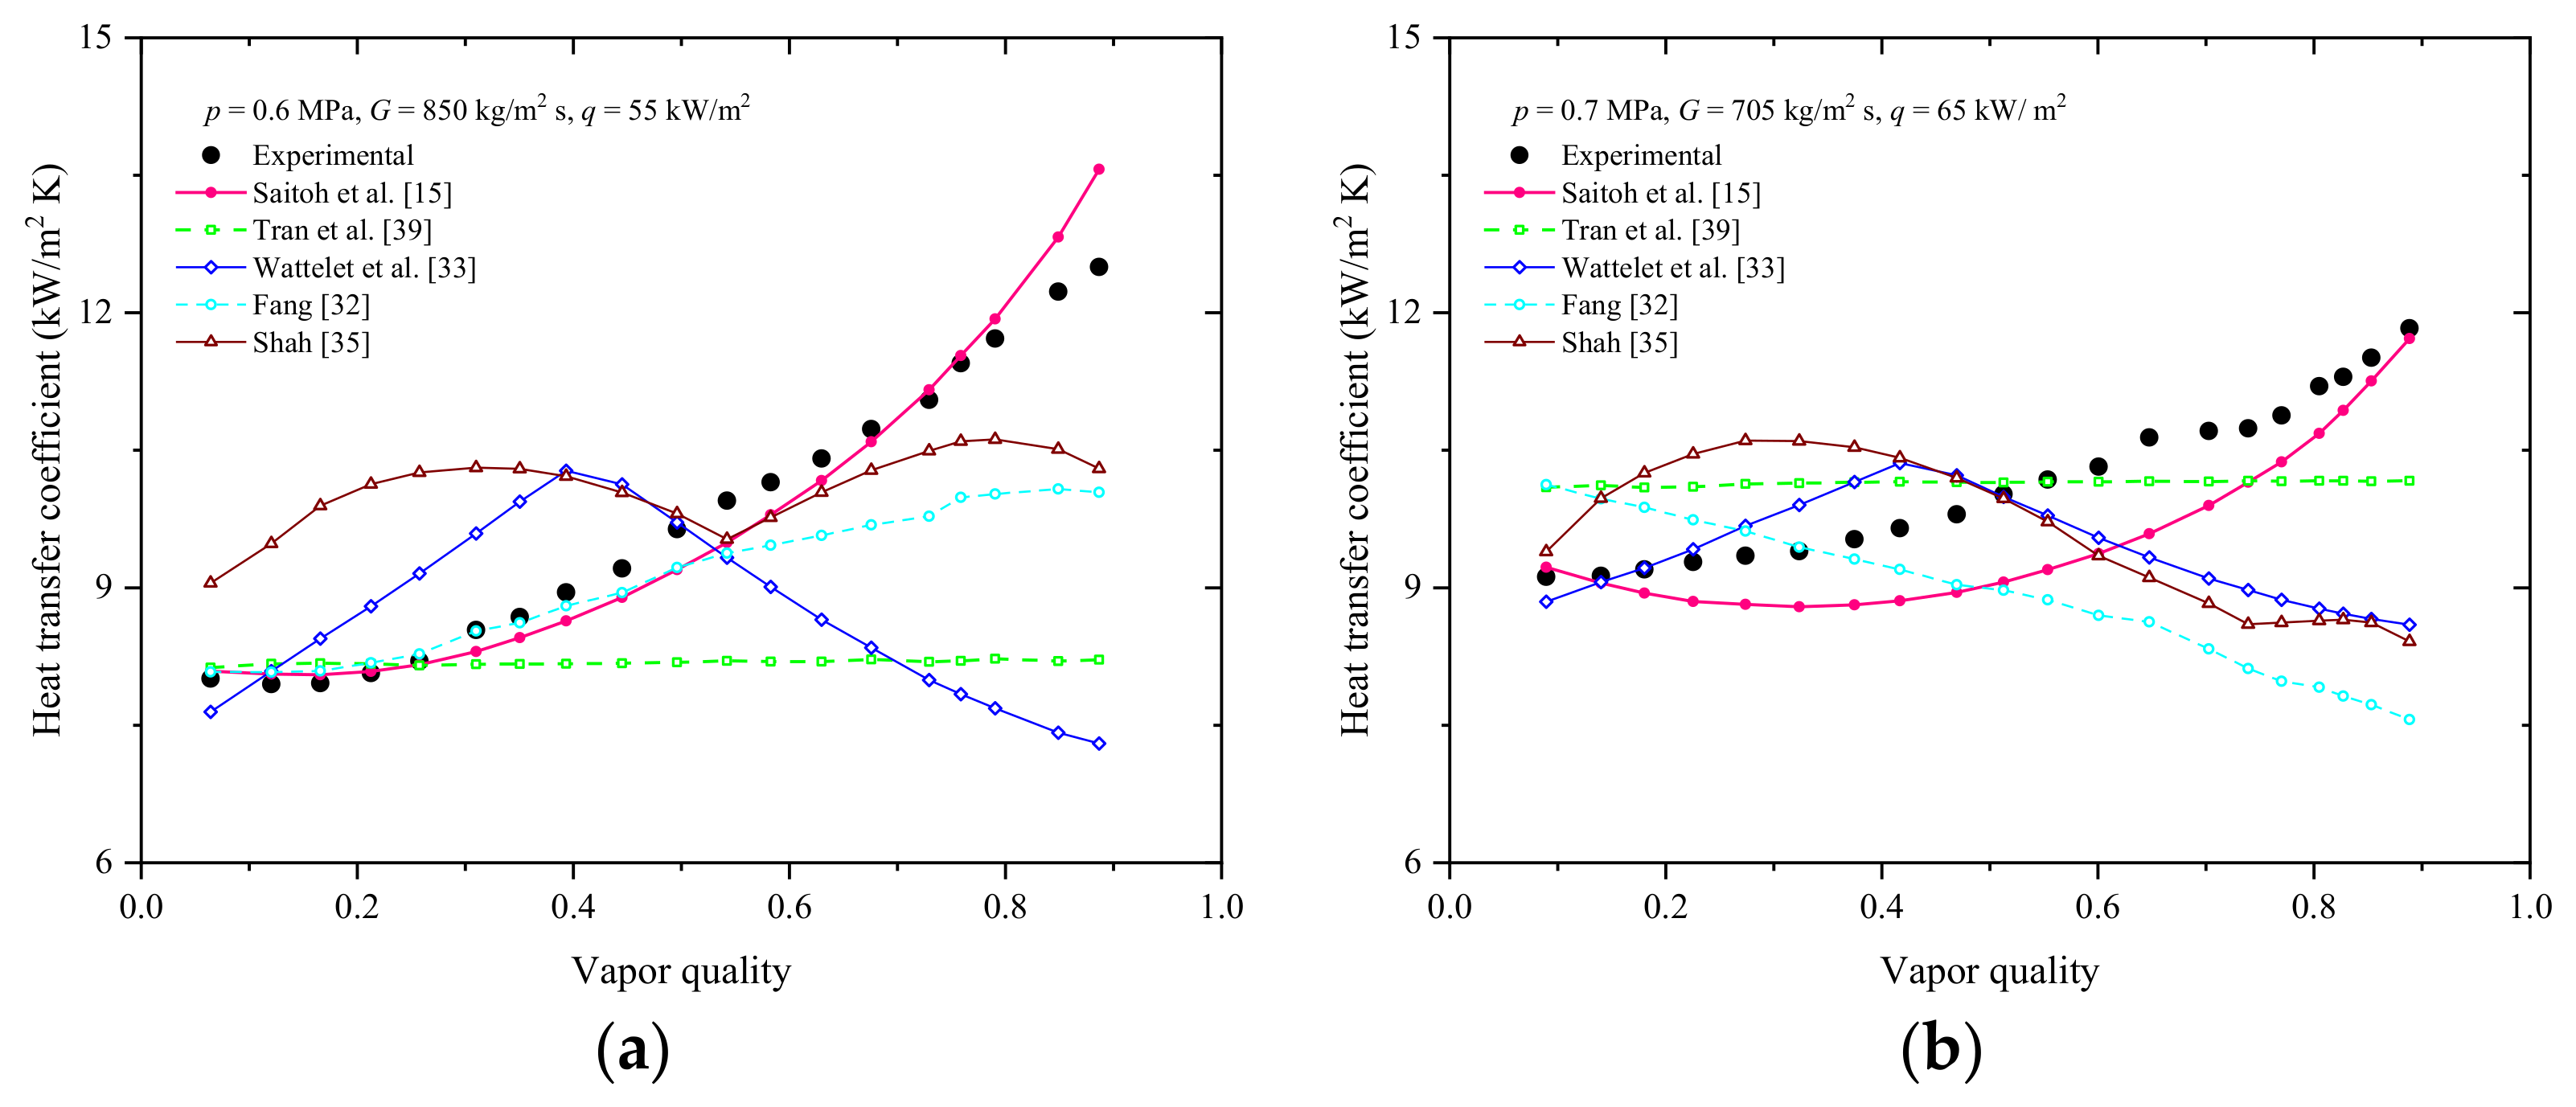
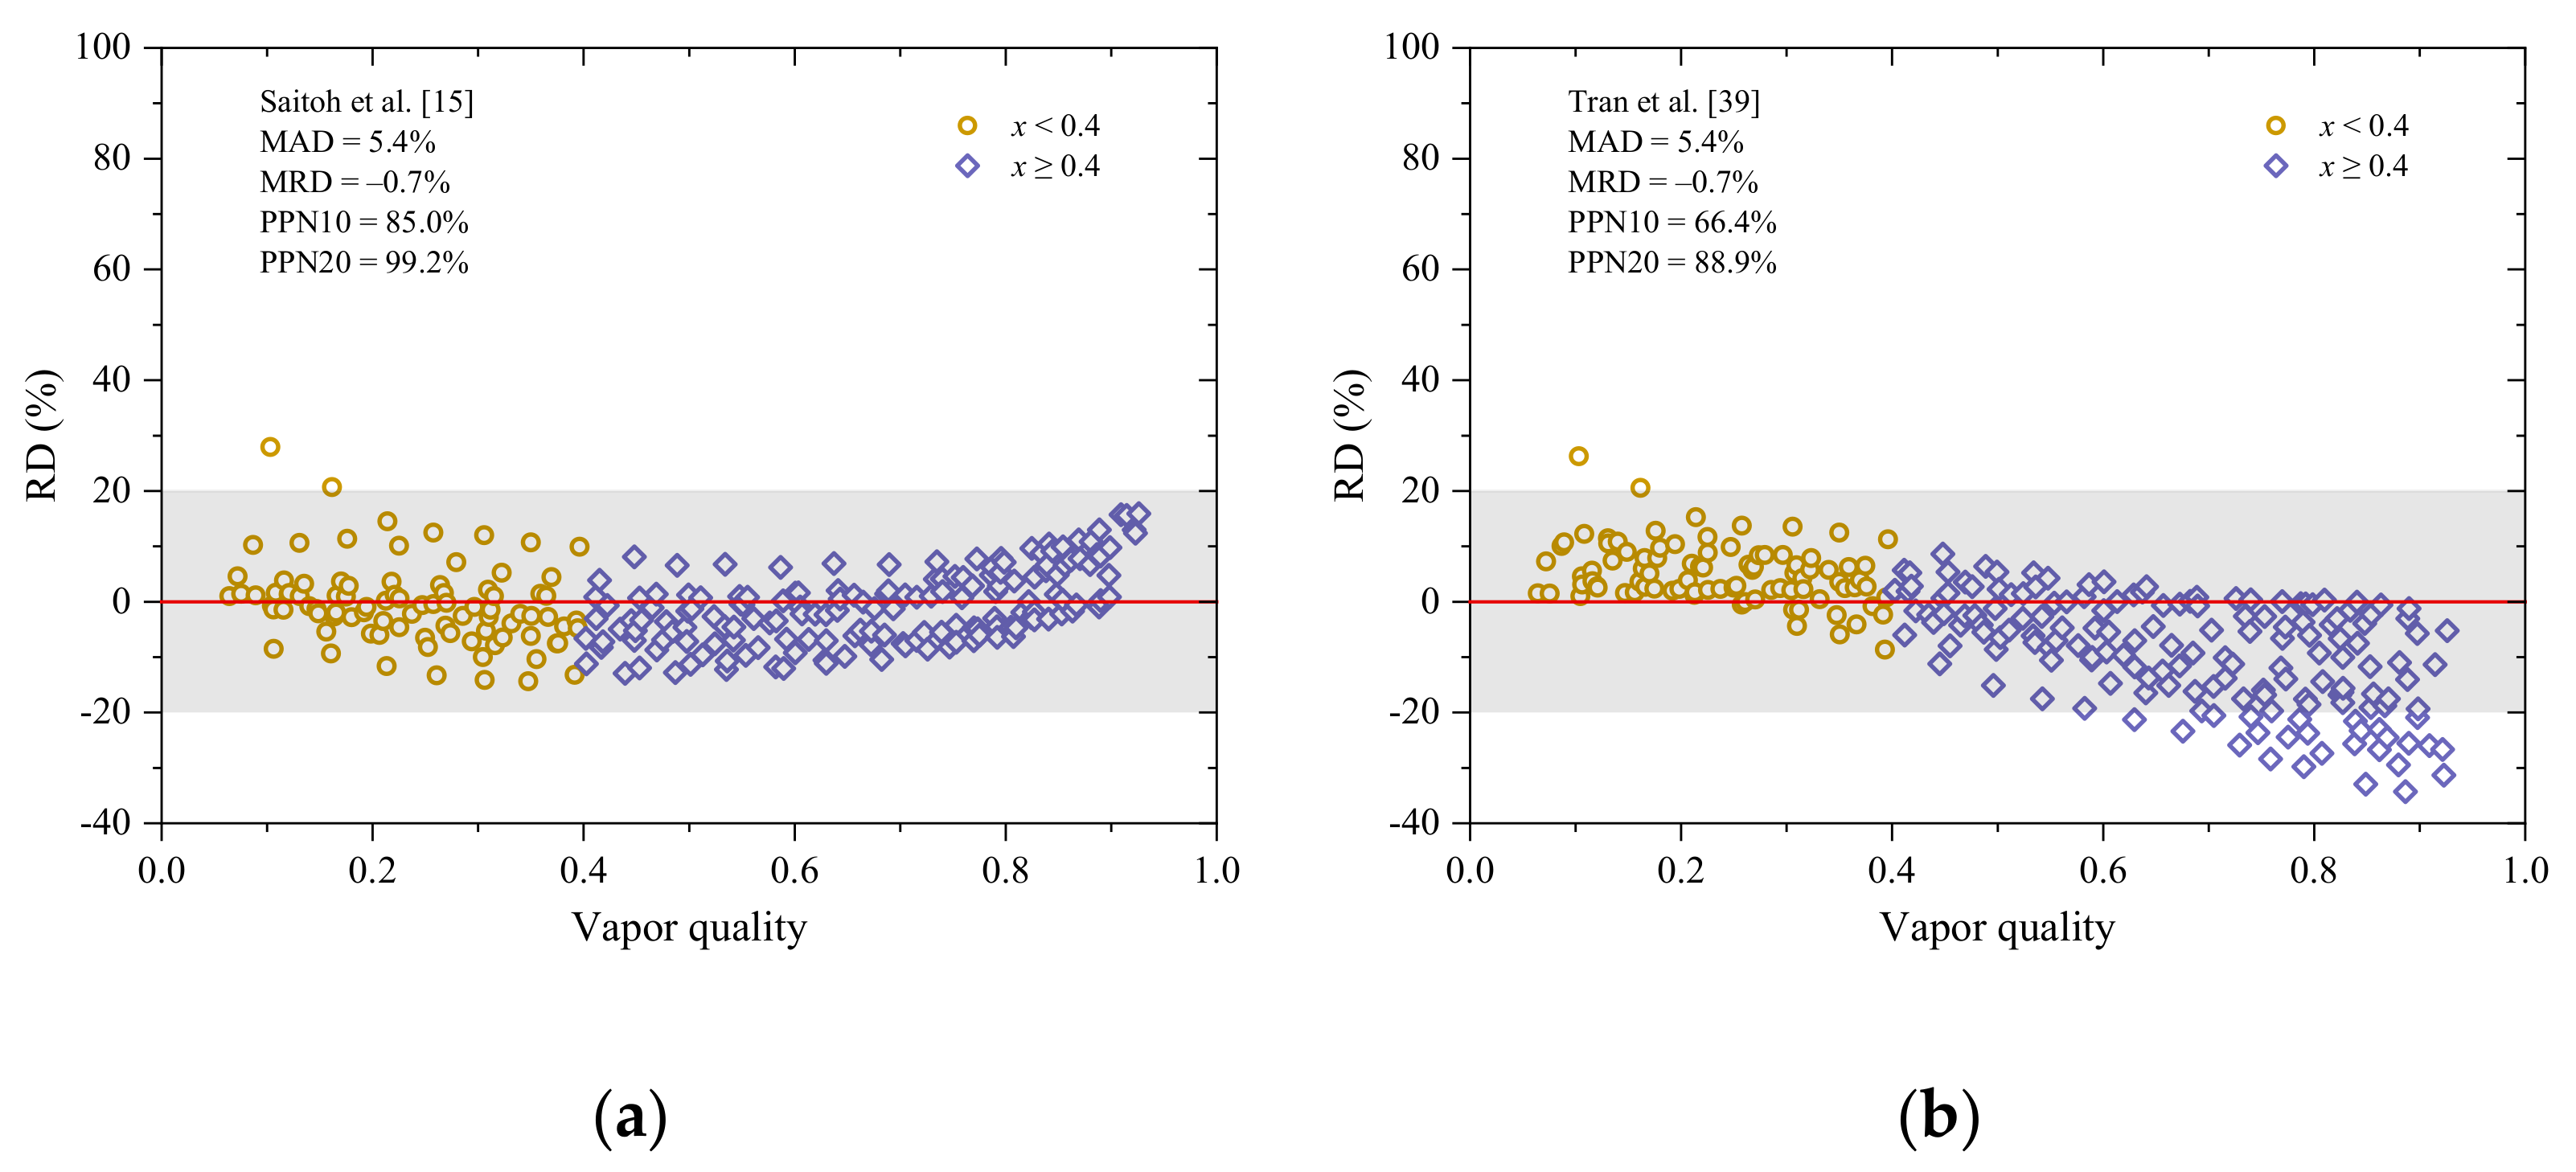
4.2. Comparison with HTC Correlations

With the 253 measured HTC data points, twelve existing correlations of two-phase HTC recommended by Xu et al. [31] are compared, including those of Fang [32], Wattelet et al. [33], Gungor and Winterton [34], Shah [35], Saitoh et al. [15], Sun and Mishima [8], Liu and Winterton [36], Jung et al. [37], Bertsch et al. [9], Li and Wu [38], Tran et al. [39], and Cooper [40]. The comparison results are summarized in Table 3, where MAD and MRD represent the mean absolute deviation and the mean relative deviation, and PPN10 and PPN20 mean the percentages of the data points having the relative deviation (RD) within ±10% and ±20%.
MAD = 1 n i = 1 N RD
MRD = 1 N i = 1 N RD
R D = y i p r e d y i e x p y i e x p
where y(i)pred and y(i)exp represent the predicted and experimental HTC or FPD, respectively, and N is the data points number.
It is evident from Table 3 that the correlation of Saitoh et al. [15] established according to the flow boiling HTC of R134a by introducing the effect of tube diameter (Dh = 0.51–10.92 mm) performs most accurately with an MAD of 5.4%. The MAD of the correlation of Tran et al. [39] developed based on HTC of R12 and R113 in small channels (Dh = 2.40–2.92 mm) is 8.6%. Actually, the correlation of Saitoh et al. [15] considered the coupling influence of both nucleate and convective boiling, and similar correlations are those of Wattelet et al. [33], Jung et al. [37], Liu and Winterton [36], and Bertsch et al. [9]. In contrast, the correlation of Tran et al. [39] considered only the effect of nucleate boiling and treated HTC to be independent of vapor quality, and similar correlations are those of Cooper [40], and Sun and Mishima [8]. However, both the Saitoh et al. [15] and Tran et al. [39] correlations yield the MAD less than 10%, as HTC does not alter dramatically (6.5–12.6 kW/m2 K), especially at lower vapor quality (x < 0.4) where nucleate boiling plays a dominant role. The PPN10 and PPN20 of the Saitoh et al. [15] correlation are 85.0% and 99.2%, and those of the Tran et al. [39] correlation are 66.4% and 88.9%. Their error distributions are illustrated in Figure 6.
In addition, there are eight correlations with the MAD within 10%–20%, which are those of Wattelet et al. [33], Fang [32], Shah [35], Gungor and Winterton [34], Cooper [40], Li and Wu [38], Sun and Mishima [8], and Jung et al. [37], with MADs of 12.7%, 13.3%, 13.6%, 17.6%, 18.1%, 18.1%, 18.3%, and 18.7%. Among them, those of Fang [32], Gungor and Winterton [34], Shah [35], and Li and Wu [38] considered that the flow boiling HTC could be decided via multiplying the single-phase HTC by the enhancement factors. Although the Fang [32] correlation was created according to the experimental HTC of R134a with Dh = 0.19–8 mm, it still performs satisfactorily for the present refrigerant, because it takes the effect of wall temperature into account.
Only two correlations have a MAD larger than 20%, which are those of Liu and Winterton [36] and Bertsch et al. [9] with MADs of 21.4% and 27.1%.
As displayed in Figure 7, the comparisons between the experimental HTCs and the calculated results by the top five correlations indicate that the Saitoh et al. [15] correlation catches the experimental trend best, while the Tran et al. [39] correlation does not catch at larger vapor quality.

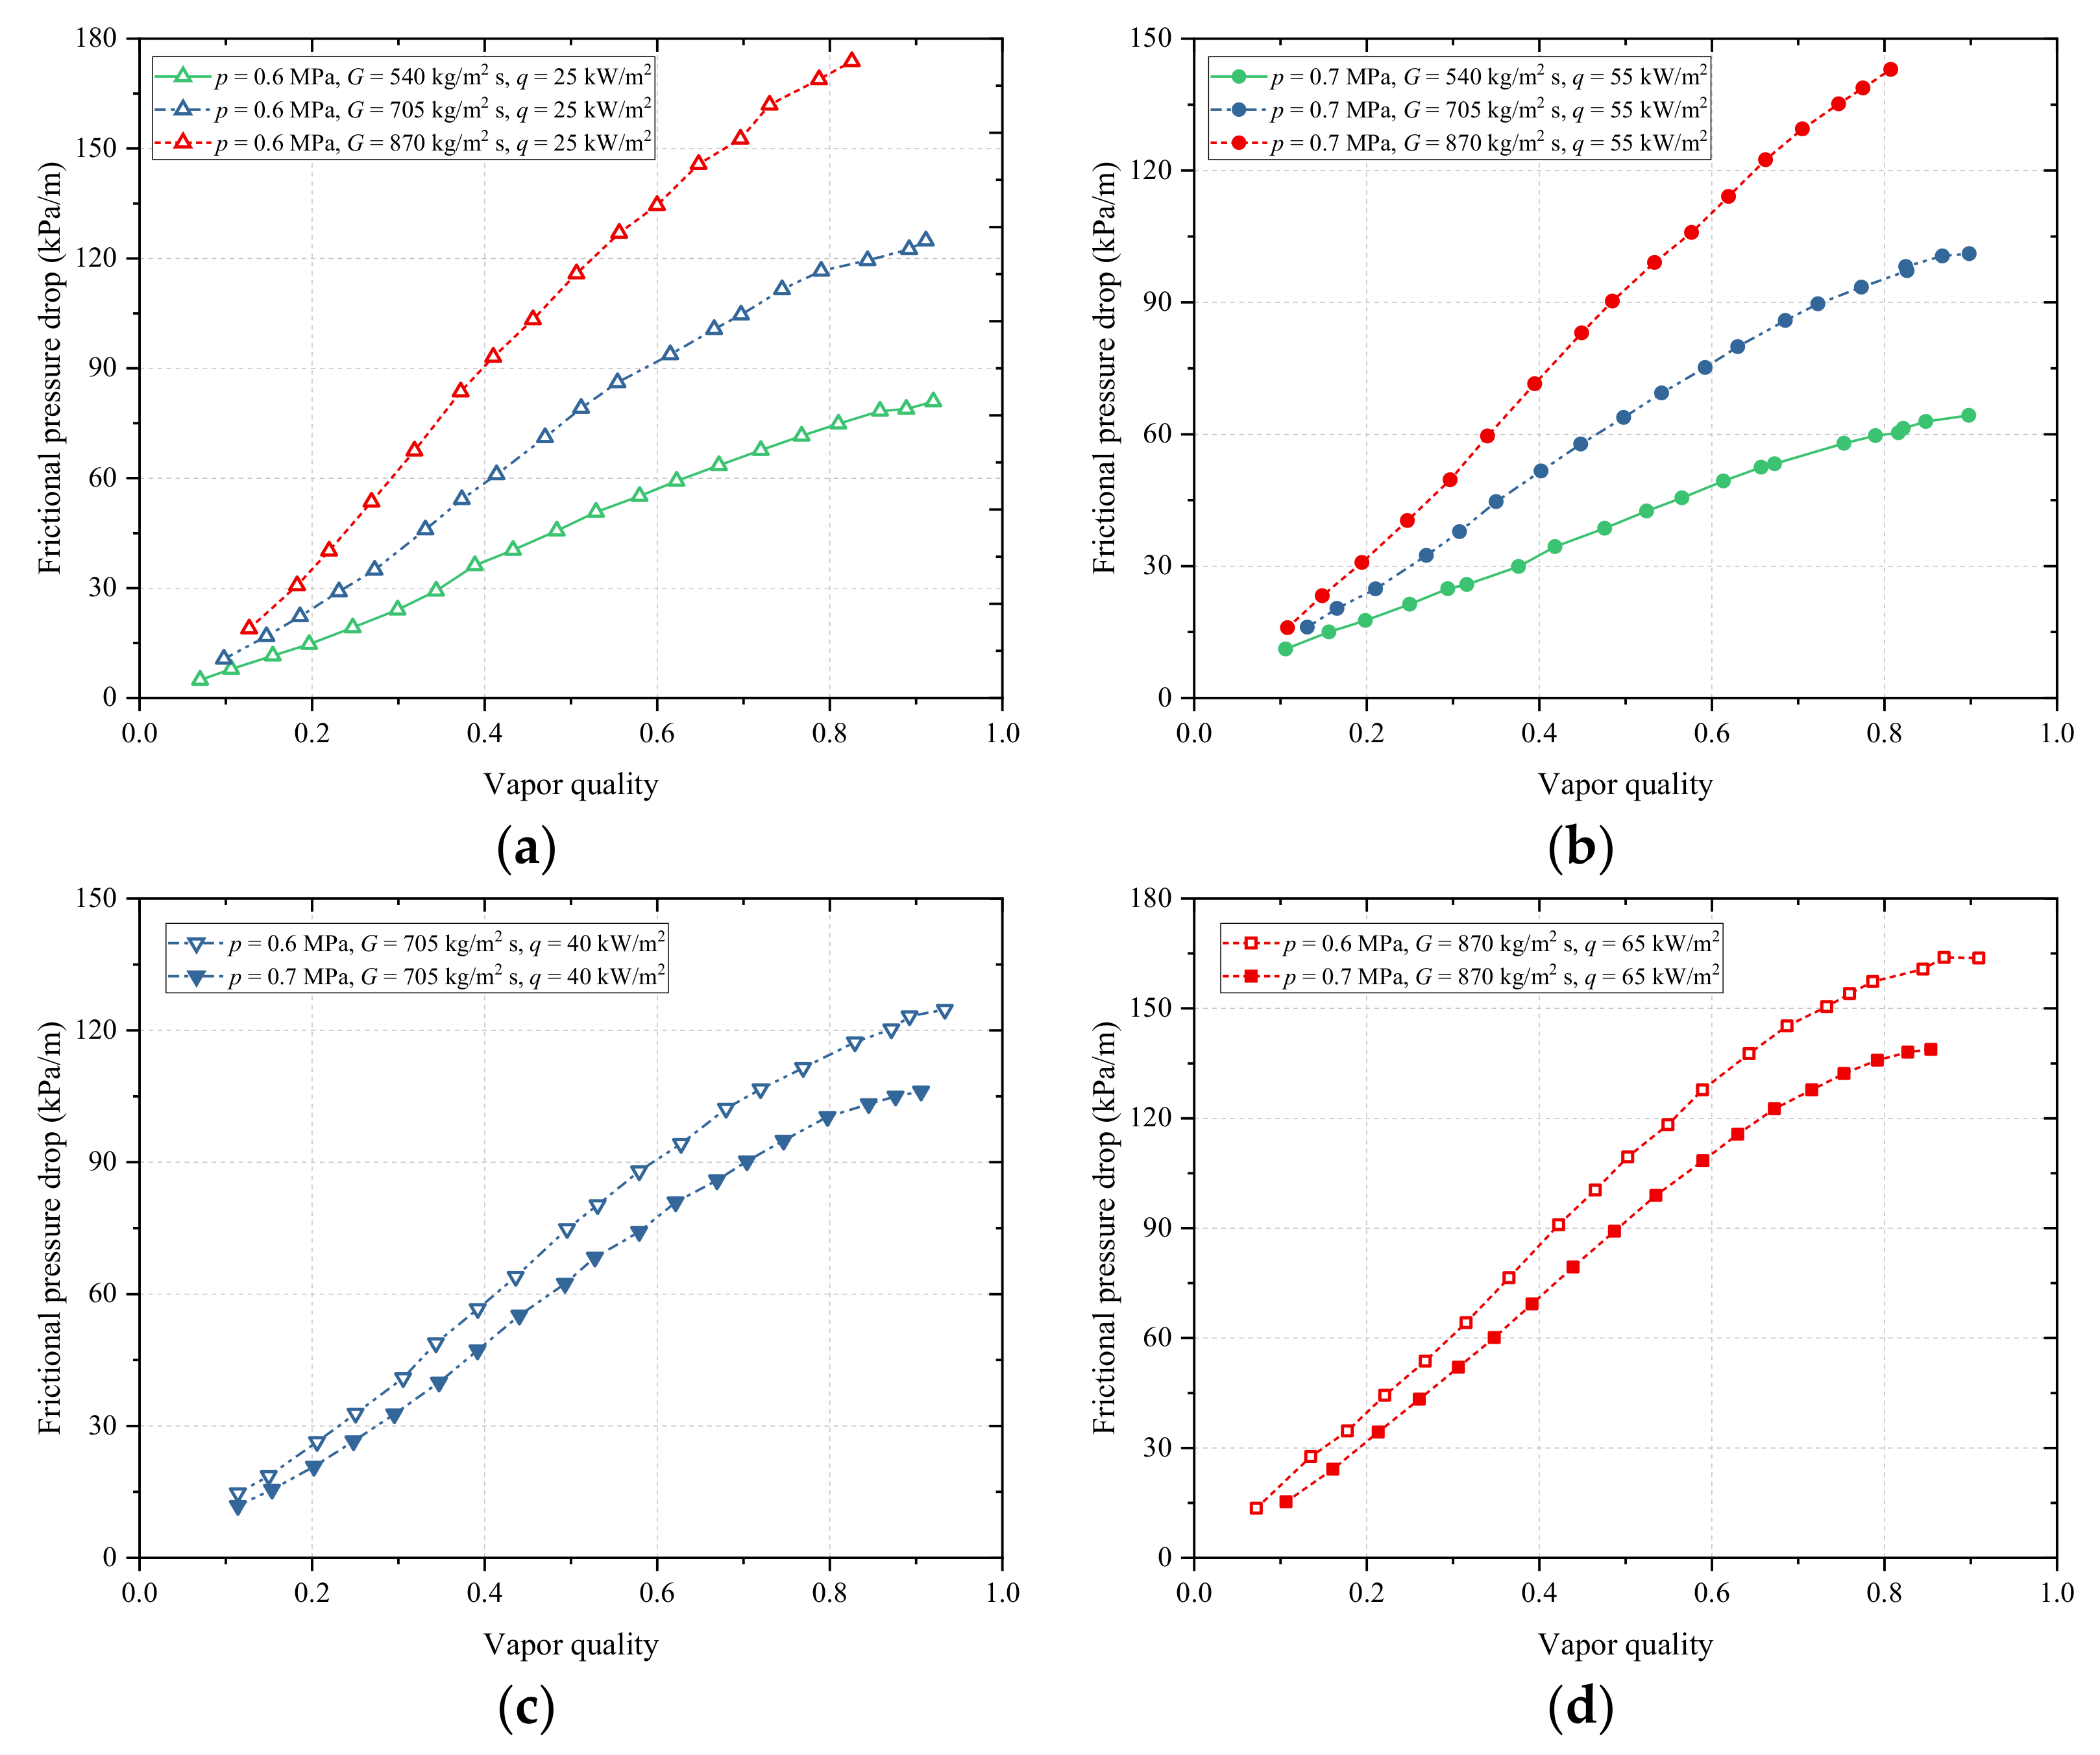
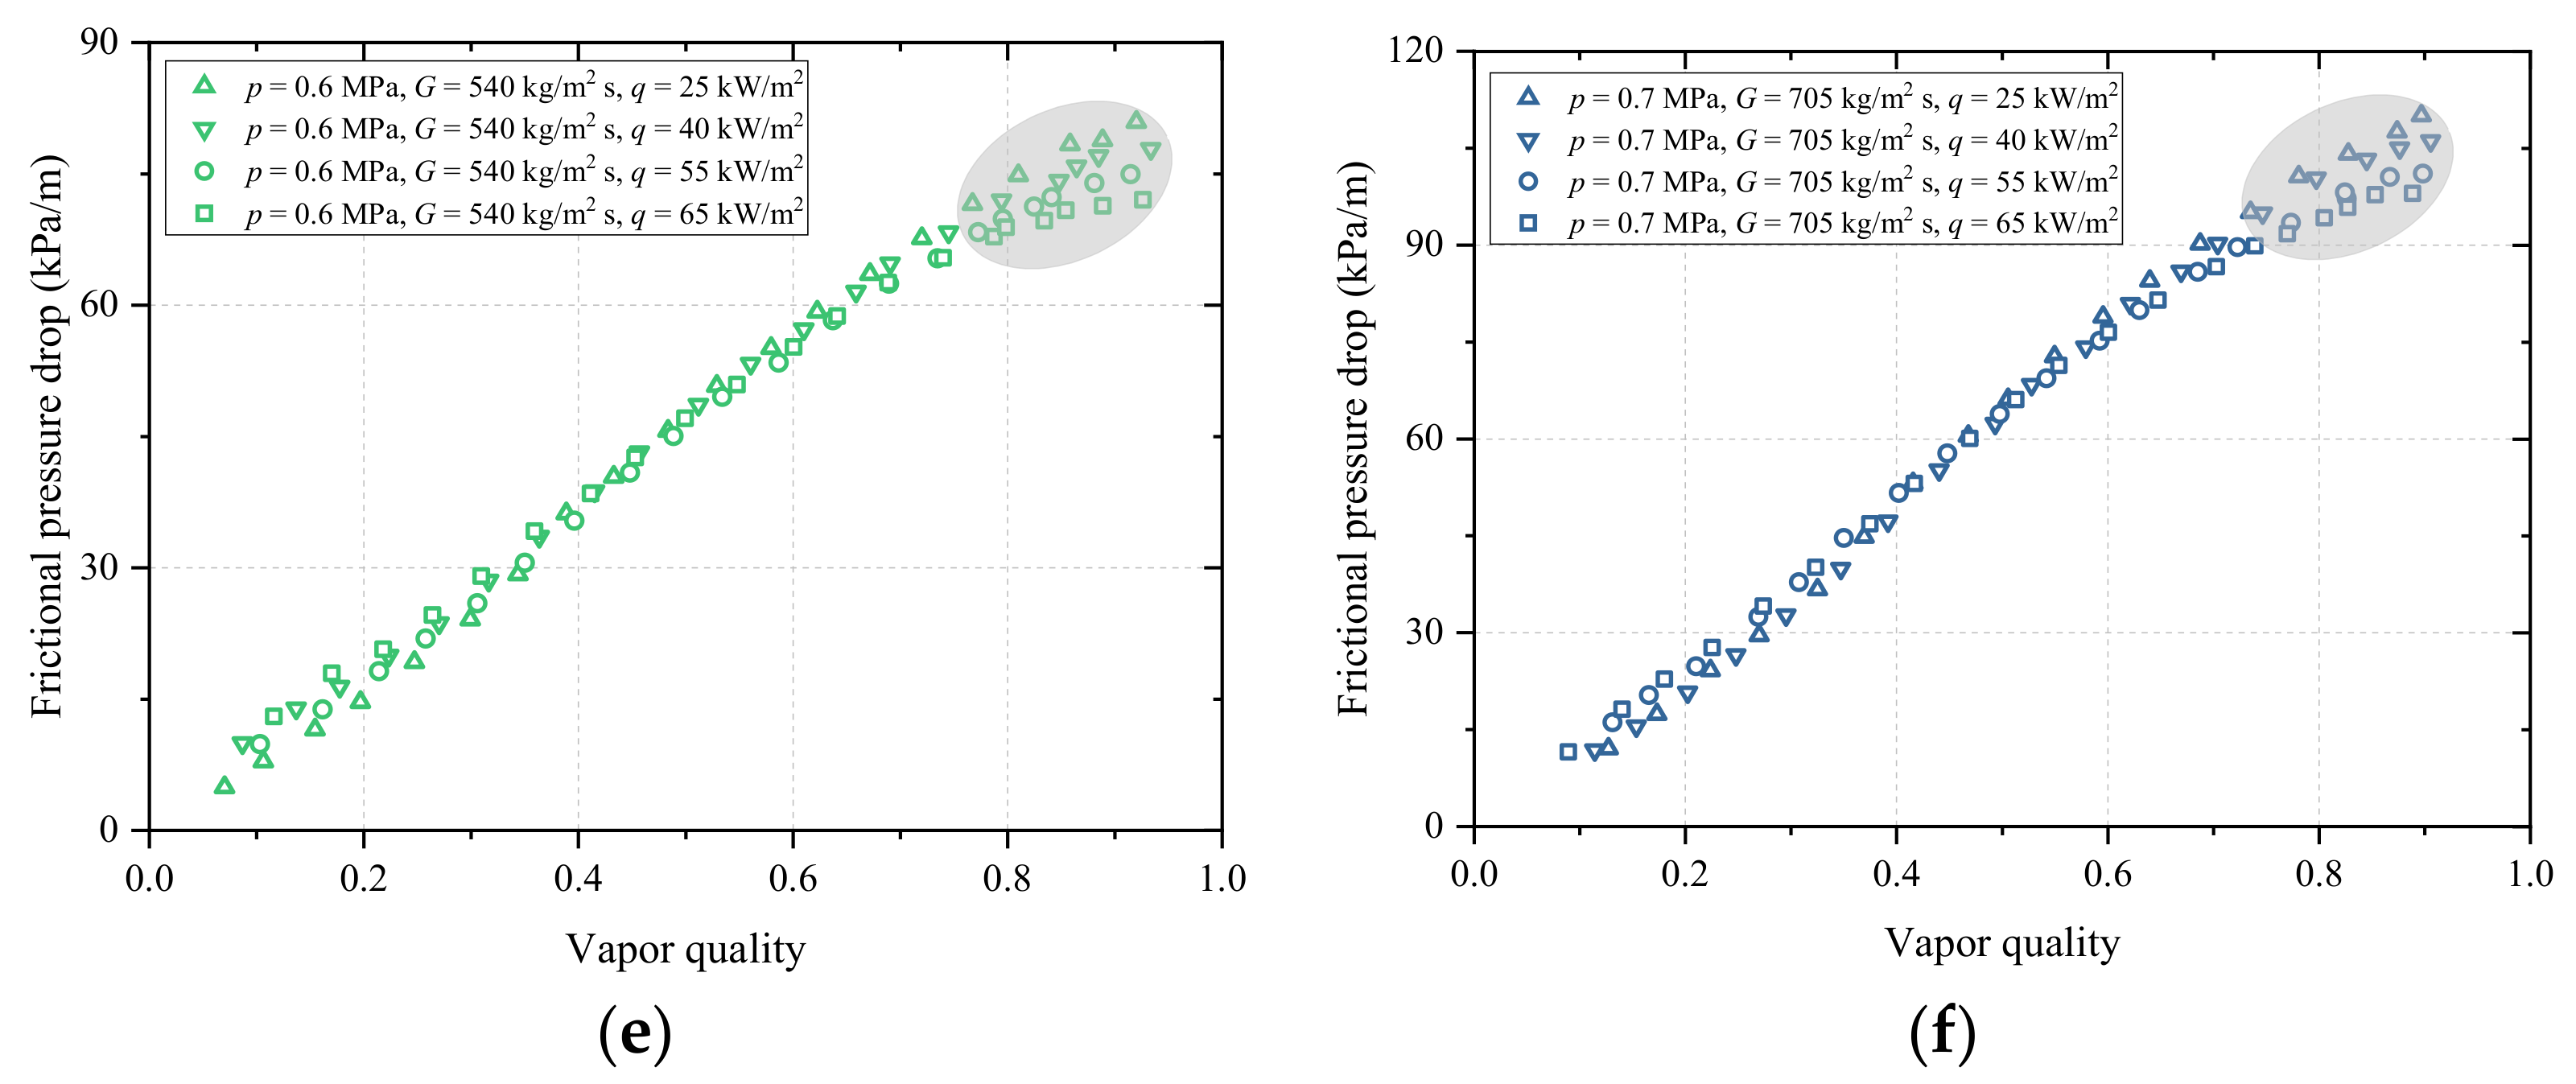
4.3. Flow Boiling FPD of R1234ze(E)

The impact of mass flux on FPD is displayed in Figure 8a,b. FPD is affected by mass flux positively whose effect is enhanced with the increasing vapor quality. For example, when psat = 0.6 MPa, and q = 65 kW/m2, FPDs corresponding to G = 540, 705, and 870 kg/m2 s are 14.66, 22.27, and 30.73 kPa/m for x nearby 0.20, while they are 59.24, 93.75, and 134.5 kPa/m for x nearby 0.60, as shown in Figure 8a. This is because the increasing mass flux brings about the increasing velocity of both liquid and vapor phases as well as the vapor–liquid shear stress, resulting in larger FPD.
The relation between FPD and saturation pressure is illustrated in Figure 8c,d. FPD presents diminution for greater saturation pressure. For instance, when G = 870 kg/m2 s, and q = 65 kW/m2, FPDs of psat = 0.6 and 0.7 MPa are 127.79, and 108.38 kPa/m for x nearby 0.60, as shown in Figure 8d. This is because of the refrigerant property change. Specifically, the decrease of saturation pressure brings about the increase of vapor velocity due to the reduction of vapor viscosity and density, as well as the increase of liquid viscosity, yielding the increase of FPD.
As apparent in Figure 8e,f, the impact of heat flux on FPD is not significant or negligible in most conditions, except in larger vapor qualities where FPD rises slightly with heat flux. Previous experiments of Longo et al. [3] also revealed a similar trend.
An FPD trend with vapor quality is clearly displayed in Figure 8. Larger FPD corresponds to larger vapor quality. This is because with the increase of vapor quality, the average density of the vapor–liquid mixture decreases and the average velocity increases, leading to larger FPD. However, as vapor quality increases, FPD slows down or even begins to decline. This is because the dry-out occurs, the liquid film is destroyed, and the liquid phase enters the vapor phase in the form of liquid drops, resulting in smaller FPD.

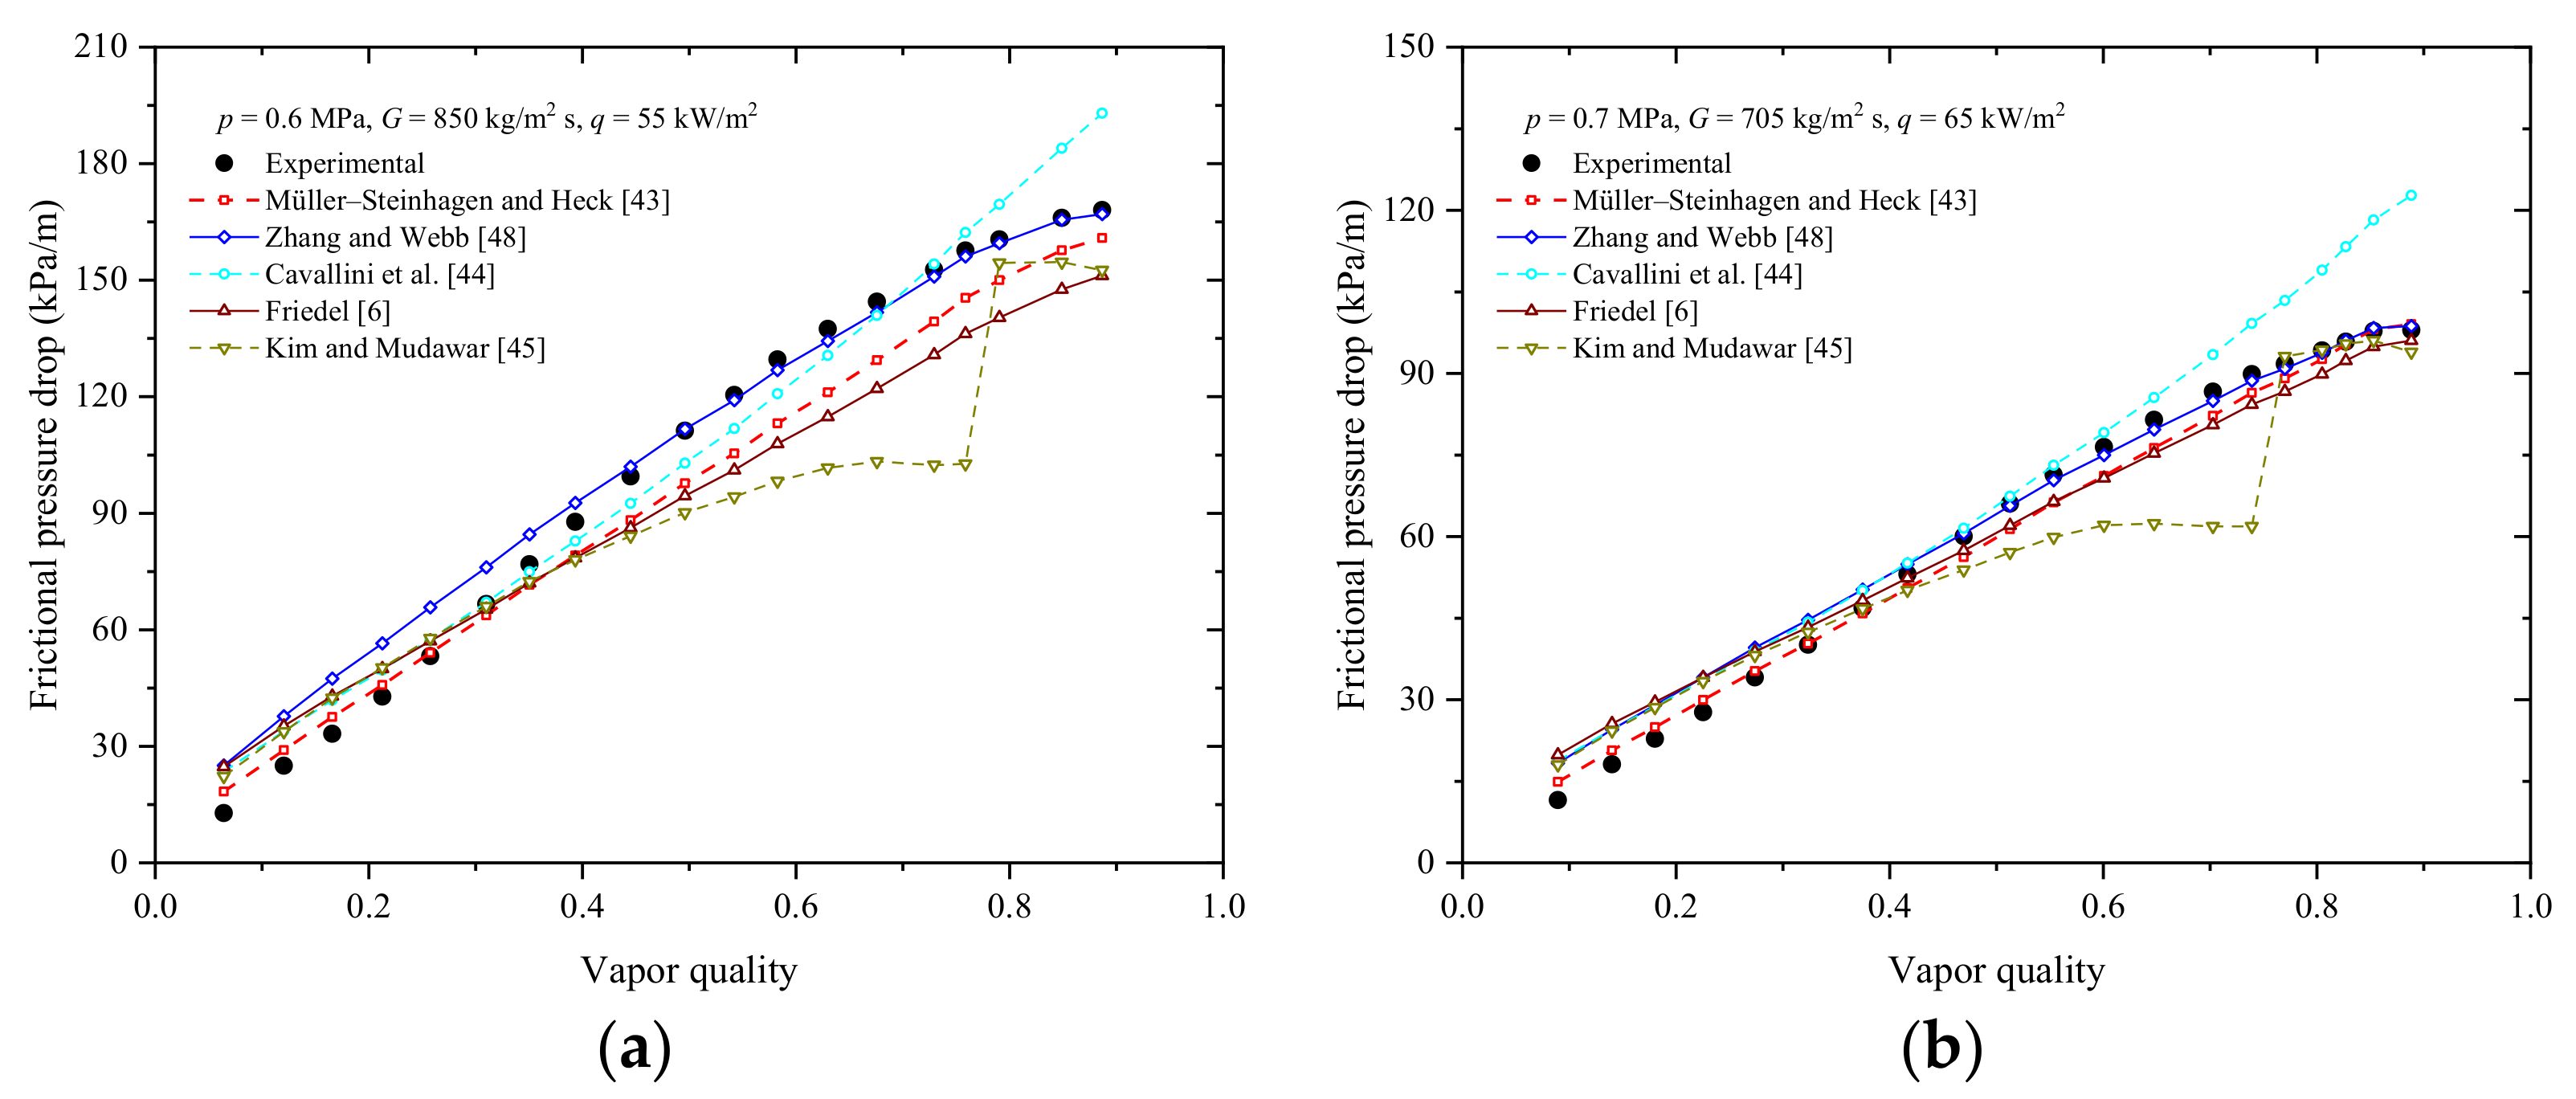
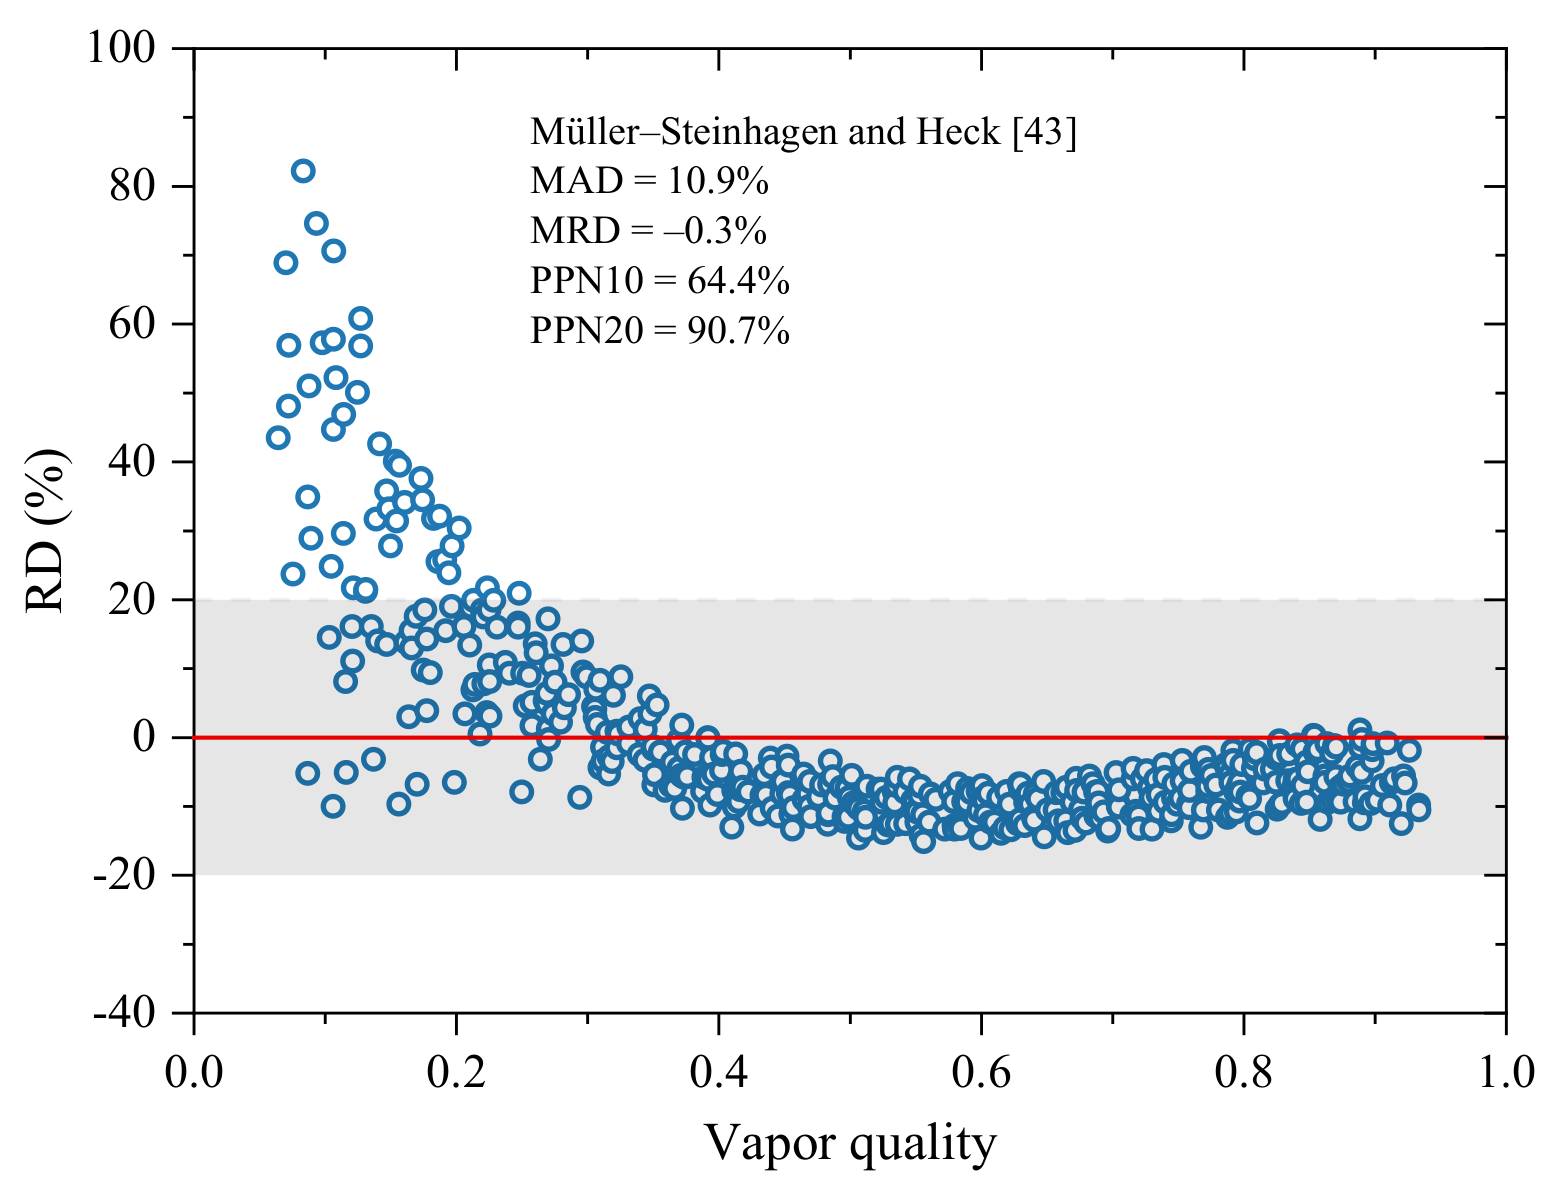
4.4. Comparison with FPD Correlations

Based on the 475 measured FPD data points, ten existing correlations of two-phase FPD suggested by Xu et al. [41] are compared, including those of Xu and Fang [42], Friedel [6], Müller-Steinhagen and Heck [43], Cavallini et al. [44], Kim and Mudawar [45], Cicchitti et al. [46], Grönnerud [47], Zhang and Webb [48], Shannak [49], and Li and Wu [50]. The comparison results are summarized in Table 4.
It is obvious from Table 4 that the correlation of Müller-Steinhagen and Heck [43] developed based on an extrapolation method and evaluated by 9300 measurements of FPD for various fluids yields the smallest MAD of 10.9%. There are another four correlations with MAD less than 20%, which are those of Zhang and Webb [48], Cavallini et al. [44], Friedel [6], and Kim and Mudawar [45] with MADs of 15.7%, 17.7%, 17.7%, and 19.7%. Actually, all these five correlations are separated flow models for two-phase FPD. The Friedel [6] correlation was proposed on the strength of 25,000 two-phase FPD data points by introducing the Froude number and Weber number to consider the gravity and surface tension functions. The Zhang and Webb [48] correlation was proposed by modifying the Friedel [6] correlation via introducing the reduced pressure (psat/pcrit) on the basis of adiabatic two-phase FPD data of R134a, R22, and R404A in tubes with Dh = 2.13–6.25 mm. The Cavallini et al. [44] correlation could also be treated as a modification of the Friedel [6] correlation for condensing flow of halogenated refrigerants. The Kim and Mudawar [45] correlation was generated on the strength of 7115 FPD data points of adiabatic and condensing mini/micro-channel flows of 17 fluids with Dh = 0.0695–6.22 mm by introducing the Suratman number. Among these five correlations, those of Zhang and Webb [48], Cavallini et al. [44], and Kim and Mudawar [45] were developed for mini/micro-channels, and shows satisfied predictions. Although those of Müller-Steinhagen and Heck [43] and Friedel [6] were developed for conventional channels, they also yield great performances. Their deviations indicate that taking the property variations and/or force interactions of fluid flowing in different scale channels into consideration is essential for yielding reasonable predictions. The PPN10 and PPN20 of the Müller-Steinhagen and Heck [43] correlation are 64.4% and 90.7%, and its error distribution is displayed in Figure 9.
Furthermore, the correlations of Cicchitti et al. [46] and Shannak [49] are the homogeneous models, and their MADs are 21.5% and 32.9%, which are larger than those of the top five separated flow models.
As illustrated in Figure 10, the comparisons between the experimental flow boiling FPDs and the calculated values by the top five correlations indicate that the Müller-Steinhagen and Heck [43] correlation can give the best tracking performance.

5. Conclusions

(1)
The R1234ze(E) flow boiling HTC and FPD inside a 1.88 mm horizontal circular minichannel was investigated experimentally. The saturation pressure, mass flux, and heat flux fell in the scopes of 0.6–0.7 MPa, 540–870 kg/m2 s, and 25–65 kW/m2, respectively.
(2)
The influences of various factors on flow boiling HTC and FPD are analyzed thoroughly. The nucleate boiling and convective boiling dominate the lower and higher vapor quality regions with a threshold vapor quality nearby 0.4. HTC mainly rises with heat flux for nucleate boiling, but increases with mass flux and vapor quality for convective boiling. HTC rises with saturation pressure, especially at lower vapor quality. Larger FPD is found for larger mass flux and vapor quality, but smaller saturation pressure. FPD is not sensitive to heat flux in most conditions.
(3)
Twelve existing correlations of two-phase HTC and ten ones of two-phase FPD are compared with the current experimental data, respectively. The correlations of Saitoh et al. [15] and Müller-Steinhagen and Heck [43] yield the best predictions and tracking performances on the flow boiling HTC and FPD with MADs of 5.4% and 10.9%, respectively. The reasonable prediction results indicate that the previous correlations suggested for R134a are mostly effective for R1234ze(E), as the thermophysical properties of R1234ze (E) are similar to those of R134a and their flow boiling characteristics are close.

Author Contributions

Conceptualization, Y.X.; methodology, Y.X. and Z.Y.; software, L.L.; validation, Y.X.; formal analysis, Z.Y. and L.L.; investigation, Y.X.; resources, Y.X.; data curation, Z.Y. and L.L.; writing—original draft preparation, Y.X. and Z.Y.; writing—review and editing, Y.X.; visualization, Z.Y.; supervision, Y.X.; project administration, Y.X.; funding acquisition, Y.X. All authors have read and agreed to the published version of the manuscript.

Funding

This research was funded by the National Natural Science Foundation of China (51806104); the Natural Science Foundation of Jiangsu Province of China (BK20180426); the Aeronautical Science Foundation of China (20182852024); the China Postdoctoral Science Foundation (2020M671487); and the Priority Academic Program Development of Jiangsu Higher Education Institutions.

Institutional Review Board Statement

Not applicable.

Informed Consent Statement

Not applicable.

Data Availability Statement

Not applicable.

Acknowledgments

We sincerely acknowledge the Key Laboratory of Aircraft Environment Control and Life Support of MIIT for providing laboratory space.

Conflicts of Interest

The authors declare no conflict of interest.

Nomenclature

ASectional area (m2)
AcCross sectional aera of fin (m)
CcContraction coefficient (–)
DiInternal diameter (m)
DhHydraulic diameter (m)
DoOuter diameter (m)
FrFroude number
GMass flux (kg/m2 s)
gGravitational acceleration (m/s2)
hEnthalpy (J/kg)
HFin length (m)
H′Modified fin length (m)
hlvLatent heat of vaporization (J/kg)
LTest section length (m)
LheatHeating length (m)
L′heatModified heating length (m)
mFin parameter (–)
nData point number
pPressure (Pa)
PCross-sectional perimeter of fin (m)
prReduced pressure (–)
qHeat flux (W/m2)
QdisHeat dissipation (W)
QeffEffective heating power (W)
rRadius (m)
ReReynolds number
tTemperature (°C)
twInner wall temperature (°C)
tw,oOuter wall temperature (°C)
VVolume flow rate (m3/s)
xVapor quality
ΔpPressure drop (Pa)
Greek Symbols
αHeat transfer coefficient (W/m2 K)
δFin thickness (m)
εVoid fraction (–)
ηfFin efficiency (–)
ρDensity (kg/m3)
λThermal conductivity (W/m K)
σcContraction area ratio (–)
σeExpansion area ratio (–)
Subscripts
expExperimental
inInlet
insInsulating layer
lLiquid
outOutlet
prePre-heater
predPredicted
satSaturation
tTotal
testTest section
vVapor

References

  1. Diani, A.; Mancin, S.; Rossetto, L. R1234ze(E) flow boiling inside a 3.4 mm ID microfin tube. Int. J. Refrig. 2014, 47, 105–119. [Google Scholar] [CrossRef]
  2. Longo, G.A.; Mancin, S.; Righetti, G.; Zilio, C. R1234yf and R1234ze(E) as environmentally friendly replacements of R134a: Assessing flow boiling on an experimental basis. Int. J. Refrig. 2019, 108, 336–346. [Google Scholar] [CrossRef]
  3. Longo, G.A.; Mancin, S.; Righetti, G.; Zilio, C. Saturated flow boiling of HFC134a and its low GWP substitute HFO1234ze(E) inside a 4 mm horizontal smooth tube. Int. J. Refrig. 2016, 64, 32–39. [Google Scholar] [CrossRef]
  4. Diani, A.; Mancin, S.; Cavallini, A.; Rossetto, L. Experimental investigation of R1234ze(E) flow boiling inside a 2.4 mm ID horizontal microfin tube. Int. J. Refrig. 2016, 69, 272–284. [Google Scholar] [CrossRef]
  5. Kim, S.-M.; Mudawar, I. Review of databases and predictive methods for heat transfer in condensing and boiling mini/micro-channel flows. Int. J. Heat Mass Transf. 2014, 77, 627–652. [Google Scholar] [CrossRef]
  6. Friedel, L. Improved friction pressure drop correlations for horizontal and vertical two phase pipe flow. In Proceedings of the European Two-Phase Flow Group Meeting, Ispra, Italy, 5–8 June 1979; pp. 485–491. [Google Scholar]
  7. Bortolin, S.; Bortolato, M.; Azzolin, M.; Del Col, D. Comparative experimental procedures for measuring the local heat transfer coefficient during flow boiling in a microchannel. Exp. Therm. Fluid Sci. 2018, 90, 231–245. [Google Scholar] [CrossRef]
  8. Sun, L.; Mishima, K. An evaluation of prediction methods for saturated flow boiling heat transfer in mini-channels. Int. J. Heat Mass Transf. 2009, 52, 5323–5329. [Google Scholar] [CrossRef]
  9. Bertsch, S.S.; Groll, E.A.; Garimella, S.V. A composite heat transfer correlation for saturated flow boiling in small channels. Int. J. Heat Mass Transf. 2009, 52, 2110–2118. [Google Scholar] [CrossRef] [Green Version]
  10. Sempértegui-Tapia, D.F.; Ribatski, G. Flow boiling heat transfer of R134a and low GWP refrigerants in a horizontal micro-scale channel. Int. J. Heat Mass Transf. 2017, 108, 2417–2432. [Google Scholar] [CrossRef]
  11. Kanizawa, F.T.; Tibiriçá, C.B.; Ribatski, G. Heat transfer during convective boiling inside microchannels. Int. J. Heat Mass Transf. 2016, 93, 566–583. [Google Scholar] [CrossRef]
  12. Kim, S.M.; Mudawar, I. Universal approach to predicting saturated flow boiling heat transfer in mini/micro-channels—Part II. Two-phase heat transfer coefficient. Int. J. Heat Mass Transf. 2013, 64, 1239–1256. [Google Scholar] [CrossRef]
  13. Jige, D.; Kikuchi, S.; Eda, H.; Inoue, N. Flow boiling in horizontal multiport tube: Development of new heat transfer model for rectangular minichannels. Int. J. Heat Mass Transf. 2019, 144, 118668. [Google Scholar] [CrossRef]
  14. Gungor, K.E.; Winterton, R.H.S. A general correlation for flow boiling in tubes and annuli. Int. J. Heat Mass Transf. 1986, 29, 351–358. [Google Scholar] [CrossRef]
  15. Saitoh, S.; Daiguji, H.; Hihara, E. Correlation for boiling heat transfer of R-134a in horizontal tubes including effect of tube diameter. Int. J. Heat Mass Transf. 2007, 50, 5215–5225. [Google Scholar] [CrossRef]
  16. Kim, S.-M.; Mudawar, I. Universal approach to predicting saturated flow boiling heat transfer in mini/micro-channels—Part I. Dryout incipience quality. Int. J. Heat Mass Transf. 2013, 64, 1226–1238. [Google Scholar] [CrossRef]
  17. Vakili-Farahani, F.; Agostini, B.; Thome, J.R. Experimental study on flow boiling heat transfer of multiport tubes with R245fa and R1234ze(E). Int. J. Refrig. 2013, 36, 335–352. [Google Scholar] [CrossRef]
  18. Thome, J.R.; Dupont, V.; Jacobi, A.M. Heat transfer model for evaporation in microchannels. Part I: Presentation of the model. Int. J. Heat Mass Transf. 2004, 47, 3375–3385. [Google Scholar] [CrossRef]
  19. Li, H.; Hrnjak, P. Heat transfer coefficient, pressure drop, and flow patterns of R1234ze(E) evaporating in microchannel tube. Int. J. Heat Mass Transf. 2019, 138, 1368–1386. [Google Scholar] [CrossRef]
  20. Mancin, S.; Diani, A.; Doretti, L.; Rossetto, L. R134a and R1234ze(E) liquid and flow boiling heat transfer in a high porosity copper foam. Int. J. Heat Mass Transf. 2014, 74, 77–87. [Google Scholar] [CrossRef]
  21. Diani, A.; Mancin, S.; Doretti, L.; Rossetto, L. Low-GWP refrigerants flow boiling heat transfer in a 5 PPI copper foam. Int. J. Multiph. Flow 2015, 76, 111–121. [Google Scholar] [CrossRef]
  22. Xu, Y.; Fang, X. Correlations of void fraction for two-phase refrigerant flow in pipes. Appl. Therm. Eng. 2014, 64, 242–251. [Google Scholar] [CrossRef]
  23. Collier, J.G.; Thome, J.R. Convective Boiling and Condensation; Oxford University Press: New York, NY, USA, 1994. [Google Scholar]
  24. Fu, B.-R.; Tsou, M.-S.; Pan, C. Flow-pattern-based correlations for pressure drop during flow boiling of ethanol-water mixtures in a microchannel. Int. J. Heat Mass Transf. 2013, 61, 332–339. [Google Scholar] [CrossRef]
  25. Kim, S.-M.; Mudawar, I. Consolidated method to predicting pressure drop and heat transfer coefficient for both subcooled and saturated flow boiling in micro-channel heat sinks. Int. J. Heat Mass Transf. 2012, 55, 3720–3731. [Google Scholar] [CrossRef]
  26. Schmidt, J.; Friedel, L. Two-phase pressure drop across sudden contractions in duct areas. Int. J. Multiph. Flow 1997, 23, 283–299. [Google Scholar] [CrossRef]
  27. Abdelall, F.F.; Hahn, G.; Ghiaasiaan, S.M.; Abdel-Khalik, S.I.; Jeter, S.S.; Yoda, M.; Sadowski, D.L. Pressure drop caused by abrupt flow area changes in small channels. Exp. Therm. Fluid Sci. 2005, 29, 425–434. [Google Scholar] [CrossRef]
  28. Kawahara, A.; Chung, P.M.Y.; Kawaji, M. Investigation of two-phase flow pattern, void fraction and pressure drop in a microchannel. Int. J. Multiph. Flow 2002, 28, 1411–1435. [Google Scholar] [CrossRef]
  29. Kline, S.J.; McClintock, F.A. Describing Uncertainties in Single-Sample Experiments. Mech. Eng. 1953, 75, 3–8. [Google Scholar]
  30. Belyaev, A.V.; Varava, A.N.; Dedov, A.V.; Komov, A.T. An experimental study of flow boiling in minichannels at high reduced pressure. Int. J. Heat Mass Transf. 2017, 110, 360–373. [Google Scholar] [CrossRef]
  31. Xu, Y.; Fang, X.; Li, G.; Li, D.; Yuan, Y. An experimental study of flow boiling heat transfer of R134a and evaluation of existing correlations. Int. J. Heat Mass Transf. 2016, 92, 1143–1157. [Google Scholar] [CrossRef]
  32. Fang, X. A new correlation of flow boiling heat transfer coefficients based on R134a data. Int. J. Heat Mass Transf. 2013, 66, 279–283. [Google Scholar] [CrossRef]
  33. Wattelet, J.P.; Chato, J.C.; Souza, A.L.; Christoffersen, B.R. Evaporative characteristics of R-12, R-134a, and a mixture at low mass fluxes. ASHRAE Trans. 1994, 100, 603–615. [Google Scholar]
  34. Gungor, K.E.; Winterton, R.H.S. Simplified general correlation for saturated flow boiling and comparisons of correlations with data. Chem. Eng. Res. Des. 1987, 65, 148–156. [Google Scholar]
  35. Shah, M.M. Chart correlation for saturated boiling heat transfer: Equations and further study. ASHRAE Trans. 1982, 88, 185–196. [Google Scholar]
  36. Liu, Z.; Winterton, R.H.S. A general correlation for saturated and subcooled flow boiling in tubes and annuli, based on a nucleate pool boiling equation. Int. J. Heat Mass Transf. 1991, 34, 2759–2766. [Google Scholar] [CrossRef]
  37. Jung, D.S.; McLinden, M.; Radermacher, R.; Didion, D. A study of flow boiling heat transfer with refrigerant mixtures. Int. J. Heat Mass Transf. 1989, 32, 1751–1764. [Google Scholar] [CrossRef]
  38. Li, W.; Wu, Z. A general criterion for evaporative heat transfer in micro/mini-channels. Int. J. Heat Mass Transf. 2010, 53, 1967–1976. [Google Scholar] [CrossRef]
  39. Tran, T.N.; Wambsganss, M.W.; France, D.M. Small circular- and rectangular-channel boiling with two refrigerants. Int. J. Multiph. Flow 1996, 22, 485–498. [Google Scholar] [CrossRef]
  40. Cooper, M.G. Heat Flow Rates in Saturated Nucleate Pool Boiling—A Wide-Ranging Examination Using Reduced Properties. Adv. Heat Transf. 1984, 16, 157–239. [Google Scholar]
  41. Xu, Y.; Fang, X.; Li, D.; Li, G.; Yuan, Y.; Xu, A. An experimental study of flow boiling frictional pressure drop of R134a and evaluation of existing correlations. Int. J. Heat Mass Transf. 2016, 98, 150–163. [Google Scholar] [CrossRef]
  42. Xu, Y.; Fang, X. A new correlation of two-phase frictional pressure drop for evaporating flow in pipes. Int. J. Refrig. 2012, 35, 2039–2050. [Google Scholar] [CrossRef]
  43. Müller-Steinhagen, H.; Heck, K. A simple friction pressure drop correlation for two-phase flow in pipes. Chem. Eng. Process. 1986, 20, 297–308. [Google Scholar] [CrossRef]
  44. Cavallini, A.; Censi, G.; Del Col, D.; Doretti, L.; Longo, G.A.; Rossetto, L. Condensation of halogenated refrigerants inside smooth tubes. HVAC R Res. 2002, 8, 429–451. [Google Scholar] [CrossRef]
  45. Kim, S.M.; Mudawar, I. Universal approach to predicting two-phase frictional pressure drop for adiabatic and condensing mini/micro-channel flows. Int. J. Heat Mass Transf. 2012, 55, 3246–3261. [Google Scholar] [CrossRef]
  46. Cicchitti, A.; Lombardi, C.; Silvestri, M.; Soldaini, G.; Zavattarelli, R. Two-phase cooling experiments-pressure drop, heat transfer, and burnout measurements. Energ. Nucl. 1960, 7, 407–425. [Google Scholar]
  47. Grönnerud, R. Investigation of liquid hold-up, flow-resistance and heat transfer in circulation type evaporators, part IV: Two-phase flow resistance in boiling refrigerants. Bull. I’Inst. Du Froid 1979, 16, 1972–1981. [Google Scholar]
  48. Zhang, M.; Webb, R.L. Correlation of two-phase friction for refrigerants in small-diameter tubes. Exp. Therm. Fluid Sci. 2001, 25, 131–139. [Google Scholar] [CrossRef]
  49. Shannak, B.A. Frictional pressure drop of gas liquid two-phase flow in pipes. Nucl. Eng. Des. 2008, 238, 3277–3284. [Google Scholar] [CrossRef]
  50. Li, W.; Wu, Z. A general correlation for adiabatic two-phase pressure drop in micro/mini-channels. Int. J. Heat Mass Transf. 2010, 53, 2732–2739. [Google Scholar] [CrossRef]
Figure 1. Experimental system: schematic diagram.
Energies 14 05972 g001
Figure 2. Experimental system: 3D model.
Energies 14 05972 g002
Figure 3. Experimental system: photograph.
Energies 14 05972 g003
Figure 4. Test section: (a) photograph; (b) cross profile.
Energies 14 05972 g004
Figure 5. Flow boiling HTC of R1234ze(E) versus vapor quality: (a) effect of mass flux on HTC at p = 0.6 MPa and q = 65 kW/m2; (b) effect of mass flux on HTC at p = 0.7 MPa and q = 55 kW/m2; (c) effect of saturation pressure on HTC at G = 705 kg/m2 s and q = 55 kW/m2; (d) effect of saturation pressure on HTC at G = 870 kg/m2 s and q = 65 kW/m2; (e) effect of heat flux on HTC at p = 0.6 MPa and G = 705 kg/m2 s; (f) effect of mass flux on HTC at p = 0.7 MPa and G = 870 kg/m2 s.
Energies 14 05972 g005aEnergies 14 05972 g005b
Figure 6. Error distributions of the heat transfer correlations: (a) Saitoh et al. [15]; (b) Tran et al. [39].
Energies 14 05972 g006
Figure 7. Comparison of HTC trends based on predictive correlations and measured data: (a) p = 0.6 MPa, G = 850 kg/m2 s and q = 55 kW/m2; (b) p = 0.7 MPa, G = 705 kg/m2 s and q = 65 kW/m2.
Energies 14 05972 g007
Figure 8. Flow boiling FPD of R1234ze(E) versus vapor quality: (a) effect of mass flux on FPD at p = 0.6 MPa and q = 25 kW/m2; (b) effect of mass flux on FPD at p = 0.7 MPa and q = 55 kW/m2; (c) effect of saturation pressure on FPD at G = 705 kg/m2 s and q = 40 kW/m2; (d) effect of saturation pressure on FPD at G = 870 kg/m2 s and q = 65 kW/m2; (e) effect of heat flux on FPD at p = 0.6 MPa and G = 540 kg/m2 s; (f) effect of mass flux on FPD at p = 0.7 MPa and G = 705 kg/m2 s.
Energies 14 05972 g008aEnergies 14 05972 g008b
Figure 9. Error distribution of the best FPD correlation.
Energies 14 05972 g009
Figure 10. Comparison of FPD trends based on predictive correlations and measured data: (a) p = 0.6 MPa, G = 850 kg/m2 s and q = 55 kW/m2; (b) p = 0.7 MPa, G = 705 kg/m2 s and q = 65 kW/m2.
Energies 14 05972 g010
Table 1. Thermophysical properties of R1234ze(E).
Propertiesp = 0.6 MPap = 0.7 MPa
Saturation temperature (°C)31.336.7
Liquid density (kg/m3)1142.21123.3
Vapor density (kg/m3)31.67337.027
Liquid viscosity (Pa s)1.8519 × 10−41.7367 × 10−4
Vapor viscosity (Pa s)1.2516 × 10−51.2770 × 10−5
Liquid conductivity (W/m K)0.07210.0703
Vapor conductivity (W/m K)0.01410.0146
Surface tension (N/m)8.0483 × 10−37.3648 × 10−3
Latent enthalpy (kJ/kg)162.05157.61
Table 2. Experimental uncertainties.
ParameterUncertainty
Diameter±1 μm
Length±1 mm
Temperature±0.1 °C
Flow rate±0.5%
Relative pressure±0.3%FS (0–1.6 MPa)
Differential pressure±0.075%FS (0–100 kPa)
Heat flux±1.44%
Vapor quality±1.66%
HTC±4.01%
Table 3. Prediction deviations of the existing HTC correlations (%).
CorrelationMADMRDPPN10PPN20
Saitoh et al. [15]5.4−0.785.099.2
Tran et al. [39]8.6−4.066.488.9
Wattelet et al. [33]12.7−6.947.879.1
Fang [32]13.3−10.149.074.3
Shah [35]13.6−1.236.876.3
Gungor and Winterton [34]17.68.529.660.5
Cooper [40]18.1−18.019.064.4
Li and Wu [38]18.1−15.135.659.3
Sun and Mishima [8]18.317.024.160.1
Jung et al. [37]18.718.323.761.7
Liu and Winterton [36]21.4−21.417.047.0
Bertsch et al. [9]27.1−27.09.148.6
Table 4. Prediction deviations of the existing FPD correlations (%).
CorrelationMADMRDPPN10PPN20
Müller–Steinhagen and Heck [43]10.9−0.364.490.7
Zhang and Webb [48]15.712.967.475.2
Cavallini et al. [44]17.716.346.372.2
Friedel [6]17.75.643.480.0
Kim and Mudawar [45]19.7−0.733.962.5
Cicchitti et al. [46]21.5–12.818.742.5
Xu and Fang [42]32.332.38.449.3
Shannak [49]32.9−25.411.421.1
Li and Wu [50]33.1−32.24.811.2
Grönnerud [47]54.554.23.28.6
Publisher’s Note: MDPI stays neutral with regard to jurisdictional claims in published maps and institutional affiliations.

