
On the Road to a Green Economy: How Do European Union Countries ‘Do Their Homework’?


Abstract
:1. Introduction
2. Literature Review
3. Materials and Methods
- The selection of the partial indicators describing the green economy;
- The standardisation of the indicators according to their impact (stimulants/destimulants) on the phenomenon studied (‘green’ transformation of the EU countries);
- The construction of the synthetic measure and the GEI indexes for respective countries;
- The linear hierarchisation of the EU countries in 2010 and 2018, based on the GEI.
3.1. Selecting a Set of Indicators
3.2. Standardisation of the Indicators
3.3. GEI Index Construction
4. Results and Discussion
- Energy productivity: 0.4127 in 2010 vs. 0.3079 in 2018 (−25%);
- People at risk of poverty or social exclusion: 0.7054 vs. 0.5338 (−24%);
- Production-based and demand-based CO2 productivity: 0.4275 vs. 0.3507 (−18%);
- The development of environment-related technologies: 0.4590 vs. 0.4057 (−12%);
- Resource productivity: 0.4107 vs. 0.3658 (−11%);
- Renewable energy supply: 0.3746 vs. 0.3338 (−11%);
- The share of renewable energy in gross final energy consumption: 0.3279 vs. 0.2910 (−11%).
- the low emissions of SO2—0.9184;
- the still low water exploitation index—0.8692, although it should be underlined that, in comparison to 2010, a deterioration by more than 4% of the value of this index was noted;
- a decrease in final energy consumption—0.7962;
- a decrease in the amount of waste produced per capita—0.7513;
- a large decrease in unemployment—0.7482, which was associated with EU countries gradually recovering from the financial and economic crisis (2008).
- waste recycling level—0.1866;
- GDP per capita—0.2431;
- the utilisation of circular materials—0.2789;
- the share of renewable energy in gross final energy consumption—0.2910;
- energy productivity—0.3079.
5. Conclusions
Funding
Institutional Review Board Statement
Informed Consent Statement
Data Availability Statement
Conflicts of Interest
References
- Pearce, D.; Markandya, A.; Barbier, E. Blueprint for Green Economy; Routledge: London, UK, 1989. [Google Scholar]
- UNEP. Towards a Green Economy: Pathways to Sustainable Development and Poverty Eradication. 2011. Available online: https://sustainabledevelopment.un.org/content/documents/126GER_synthesis_en.pdf (accessed on 15 July 2021).
- Ryszawska, B. Zielona Gospodarka—Teoretyczne Podstawy Koncepcji i Pomiar jej Wdrażania w Unii Europejskiej (Green Economy–Theoretical Foundations of the Concept and Measurement of Its Implementation in the European Union); Wydawnictwo Uniwersytetu Ekonomicznego we Wrocławiu: Wrocław, Poland, 2013; pp. 48–60. (In Polish) [Google Scholar]
- Ryszawska, B. Zielona Gospodarka w Dokumentach Strategicznych Unii Europejskiej (The Transition towards the Green Economy in European Union‘s Strategic Documents). Ekon. Śr. 2013, 3, 26–37. (In Polish) [Google Scholar]
- Allen, C.; Clouth, S. A Guidebook to the Green Economy. Issue 1: Green Economy, Green Growth, and Low-Carbon Development–History, Definitions and a Guide to Recent Publications; UN Division for Sustainable Development: New York, NY, USA, 2012; Available online: https://sustainabledevelopment.un.org/content/documents/GE%20Guidebook.pdf (accessed on 18 July 2021).
- Bina, O. The Green Economy and Sustainable Development: An Uneasy Balance? Environ. Plan. C Gov. Policy 2013, 31, 1023–1047. [Google Scholar] [CrossRef] [Green Version]
- Georgeson, L.; Maslin, M.; Poessinouw, M. The Global Green Economy: A Review of Concepts, Definitions, Measurement Methodologies and their Interactions. Geogr. Environ. 2017, 4, e00036. [Google Scholar] [CrossRef]
- Mealy, P.; Teytelboym, A. Economic Complexity and the Green Economy. Res. Policy 2020, 103948. [Google Scholar] [CrossRef]
- Michalak, D.; Rosiek, K.; Szyja, P. Gospodarka Niskoemisyjna, Gospodarka Cyrkularna, Zielona Gospodarka. Uwarunkowania i Wzajemne Powiązania (Low-Carbon Economy, Circular Economy, Green Economy. Determinants and Interconnections); Wydawnictwo Uniwersytetu Łódzkiego: Łódź, Poland, 2020; ISBN 978-83-8220-032-4. (In Polish) [Google Scholar] [CrossRef]
- Shafter, K. Challenges of the Green Economy: Review of Concepts and Definitions. Eur. J. Manag. Soc. Sci. 2020, 2, 95–100. [Google Scholar] [CrossRef]
- Anser, M.K.; Usman, M.; Godil, D.I.; Shabbir, M.S.; Sharif, A.; Tabash, M.I.; Lopez, L.B. Does Globalization Affect the Green Economy and Environment? The Relationship between Energy Consumption, Carbon Dioxide Emissions, and Economic Growth. Environ. Sci. Pollut. Res. 2021. [Google Scholar] [CrossRef]
- Limsuwan, K.; Thiengkamol, N.; Thiengkamol, C. Major Factors Affecting Green Economy Model. Ann. RSCB 2021, 25, 1074–1088. [Google Scholar]
- Odugbesan, J.A.; Rjoub, H.; Ifediora, C.U.; Iloka, C.B. Do Financial Regulations Matters for Sustainable Green Economy: Evidence from Turkey. Environ. Sci. Pollut. Res. 2021. [Google Scholar] [CrossRef]
- Licastro, A.; Sergi, B.S. Drivers and Barriers to a Green Economy. A Review of Selected Balkan Countries. Clean. Eng. Technol. 2021, 4, 100228. [Google Scholar] [CrossRef]
- Wu, M.; Wu, J.; Zang, C. A Comprehensive Evaluation of the Eco-carrying Capacity and Green Economy in the Guangdong-Hong Kong-Macao Greater Bay Area, China. J. Clean. Prod. 2021, 281, 124945. [Google Scholar] [CrossRef]
- UNDESA. A Guidebook to the Green Economy. Issue 3: Exploring Green Economy Policies and International Experience with National Strategies; UN Division for Sustainable Development: New York, NY, USA, 2012; Available online: http://sustainabledevelopment.un.org/content/documents/738GE%20Publication.pdf (accessed on 18 July 2021).
- Eaton, D.; Sheng, F. (Eds.) Inclusive Green Economy: Policies and Practice; Zayed International Foundation for the Environment & Tongji University: Shanghai, China, 2019. [Google Scholar]
- Khoshnava, S.M.; Rostami, R.; Zin, R.M.; Štreimikienė, D.; Yousefpour, A.; Strielkowski, W.; Mardani, A. Aligning the Criteria of Green Economy (GE) and Sustainable Development Goals (SDGs) to Implement Sustainable Development. Sustainability 2019, 11, 4615. [Google Scholar] [CrossRef] [Green Version]
- Dogaru, L. Green Economy and Green Growth—Opportunities for Sustainable Development. Proceedings 2020, 63, 3070. [Google Scholar] [CrossRef]
- Mikhno, I.; Koval, V.; Shvets, G.; Garmatiuk, O.; Tamošiūnienė, R. Green Economy in Sustainable Development and Improvement of Resource Efficiency. Cent. Eur. Bus. Rev. 2021, 10, 99–113. [Google Scholar] [CrossRef]
- Green Growth, Green Profit: How Green Transformation Boosts Business; Roland Berger Strategy Consultants GmbH: Palgrave Macmillan, UK, 2011; Available online: https://www.palgrave.com/gp/book/9780230285439 (accessed on 24 July 2021)ISBN 978-1349330560. [CrossRef]
- UNDP. Green Economy in Action: Articles and Excerpts that Illustrate Green Economy and Sustainable Development Efforts; 38; United Nations Development Programme. 2012. Available online: https://www.un.org/waterforlifedecade/pdf/green_economy_in_action_eng.pdf (accessed on 18 July 2021).
- UNDESA. A Guidebook to the Green Economy. Issue 4: A Guide to International Green Economy Initiatives, Division for Sustainable Development; UN Division for Sustainable Development. 2013. Available online: http://sustainabledevelopment.un.org/ (accessed on 18 July 2021).
- Bhuju, D.R.; Thapa-Parajuli, R.B.; Sharma, P.; Aryal, P. Nepal’s Green Economy Initiative and Framework Proposed. Nep J. Environ. Sci. 2014, 2, 15–25. [Google Scholar] [CrossRef]
- Denona Bogovic, N.; Grdic, Z.S. Transitioning to a Green Economy—Possible Effects on the Croatian Economy. Sustainability 2020, 12, 9342. [Google Scholar] [CrossRef]
- Vuola, M.; Korkeakoski, M.; Vähäkari, N.; Dwyer, M.B.; Hogarth, N.J.; Kaivo-oja, J.; Luukkanen, J.; Chea, E.; Thuon, T.; Phonhalath, K. What is a Green Economy? Review of National-Level Green Economy Policies in Cambodia and Lao PDR. Sustainability 2020, 12, 6664. [Google Scholar] [CrossRef]
- Ali, E.B.; Pavlovich Anufriev, V.; Amfo, B. Green Economy Implementation in Ghana as a Road Map for a Sustainable Development Drive: A Review. Sci. Afr. 2021, 12, e00756. [Google Scholar] [CrossRef]
- Steblyanskaya, A.; Ye, A.M.; Bocharnikov, V.; Denisov, A. Strategies for Green Economy in China. Foresight STI Gov. 2021, 15, 74–85. [Google Scholar] [CrossRef]
- Górka, K.; Łuszczyk, M. Zielona Gospodarka i Gospodarka Oparta na Wiedzy a Rozwój Trwały. Optimum Studia Ekonomiczne 2014, 3, 22–31. [Google Scholar] [CrossRef]
- Ferreira Gregorio, V.; Pié, L.; Terceño, A. A Systematic Literature Review of Bio, Green and Circular Economy Trends in Publications in the Field of Economics and Business Management. Sustainability 2018, 10, 4232. [Google Scholar] [CrossRef] [Green Version]
- D’Amato, D.; JKorhonen, J. Integrating the Green Economy, Circular Economy and Bioeconomy in a Strategic Sustainability Framework. Ecol. Econ. 2021, 188, 107143. [Google Scholar] [CrossRef]
- Chen, Y.; Chen, C.-Y.; Hsieh, T. Exploration of Sustainable Development by Applying Green Economy Indicators. Environ. Monit Assess 2011, 182, 279–289. [Google Scholar] [CrossRef] [PubMed]
- EEA. Environmental Indicator Report 2012. Ecosystem Resilience and Resource Efficiency in a Green Economy in Europe; European Environment Agency: Copenhagen, Denmark, 2012. [Google Scholar]
- EEA. Towards a Green Economy in Europe; European Environmental Agency: Copenhagen, Denmark, 2013. [Google Scholar]
- UNEP. Measuring Progress Towards an Inclusive Green Economy; United Nations Environment Programme: Nairobi, Kenya, 2012; Available online: https://www.gwp.org/globalassets/global/toolbox/references/measuring-progress-towards-an-inclusive-green-economy-unep-2012.pdf (accessed on 15 July 2021).
- UNEP. Green Economy. A Guidence Manual for Green Economy Indicators; United Nations Environment Programme: Nairobi, Kenya, 2014; Available online: https://www.un-page.org/files/public/content-page/unep_indicators_ge_for_web.pdf (accessed on 19 July 2021).
- Ryszawska, B. Green economy indicators. In Towards a Green Economy; Burchard-Dziubińska, M., Ed.; Wydawnictwo Uniwersytetu Łódzkiego: Łódź, Poland, 2015; Volume 2, pp. 31–52. [Google Scholar]
- Green Economy: Indicators for Progress Measurement; Executive summary; Federal Department of the Environment; Federal Office for the Environment FOEN: Bern, Switzerland, 2016; Available online: https://www.bafu.admin.ch/dam/bafu/en/dokumente/wirtschaft-konsum/fachinfo-daten/kurzfassung_gruenewirtschaftindikatorenzurmessungderforschritte.pdf.download.pdf/executive_summarygreeneconomyindicatorsforprogressmeasurement.pdf (accessed on 19 July 2021).
- PAGE. The Green Economy Progress Measurement Framework. Methodology; PAGE (United Nations): Chatelaine-Geneva, Switzerland, 2017; Available online: https://www.un-page.org/files/public/gep_methodology.pdf (accessed on 19 July 2021).
- PAGE. The Green Economy Progress Measurement Framework. Application; PAGE (United Nations): Chatelaine-Geneva, Switzerland, 2017; Available online: https://www.un-page.org/files/public/green_economy_progress_measurement_framework_application.pdf (accessed on 19 July 2021).
- Dual Citizen LLC. Performance Index 2018. Available online: https://dualcitizeninc.com/global-green-economy-index/economic-environmental-indicators.php?id=3 (accessed on 19 July 2021).
- Merino-Saum, A.; Baldi, M.G.; Gunderson, I.; Oberle, B. Articulating Natural Resources and Sustainable Development Goals through Green Economy Indicators: A Systematic Analysis. Resour. Conserv. Recycl. 2018, 139, 90–103. [Google Scholar] [CrossRef]
- Vukovic, N.; Pobedinsky, V.; Mityagin, S.; Drozhzhin, A.; Mingaleva, Z. A Study on Green Economy Indicators and Modeling: Russian Context. Sustainability 2019, 11, 4629. [Google Scholar] [CrossRef] [Green Version]
- Alekna, R.; Kazlauskiene, E. Evaluation Indicators of Green Economic Development: The Case of the Baltic Countries. Econ. Cult. 2020, 17, 150–163. [Google Scholar] [CrossRef]
- Ul Mustafa, A.; Afzal, H.; Zahoor, Z. Green Economy and its Future. J. Sustain. Tour. Entrep. 2020, 2, 119–131. [Google Scholar] [CrossRef]
- Cabernard, L.; Pfister, S. A Highly Resolved MRIO Database for Analyzing Environmental Footprints and Green Economy Progress. Sci. Total Environ. 2021, 755, 142587. [Google Scholar] [CrossRef]
- Daniek, K. Green Economy Indicators as a Method of Monitoring Development in the Economic, Social and Environmental Dimensions. Soc. Inequal. Econ. Growth 2020, 2, 150–173. [Google Scholar] [CrossRef]
- Balmford, A.; Bennun, L.; Ten Brink, B.; Cooper, D.; Côté, M.I.; Crane, P.; Dobson, A.; Dudley, N.; Dutton, I.; Green, R.E.; et al. The Convention on Biological Diversity’s 2010 Target. Science 2005, 307, 212–213. [Google Scholar] [CrossRef]
- Cornescu, V.; Adam, R. Considerations Regarding the Role of Indicators used in the Analysis and Assessment of Sustainable Development in the EU. Procedia Econ. Financ. 2014, 8, 10–16. [Google Scholar] [CrossRef] [Green Version]
- Handbook on Constructing Composite Indicators. Methodology and User Guide; OECD Publishing: Paris, France, 2008; Available online: https://www.oecd.org/sdd/42495745.pdf (accessed on 24 July 2021).
- Dziechciarz, J. Ekonometria. Metody, Przykłady, Zadania. (Econometrics. Methods, Examples, Tasks); Wydawnictwo Uniwersytetu Ekonomicznego: Wrocław, Poland, 2012; ISBN 978-83-7695-147-8. (In Polish) [Google Scholar]
- Hellwig, Z. Zastosowanie metody taksonomicznej do typologicznego podziału krajów ze względu na poziom ich rozwoju oraz zasoby i strukturę wykwalifikowanych kadr (The Application of the Taxonomic Method to the Typological Division of Countries by Level of their Development as Well as Resources and Structure of Qualified Staff). Prz. Stat. 1968, 4, 307–326. (In Polish) [Google Scholar]
- Hellwig, Z.S. Taksonometryczne Modele Zmian Struktury (Taxonomic Models of Structure Change); Instytut Rozwoju i Studiów Strategicznych: Warszawa, Poland, 1995. (In Polish) [Google Scholar]
- Pluta, W. Wielowymiarowa Analiza Porównawcza w Badaniach Ekonomicznych. Metody Taksonomiczne i Analizy Czynnikowe (Multivariate Comparative Analysis in Economic Research. Taxonomic Methods and Factor Analysis); PWE: Warszawa, Poland, 1977. [Google Scholar]
- Strahl, D. (Ed.) Metody Oceny Rozwoju Regionalnego (Methods for Evaluation of Regional Development); AE Publishing House: Wrocław, Poland, 2006. (In Polish) [Google Scholar]
- Grzebyk, M.; Stec, M. Sustainable Development in EU Countries: Concept and Rating of Levels of Development. Sustain. Dev. 2015, 23, 110–123. [Google Scholar] [CrossRef]
- Sulich, A.; Sołoducho-Pelc, L. Renewable Energy Producers’ Strategies in the Visegrád Group Countries. Energies 2021, 14, 3048. [Google Scholar] [CrossRef]
- Walesiak, M. Uogólniona Miara Odległości GDM w Statystycznej Analizie Wielowymiarowej w Wykorzystaniem Programu R (Generalized GDM Distance Measure in Statistical Multivariate Analysis Using R Software); Wydawnictwo Uniwersytetu Ekonomicznego: Wrocław, Poland, 2011. (In Polish) [Google Scholar]
- Kasztelan, A. How Circular Are the European Economies? A Taxonomic Analysis Based on the INEC (Index of National Economies’ Circularity). Sustainability 2020, 12, 7613. [Google Scholar] [CrossRef]
- Kukuła, K. Metoda Unitaryzacji Zerowanej (The Zero Unitarization Method); Wydawnictwo Naukowe PWN: Warszawa, Poland, 2000. (In Polish) [Google Scholar]
- Kijek, A. Sector Risk of the Processing Industry. In Modeling and Assessment (Ryzyko Sektorowe Przemysłu Przetwórczego: Modelowanie i Ocena); UMCS Publishing House: Lublin, Poland, 2013. [Google Scholar]
- Fura, B.; Stec, M.; Miś, T. Statistical Evaluation of the Level of Development of Circular Economy in European Union Member Countries. Energies 2020, 13, 6401. [Google Scholar] [CrossRef]
- Jarocka, M. Wybór Formuły Normalizacyjnej w Analizie Porównawczej Obiektów Wielocechowych (The Choice of a Formula of the Data Normalization in the Comparative Analysis of Multivariate Objects). Econ. Manag. 2015, 1, 113–126. (In Polish) [Google Scholar]
- Kasztelan, A.; Nowak, A. Construction and Empirical Verification of the Agri-Environmental Index (AEI) as a Tool for Assessing the Green Performance of Agriculture. Energies 2021, 14, 45. [Google Scholar] [CrossRef]
- Dual Citizen, L.L.C. 2018 Global Green Economy Index (GGEI); Dual Citizen L.L.C: New York, NY, USA, 2018; Available online: https://dualcitizeninc.com/global-green-economy-index/ (accessed on 24 July 2021).


| Indicator Symbol | Indicator Name (Unit of Measure) | Source | Stimulant/ Destimulant |
|---|---|---|---|
| x1 | Greenhouse gas emissions (tonnes per capita) | UNEP; Ryszawska; Dual Citizen LLC; Eurostat | D |
| x2 | Sulphur oxides (SO2) emissions (kg per capita) | Ryszawska; Dual Citizen LLC; Eurostat | D |
| x3 | Mean population exposure to PM2.5 (micrograms/m3) | PAGE; OECD | D |
| x4 | Primary energy consumption (TOE 1 per capita) | UNEP; Ryszawska; PAGE; Eurostat | D |
| x5 | Final energy consumption (TOE per capita) | PAGE; Eurostat | D |
| x6 | Renewable energy supply (% total energy supply) | UNEP; Dual Citizen LLC; PAGE; Ryszawska; OECD | S |
| x7 | Share of renewable energy in gross final energy consumption (%) | Eurostat | S |
| x8 | Renewable electricity (% total electricity generation) | Dual Citizen LLC; OECD | S |
| x9 | Production-based and demand-based CO2 productivity (US dollars per kilogram CO2, 2015) | UNEP; OECD | S |
| x10 | Resource productivity (purchasing power standard per kilogram) | UNEP; Ryszawska; Dual Citizen LLC; Eurostat | S |
| x11 | Energy productivity (euro per kilogram of oil equivalent) | UNEP; Eurostat | S |
| x12 | Environmental tax revenues (% GDP 2) | UNEP; Ryszawska; Eurostat | S |
| x13 | Development of environment-related technologies (% all technologies) | UNEP; Ryszawska; Dual Citizen LLC; OECD | S |
| x14 | Eco-innovation index (score) | Eurostat | S |
| x15 | Generation of waste (kg per capita) | UNEP; Ryszawska; Eurostat | D |
| x16 | Recycling waste (tonnes per capita) | UNEP; Ryszawska; Eurostat | S |
| x17 | Circular material use rate (%) | Eurostat | S |
| x18 | Terrestrial protected area (% of total area) | UNEP; PAGE; OECD | S |
| x19 | Area under organic farming (% of utilised agricultural area) | Ryszawska; Eurostat | S |
| x20 | Water exploitation index (%) | UNEP; Dual Citizen LLC; Eurostat | D |
| x21 | Real GDP per capita (US Dollar, 2015) | Ryszawska; OECD | S |
| x22 | The Global Competitiveness Index (0–100) | Ryszawska; OECD | S |
| x23 | Life expectancy at birth (number of years) | PAGE; OECD | S |
| x24 | Population, ages 15–64 (% total) | OECD | S |
| x25 | Unemployment rate (%) | Ryszawska; OECD | D |
| x26 | People at risk of poverty or social exclusion (%) | Ryszawska; Eurostat | D |
| x27 | Gini coefficient of equivalised disposable income (0–100) | UNEP; Ryszawska; Eurostat | D |
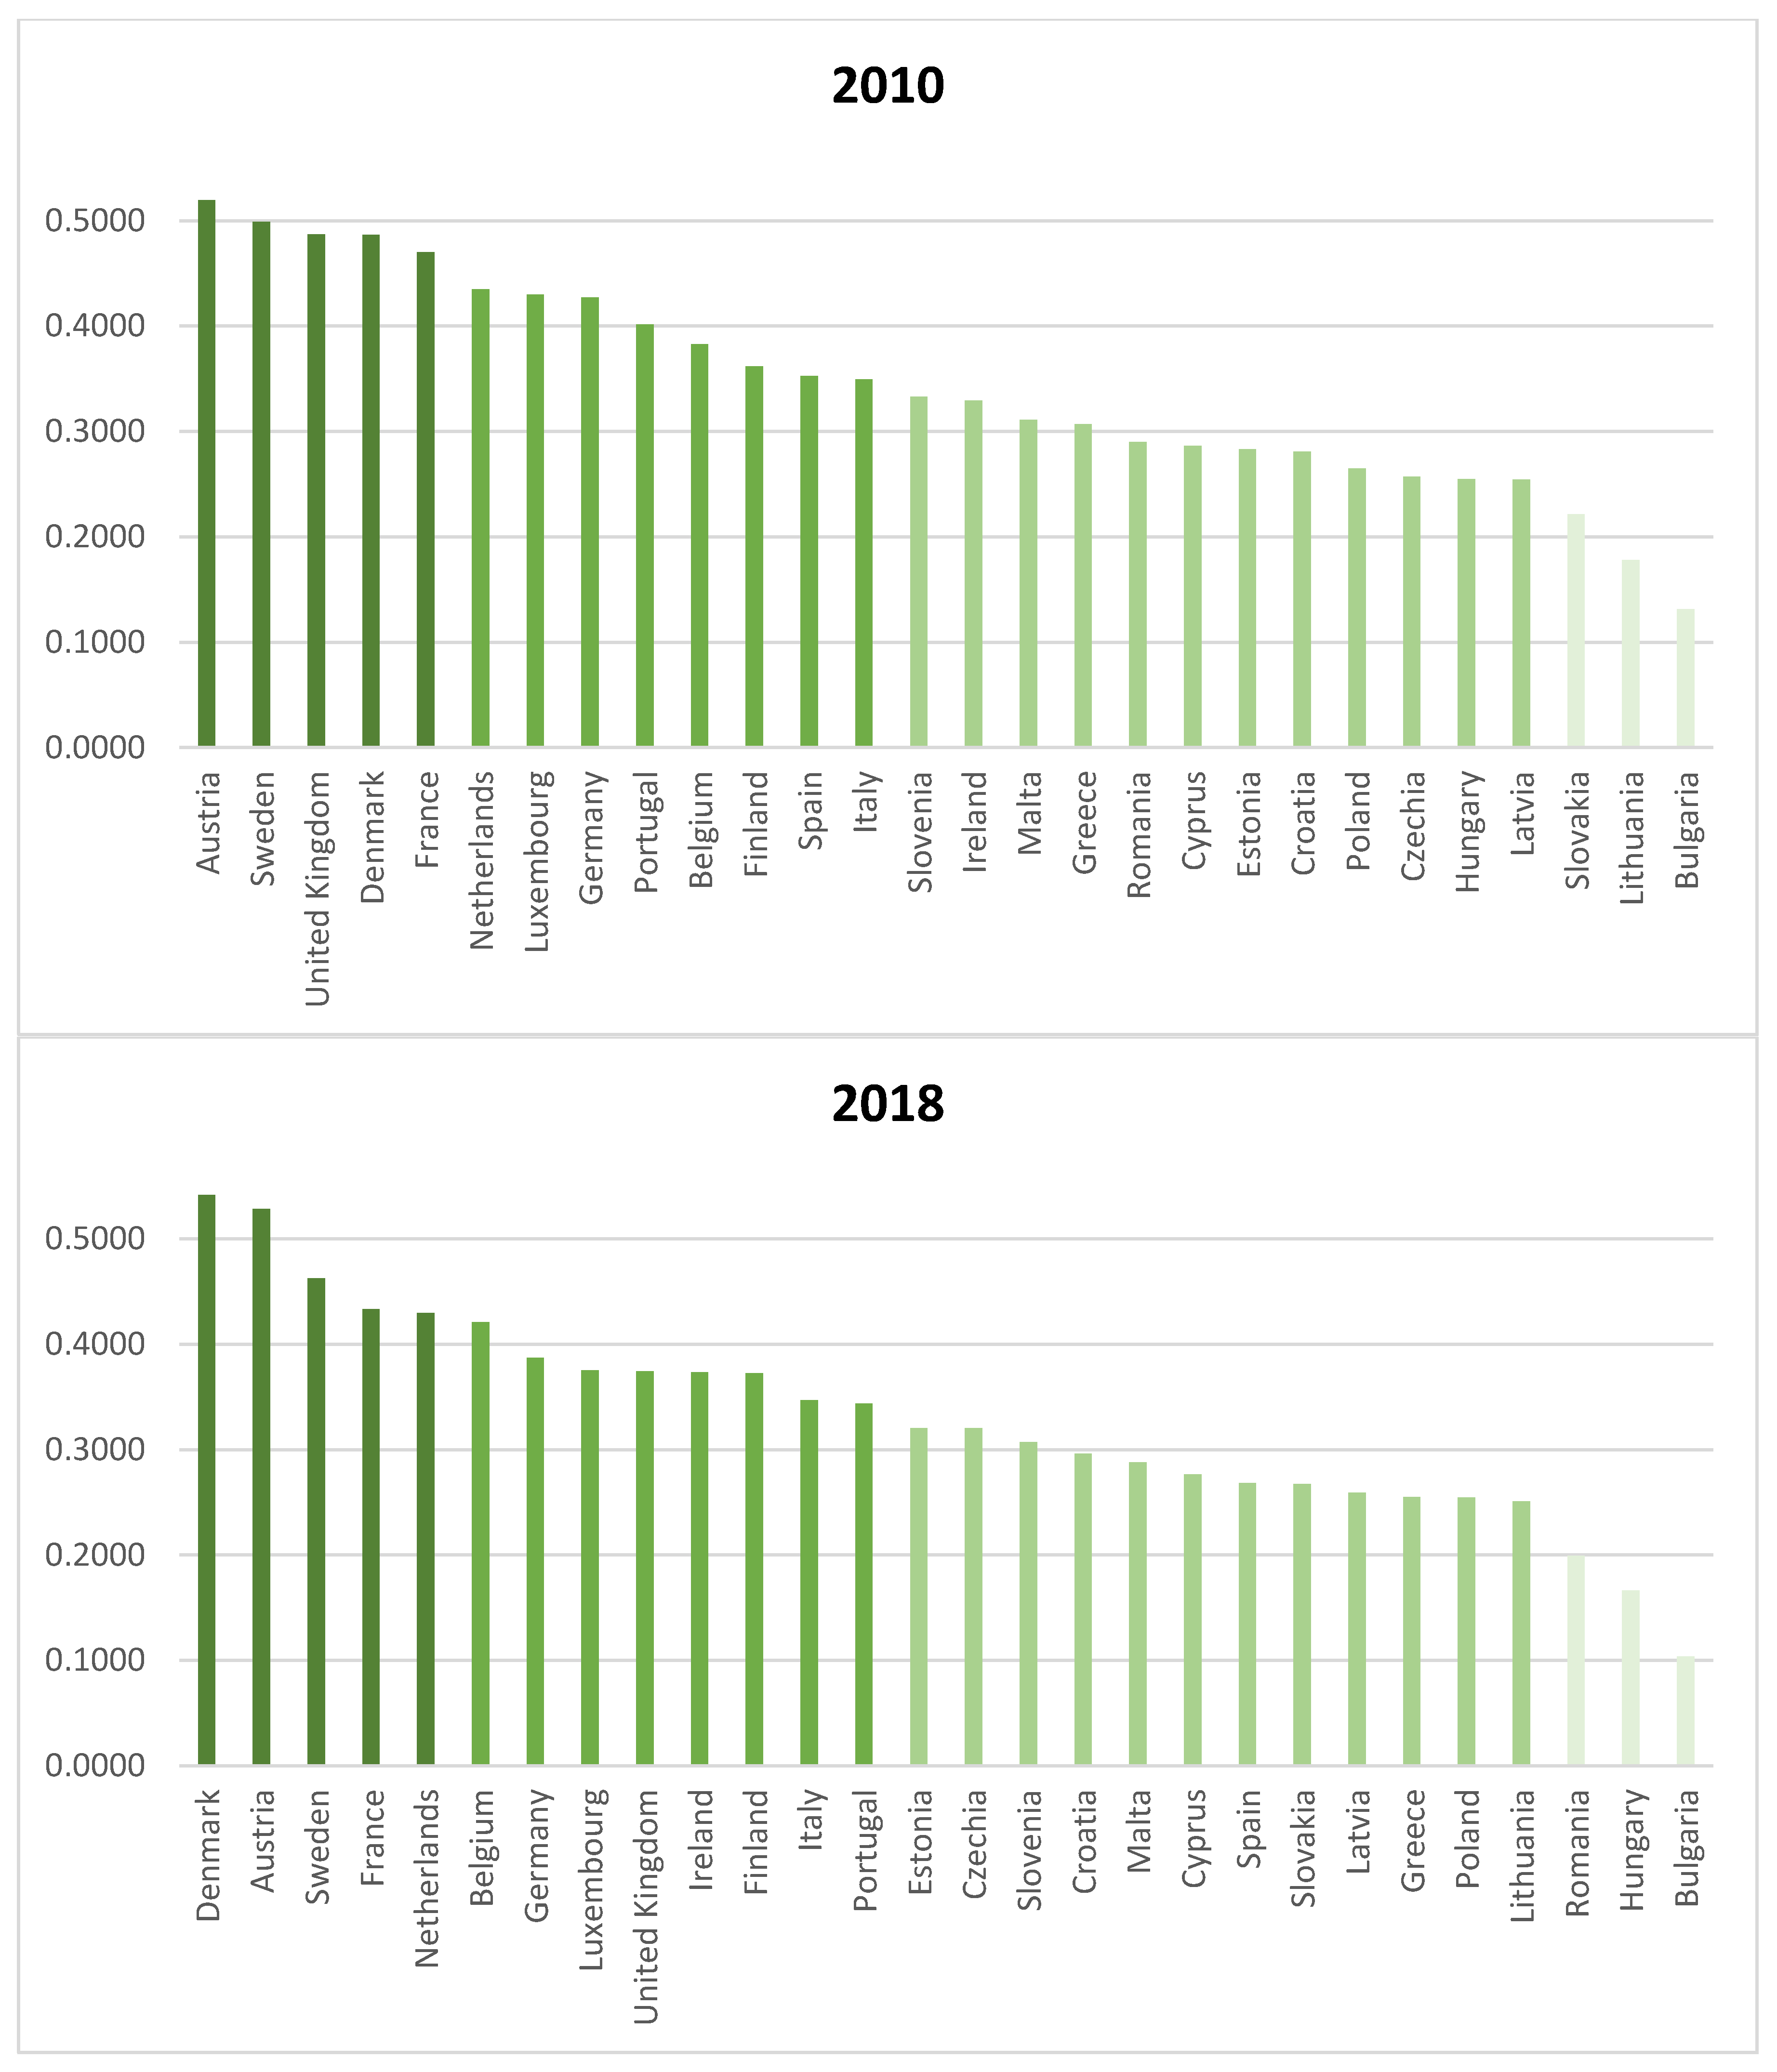
| EU Countries | 2010 | 2018 | Ranking Change 2010 vs. 2018 | ||
|---|---|---|---|---|---|
| GE Level (Group) | EU Countries Ranking | GE Level (Group) | EU Countries Ranking | ||
| Austria | I | 1 | I | 2 | −1 |
| Belgium | II | 10 | II | 6 | +4 |
| Bulgaria | IV | 28 | IV | 28 | 0 |
| Croatia | III | 21 | III | 17 | +4 |
| Cyprus | III | 19 | III | 19 | 0 |
| Czech Republic | III | 23 | III | 15 | +8 |
| Denmark | I | 4 | I | 1 | +3 |
| Estonia | III | 20 | III | 14 | +6 |
| Finland | II | 11 | II | 11 | 0 |
| France | I | 5 | I | 4 | +1 |
| Germany | II | 8 | II | 7 | +1 |
| Greece | III | 17 | III | 23 | −6 |
| Hungary | III | 24 | IV | 27 | −3 |
| Ireland | III | 15 | II | 10 | +5 |
| Italy | II | 13 | II | 12 | +1 |
| Latvia | III | 25 | III | 22 | +3 |
| Lithuania | IV | 27 | III | 25 | +2 |
| Luxembourg | II | 7 | II | 8 | −1 |
| Malta | III | 16 | III | 18 | −2 |
| Netherlands | II | 6 | I | 5 | +1 |
| Poland | III | 22 | III | 24 | −2 |
| Portugal | II | 9 | II | 13 | −4 |
| Romania | III | 18 | IV | 26 | −8 |
| Slovak Republic | IV | 26 | III | 21 | +7 |
| Slovenia | III | 14 | III | 16 | −2 |
| Spain | II | 12 | III | 20 | −8 |
| Sweden | I | 2 | I | 3 | −1 |
| United Kingdom | I | 3 | II | 9 | −6 |
| EU Countries | Indicators (Areas) Requiring Corrective Actions (zij < 0.4000) |
|---|---|
| Austria | x9; x10; x12; x13; x16;x17; x18; x21 |
| Belgium | x6;x7; x8; x9; x11; x13; x16; x18; x19; x21; x24 |
| Bulgaria | x3; x6;x7; x8; x9; x10; x11; x14; x15; x16; x17; x19; x21; x22; x23; x24; x26; x27 |
| Croatia | x3; x9; x10; x11; x13; x16; x17; x19; x21; x22 |
| Cyprus | x6; x7; x8; x9; x10; x11; x13; x14; x16; x17; x19; x21; x22 |
| Czech Republic | x3; x6; x7; x8; x9; x10; x11; x12; x16; x17; x18;x21 |
| Denmark | x2; x10; x16; x17; x18; x19; x21; x24 |
| Estonia | x1; x6; x8; x9; x10; x11; x14; x15; x18; x21; x24 |
| Finland | x4; x9; x10; x11; x15; x16; x17; x18; x21; x24 |
| France | x6; x7; x8; x11; x12; x13; x16; x18; x19; x21; x24 |
| Germany | x6; x7; x8; x9; x12; x16; x17; x19; x21; x24 |
| Greece | x6; x7; x8; x9; x10; x11; x16; x17; x19; x21; x22; x24; x25; x26; x27 |
| Hungary | x3; x6; x7; x8; x9; x10; x11; x12; x13; x14; x16; x17; x18; x19; x20; x21; x22; x23 |
| Ireland | x6; x7; x8; x12; x13; x16; x17; x18; x19; x24 |
| Italy | x3; x6; x7; x9; x13; x16; x18; x21; x24; x26; x27 |
| Latvia | x9; x10; x11; x13; x14; x16; x17; x18; x21; x22; x23; x24; x26; x27 |
| Lithuania | x7; x10; x11; x12; x13; x16; x17; x18; x19; x21; x22; x23; x24; x26; x27 |
| Luxembourg | x1; x4; x5; x6; x7; x9; x12; x15; x17; x19 |
| Malta | x6; x7; x8; x11; x14; x16; x17; x18; x19; x21; x22 |
| Netherlands | x6; x7; x8; x9; x11; x13; x18; x19; x21; x24 |
| Poland | x3; x6x7; x8; x9; x10; x11; x13; x14; x16; x17; x19; x21; x22 |
| Portugal | x9; x10; x11; x13; x16; x17; x18; x19; x21; x24 |
| Romania | x6; x7; x9; x10; x11; x12; x13; x14; x16; x17; x18; x19; x21; x22; x23; x26; x27 |
| Slovak Republic | x3; x6; x7; x8; x9; x10; x11; x12; x14; x16; x17; x19; x21; x22; x23 |
| Slovenia | x3; x6; x7; x8; x9; x10; x11; x13; x16; x17; x19; x21 |
| Spain | x6; x7; x9; x11; x12; x13; x16; x17; x18; x19; x21; x25; x26; x27 |
| Sweden | x10; x11; x12; x16; x17; x18; x19; x21; x24 |
| United Kingdom | x6; x7; x8; x12; x16; x18; x19; x21; x24; x27 |
| GGEI 2018 | GEI 2018 | GEP 1 2004–2014 |
|---|---|---|
| Sweden | Denmark | Bulgaria |
| Finland | Austria | Slovenia |
| Germany | Sweden | Hungary |
| Denmark | France | Ireland |
| Austria | Netherlands | Poland |
| France | Belgium | Cyprus |
| United Kingdom | Germany | Luxembourg |
| Ireland | Luxembourg | Italy |
| Netherlands | United Kingdom | Spain |
| Belgium | Ireland | Greece |
| Italy | Finland | Belgium |
| Greece | Italy | France |
| Hungary | Portugal | Germany |
| Spain | Estonia | United Kingdom |
| Portugal | Czech Republic | Croatia |
| Luxembourg | Slovenia | Czech Republic |
| Malta | Croatia | Netherlands |
| Lithuania | Malta | Austria |
| Slovenia | Cyprus | Finland |
| Croatia | Spain | Portugal |
| Romania | Slovak Republic | Estonia |
| Czech Republic | Latvia | Denmark |
| Estonia | Greece | Sweden |
| Latvia | Poland | Slovak Republic |
| Slovak Republic | Lithuania | Lithuania |
| Cyprus | Romania | Latvia |
| Poland | Hungary | |
| Bulgaria | Bulgaria |
Publisher’s Note: MDPI stays neutral with regard to jurisdictional claims in published maps and institutional affiliations. |
© 2021 by the author. Licensee MDPI, Basel, Switzerland. This article is an open access article distributed under the terms and conditions of the Creative Commons Attribution (CC BY) license (https://creativecommons.org/licenses/by/4.0/).
Share and Cite
Kasztelan, A. On the Road to a Green Economy: How Do European Union Countries ‘Do Their Homework’? Energies 2021, 14, 5941. https://doi.org/10.3390/en14185941
Kasztelan A. On the Road to a Green Economy: How Do European Union Countries ‘Do Their Homework’? Energies. 2021; 14(18):5941. https://doi.org/10.3390/en14185941
Chicago/Turabian StyleKasztelan, Armand. 2021. "On the Road to a Green Economy: How Do European Union Countries ‘Do Their Homework’?" Energies 14, no. 18: 5941. https://doi.org/10.3390/en14185941
APA StyleKasztelan, A. (2021). On the Road to a Green Economy: How Do European Union Countries ‘Do Their Homework’? Energies, 14(18), 5941. https://doi.org/10.3390/en14185941