
Cyber Risks to Critical Smart Grid Assets of Industrial Control Systems


Abstract
:1. Introduction
1.1. Motivation
1.2. Related Case Studies
1.3. Associated Challenges
1.4. Impact of Cyber-Attacks on Industrial Control Systems
- To provide a comprehensive overview on all available ICS asset discovery tools, vulnerability scanners, and used solutions.
- To propose a methodology to evaluate assets criticality based on their connection inside the smart grid.
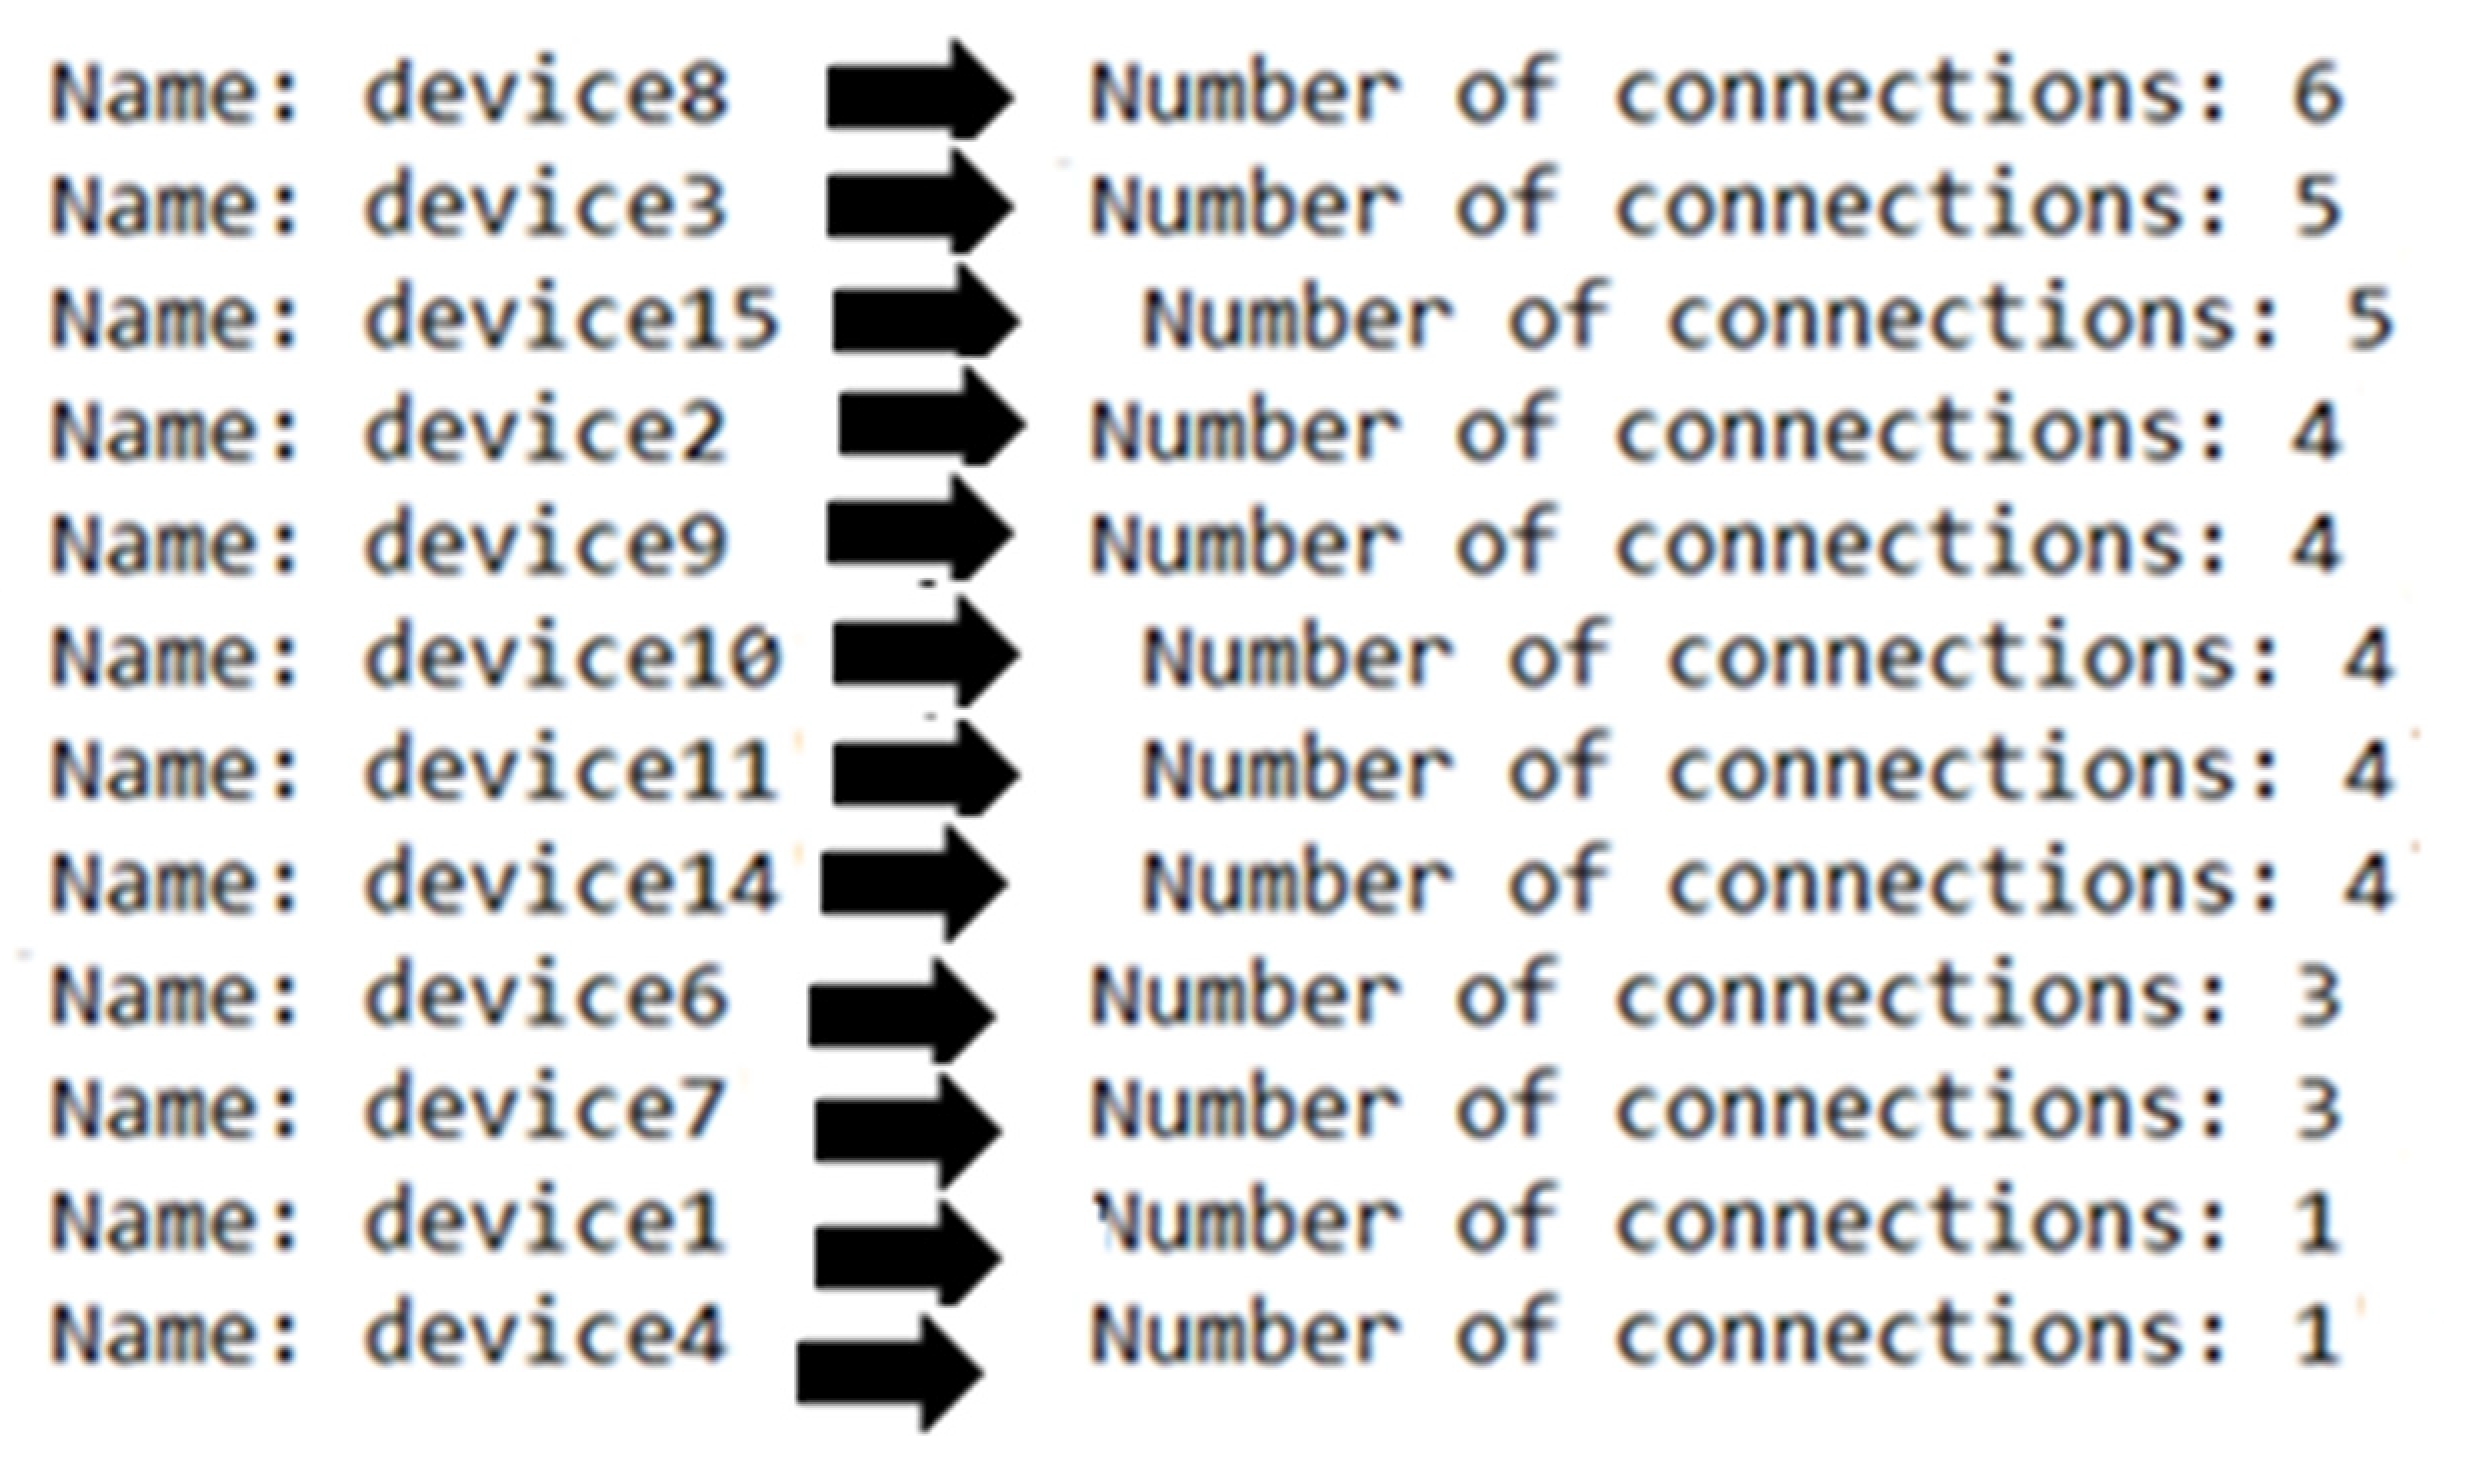
- To evaluate the proposed methodology using a list that contains 18 assets to determine and classify their criticality.
- Explore different attack scenarios from a power measurements perspective when a system is compromised to emphasise the importance of protecting such a system.
2. Background and Related Works
2.1. Related Terminology
2.2. Assets and Asset Discovery
2.3. Assets Rating
2.4. Asset Discovery Existing Tools
2.5. Vulnerability Scanner Existing Tools
2.6. Existing Solutions for Asset Discovery
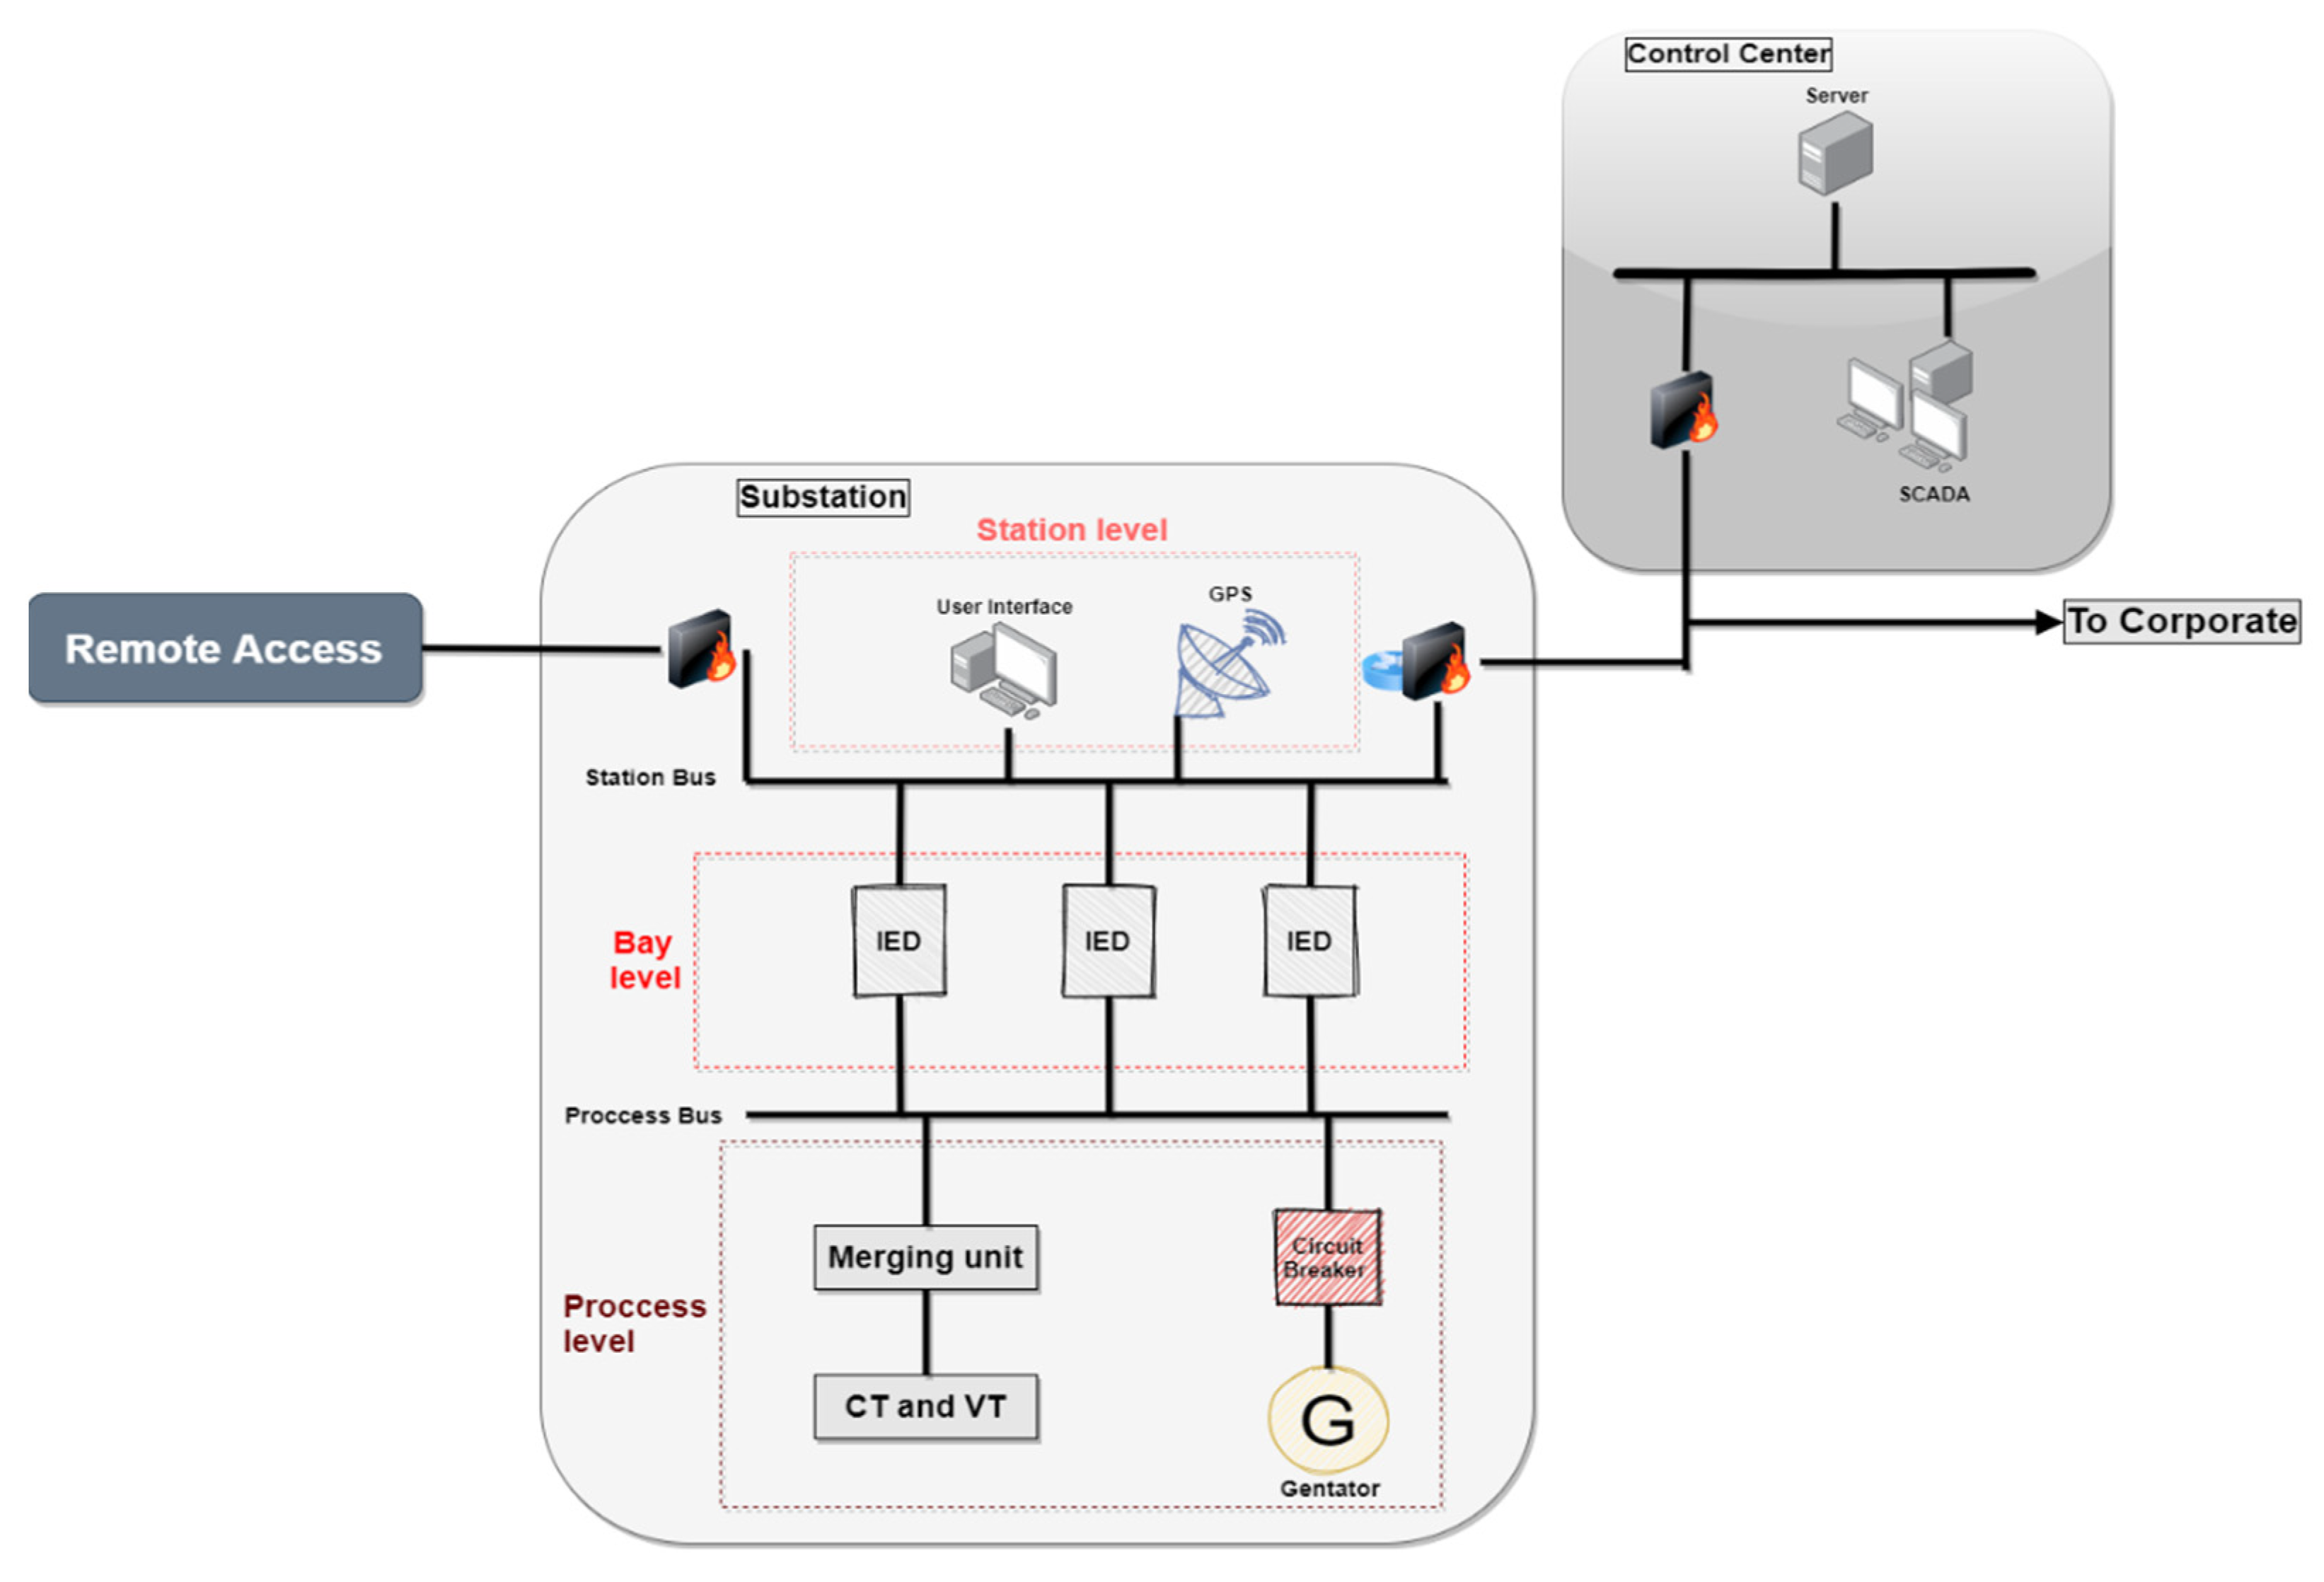
3. System and Threat Models
3.1. Security Objectives and Goals
3.2. System Model and Problem Formulation
3.3. Threat Model
4. Our Approach
4.1. Assets in ICS
4.2. Critical Assets
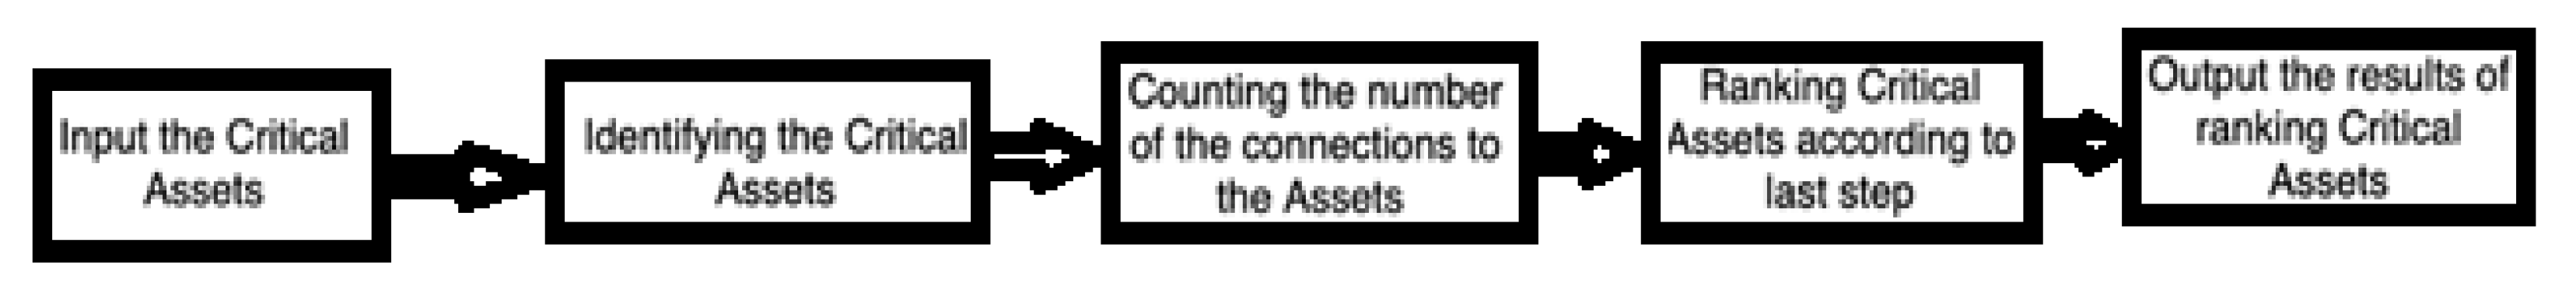
4.3. Ranking of Critical Assets
| Algorithm 1 Calculate Criticality for ICS Asset list |
| Input: An asset list defined based on the asset discovery tool/technique used. Output: An asset list with their connections organised in descending order to did determine the criticality
2: Create Edges using the Plotly library 3: Output is output_list[ ] that contains the connections of all assets
5: let temp present temporary value in order to organise the list in descending order 6: For i in range(0, len(output_list)): 7: for j in range(i+1, len(output_list)): 8: if(output_list [i] < output_list [j]): 9: temp = output_list [i]; 10: output_list [i] = output_list [j]; 11: output_list [j] = temp; |
5. Results and Evaluation
5.1. Experiment Setup
5.2. Results and Discussion
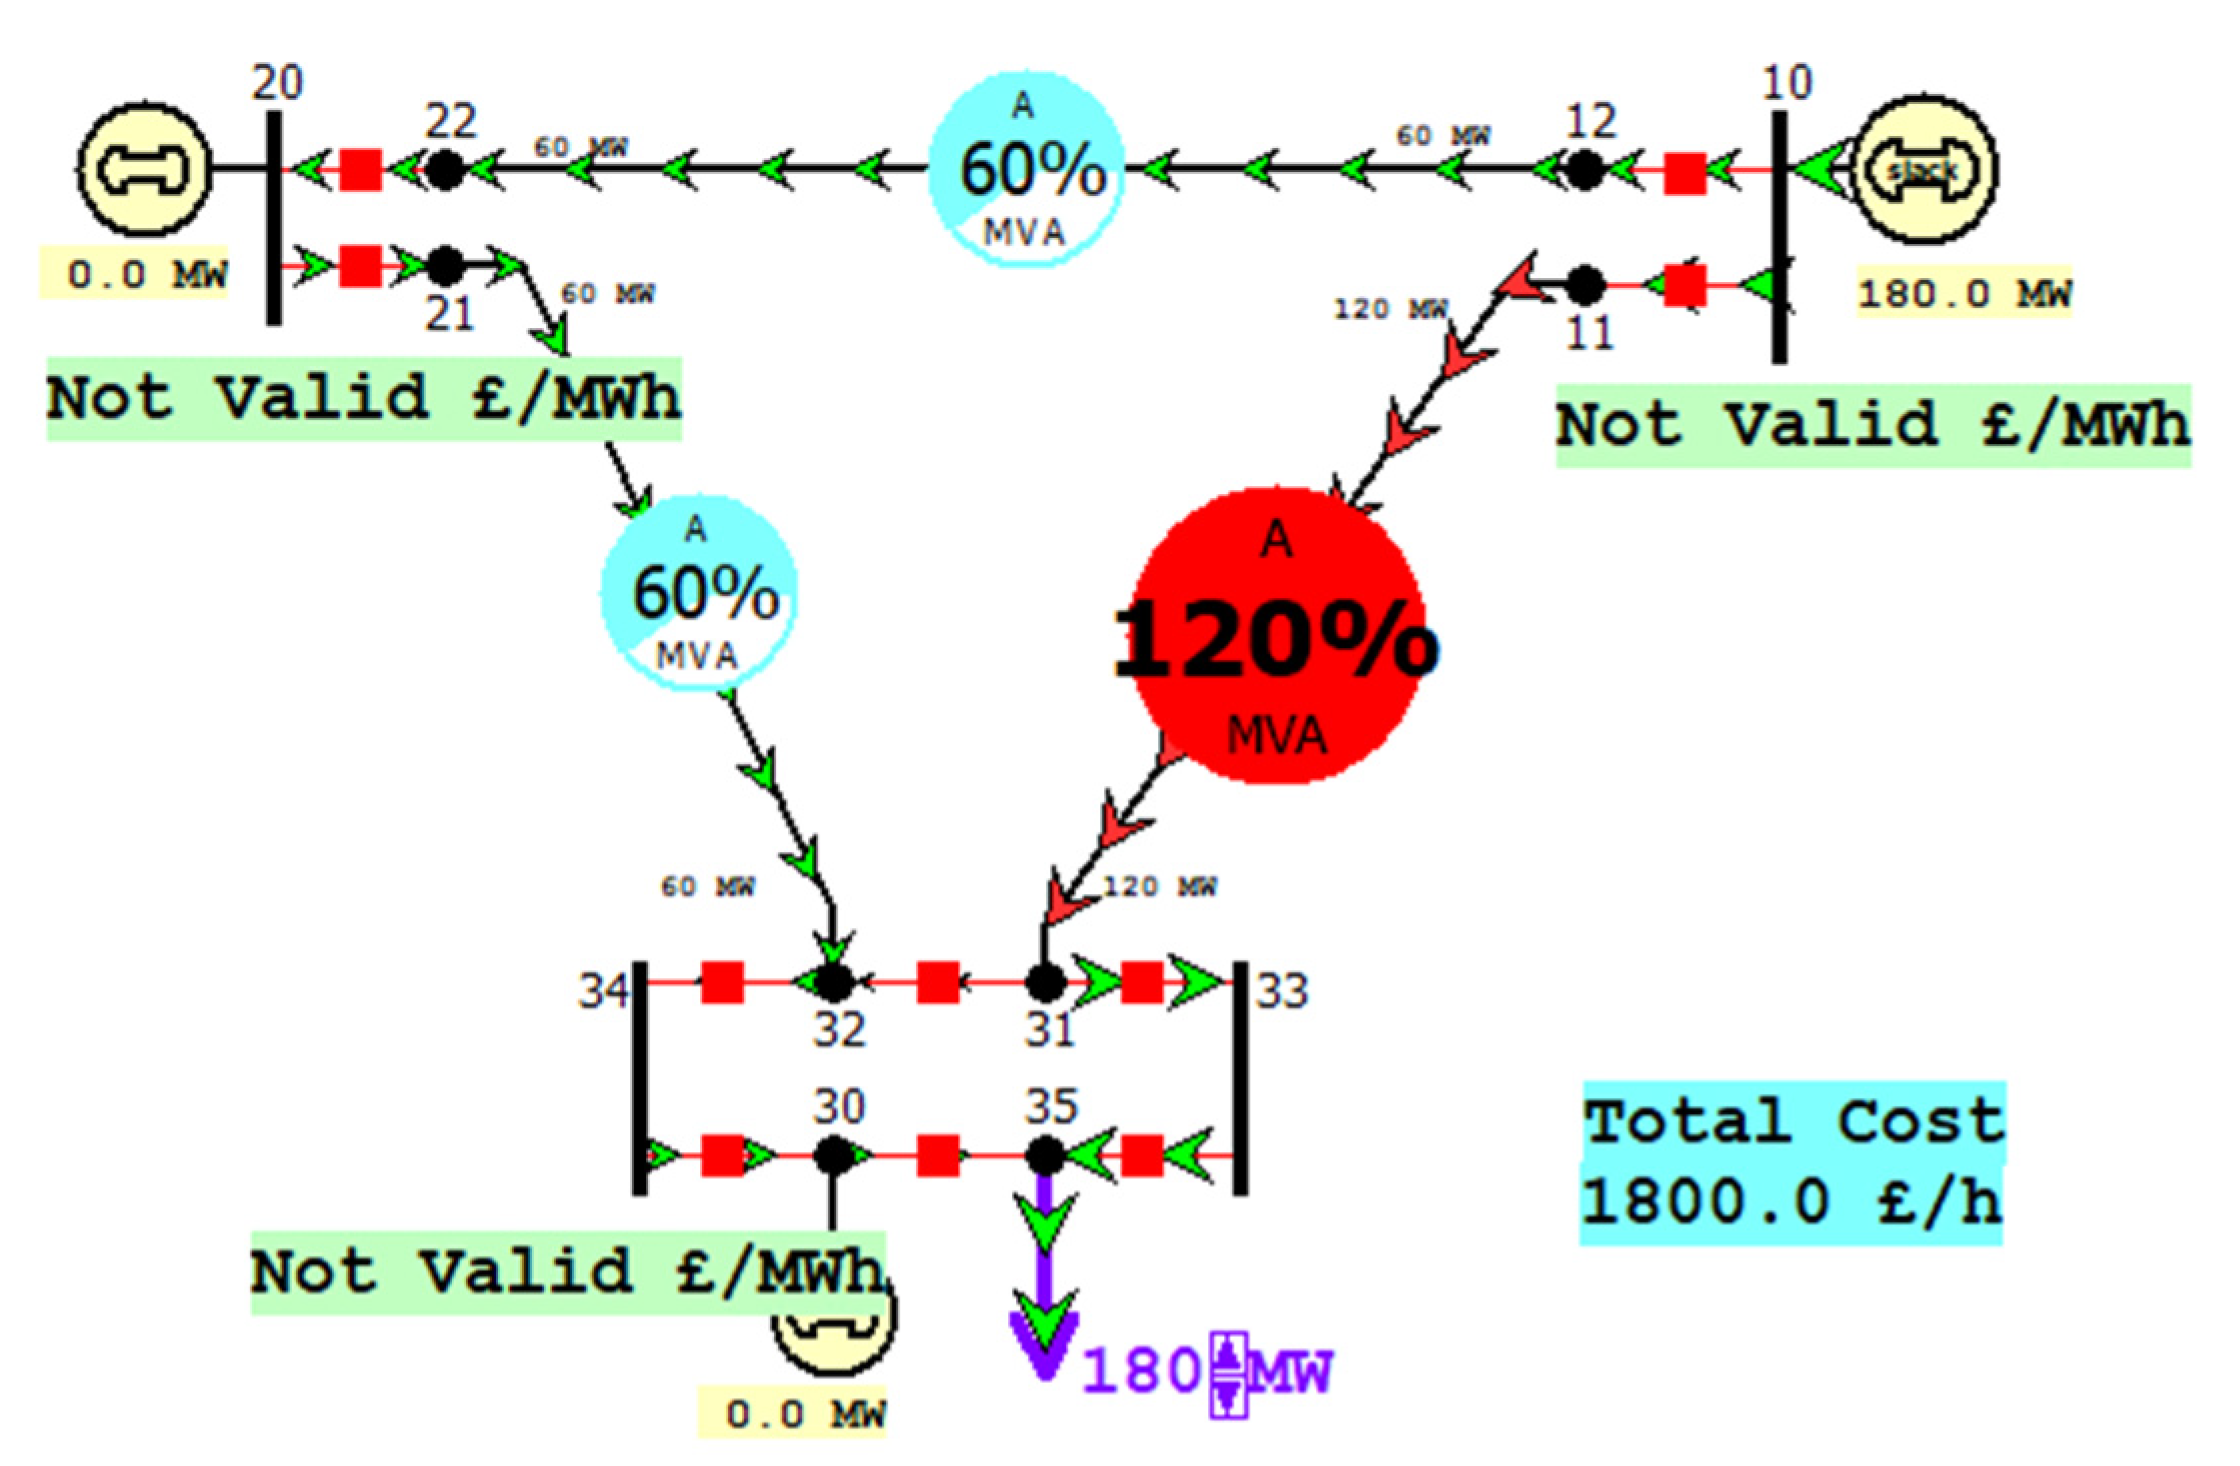
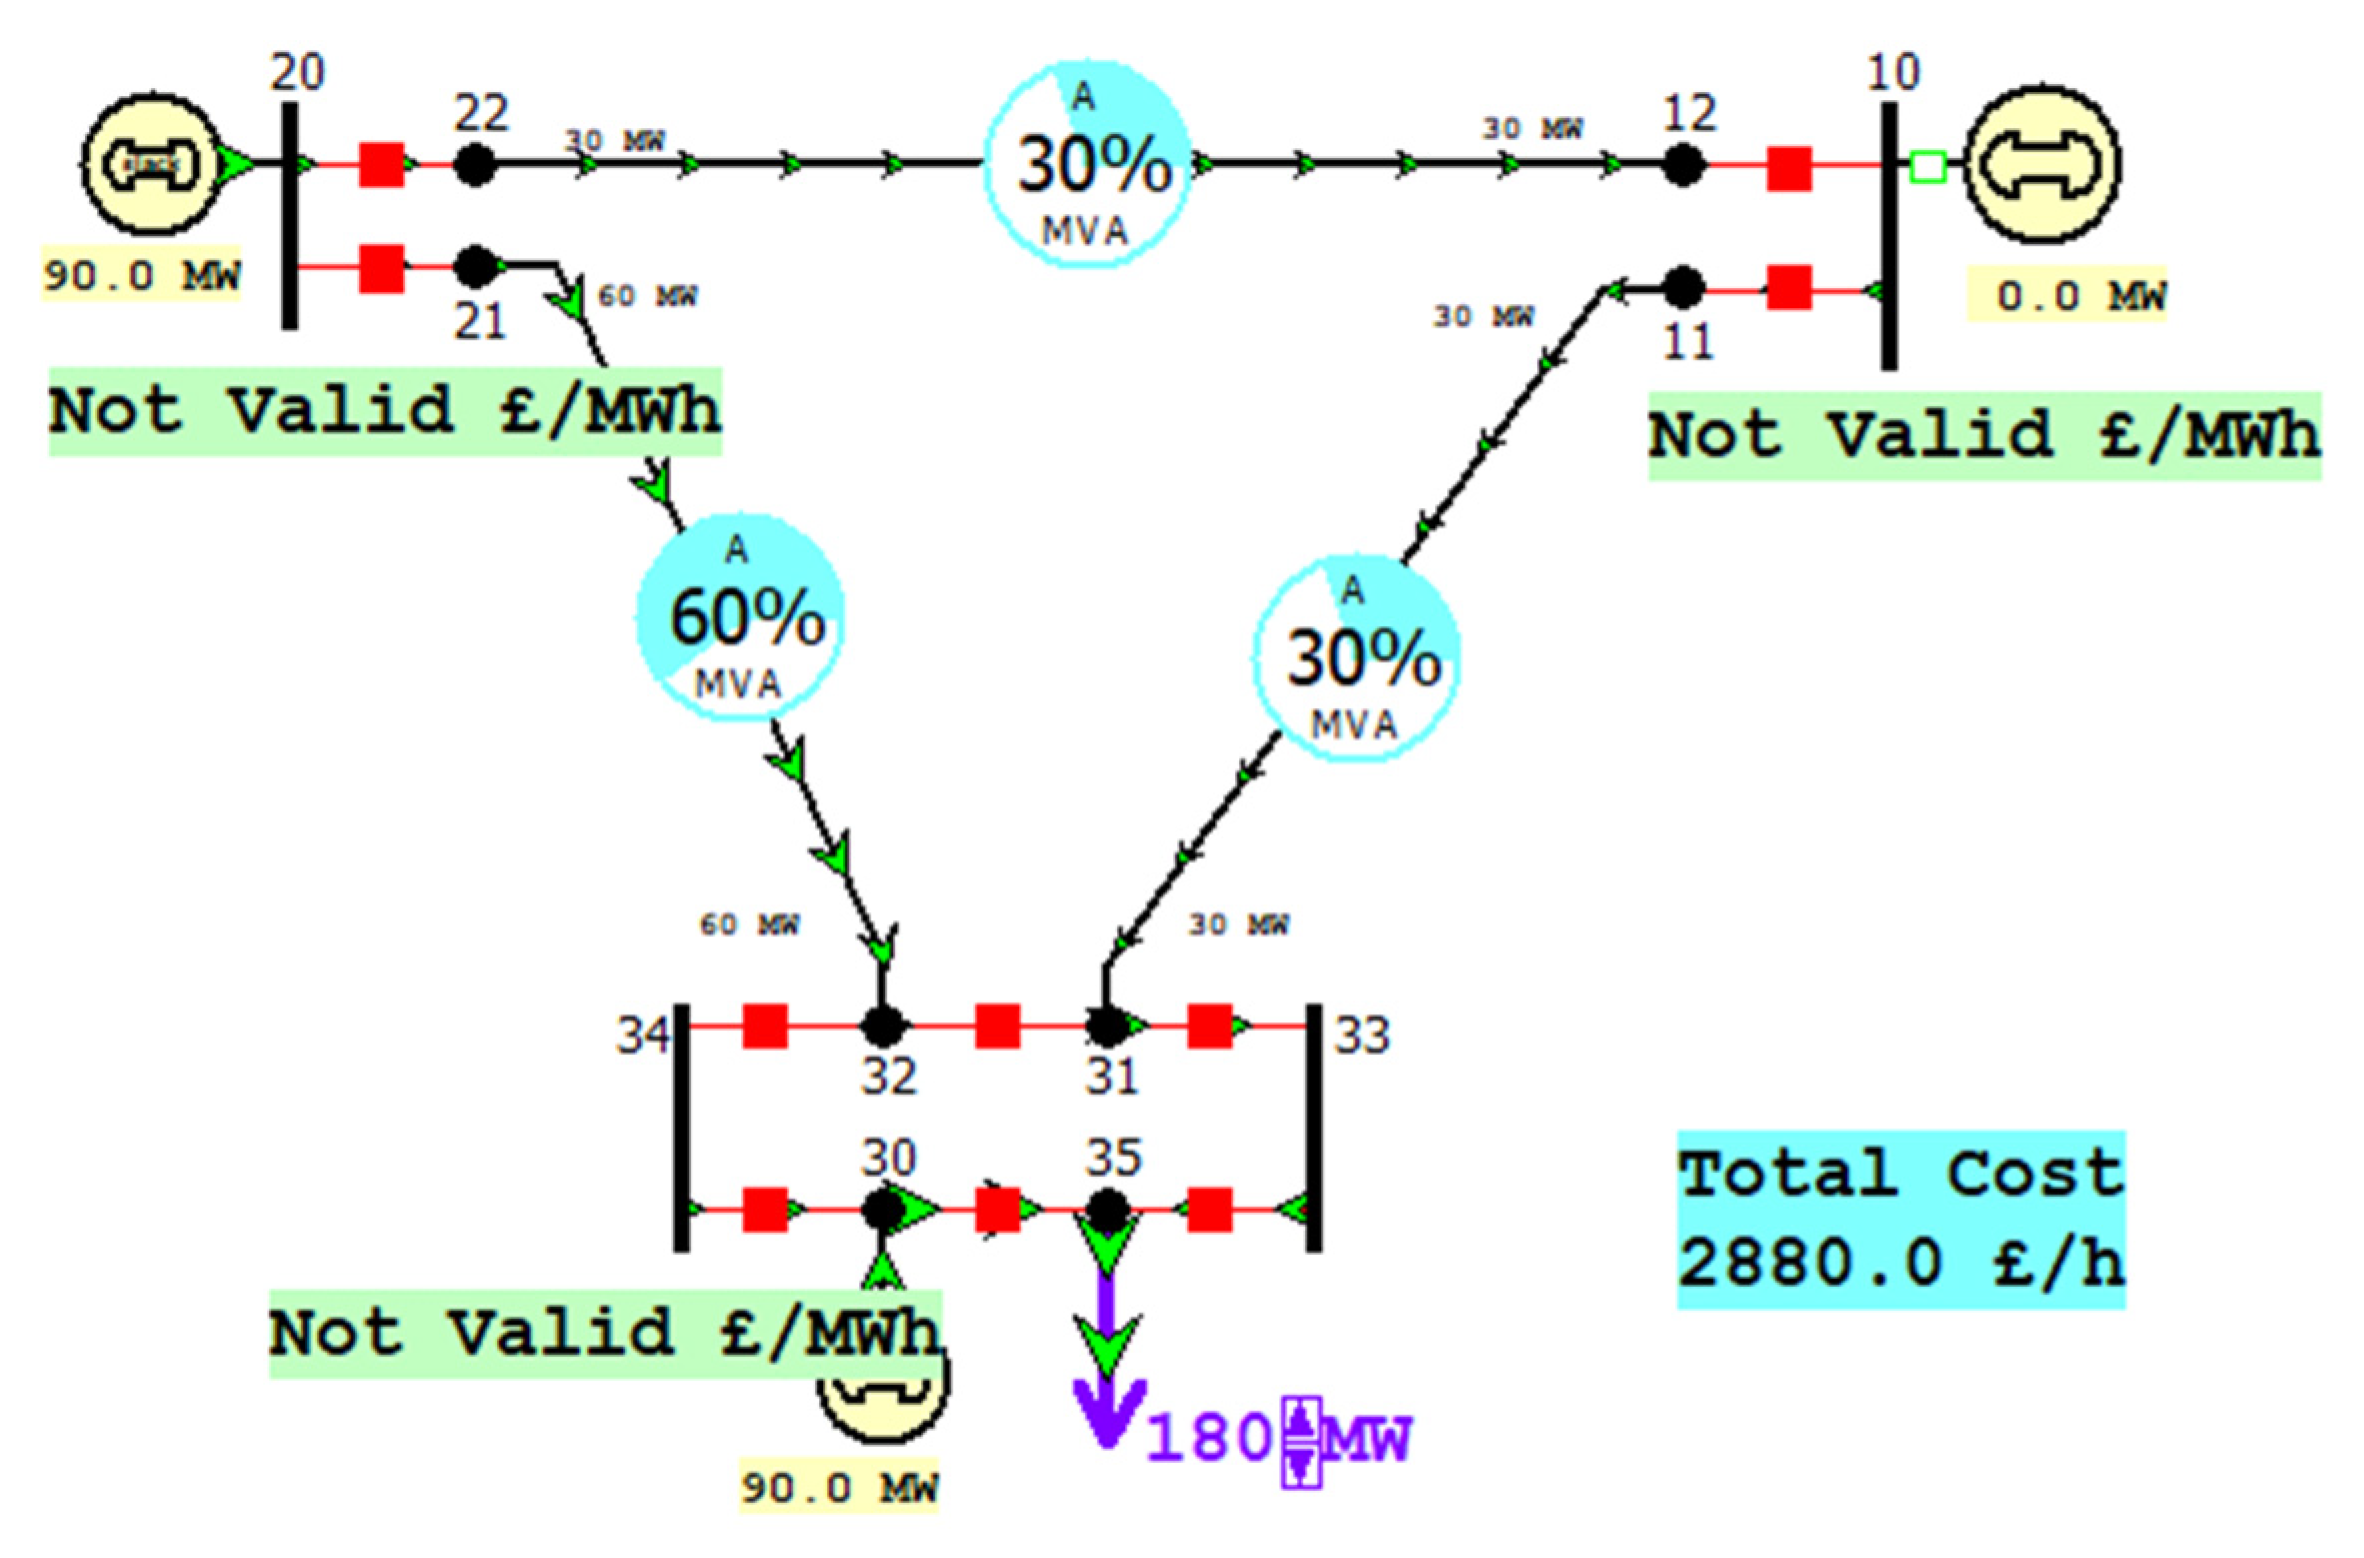
5.3. Evaluation under Normal vs. Attack Scenarios
5.3.1. Impact under Normal Scenario
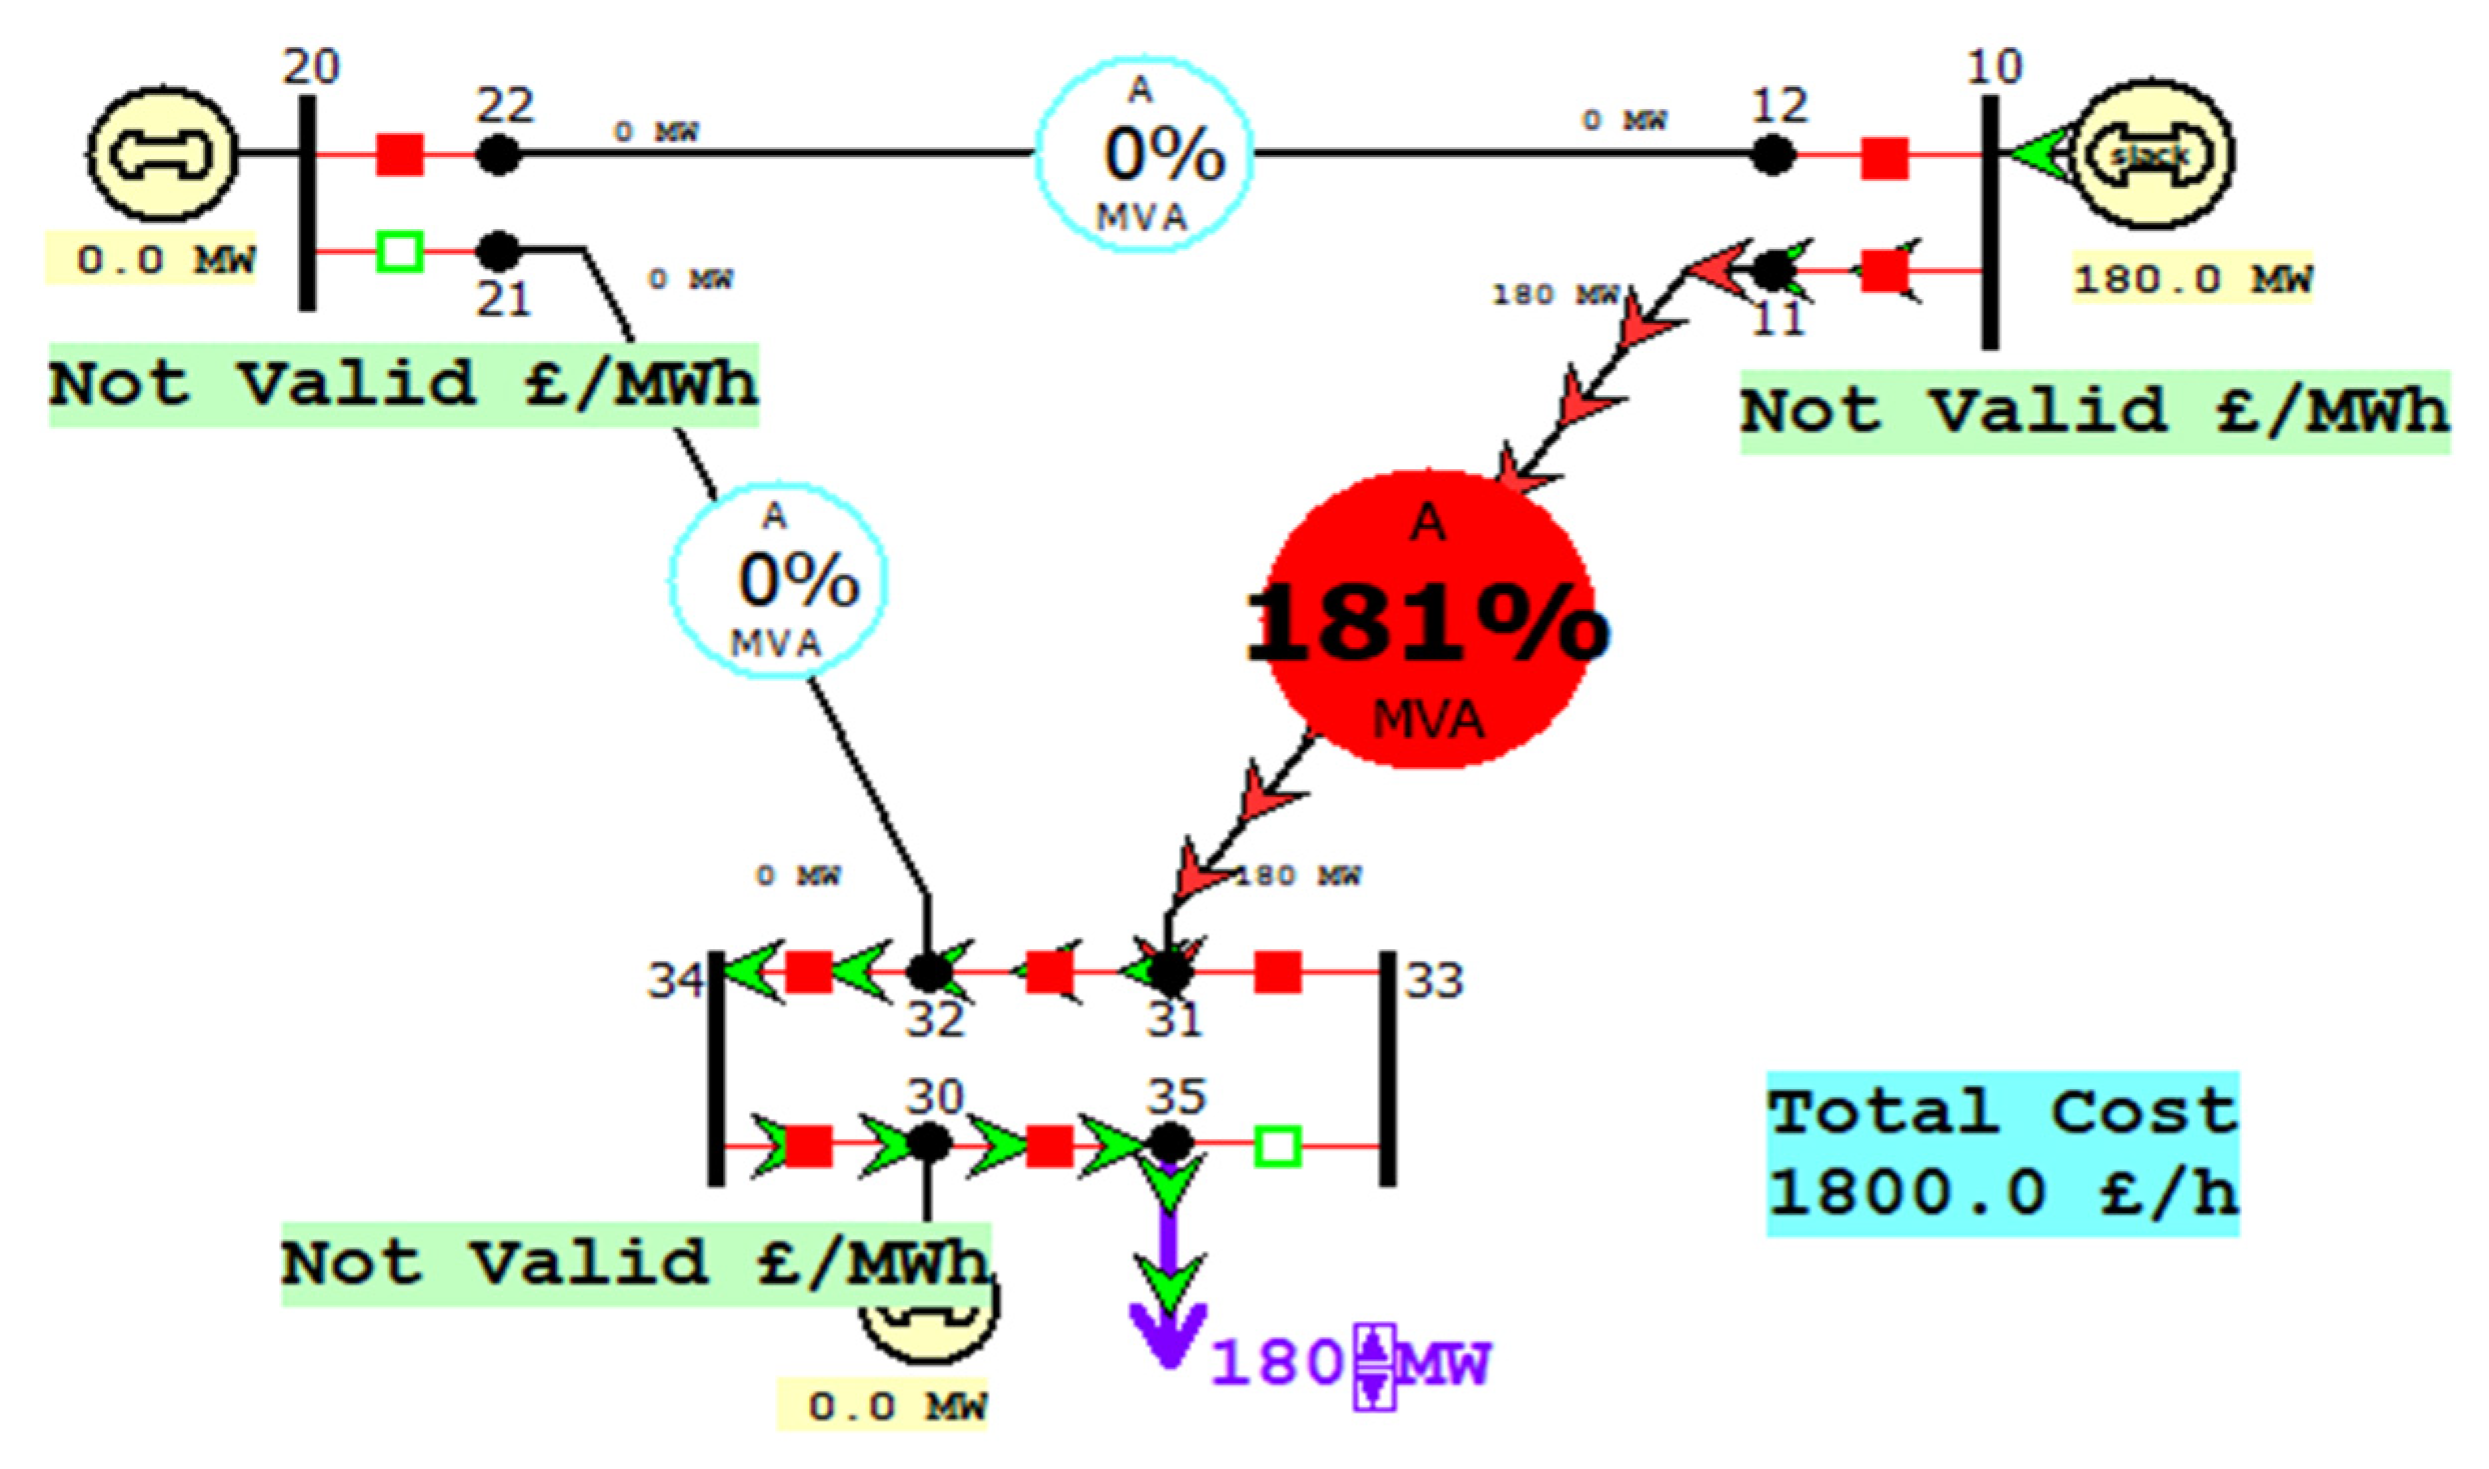
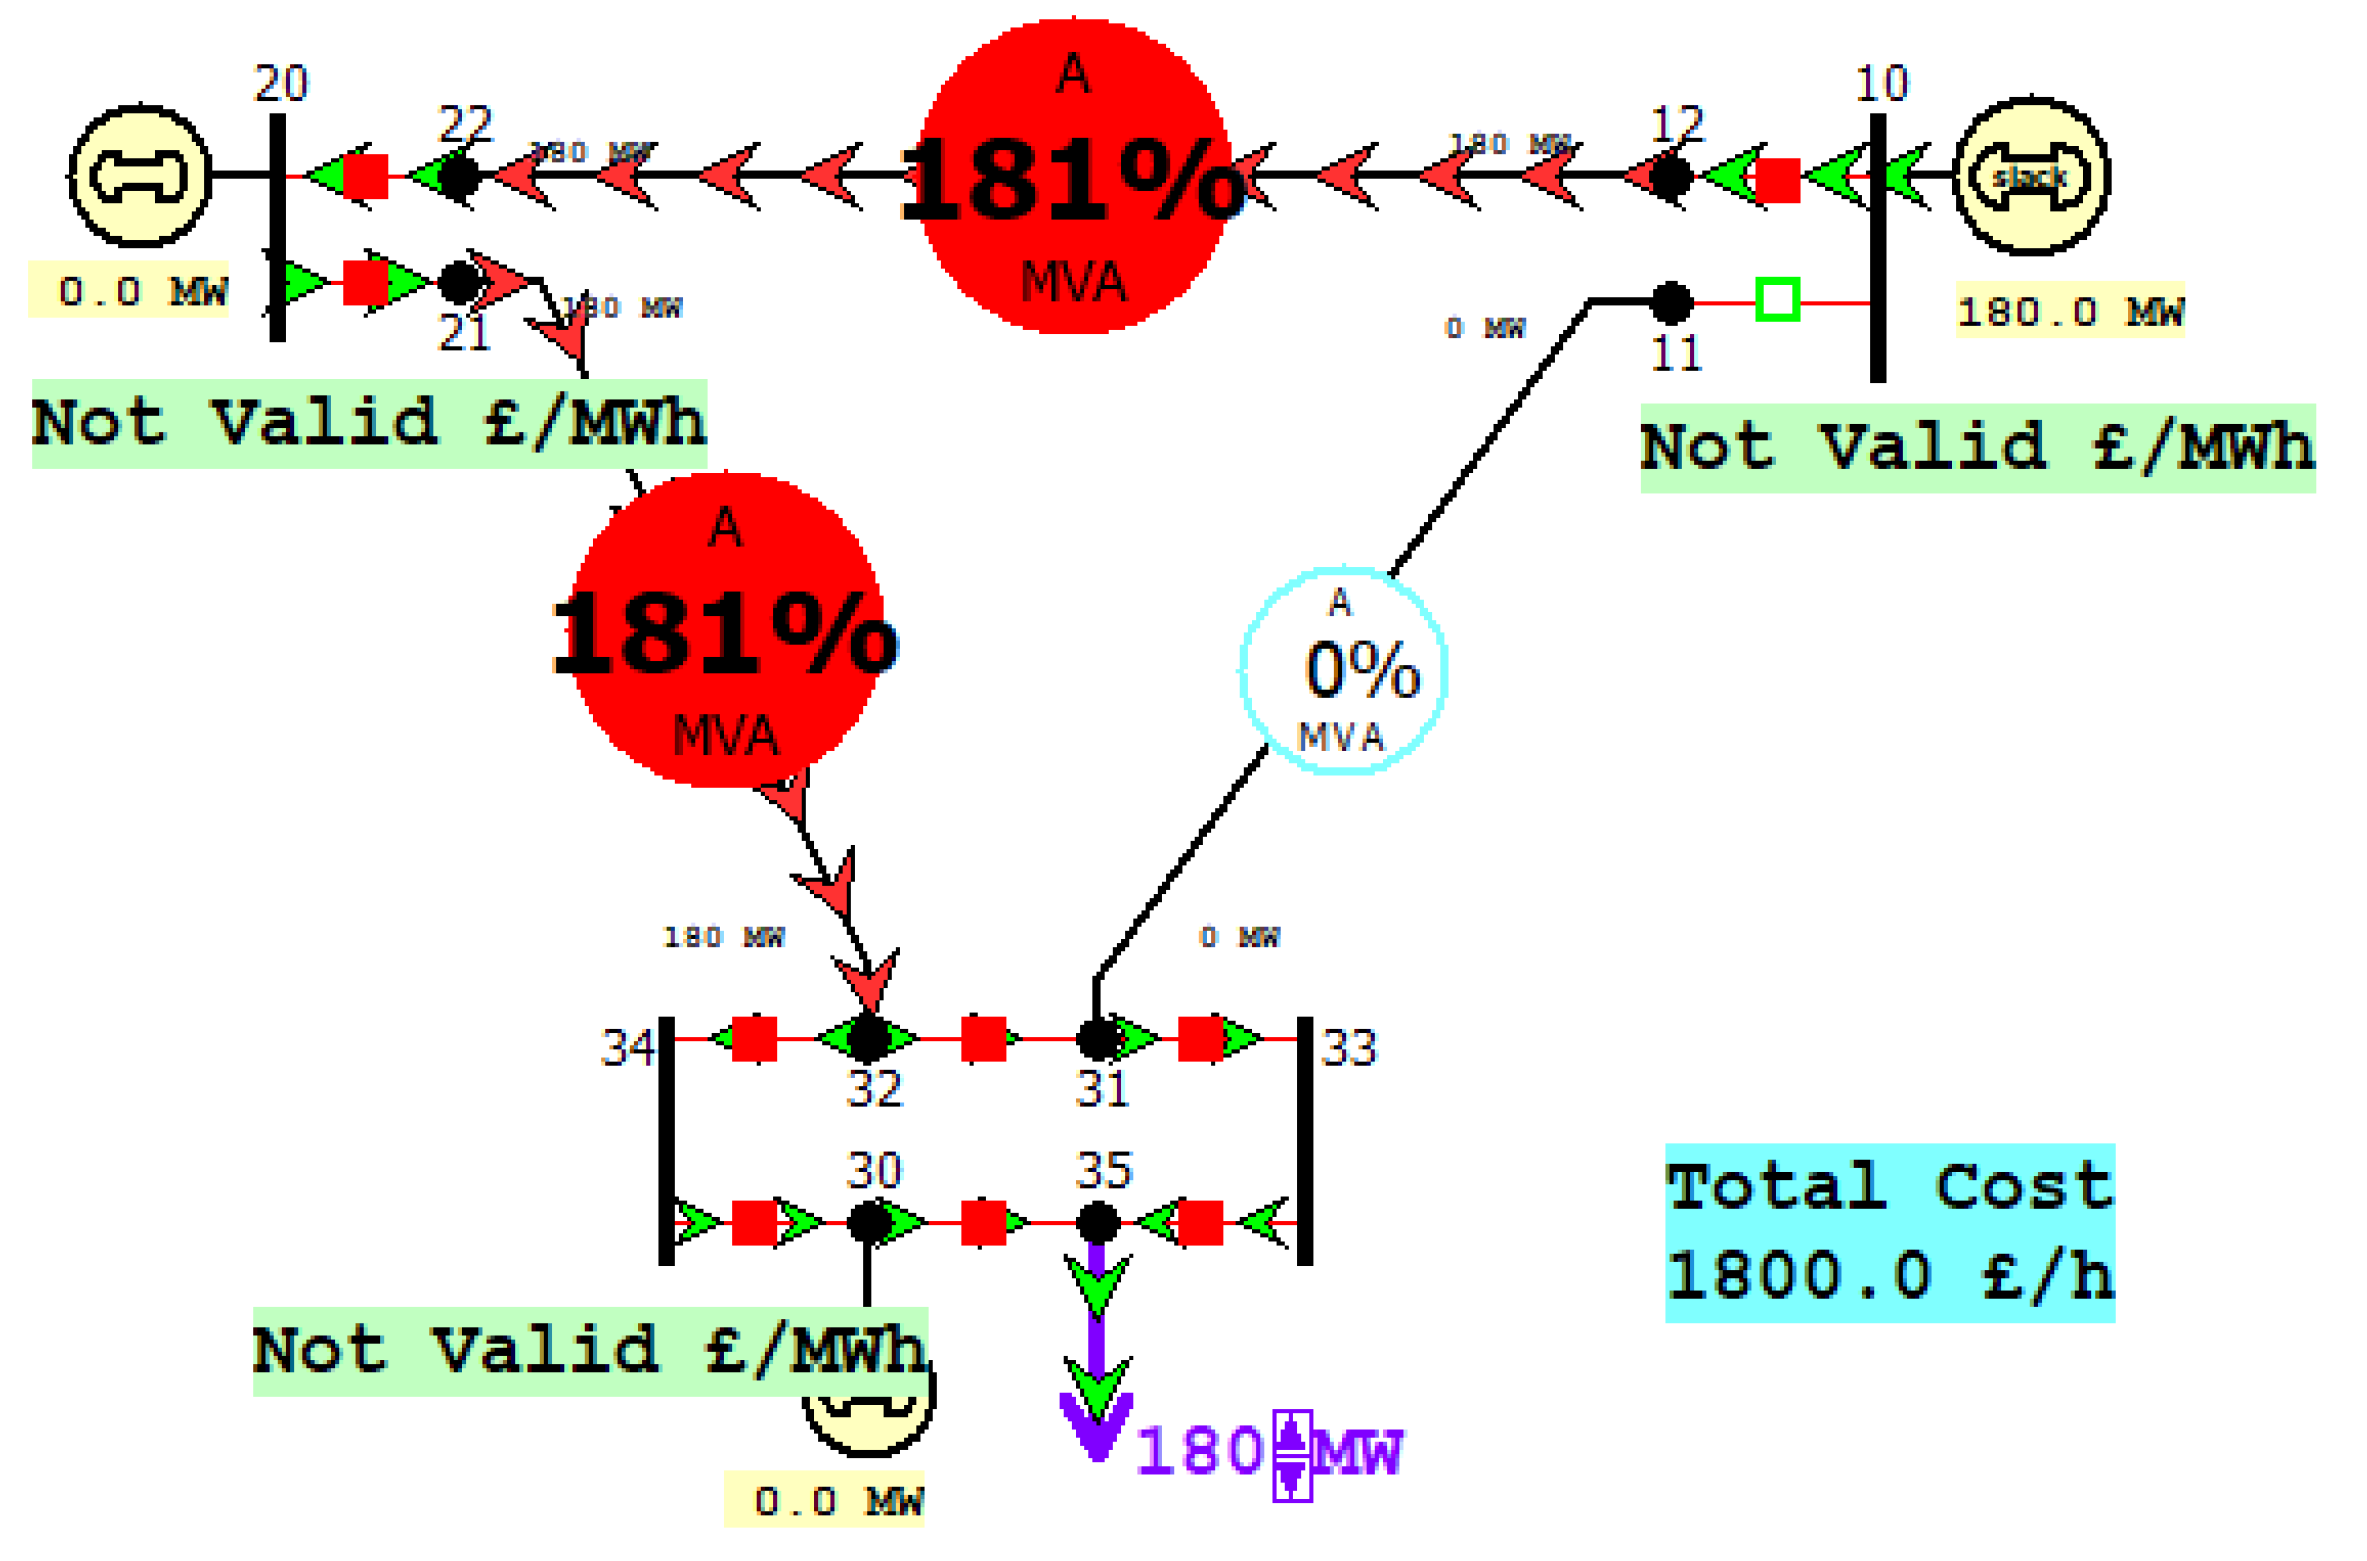
5.3.2. Impact under Attack Scenario
Scenario-I: An Adversary Trips Generator #10
Scenario-II: Adversary Trips Generator #20 and #30
Scenario-III: Adversary Trips Two Circuit Breakers: 21–20 and 33–35 Breakers
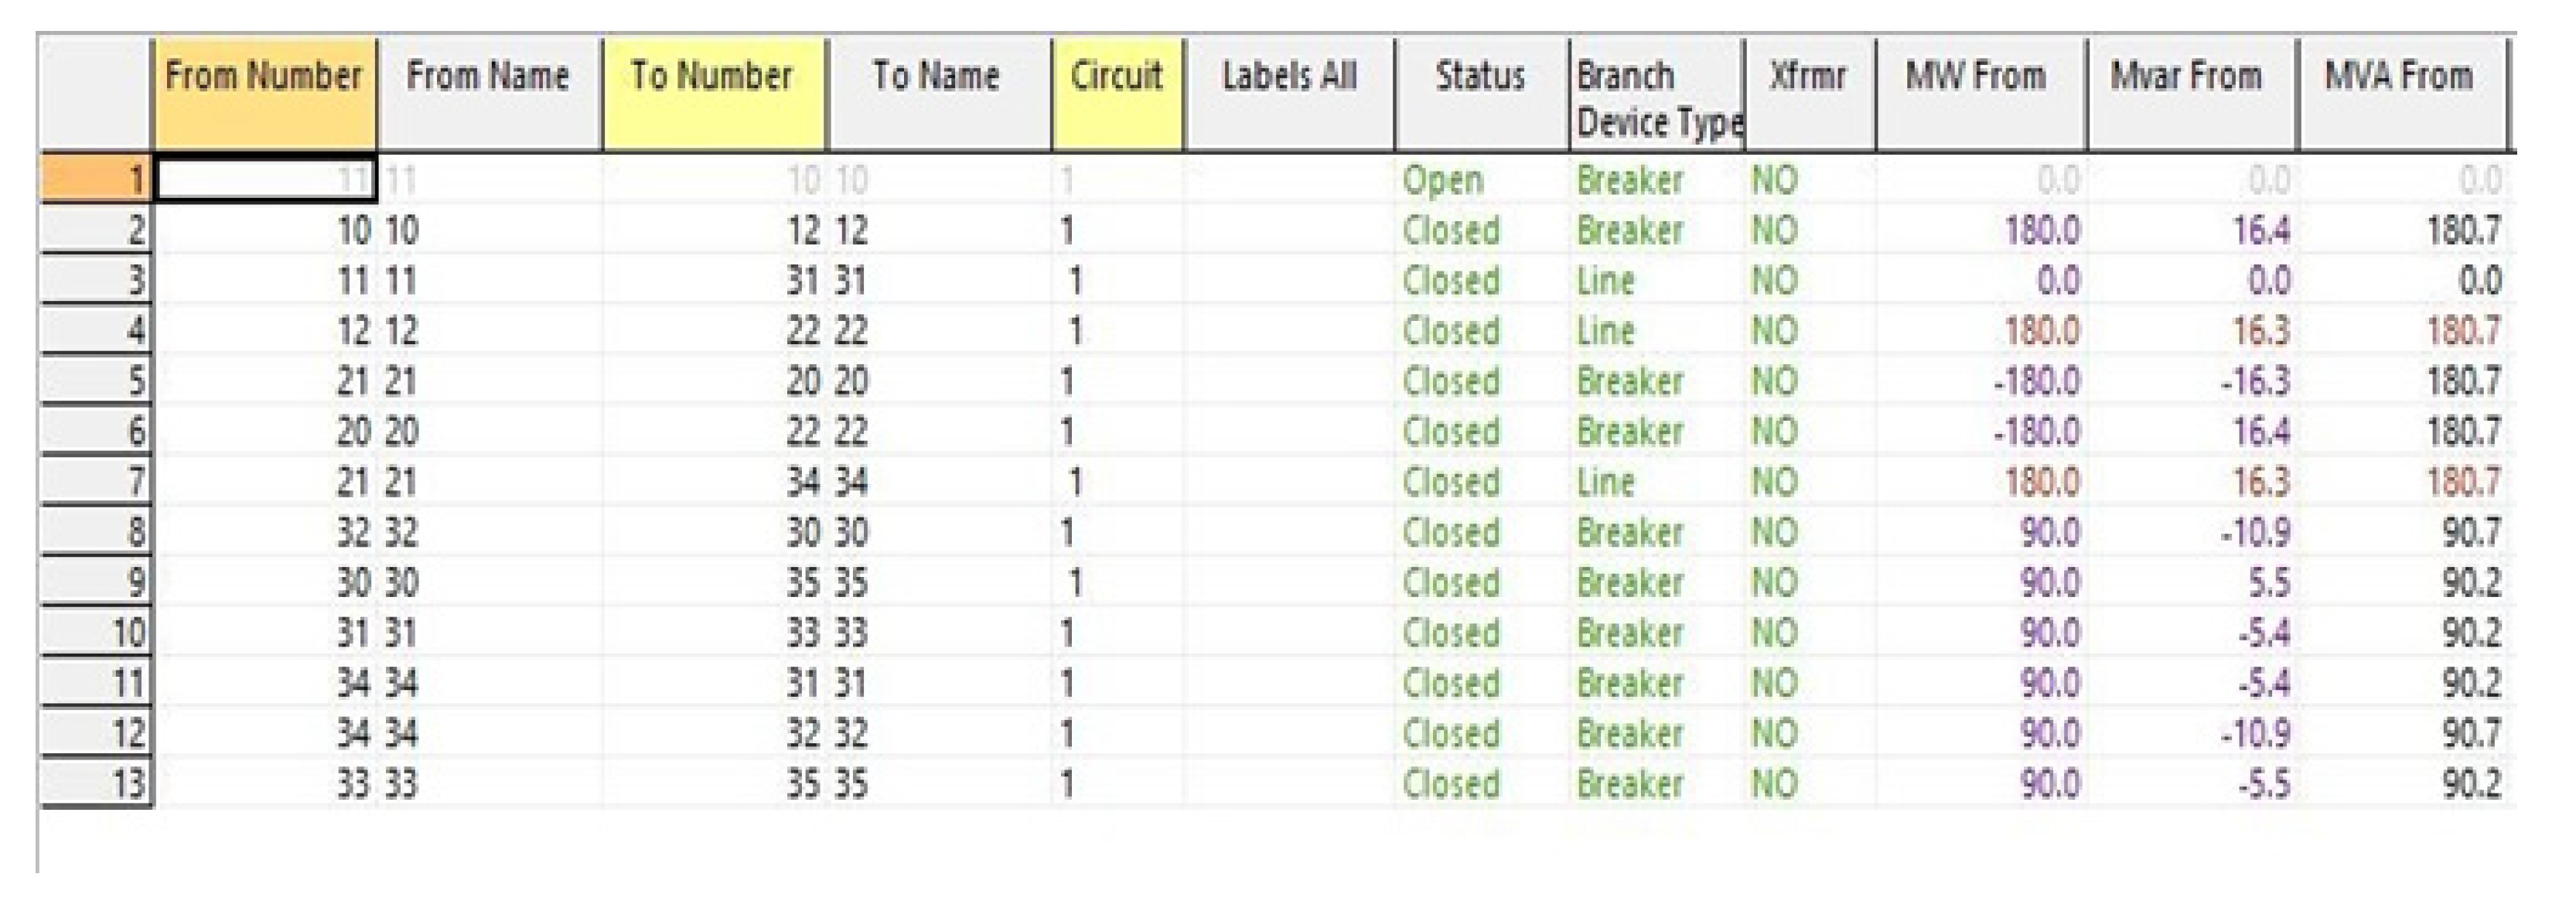
Scenario-IV: Adversary Trips One Circuit Breaker: 11–10 Breakers
6. Conclusions
Author Contributions
Funding
Conflicts of Interest
References
- Paridari, K.; O’Mahony, N.; Mady, A.E.-D.; Chabukswar, R.; Boubekeur, M.; Sandberg, H. A Framework for Attack-Resilient Industrial Control Systems: Attack Detection and Controller Reconfiguration. Proc. IEEE 2018, 106, 113–128. [Google Scholar] [CrossRef]
- Gunduz, M.Z.; Das, R. Analysis of Cyber-Attacks on Smart Grid Applications. In Proceedings of the IEEE International Conference on Artificial Intelligence and Data Processing, IDAP, Malatya, Turkey, 28–30 September 2018. [Google Scholar] [CrossRef]
- Stouffer, K.; Falco, J.; Scarfone, K. GUIDE to Industrial Control Systems (ICS) Security. NIST 2011, 800, 16. Available online: https://nvlpubs.nist.gov/nistpubs/SpecialPublications/NIST.SP.800-82r2.pdf (accessed on 20 March 2021).
- Panettieri, J. Colonial Pipeline Cyberattack: Timeline and Ransomware Attack Recovery Details—MSSP Alert. Available online: https://www.msspalert.com/cybersecurity-breaches-and-attacks/ransomware/colonial-pipeline-investigation/ (accessed on 17 June 2021).
- Turton, W.; Mehrotra, K. Colonial Pipeline Cyber Attack: Hackers Used Compromised Password—Bloomberg. Available online: https://www.bloomberg.com/news/articles/2021-06-04/hackers-breached-colonial-pipeline-using-compromised-password (accessed on 17 June 2021).
- Lee, R.M.; Assante, M.J.; Conway, T. Analysis of the Cyber Attack on the Ukrainian Power Grid Defense Use Case. Electr. Inf. Shar. Anal. Cent. 2016, 36, 1–29. [Google Scholar]
- Wei, D.; Ji, K. Resilient industrial control system (RICS): Concepts, formulation, metrics, and insights. In Proceedings of the 3rd International Symposium on Resilient Control Systems, Idaho Falls, ID, USA, 10–12 August 2010; pp. 15–22. [Google Scholar]
- Liu, Y.; Ning, P. False Data Injection Attacks against State Estimation in Electric Power Grids. ACM Trans. Inf. Syst. Secur. 2011, 14, 33. [Google Scholar] [CrossRef]
- Chen, W.; Ding, D.; Dong, H.; Wei, G. Distributed Resilient Filtering for Power Systems Subject to Denial-of-Service Attacks. IEEE Trans. Syst. Man Cybern. Syst. 2019, 49, 1688–1697. [Google Scholar] [CrossRef]
- Incibe. Guide for an Asset Inventory Management in Industrial Control Systems. 2020. Available online: https://www.incibe-cert.es/en/blog/guide-asset-inventory-management-industrial-control-systems (accessed on 17 May 2021).
- RTU. Introduction of Remote Terminal Unit. Available online: https://www.sciencedirect.com/topics/engineering/remote-terminal-unit (accessed on 3 April 2021).
- Stouffer, K.; Zimmerman, T.; Tang, C.; Lubell, J.; Cichonski, J.; McCarthy, J. Cybersecurity Framework Manufacturing Profile. NIST Intern. Rep. 2017, 2017, 8183. Available online: https://www.nist.gov/publications/cybersecurity-framework-manufacturing-profile (accessed on 4 April 2021).
- Tenable, OT. Available online: https://zh-cn.tenable.com/products/tenable-ot?tns_redirect=true (accessed on 12 May 2021).
- Axonius. Cybersecurity Asset Management Platform. Available online: https://www.axonius.com/ (accessed on 9 May 2021).
- Bayshore Networks. Bayshore Networks—Industrial Control Cyber. Available online: https://bayshorenetworks.com/products/scrutiny/ (accessed on 9 May 2021).
- THE INDUSTRIAL CYBERSECURITY COMPANY. Available online: https://www.claroty.com/ (accessed on 21 March 2021).
- The Leader in OT & IoT Security and Visibility. Available online: https://www.nozominetworks.com/?gclid=EAIaIQobChMIoa2B3oHI8AIVgyRgCh0vDQPTEAAYASAAEgKTFPD_BwE (accessed on 18 June 2021).
- CyberX. Available online: https://cyberx-labs.com/ (accessed on 24 March 2021).
- Park, Y.; Teiken, W.; Rao, J.R.; Chari, S.N. Data classification and sensitivity estimation for critical asset discovery. IBM J. Res. Dev. 2016, 60, 2:1–2:12. [Google Scholar] [CrossRef]
- Liu, X.; Qian, C.; Hatcher, W.G.; Xu, H.; Liao, W.; Yu, W. Secure Internet of Things (IoT)-Based Smart-World Critical Infrastructures: Survey, Case Study and Research Opportunities. IEEE Access. 2019, 7, 79523–79544. [Google Scholar] [CrossRef]
- Shodan Search Engine. Available online: https://www.shodan.io/ (accessed on 18 May 2021).
- Malzahn, D.; Birnbaum, Z.; Wright-Hamor, C. Automated Vulnerability Testing via Executable Attack Graphs. In Proceedings of the International Conference on Cyber Security and Protection of Digital Services (Cyber Security), Dublin, Ireland, 15–19 June 2020; pp. 1–10. [Google Scholar] [CrossRef]
- Wang, W.; Chen, L.; Han, L.; Zhou, Z.; Xia, Z.; Chen, X. Vulnerability Assessment for ICS system Based on Zero-day Attack Graph. In Proceedings of the International Conference on Intelligent Computing, Automation and Systems (ICICAS), Chongqing, China, 11–13 December 2020; pp. 1–5. [Google Scholar] [CrossRef]
- Qualys, Inc. Qualys Community Edition. Available online: https://www.qualys.com/community-edition/ (accessed on 9 May 2021).
- Zhou, C.; Li, X.; Yang, S.; Tian, Y. Risk-Based Scheduling of Security Tasks in Industrial Control Systems with Consideration of Safety. IEEE Trans. Ind. Inform. 2020, 16, 3112–3123. [Google Scholar] [CrossRef] [Green Version]
- McLaughlin, S.; Konstantinou, C.; Wang, X.; Davi, L.; Sadeghi, A.R.; Maniatakos, M.; Karri, R. The Cybersecurity Landscape in Industrial Control Systems. Proc. IEEE 2016, 104, 1039–1057. [Google Scholar] [CrossRef]
- Alhasawi, S. ICSrank: A Security Assessment Framework for Industrial Control Systems (ICS). August 2020. Available online: http://researchonline.ljmu.ac.uk/id/eprint/13480/1/2020AlhasawiPhD.pdf (accessed on 11 April 2021).
- West, J.; Hale, J.; Papa, M.; Hawrylak, P. Automatic Identification of Critical Digital Assets. In Proceedings of the International Conference on Data Intelligence and Security (ICDIS), South Padre Island, TX, USA, 28–30 June 2019; pp. 219–224. [Google Scholar] [CrossRef]
- Hart, P.M. Continuous Asset Monitoring on the Smart Grid. In Proceedings of the IEEE PES Innovative Smart Grid Technologies, ISGT Asia Conference: Smarter Grid for Sustainable and Affordable Energy Future, Perth, WA, Australia, 13–16 November 2011. [Google Scholar] [CrossRef]
- Farzan, F.; Jafari, M.A.; Wei, D.; Lu, Y. Cyber-Related Risk Assessment and Critical Asset Identification in Power Grids. ISGT Conf. 2014, 2014, 14319525. [Google Scholar] [CrossRef]
- Abdulrazzaq, M.; Wei, Y. Industrial Control System (ICS) Network Asset Identification and Risk Management. 2018. Available online: https://www.aveva.com/content/dam/aveva/documents/support/customer-first/ServicesProfile_AVEVA_ICSSecurityAndRiskAssessments_09-19.pdf (accessed on 26 April 2021).
- Ranking Critical Assets. Available online: http://www.thesecurityminute.com/ranking-critical-assets (accessed on 26 March 2021).
- Boyer, B. Identification and Ranking of Critical Assets within an Electrical Grid under Threat of Cyber Attack; Rutgers The State University of New Jersey-New Brunswick: New Brunswick, NJ, Canada, 2011; Available online: https://rucore.libraries.rutgers.edu/rutgers-lib/33591/PDF/1/play/ (accessed on 4 May 2021).
- Wedgbury, A.; Jones, K. Automated Asset Discovery in Industrial Control Systems—Exploring the Problem. In Proceedings of the 3rd International Symposium for ICS & SCADA Cyber Security Research (ICS-CSR’15), Ingolstadt, Germany, 17–18 September 2015. [Google Scholar] [CrossRef] [Green Version]
- Liu, C.; Huang, G.; Zhang, K.; Wen, F.; Salam, M.A.; Ang, S.P. Asset Management in Power Systems. In Proceedings of the 10th International Conference on Advances in Power System Control, Operation & Management (APSCOM 2015), Hong Kong, China, 8–12 November 2015; pp. 1–5. [Google Scholar] [CrossRef]
- Beyza, J.; Garcia-Paricio, E.; Yusta, J.M. Ranking Critical Assets in Interdependent Energy Transmission Networks. Electr. Power Syst. Res. 2019, 172, 242–252. [Google Scholar] [CrossRef]
- Bhandari, H.N.; Vittal, V.; Heydt, G.T.; Quintanilla, F.L.; Knuth, W.B. Ranking of Bulk Transmission Assets for Maintenance Decisions. In Proceedings of the 51st North Am. Power Symp. NAPS 2019, Wichita, KS, USA, 13–15 October 2019. [Google Scholar] [CrossRef] [Green Version]


| Tool Name | Company | Pros | Cons |
|---|---|---|---|
| Tenable.OT [13] | Tenable | Complete visibility of assets and prioritised risk-based insights into vulnerabilities. | Unable to sort critical assets. |
| Axonius [14] | Axonius | Identify unmanaged devices and identify assets automatically. | Unable to show vulnerability level. |
| Scrutiny [15] | Bayshore networks | Have asset summary report and show network connections | Unable to show information of vulnerability |
| Claroty [16] | Claroty | Continuous threat detection and visibility of the asset management and show critical assets | Unable to rank risk assets. |
| Nozomi network [17] | Nozomi | Show information of all assets in the network and send you alerts when changes to hardware, software and devices occur | Unable to rank risk assets. |
| CyberX [18] | CyberX | Network topology diagram and information of assets and vulnerability management | Unable to rank risk assets. |
| AT&T security [19] | AT&T Business | Able to rank critical assets and vulnerability | - |
| Liu et al. [20] | Applied Risk | Show information of all assets in the network | Unable to rank risk assets |
| Shodan [21] | Shodan | Show information of all assets in the network | Unable to rank risk assets and unable to show information of vulnerability |
| Tool Name | Company | Pros | Cons |
|---|---|---|---|
| Nessus [22] | Tenable | Fast scanning speed and high accuracy, and comprehensive vulnerability base | May causes DoS on SCADA system |
| Tenable.OT [13] | Tenable | Complete visibility of assets and prioritised risk-based insights into vulnerabilities. | Mostly focused on asset discovery and weak vulnerability |
| Nmap [23] | Nmap | Open source and comprehensive vulnerability base | May threaten the operation of the ICS/SCADA system. |
| Qualys Community Edition [24] | Qualys | The vulnerability library is powerful, and the interface is highly visible | Does not rank vulnerability |
| Wang et al. [23] | Rapid7 | Get a real-time view of risk and let people know which vulnerability is more important to focus on. | Weak vulnerability scanning capabilities |
| Zhou et al. [25] | Verve | Tech-enabled vulnerability assessment and real-time reporting | Does not rank vulnerability |
| Author | Title | Pros | Cons | Gap |
|---|---|---|---|---|
| McLaughlin et al. [26] | The Cybersecurity Landscape in Industrial Control Systems | Rich basic knowledge introduction, a variety of detailed vulnerability scanning methods, clear steps. | Not much introduction about asset discovery. | No method for critical asset ranking. |
| Sulaiman [27] | ICSrank: A Security Assessment Framework for ICS | Rich basic knowledge introduction and clear data about ranking critical assets. | Not much information about vulnerability scanning. | - |
| West et al. [28] | Automatic Identification of Critical Digital Assets | Rich data of the way about the identification of the critical asset. | Not much information about vulnerability scanning. | No method for critical asset ranking. |
| Hart [29] | Continuous Asset Monitoring on the Smart Grid | Use continuous monitoring methods to discover key infrastructure equipment dynamically. | Not much information about vulnerability scanning. | No method for critical asset ranking. |
| Farzan et al. [30] | Cyber-related Risk Assessment and Critical Asset Identification in Power Grids | A variety of detailed vulnerability scanning methods and asset discovery, rich basic knowledge introduction, clear steps. | No method for critical asset ranking. | No method for critical asset ranking. |
| Abdulrazzaq et al. [31] | Industrial Control System (ICS) Network Asset Identification and Risk Management | Rich basic knowledge introduction about the critical asset and asset discovery. | No method about critical asset ranking and not much text about vulnerability scanning. | No method for critical asset ranking. |
| Audrey [32] | Ranking Critical Assets | The process of ranking critical assets is described in detail. | No information about asset discovery and no text about vulnerability scanning. | - |
| Boyer [33] | Identification and ranking of Critical Assets within an Electrical Gridunder Threat of Cyber Attack | Very detailed case analysis content. | Not much information about vulnerability scanning. | No method for critical asset ranking. |
| Adam et al. [34] | Automated Asset Discovery in Industrial Control Systems—Exploring the Problem | Rich basic knowledge introduction about the critical asset and asset discovery. | No method about critical asset ranking and not much text about vulnerability scanning. | No method for critical asset ranking. |
| Author | Approach | Context and Scoop |
|---|---|---|
| Proposed Method | Counting the number of connections each asset holds inside the cyber–physical smart grid to determine the most critical assets. | The proposed methodology was used with ICS assets and focused on cybersecurity threats targeting this system. |
| Beyza et al. [36] | A complex network theory to identify and rank critical assets in interdependent natural gas and electricity networks. | The proposed methodology focused on the physical level of the cyber–physical system and quantifying the performance under cascading failures. |
| Bhandari et.al [37] | A methodology for ranking bulk transmission assets for maintenance by quantifying the impact when a failure occurs. | The main context is on transmission lines that fall inside the same grid, and it focused on component failures and the operational health of the transmission assets. |
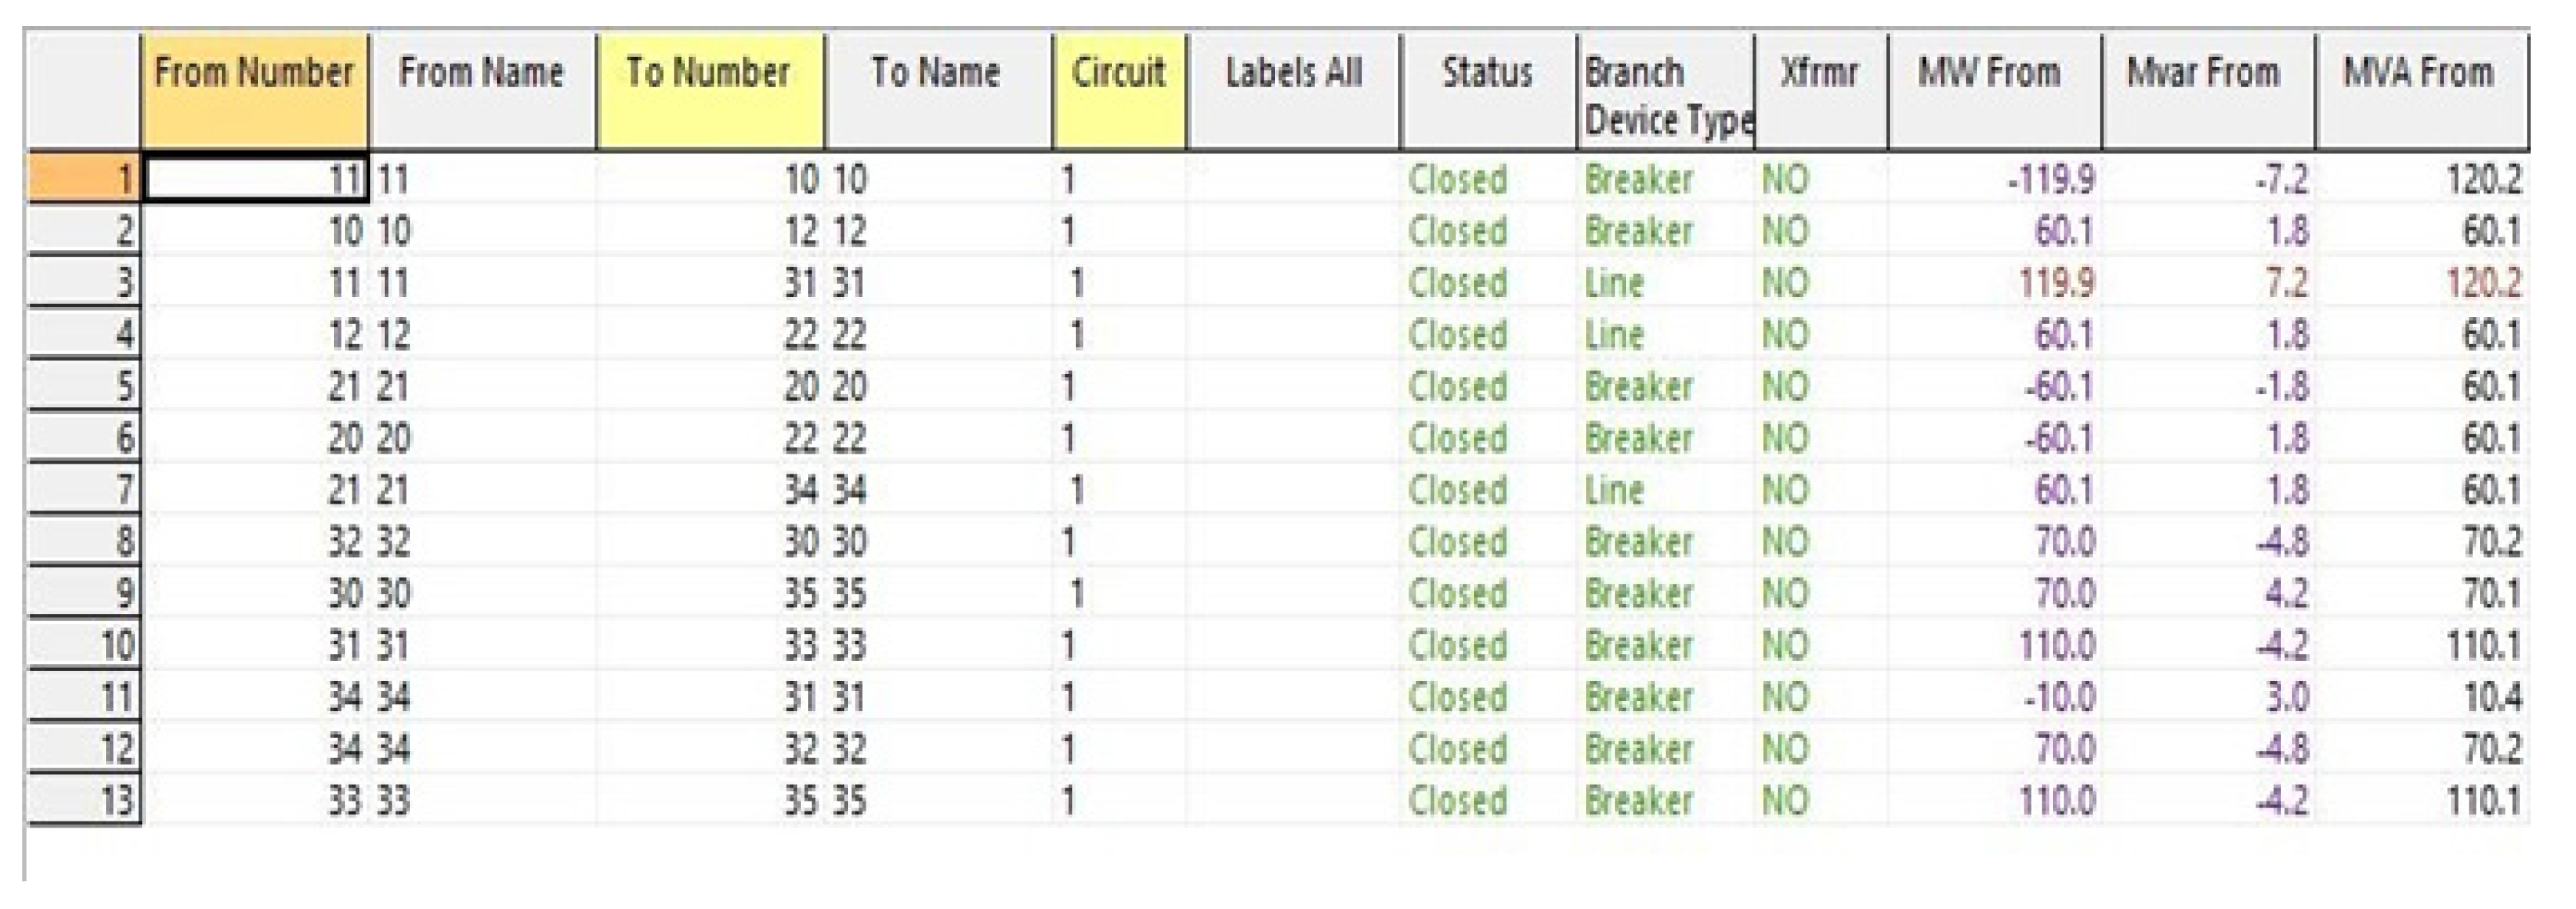
| Parameter | Description |
|---|---|
| From Number, Name: | Represents the source bus of the power flow movement to the destination. |
| To Number, Name | Represents the destination bus for the power flow movement |
| Statutes: | The service status of the branch. |
| Circuit: | Used to differentiate between multiple lines linking the same two buses. |
| Brush/Device Type: | Represents the identifier for the type of branch. |
| Xfrmr: | Used to indicate if the branch is a transformer or transmission line. |
| MW: | Real power flowing into the line at the source bus. |
| Mvar: | Reactive power flowing into the line at the source bus. |
Publisher’s Note: MDPI stays neutral with regard to jurisdictional claims in published maps and institutional affiliations. |
© 2021 by the authors. Licensee MDPI, Basel, Switzerland. This article is an open access article distributed under the terms and conditions of the Creative Commons Attribution (CC BY) license (https://creativecommons.org/licenses/by/4.0/).
Share and Cite
Liu, C.; Alrowaili, Y.; Saxena, N.; Konstantinou, C. Cyber Risks to Critical Smart Grid Assets of Industrial Control Systems. Energies 2021, 14, 5501. https://doi.org/10.3390/en14175501
Liu C, Alrowaili Y, Saxena N, Konstantinou C. Cyber Risks to Critical Smart Grid Assets of Industrial Control Systems. Energies. 2021; 14(17):5501. https://doi.org/10.3390/en14175501
Chicago/Turabian StyleLiu, Chenyang, Yazeed Alrowaili, Neetesh Saxena, and Charalambos Konstantinou. 2021. "Cyber Risks to Critical Smart Grid Assets of Industrial Control Systems" Energies 14, no. 17: 5501. https://doi.org/10.3390/en14175501
APA StyleLiu, C., Alrowaili, Y., Saxena, N., & Konstantinou, C. (2021). Cyber Risks to Critical Smart Grid Assets of Industrial Control Systems. Energies, 14(17), 5501. https://doi.org/10.3390/en14175501