Article

Effect of Biodiesel Blends on the Transient Performance of Compression Ignition Engines

School of Computing and Engineering, University of Huddersfield, Queensgate, Huddersfield HD1 3DH, UK
*
Author to whom correspondence should be addressed.
Energies 2021, 14(17), 5416; https://doi.org/10.3390/en14175416
Submission received: 23 July 2021 / Revised: 18 August 2021 / Accepted: 26 August 2021 / Published: 31 August 2021

Abstract

:
Prior to full electric conversion, internal combustion engines will still maintain a paramount position in heavy goods and earth-moving vehicles. The most promising, cleaner alternative to fossil fuels is biodiesel. While it does not require alterations in the engine design, hence no major overhaul of existing infrastructure, biodiesel is more sustainable and clean-burning than petro-diesel. Extensive research has been reported on the effect of biodiesel blends, on the operational characteristics of compression ignition (CI) engines as well as the emissions behaviour of such engines. The performance characteristics of CI engines under transient operational conditions with Biodiesel blends has had limited attention so far from researchers. In the present work, transient performance characteristics of a CI engine has been evaluated for various biodiesel blends and its effects on performance behaviour have been quantified. In addition, emission footprints of CI engines under various transient operational conditions have also been enumerated.

Graphical Abstract

1. Introduction

Biodiesel blends are becoming increasingly popular as an alternative to conventional fossil fuels to supplement increasing worldwide energy demand [1]. This is because of their adaptability of usage within conventional engines and sustainability when compared to fossil fuels [2]. It has been widely reported that biodiesel and diesel fuels have very similar thermodynamic properties even though there are differences in physical properties such as viscosity, density and the bulk modulus [3,4,5]. These physical properties massively influence factors such as injection pressure and fuel pump performance. Other factors that are affected include fuel-air characteristics and injection rate. The biodiesel physical properties also influence the emissions and performance of the engine. Few works have been carried out on the effects of biodiesel fuels’ physical properties on the fuel pump performance characteristics, fuel injection operation and mixing behaviour of the air/oil mixture [6,7,8,9,10,11]. The influence of viscosity of the fuel-on-fuel pump performance characteristics was investigated by Bannikov et al. [12] by testing sunflower oils and biodiesel blends. They found that the engine operated with viscous blends did not achieve its rated power. It is evident from the discussion that although various biodiesel blends can be used with conventional engines there may be variations in operational characteristics and emission behaviour because of subtle differences in the way biodiesel blends interact with the engine system as well as in the combustion mechanism.
Many authors in the past have conducted studies to determine the performance of CI engines using with various Biodiesel blends. Some have carried out work on the type of biodiesel and the effect of nanoparticle additives. Soudagar et al. [13] evaluated the performance and emission behaviour of a modified direct injection diesel engine fuelled with biodiesel made from the castor oil plant (Ricinus communis), which is an 80% diesel blend and their blends with strontium-zinc oxide (Sr@ZnO) nanoparticle additives. They reported only a small increase in NOx emissions for all the nano-blended fuels studied. Khan et al. [14] reported a study that used a blend of biodiesel made from the Fennel flower plant, diesel, n-butanol, and graphene oxide nanoparticles. This was to improve the combustion characteristics and decrease the emissions from a toroidal-type direct injection diesel engine. The authors found that 90 ppm of graphene oxide nanoparticles and 10% n-butanol in Fennel flower biodiesel gives similar performance levels as diesel fuel. Furthermore, they reported that the nano-particle-impregnated fuel blend enhanced the brake thermal efficiency and reduced the brake-specific fuel consumption of the engine.
Other investigators have reported that engines running with blends of biodiesel result in improvements in injection timing. Furthermore, the onset of combustion is enhanced as the blends’ biodiesel content rises [15,16,17]. Lately, Gumus [17] presented a study detailing the burning and heat emancipation properties of biodiesel used in an engine using direct-injection compression ignition. Experiments were performed for different biodiesel blends such that pressure measurements within the combustion cylinder were carried out. Using this information, the duration of combustion, cumulative heat release rate amongst other parameters were computed. They concluded that biodiesel combustion characteristics did not significantly deviate from those of diesel in the engine tested. Nevertheless, as the amount of biodiesel in the blend rises, it was observed that shorter ignition delays occurred as well as and shorter premixed stage durations [18,19,20,21,22]. We note that studies on combustion characteristics of biodiesel blends are inconsistent as there is a lack of systematic investigation to quantify the interrelationship between biodiesel’s physical and combustion characteristics. More work is required to understand the combustion process so that the performance and emission characteristics of engines running with biodiesel blends are improved.
The characteristics of CI engines using various blends of biodiesel in steady state conditions of operation are widely given in previous works [23,24,25,26,27,28]. The key engine performance indicators with biodiesel blends have been reasonably well studied. These include brake power, specific fuel consumption, thermal efficiency, engine speed, engine load, and engine types. Conversely, there are limited published literature on systematically studying engine performance parameters with biodiesel and its blends during transient operating conditions. Indeed, most of the works present performance under steady-state operations [29,30,31,32]. Transient operation is mainly observed during urban driving conditions due to the ‘stop and go’ nature of vehicular traffic. Detailed research outcomes are also available in the literature with varying degrees of clarity on the emission characteristics of CI engines operating with biodiesel during steady-state operations. However, transient CI engine behaviour has not been widely studied. In this study, we therefore investigate the practicality of biodiesel and biodiesel blends under transient operating situations. In addition, we carry out a detailed analysis of the effect of biodiesel blending ratio, the influence of load variation and engine speed on engine emissions.

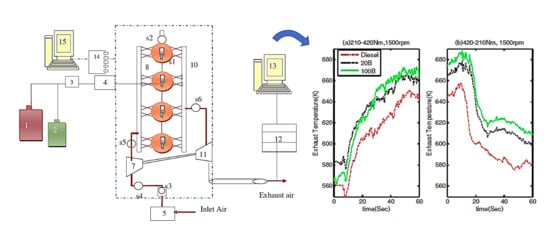
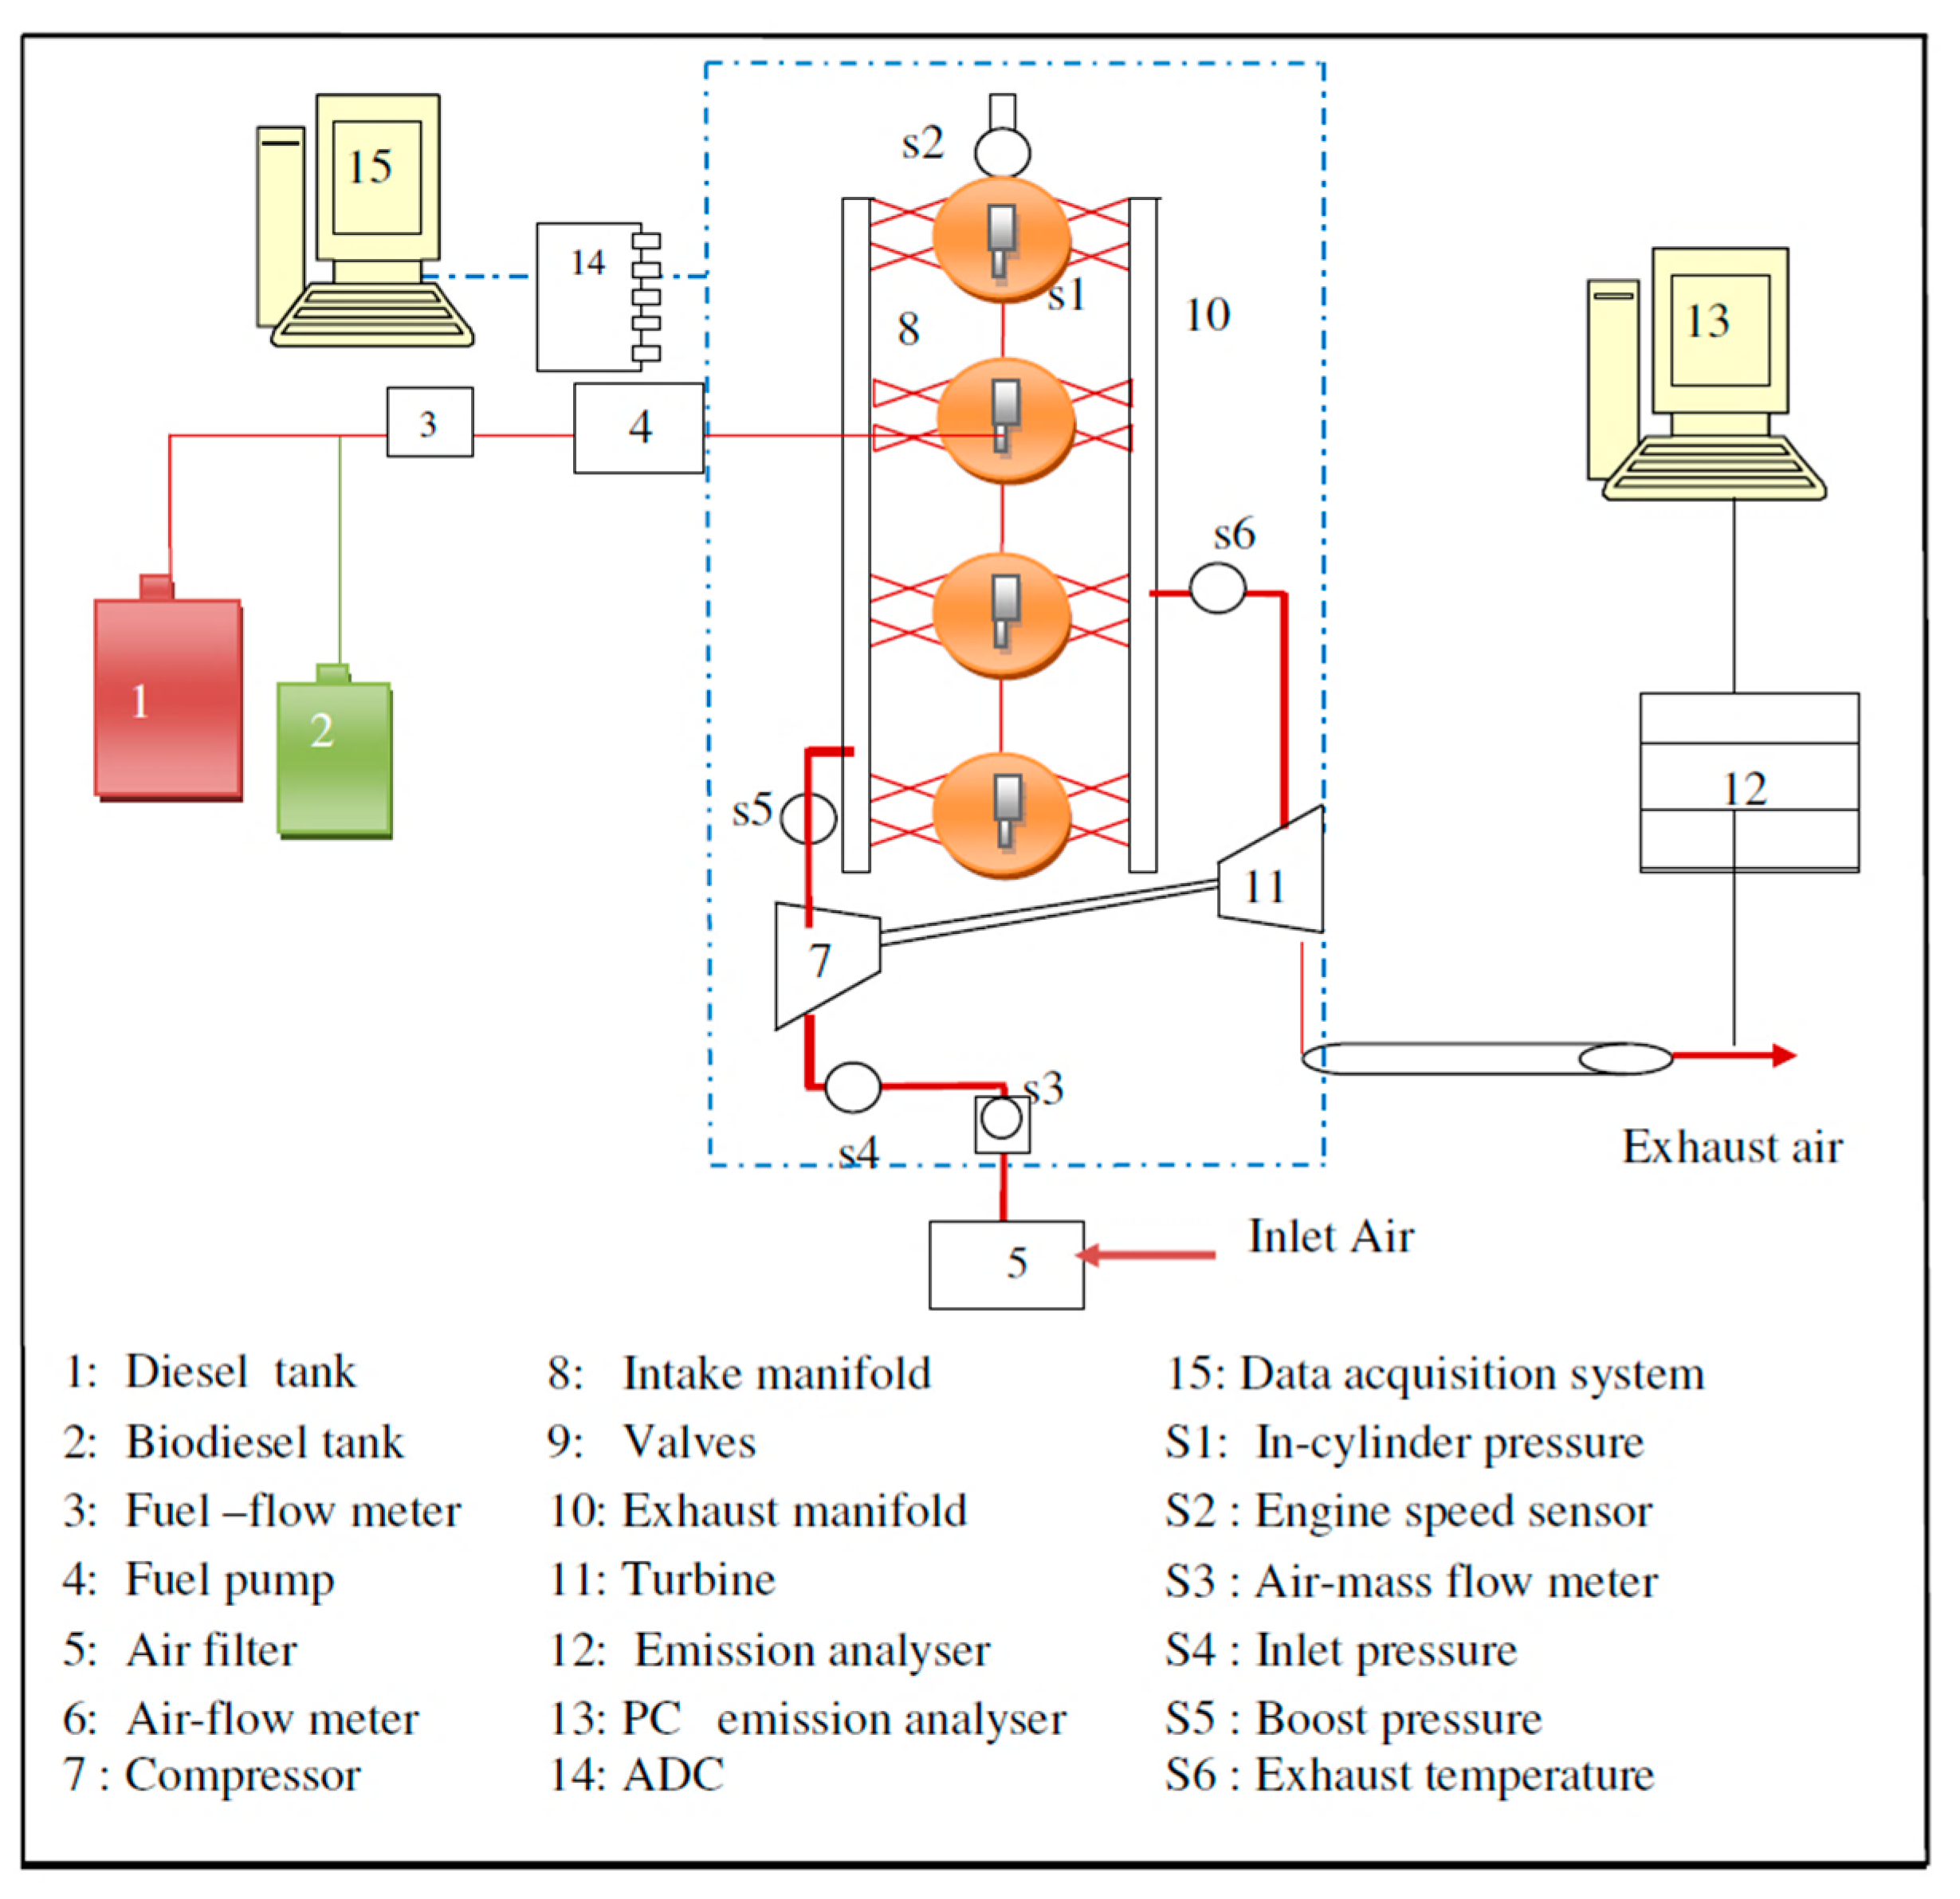
2. CI Engine and Test Bed Facilities

The tests in a CI engine were carried out within the Advanced Automotive Laboratory, at the University of Huddersfield. The facility possesses a transient testing unit which has a 200 kW AC Dynamometer. It also has a 4-Quadrant Regenerative Drive unit possessing motoring and absorbing capability. Installed are an in-line torque meter, various speed sensors, thermocouples, pressure transducers, air flow metres, and fuel flow metres. The CI engine is direct injection with four cylinders, four strokes, and is turbo-charged. The bore is 103 mm while the stroke is 132 mm, and it has 4.4 litres of engine displacement. Furthermore, the compression ratio is 18.3. The detailed characteristics of the engine are given in Table 1 while the layout of the experimental set up and associated instrumentation are depicted in Figure 1. The engine was wholly instrumented, the steady and transient cycles were programmed with the CADET software integrated with the engine.
For acquiring accurate and repeatable biodiesel engine test data for performance evaluation, state-of-the-art instrumentation was installed as shown in the figure. The main quantities measured are the combustion pressure and temperature, engine speed, load, crank angle, air and fuel flow rates and TDC position. Each signal was conditioned prior to connection to the data acquisition system, and it was necessary to amplify some to increase the resolution of low-level signals as well as differentiate from background noise. Furthermore, signal amplification enabled the highest conditioned signals’ voltage range to be equal to the highest analogue-to digital converter (ADC) input range.
To measure gaseous emissions, a gas test bench (HORIBA EXSA—15008) was used and its sample line was connected straight to the engine’s exhaust pipe which was heated to sustain a wall temperature of approximately 191.0 °C to avoid hydrocarbon condensation within the line. Additionally, the insulated line was further added to from the exhaust pipe to the analysers. All the emission analysers (i.e., for NOx, CO, CO2 and THC) were placed on one workbench, but each has a different measurement principle, as shown in Table 2.

2.1. Details of Biodiesel and Petro Diesel Fuels Used in the Investigation

For the investigations carried out, three biodiesels (made from corn oil, rapeseed oil, and waste oil) were purchased locally and used for testing and analysis. The production of biodiesel is via the transesterification of the oil with and alcohol usually methanol. Conventional petroleum diesel fuel was obtained from a local filling station and was red in appearance. The same sample was used in all tests for combustion, performance, and emissions evaluation. The red coloured diesel was selected because of the low fuel tax for it for use in off-road engines and it was then blended with diesel on a volumetric basis at 5, 10, 20, 50, 75 and 100%. A total of 6 samples were prepared for every biodiesel used. In all, 19 samples were prepared and utilised in viscosity and density characterisation tests.

2.2. Calibration of Instruments

Prior to experiments, the various sensors and instrumentation were calibrated using data acquisition software and hardware. Readings were taken to cover the required operating ranges. The gain and offset values for each individual signal were then determined. For calibrating the Kistler in-cylinder pressure transducer, a known pressure was applied to the sensor and the response voltage was measured from the charge amplifier. As the Kistler pressure transducer (Kitsler type) only generates a signal once, there was a change in pressure, during the exhaust stroke. The reference pressure used was atmospheric, and the resulting offset was automatically applied by writing it into the software used for data acquisition. A portable pressure instrument (model: Druck DP-601) was used to calibrate the pressure transducers within an uncertainty level of ±0.1%. The appropriate gain and offset values for each transducer were determined and used to calculate the pressure from the raw voltage signals acquired. An accuracy of ±0.1% was determined for the dead weight system and all emissions measurement equipment were calibrated daily before experiments were carried out according to the emission measurement procedures. The experiments were performed over a wide range of biodiesel feed sources, blend types and steady/transient test modes.

3. Results and Discussion

In this section, the results obtained from the in-depth study carried out to quantify biodiesel effects on engine’s transient performance are discussed. Synthetic speed and torque test cycles were developed for studying the effect of transients in CI engine performance as well as the engine’s emission characteristics. While the results of steady-state testing have been widely reported in the literature [33,34,35,36], transients have not been studied as much. Here, the transient behaviour of CI engines was independently investigated during acceleration and deceleration for both engine speed and torque produced. These are shown in Figure 2 and Figure 3, respectively. Figure 2a shows the profile of engine speed for a torque of 420 Nm. Prior to data collection, about 10 minutes was left for the engine to first stabilise. During transient engine tests, previous authors have reported the normal acceleration duration to be in the range of 1–10 s [16]. The steady and transient duration used in the current tests are 17 and 8 s, respectively. Ultimately, the engine was run at 1500 rpm for 35 s under steady-state conditions. The deceleration of the CI engine operation is shown in Figure 2b. In summary, the engine was run steadily for 17 s, then decelerated for 8 s and then run for another 35 s under steady-state conditions.
A shorter steady pre-transient engine operation was used than the steady post-transient conditions. The reason for doing this was to investigate the effects of transient operation on the subsequent steady state operation. Figure 2c,d show the positive and negative torque transition profiles at an engine speed of 1500 rpm. The engine was operated for a time period of 17 s in steady state operation conditions. It was afterwards run for 8 s in transition mode while the torque changed from 210 Nm to 420 Nm. Ultimately, the engine was run at 420 Nm for 35 s. This is shown in Figure 2c. Correspondingly, Figure 2d shows the negative torque transition of the engine. In the negative torque transition case, the time segment and torque values have similarities with the positive torque transition condition.

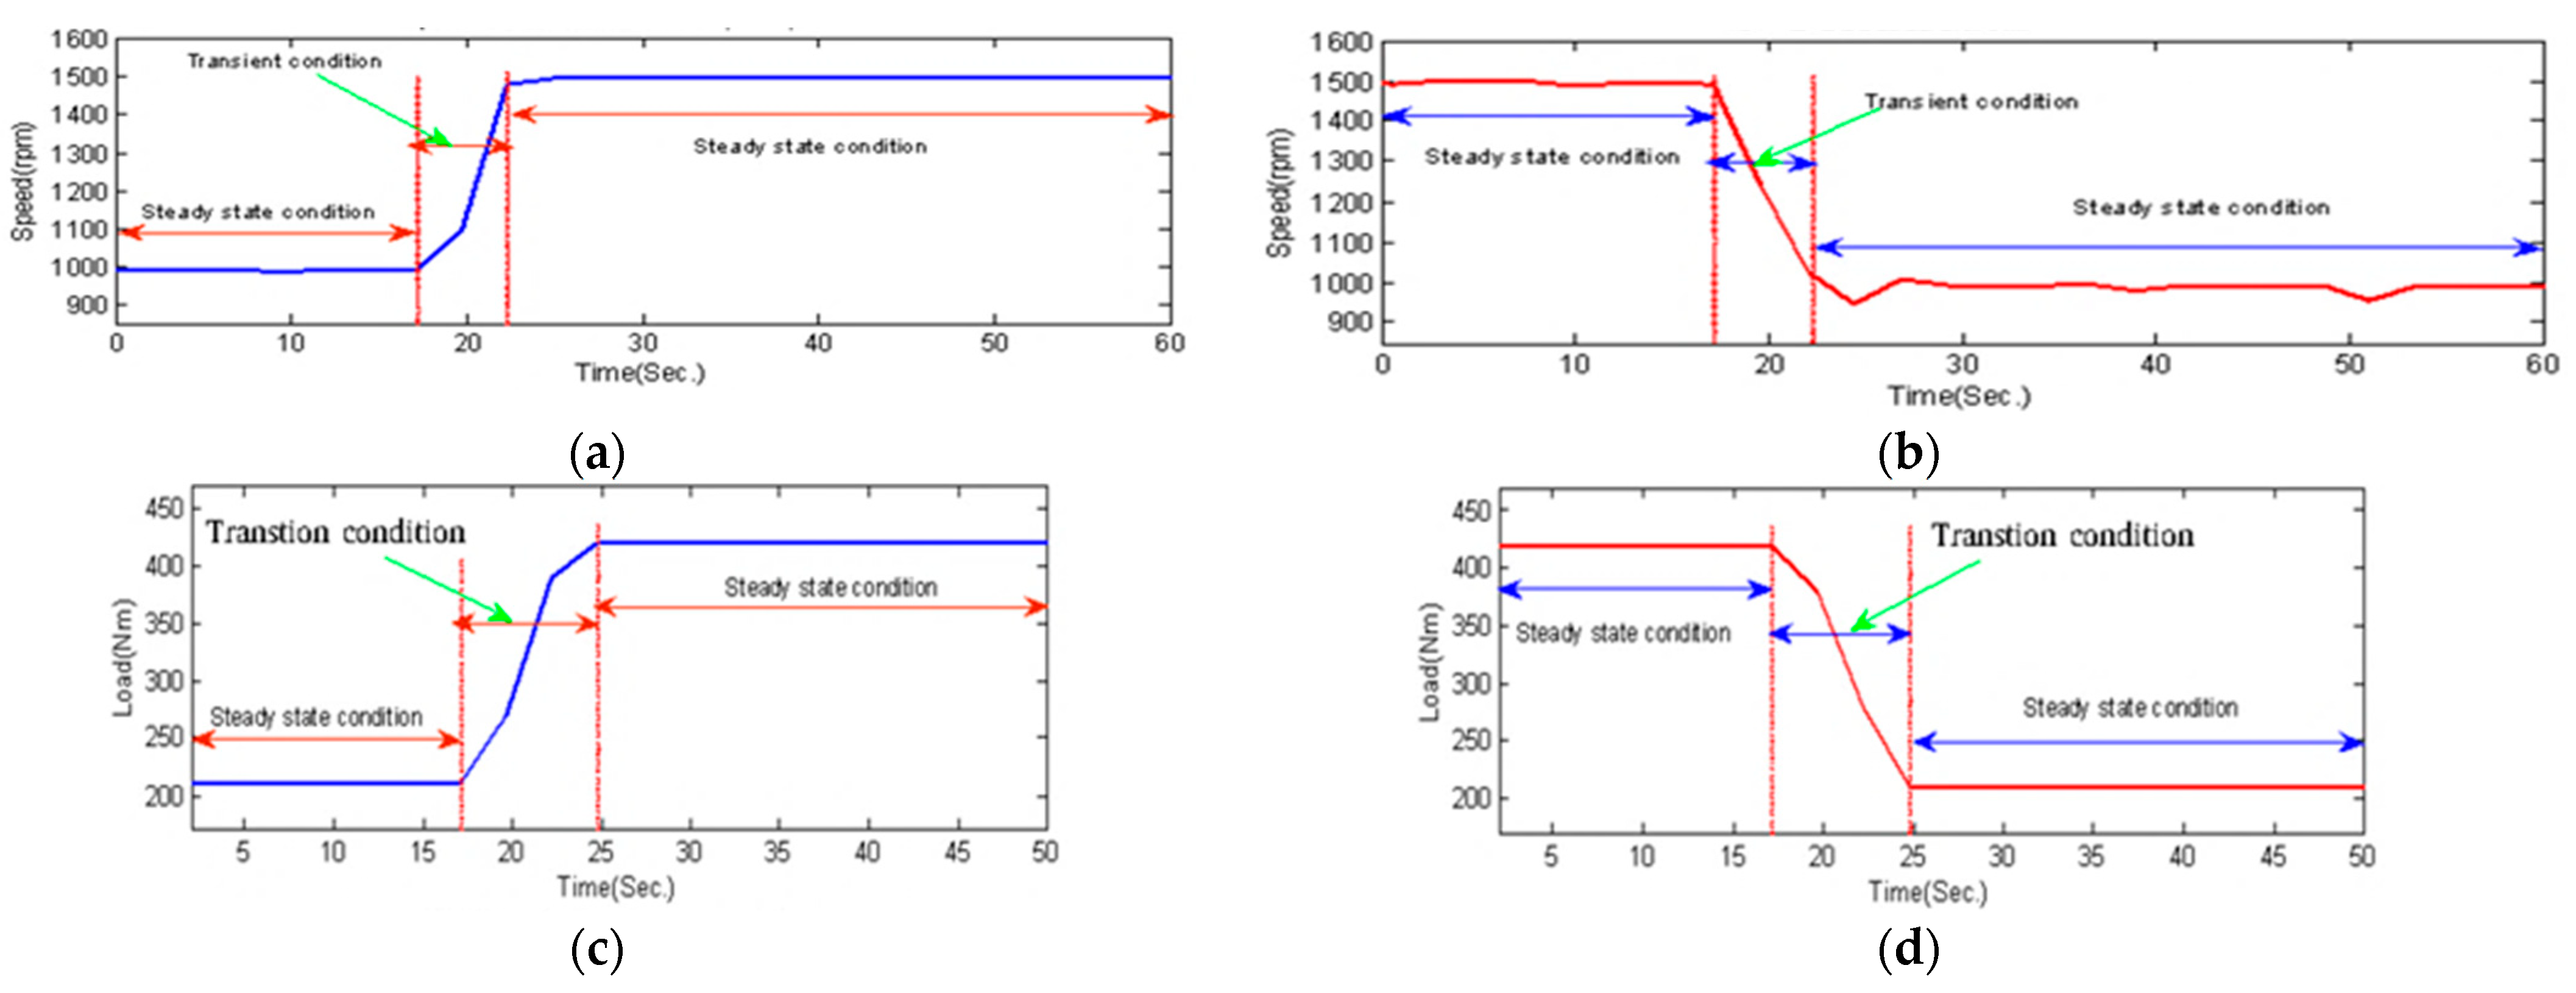
3.1. Performance Characteristics during Transient Operation

The rate of fuel consumption, the temperature of the engine exhaust and pressure in the cylinders were investigated for understanding the influence of biodiesel blends on the performance of CI engine performance during transient operation. Since the rate of fuel consumption is more sensitive than the break specific fuel consumption (BSFC), the former was chosen to examine the effect of blend on engine performance. The exhaust gas temperature exhibited a high sensitivity to dynamic phenomena and ease in its measurement. As such, it is usually used for diagnosing combustion performance of the fuel and for monitoring combustion anomalies [19,20], in the design and operation of exhaust gas recirculation (EGR) [19], as well as for prediction using emission models [22]. Additionally, to obtain detailed information about the combustion process, the in-cylinder pressure values were also monitored.

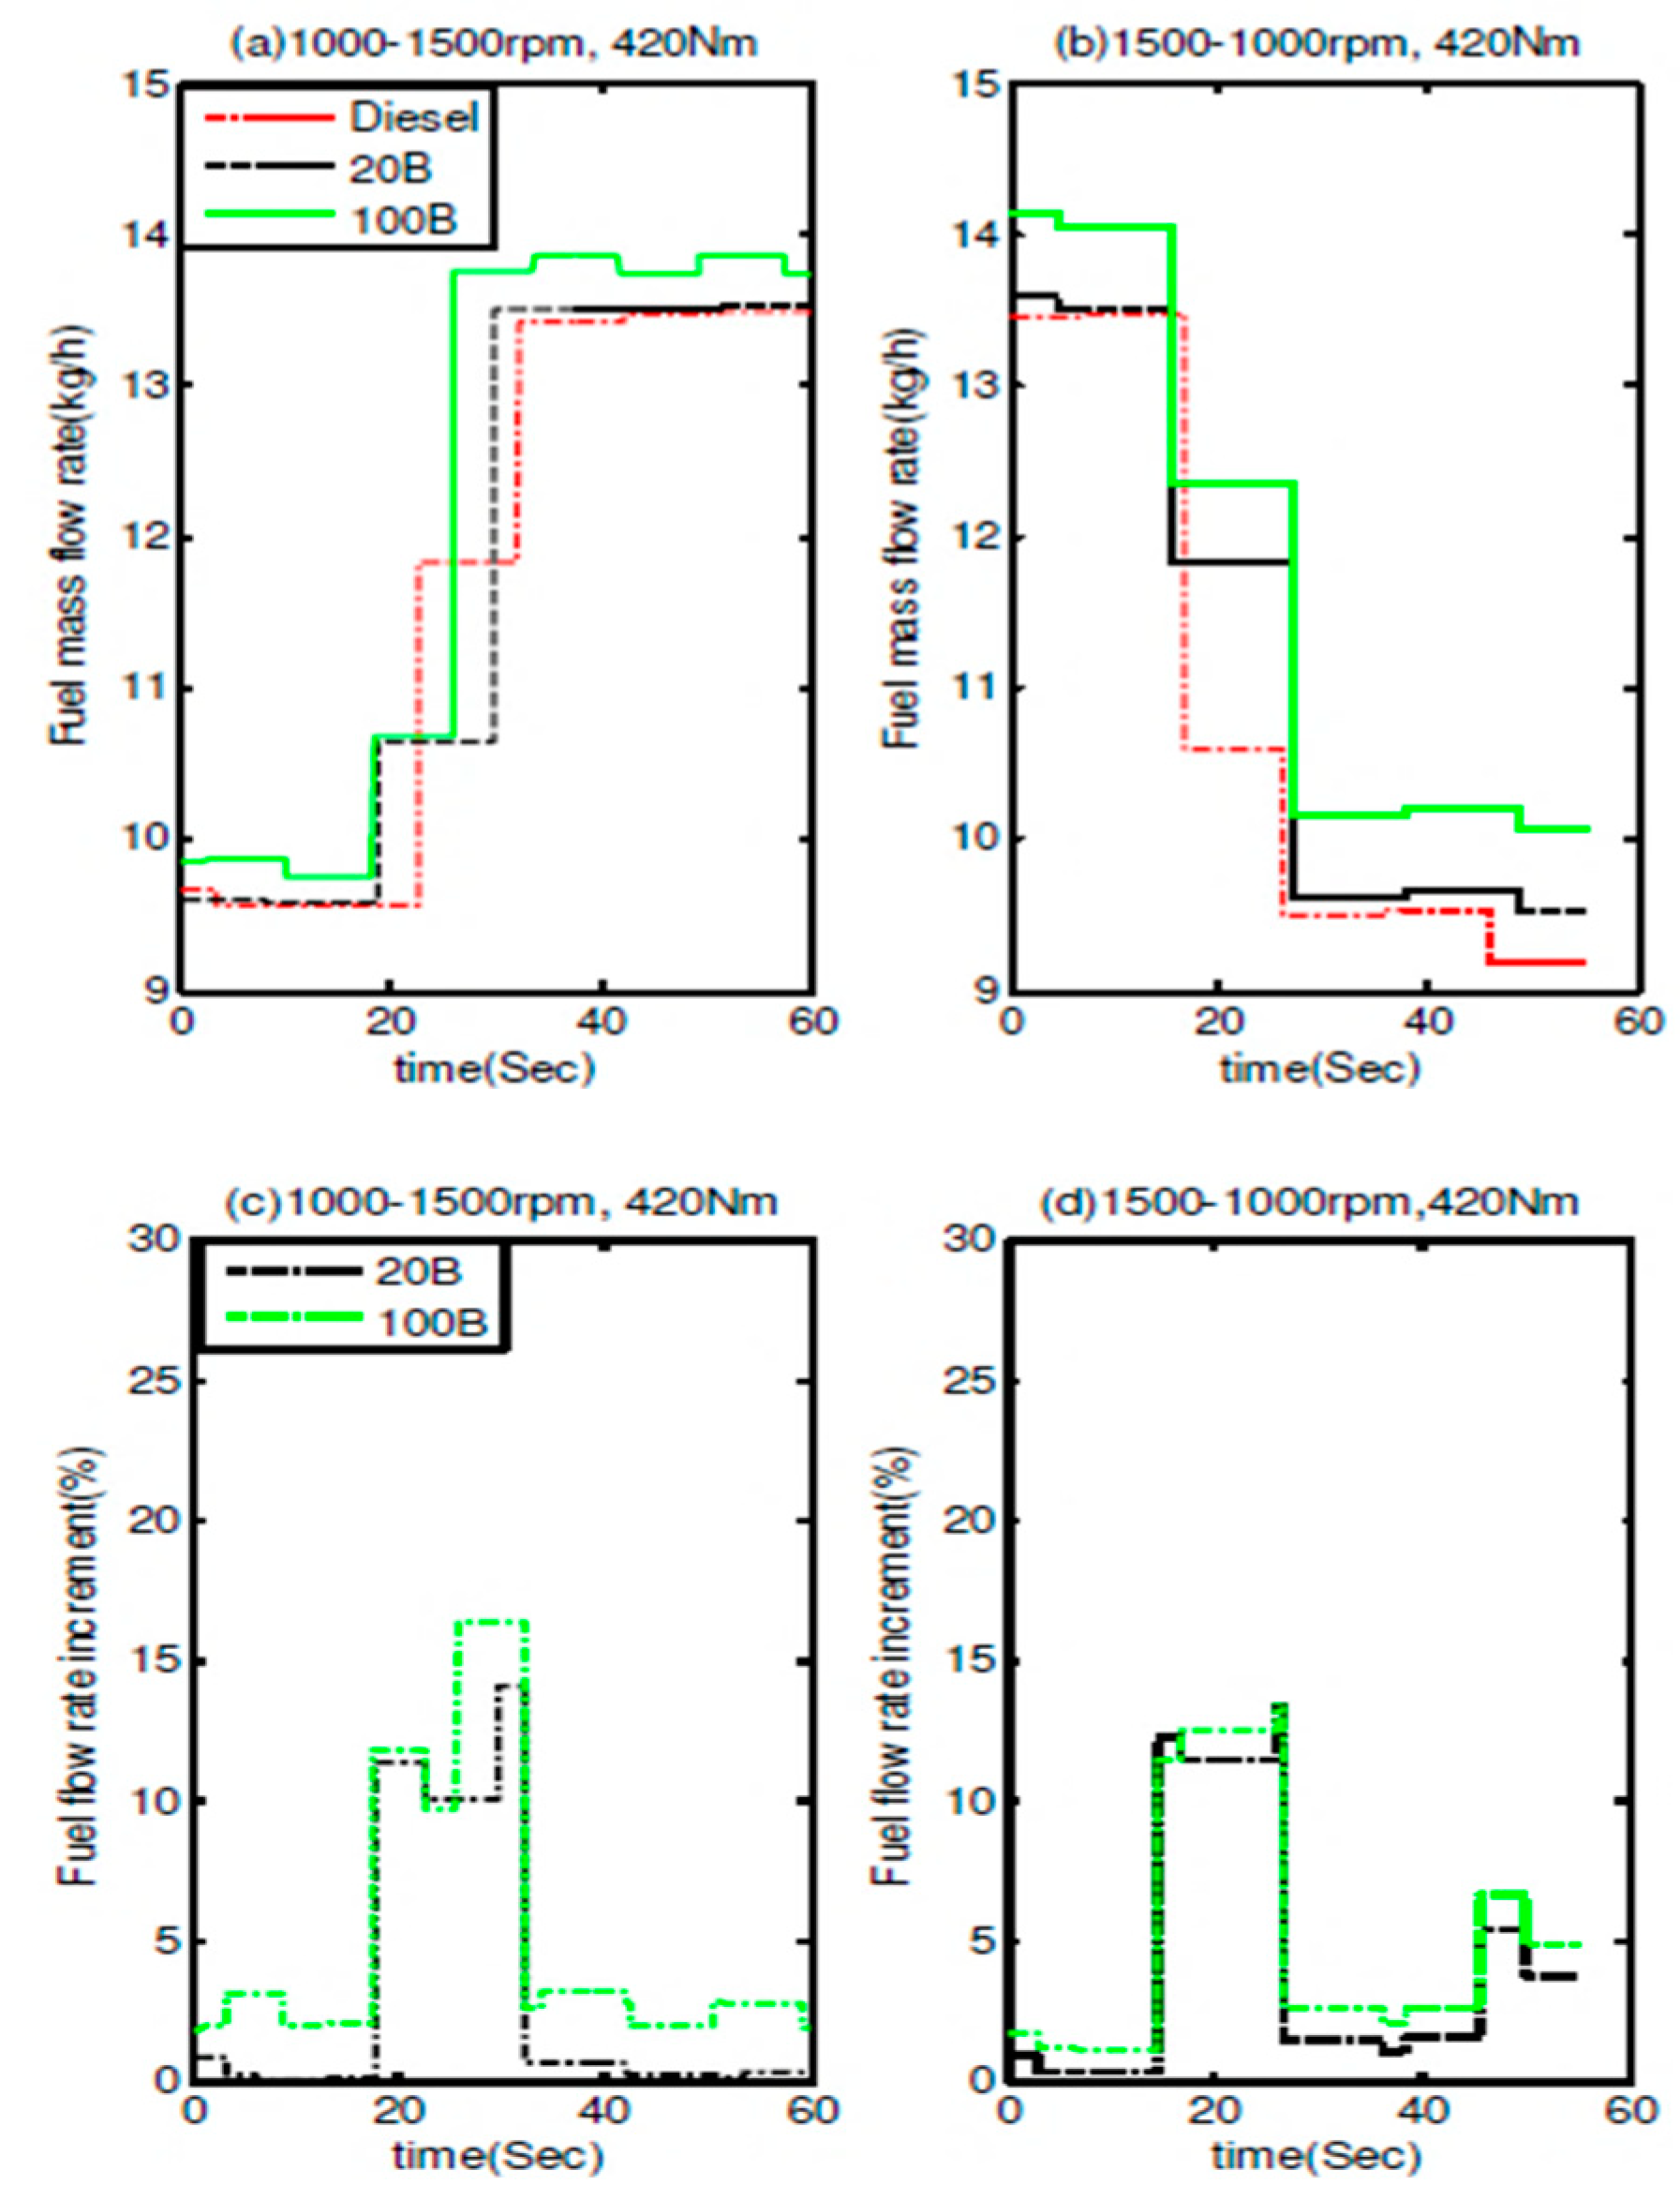
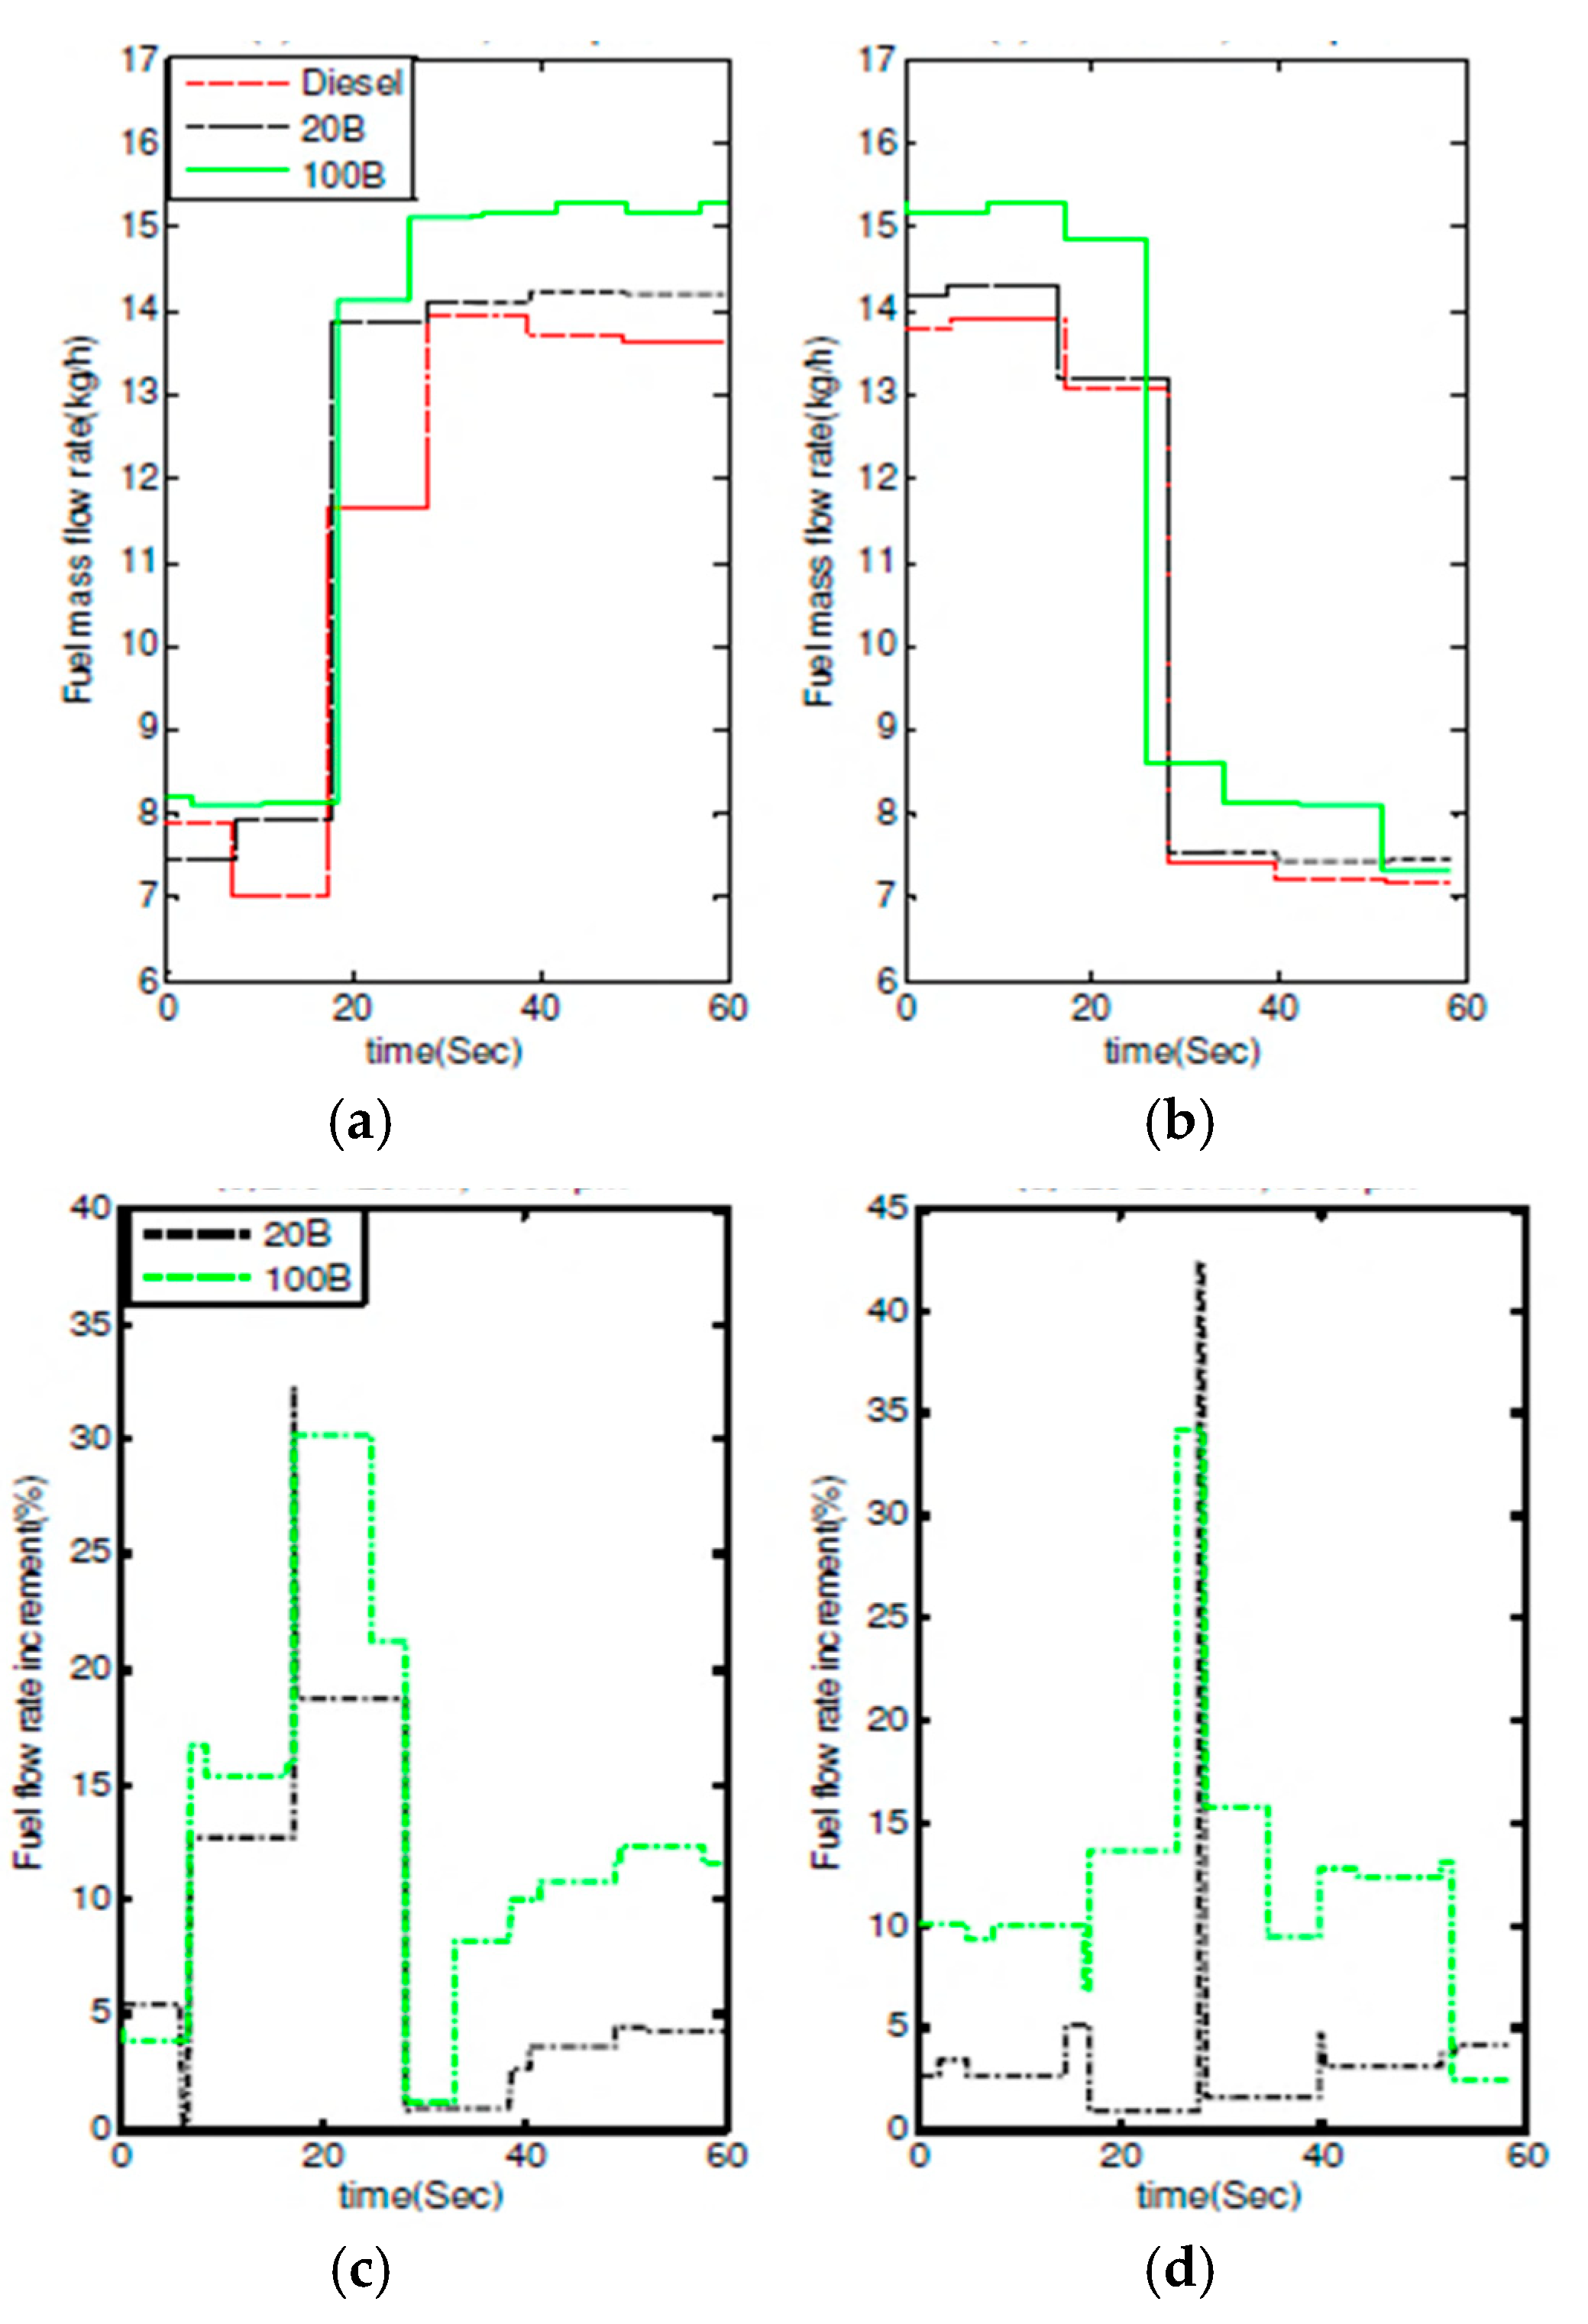
3.1.1. Fuel Consumption Rate

The fuel flow rate was quantified using the fuel measurement instrumentation (FMS-1000, which measures on a gravimetric basis). Figure 3 depicts the biodiesel fuel flow rate under a speed transient of 1000–1500 rpm and 1500–1000 rpm at 420 Nm load. The rate of fuel flow rises by 35% on accelerating from 1000 to 1500 rpm. Conversely, the rate of fuel flow decreases by 32.9% on decelerating the engine from 1500 to 1000 rpm. The fuel flow rate increase with acceleration is because as the engine speed is increased, the rate of charging the cylinder increases, and as a result, there is an increase in the rate of fuel flow [23,24].
Additionally, while accelerating, the horsepower due to friction increases due to a decrease in efficiency for maintaining a constant torque output. This leads to a rise in the rate of fuel consumption [23]. In Figure 3c,d it is shown that the fuel consumption of the engine operating with 100B is higher than the efficiency of diesel by 16% while accelerating and is 14% higher during the deceleration transient operation. This occurred because of the influence of the lower biodiesel heating value. This lower value is less than that of conventional diesel by approximately 12%. In the past, investigators [26,27,28,29,30,31,32] have also reported similar fuel consumption trends based on discrete engine speed tests.
Figure 4 shows the influence of operating at torque transient conditions on the rate of diesel fuel consumption along with two blends 20B and 100B. The fuel consumption rises by 31% while the torque transition increased from 210 to 420 Nm (i.e., positive torque transition) running at 1500 rpm. Correspondingly, the fuel consumption is reduced by 34% as the torque decreases from 420 to 210 Nm (i.e., negative torque transition). This is because of an increase in the fuel injection required to reach the higher total energy output for a certain engine speed. It can be seen in Figure 4c,d that comparing the diesel and biodiesel blends’ consumption rates in the CI engine resulted in higher fuel consumption by the latter rate by 17% and 15% for the positive and negative torque transitions, respectively.

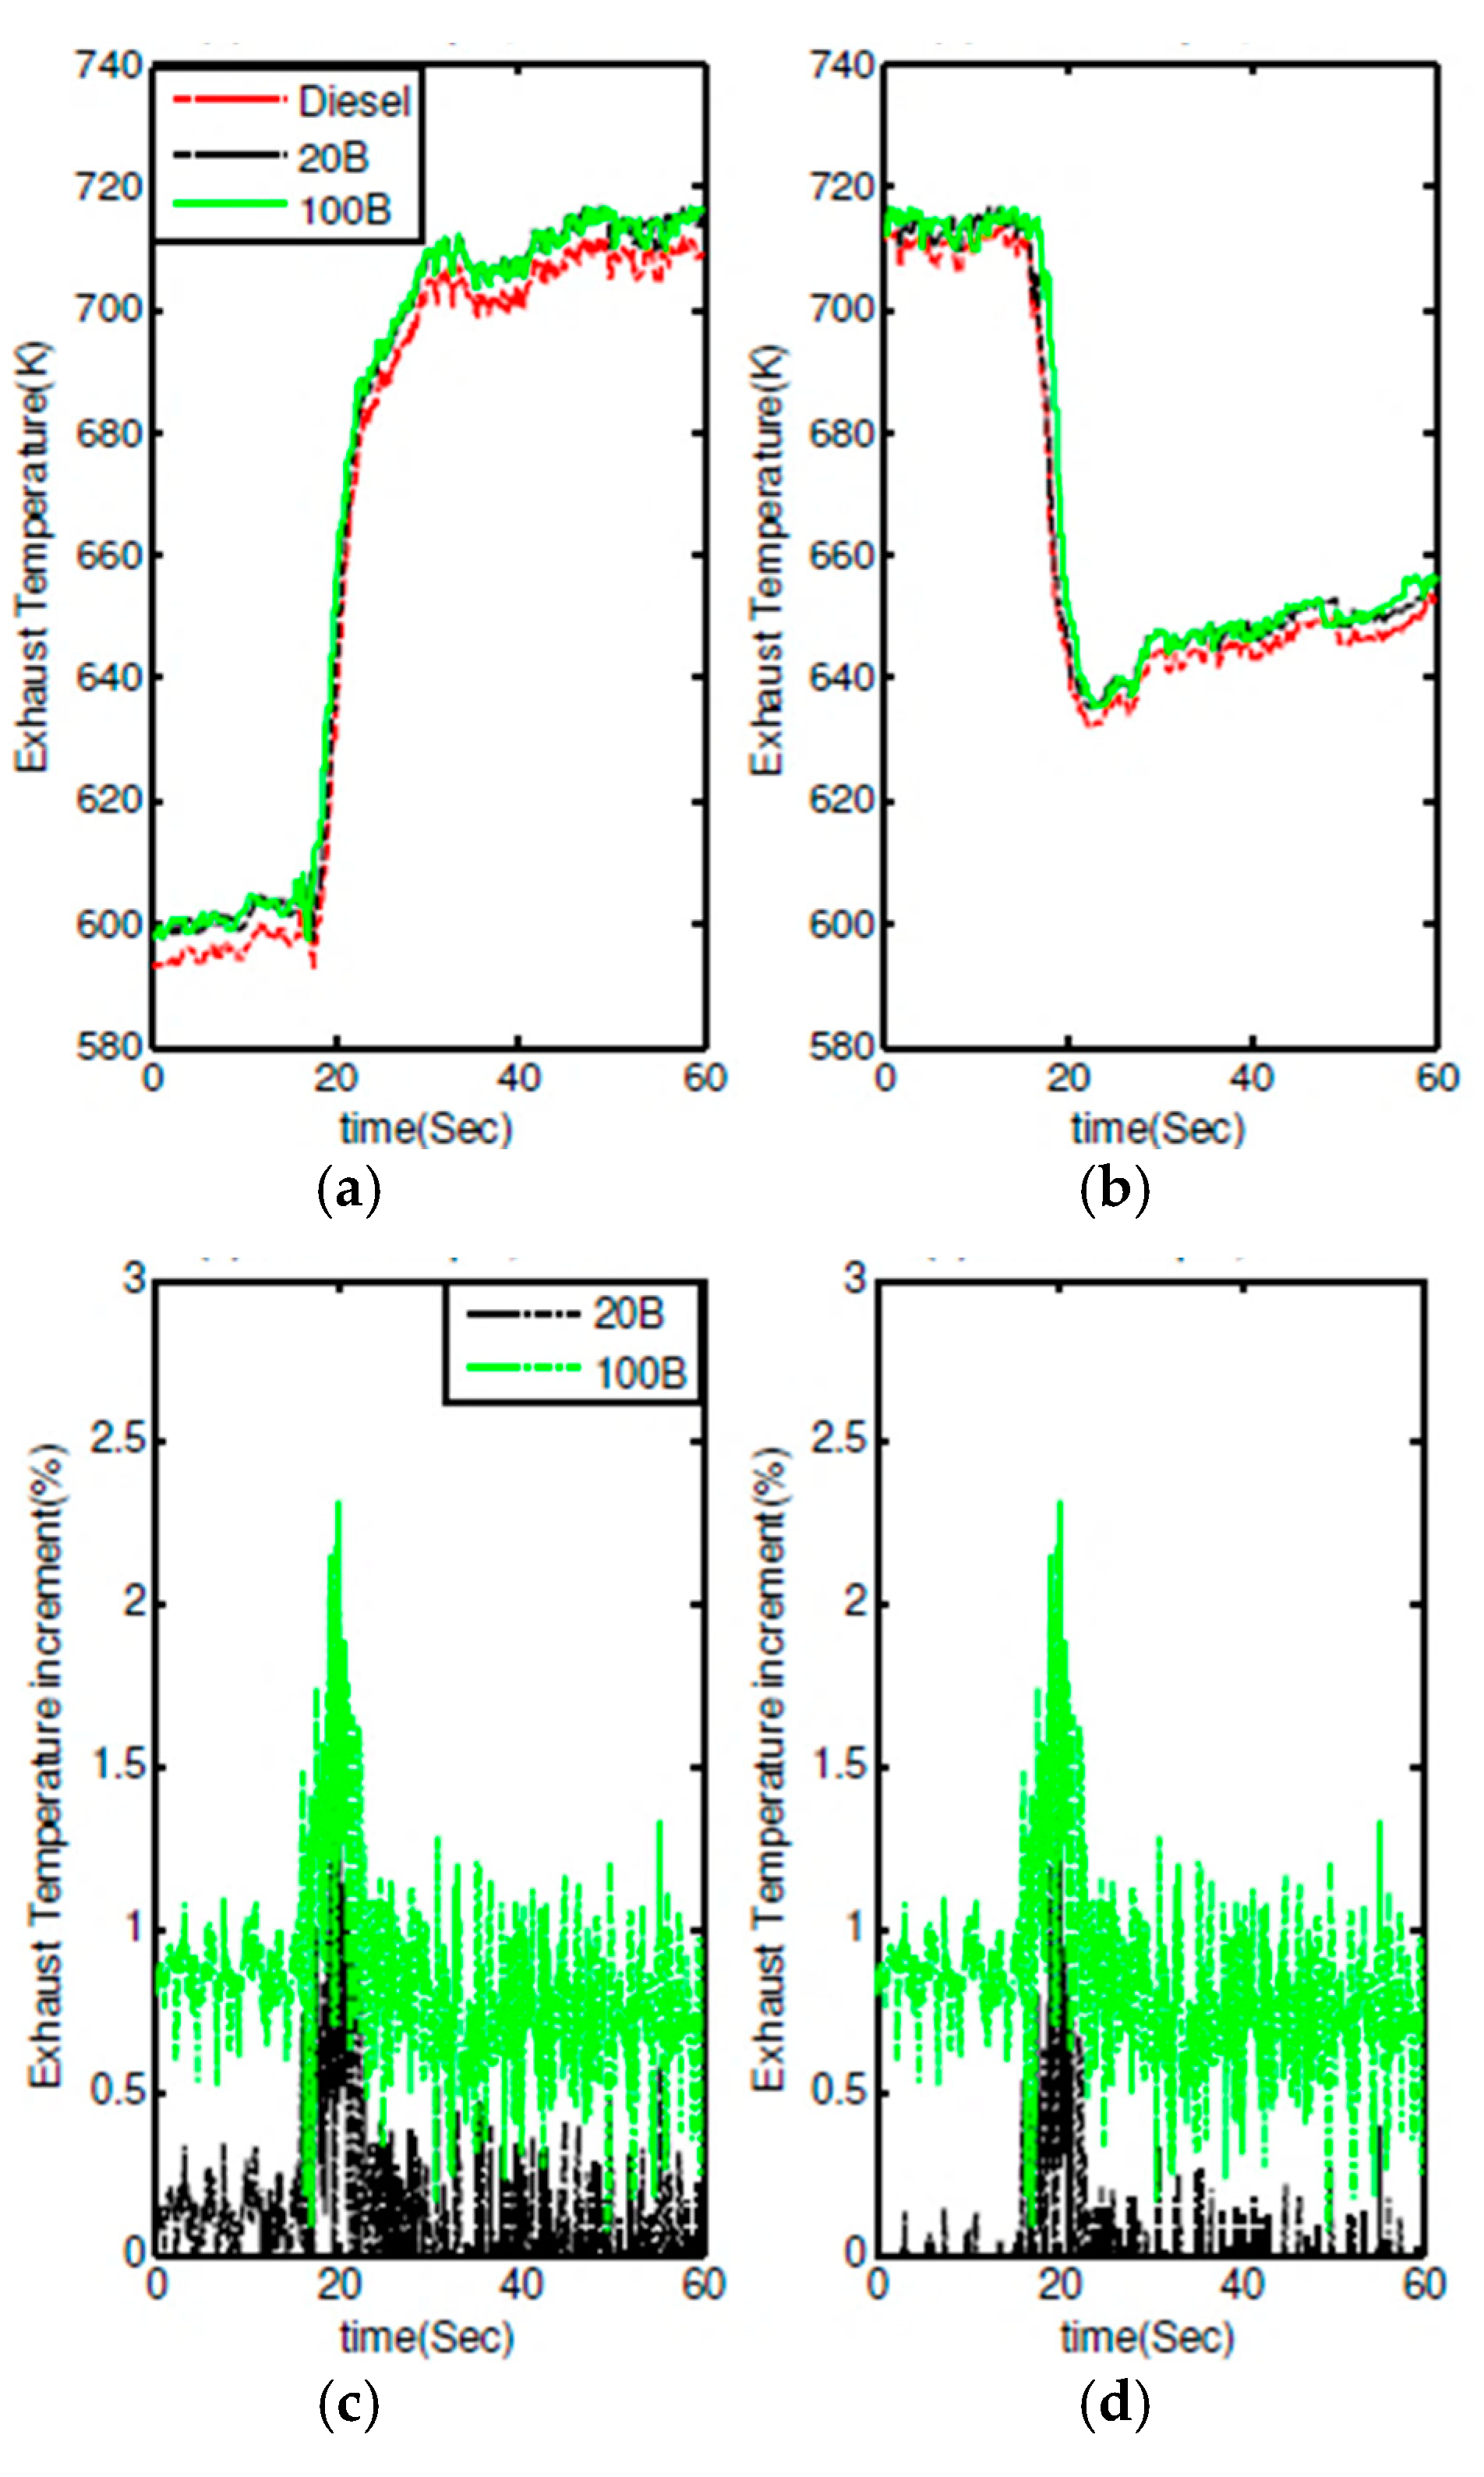
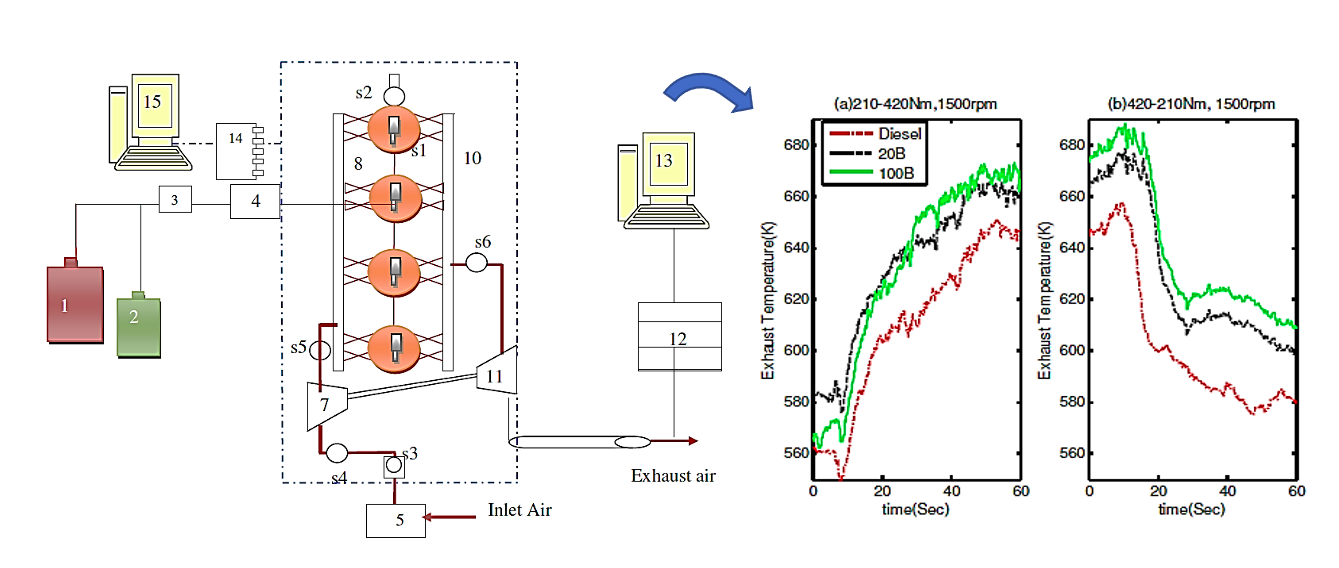
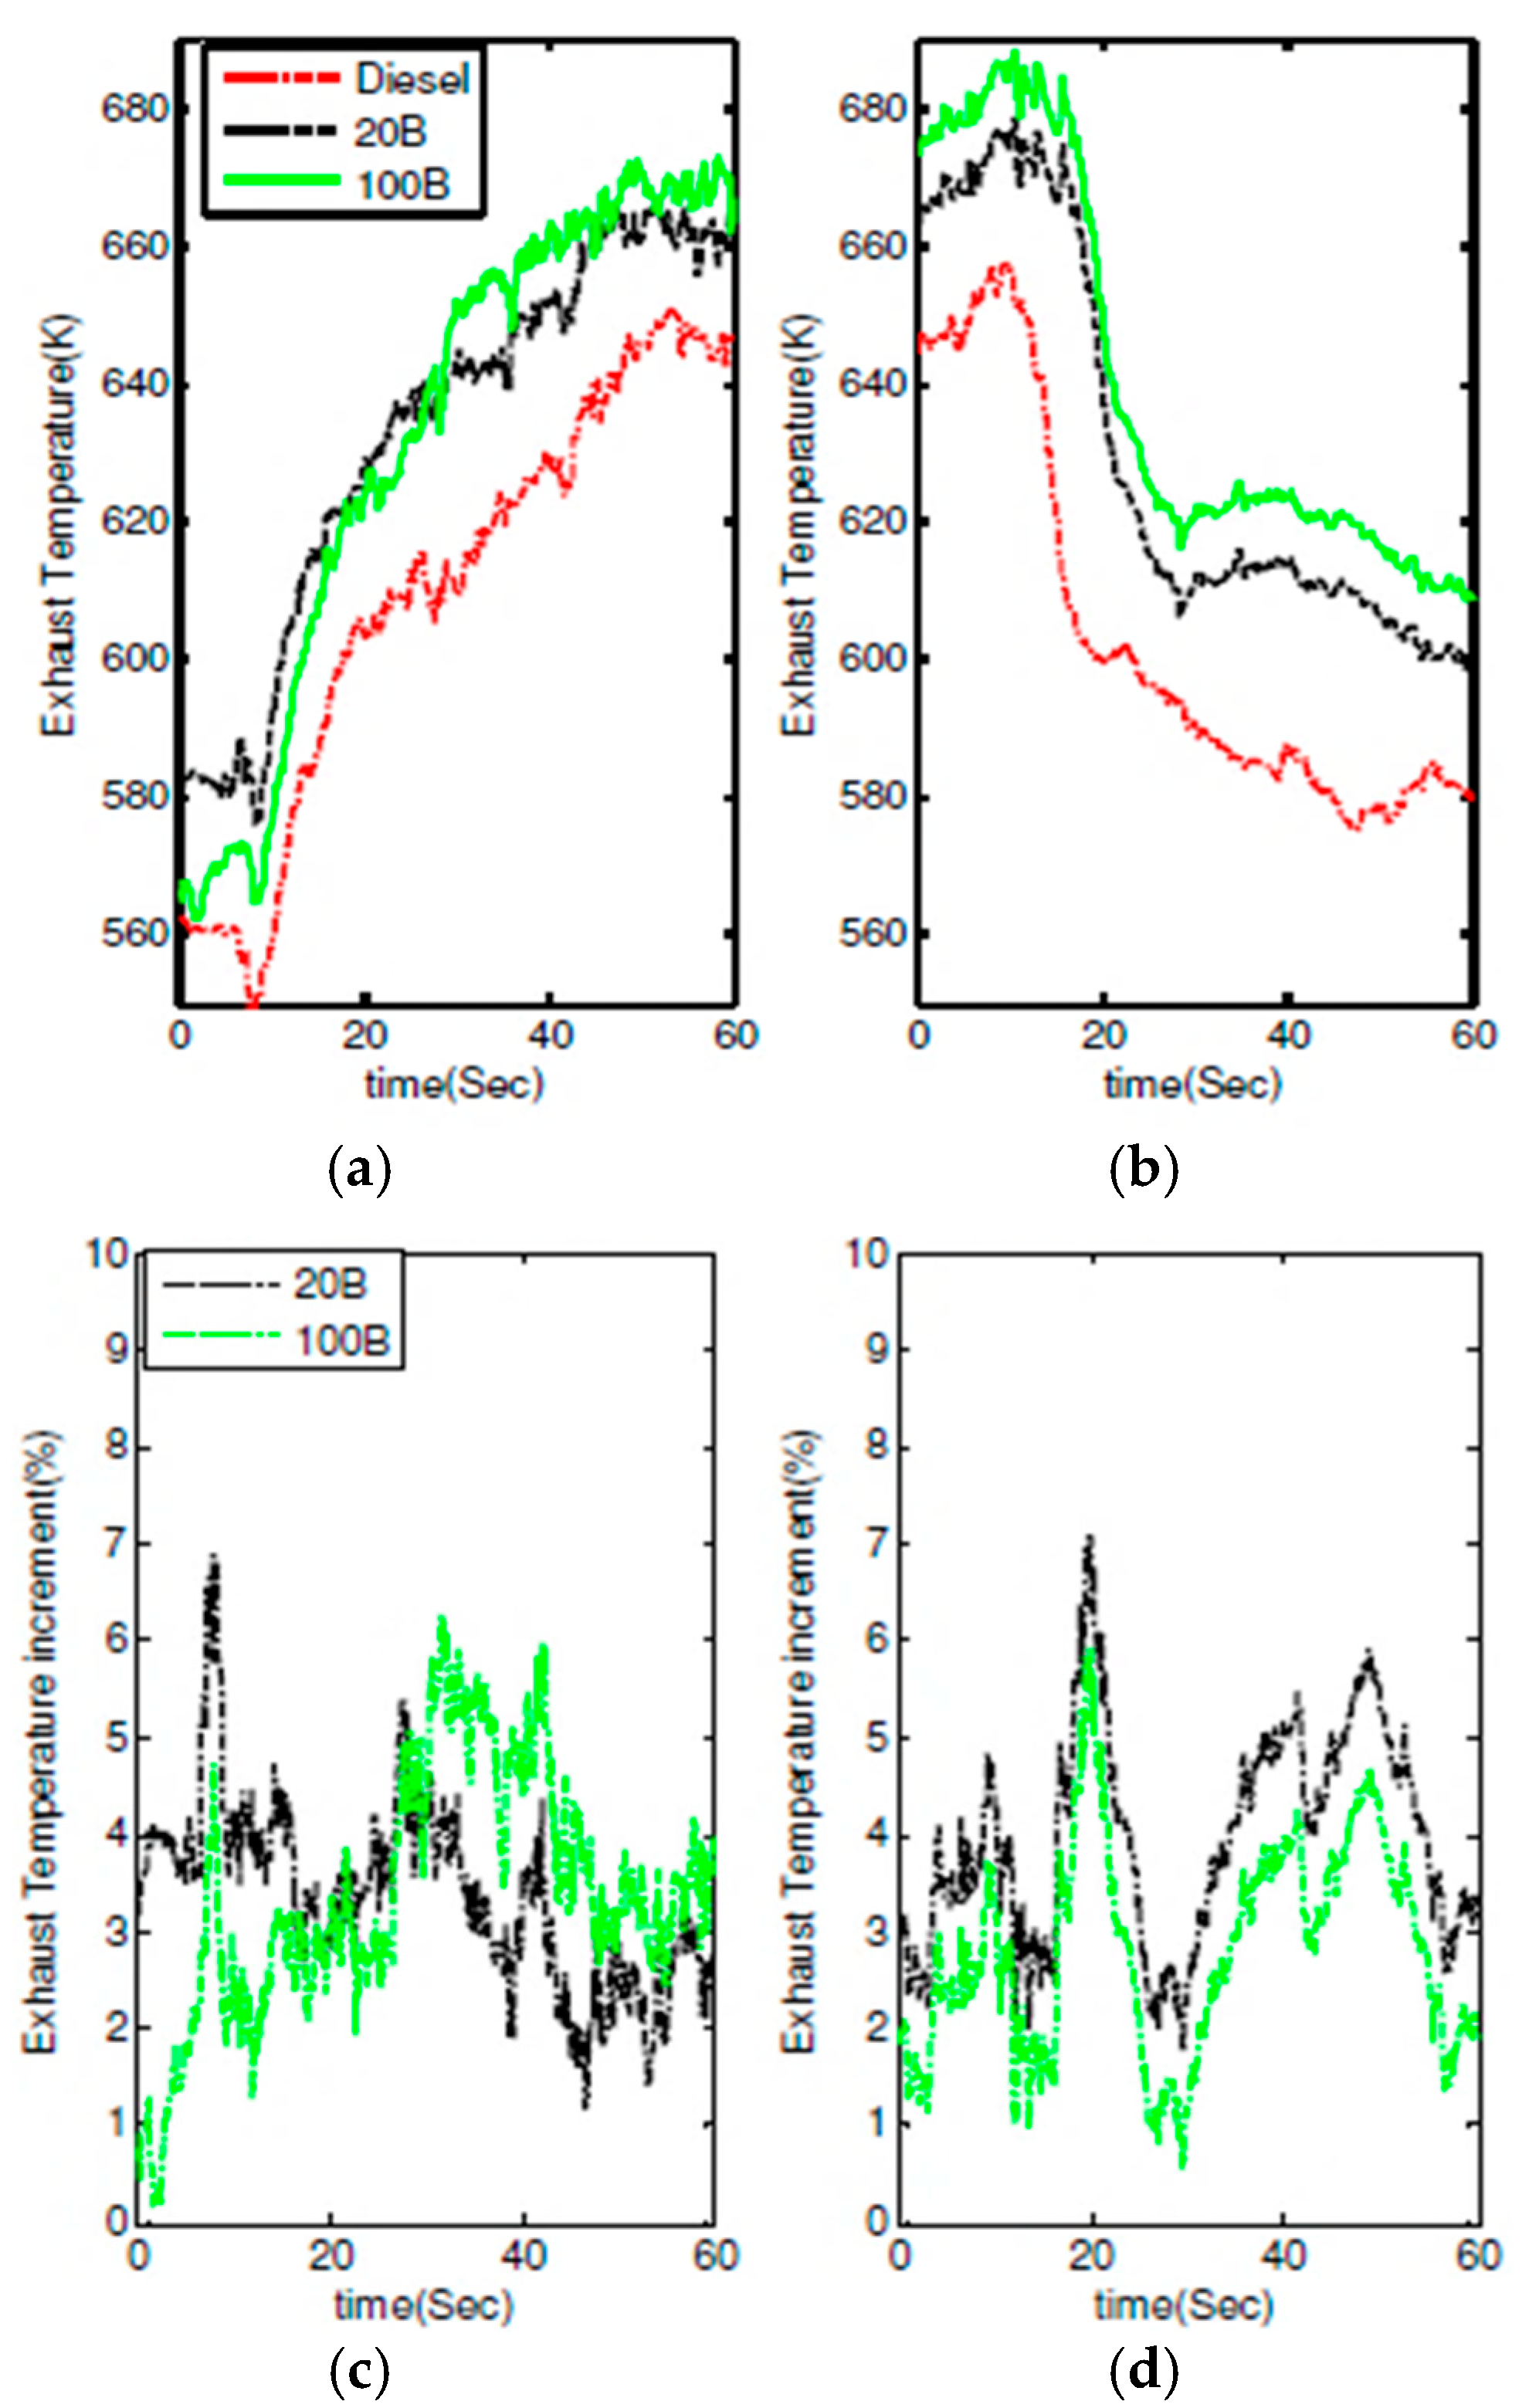
3.1.2. Exhaust Gas Temperature

Figure 5 presents the temperatures of the exhaust gas obtained from the diesel tests and those of 20B and 100B during a speed transient of 1000–1500 rpm and 1500–1000 rpm. The engine load is 420 Nm. The graph shows there is no significant difference in temperature for the diesel and biodiesel blends’ exhaust gases in both acceleration and deceleration conditions. Both conditions exhibit a maximum difference of 2% between the engine exhaust gas temperature with diesel and biodiesel blends. During acceleration, the exhaust temperature rises from around 600 to 710 K. conversely, during deceleration, the exhaust temperature falls from around 710 to 630 K. This is because as when the engine accelerates from 1000 rpm to 1500 rpm, the quantity of fuel introduced into the cylinder also increases to keep a fixed engine torque output. Hence, as expected, the exhaust gas temperatures increase because of burning the fuels.
During deceleration from 1500 to 1000 rpm engine speed, the reverse process occurs in the cylinder. Figure 6 shows the consequences of the torque transition on exhaust gas temperature. The figure shows results of the engine operating with diesel, as well as blends 20B and 100B. Figure 6a gives the exhaust temperature rising from 570 to 670 K through a positive torque transition from 210 to 420 Nm at an engine speed of 1500 rpm. Likewise, during negative torque transition between 420 and 210 Nm, the exhaust gas temperature decreases due to a rise in the fuel required for reaching a higher overall energy input. Comparing the exhaust temperatures of the CI engine with diesel and biodiesel blends and diesel, Figure 6 shows that the engine running with the latter gave a 7% increase in the temperature of the gas exhaust for the positive and negative transition torque conditions. Furthermore, the temperature of the exhaust gases rises with increasing biodiesel blend fraction. A possible reason is that as biodiesel has about 10.5% oxygen in its molecule, which facilitates total fuel combustion within the CI engine’s cylinder. Hence, temperature in the cylinder rises and thus there is a corresponding increase in the temperature of the exhaust gases.

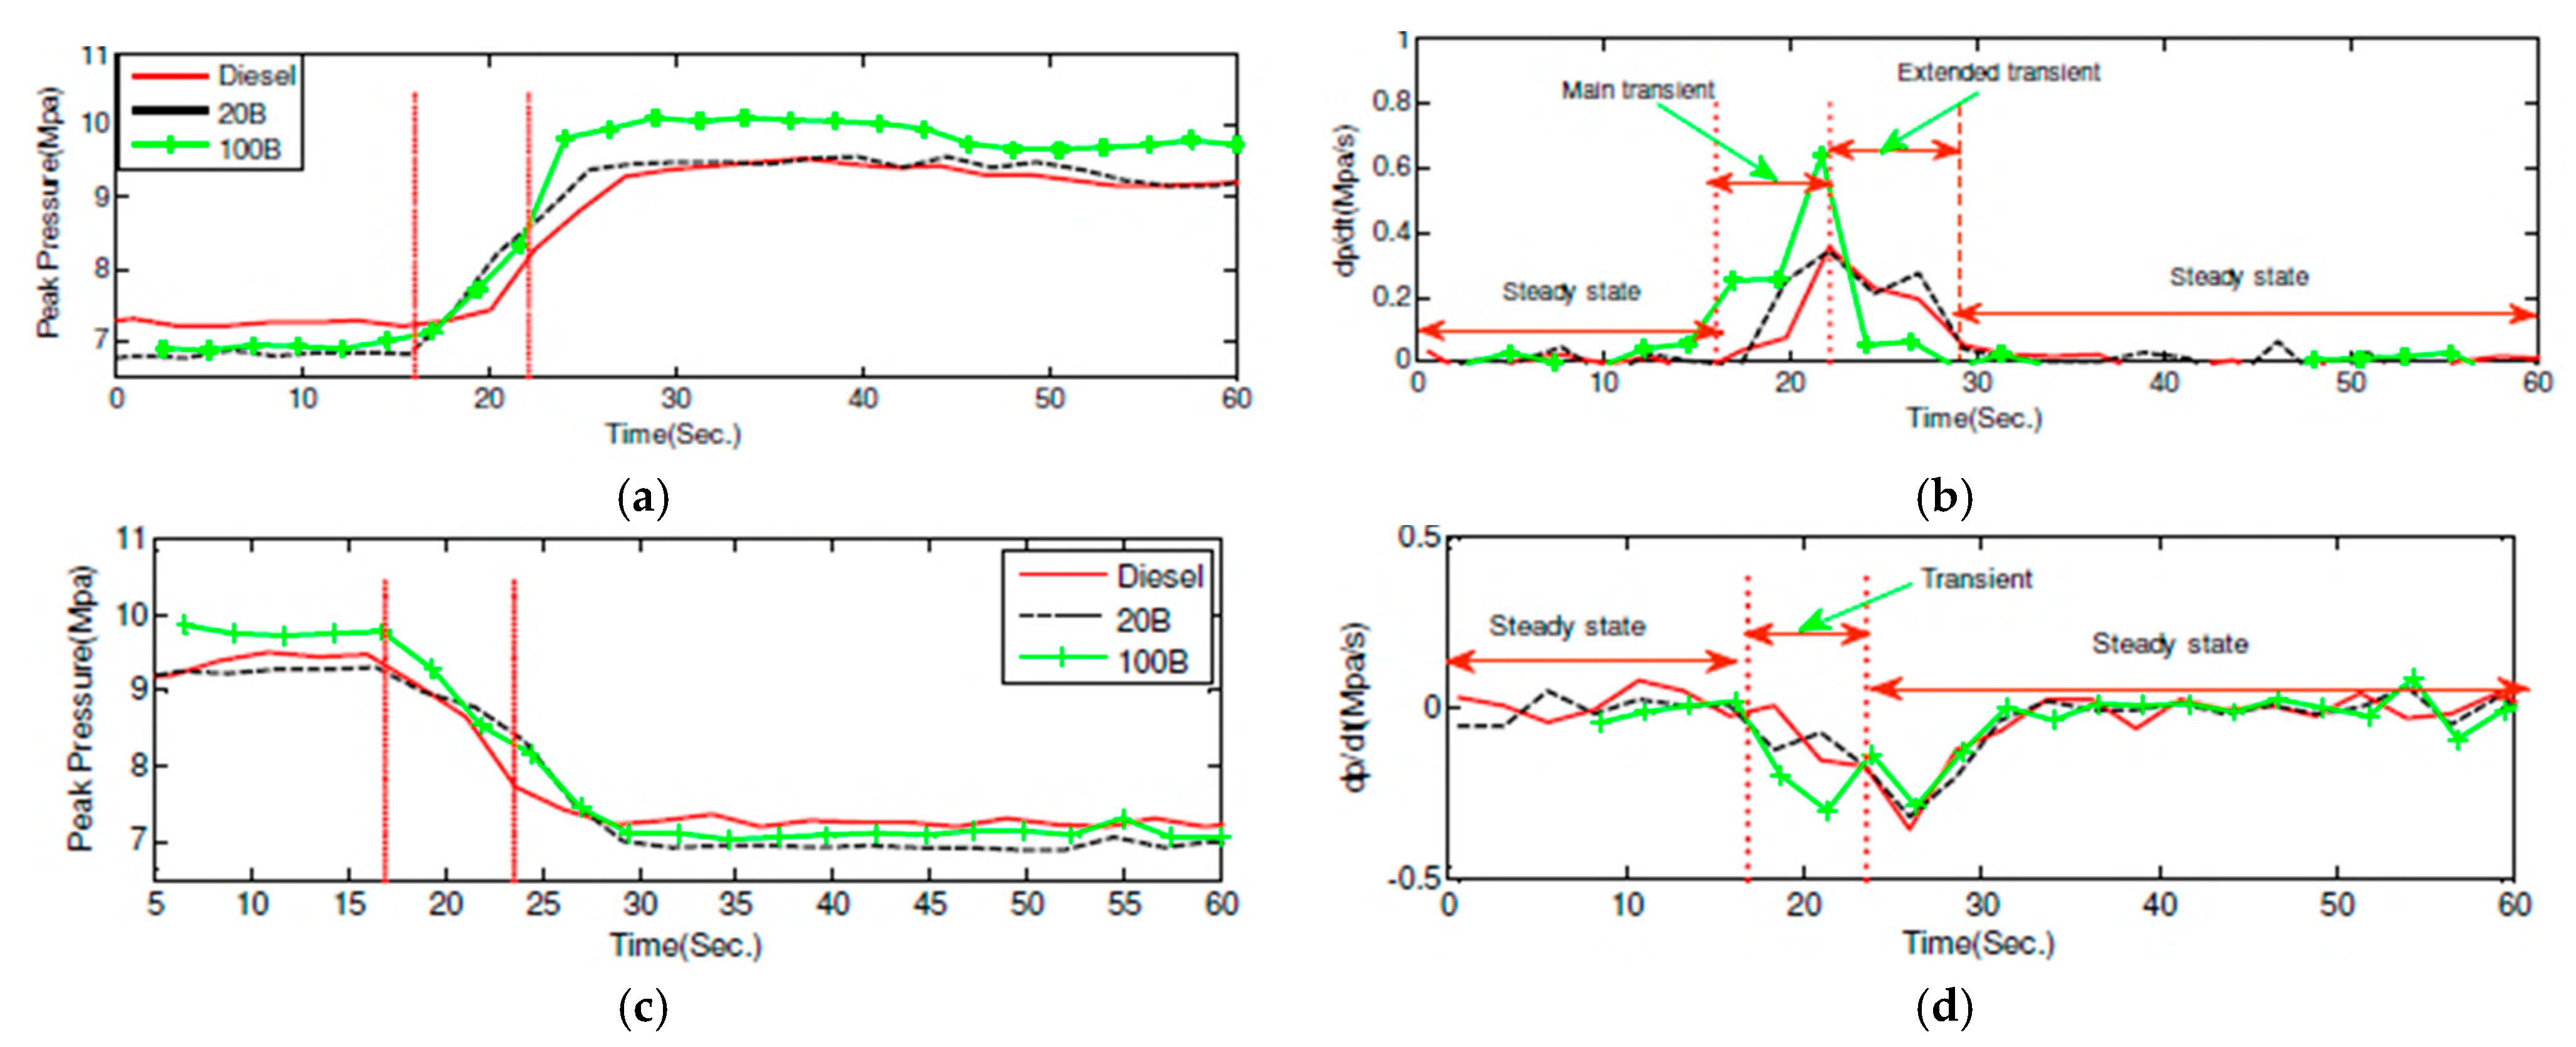
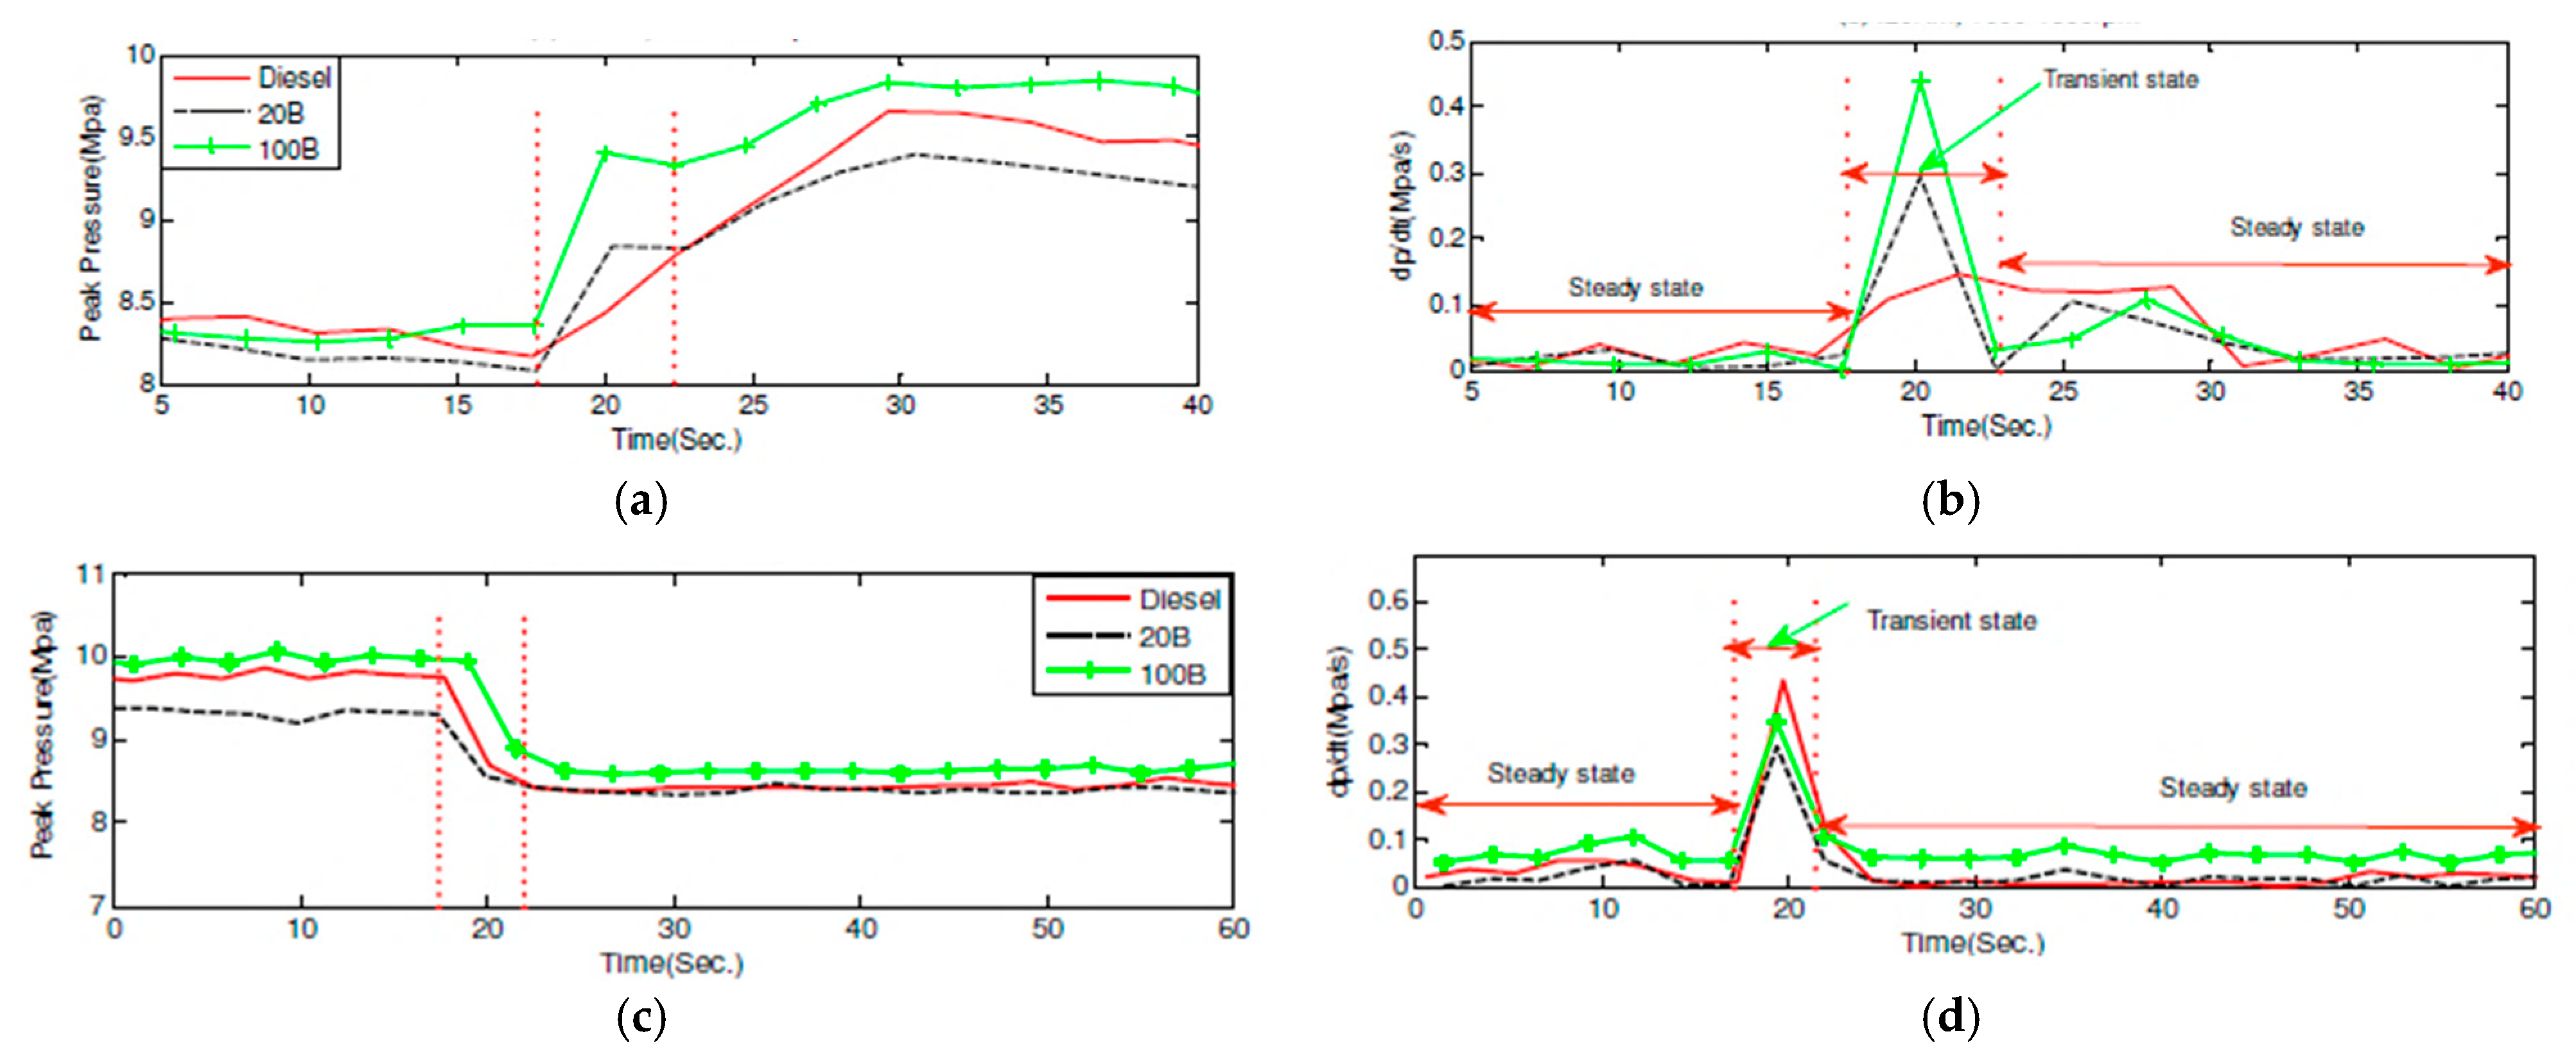
3.1.3. In-Cylinder Pressure

During the development and calibration of engines, the most valuable source of combustion information is the in-cylinder pressure. This signal provided important information for analysis of the engine behaviour. These include the heat release rate, peak pressure (and a P-V diagram can be constructed), indicated mean effective pressure, injector pressure, combustion duration, ignition delay, etc. In this section, we discuss in detail the in-cylinder pressure and the effect of fuel type. Figure 7 and Figure 8 depict the maximum in-cylinder pressure for 4 conditions of operation. These are the increase from 1000–1500 rpm, deceleration operation from values of 1500–100 rpm, the positive torque transition from 210 to 420 Nm as well as the negative torque transient of 420 to 210 Nm. Figure 7 presents the results of peak pressure inside the engine cylinder with diesel, blends 20 B, and 100 B fuels at an engine torque of 420 Nm during the speed transition from 1000–1500 rpm.
Figure 7a shows that the CI engine with 100 B and 20 B gave 15% and 7% higher in-cylinder peak pressures than diesel within the transient segments of operating the engine. This process is because of the total carbon molecule combustion to produce the maximum torque. It is reckoned that the main source of the increased in-cylinder peak pressure of the engine operating with biodiesel is the complex combustion process occasioned by lower biodiesel viscosity.
Additionally, because of the presence of oxygen molecules in biodiesel, the hydrocarbons experience complete combustion. Figure 7b shows that the in-cylinder pressure initially remains almost constant with time. However, because of the post-transient operation, the in-cylinder pressure change exhibited some irregular behaviour. Firstly, in the transient segment, the pressure in the cylinder reached a peak. Figure 7c shows that the in-cylinder peak pressure with 20B and 100B at an engine load of 420 Nm at a deceleration of 1500–1000 rpm. As was with the speed transient condition, the engine operating using 100 B resulted in a 5% larger peak pressure in the engine than diesel. Figure 7d shows that the in-cylinder pressure rate was nearly uniform in pre-transient as well as post-transient steady state operations. For the transient operation, biodiesel blend operated engine exhibited higher peak pressures in the cylinders than when fuelled with pure diesel.
Shown in Figure 8a is the effect of positive torque transition within the ranges 210 Nm and 420 Nm on the in-cylinder peak pressure when the CI engine was fuelled with diesel, 20 B, and 100 B at 1500 rpm. In pre-transient conditions, the diesel and then 100 B resulted in a 9% higher in-cylinder peak pressure. Nevertheless, in post-transient conditions, the engine with 100 B and 20 B respectively exhibited 12% and 6% higher in-cylinder pressures than the engine fuelled by diesel. Figure 8b shows the results of contrasting the transient in-cylinder pressures where the 100 B blend resulted in a 45% higher rate than diesel and 20 B. Figure 8c depicts the in-cylinder peak pressure when the engine is operated with diesel, 20B and 100B 1500 rpm during the negative torque transient of 420–210 Nm. In a similar fashion to the acceleration torque transient, the 100 B-run engine resulted in an 8% higher in-cylinder peak pressure than the diesel pre-transient operation. In post-transient operation, however, fuelled using diesel, the engine produced a higher in-cylinder pressure than with the 100 B fuel. In the transient operating conditions, both 20B and 100B gave higher in-cylinder peak pressures. The rate of change of the peak in-cylinder pressure during transient operation for 20B and 100B were lower than that of diesel.

3.2. Emission Characteristics of CI Engine during Transient Operation

In this section, the results of detailed investigations carried out on the emission characteristics of the CI engine with diesel and the biodiesel blends are presented. The analysis was performed for four transient operating conditions. These are acceleration, deceleration, negative and positive torque transitions. The analyses were done in three stages. In the first stage, the measured engine emissions characteristics for various operating conditions were compared. In the second stage, the emission release rates of change were computed. Finally, the magnitude of emissions reduction using the biodiesel blends was determined. The major emission compounds studied in the analysis are CO2, NOx, CO and total hydrocarbons (THC). While oxygen (O2) was not considered as an emission, its release characteristics under transient conditions were also studied for understanding the combustion phenomena as well as the relationship between the exhaust gas emissions and O2.

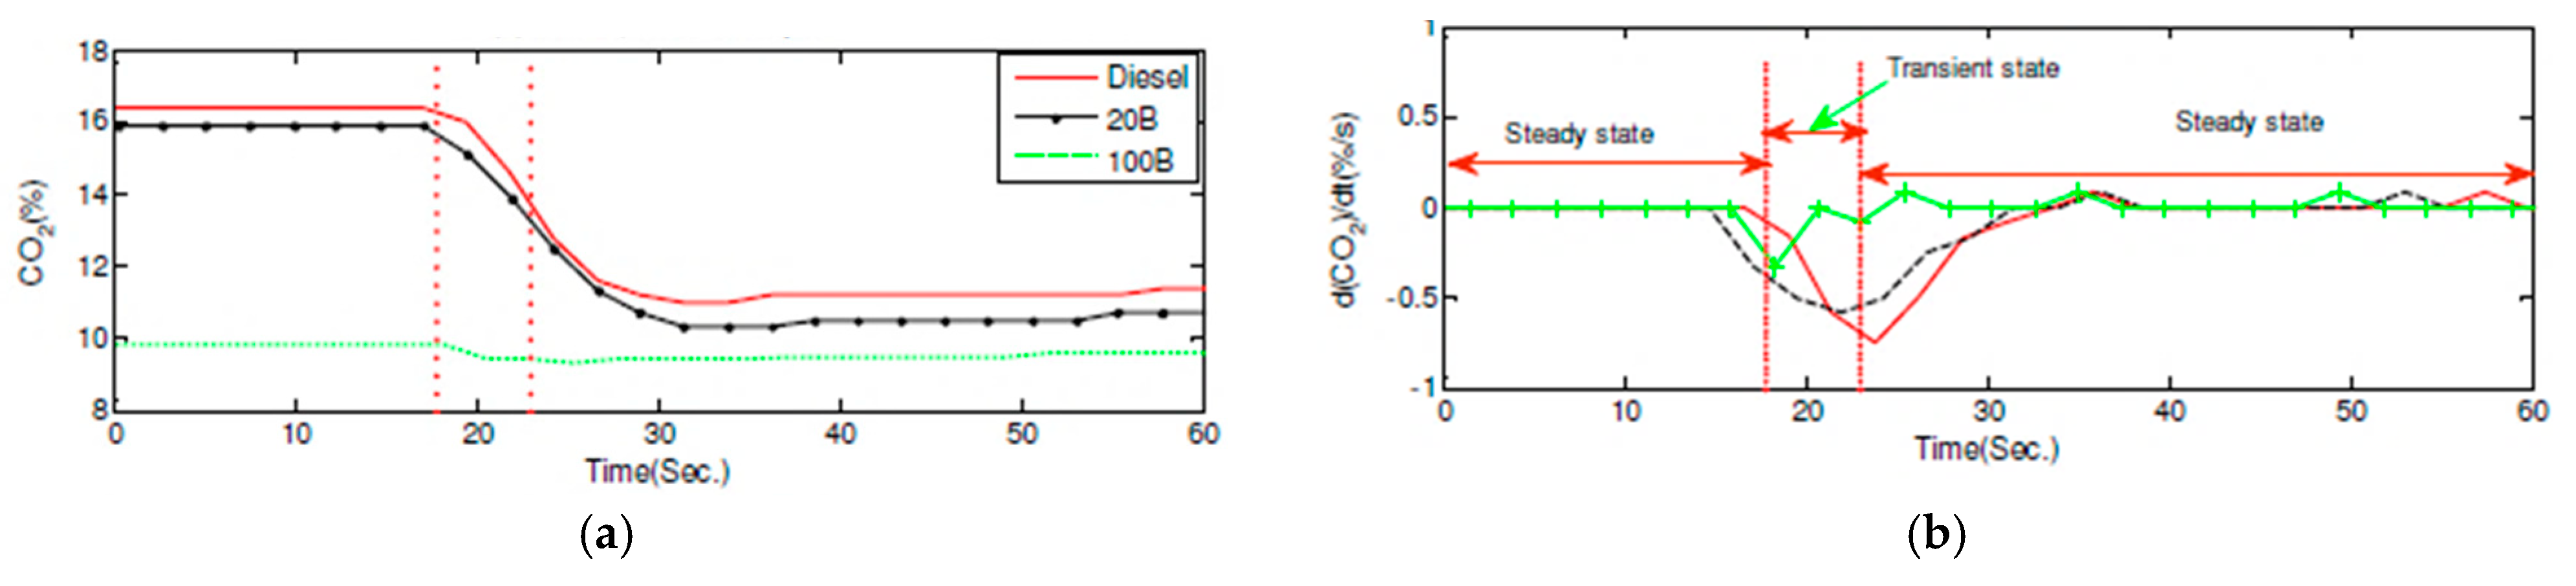
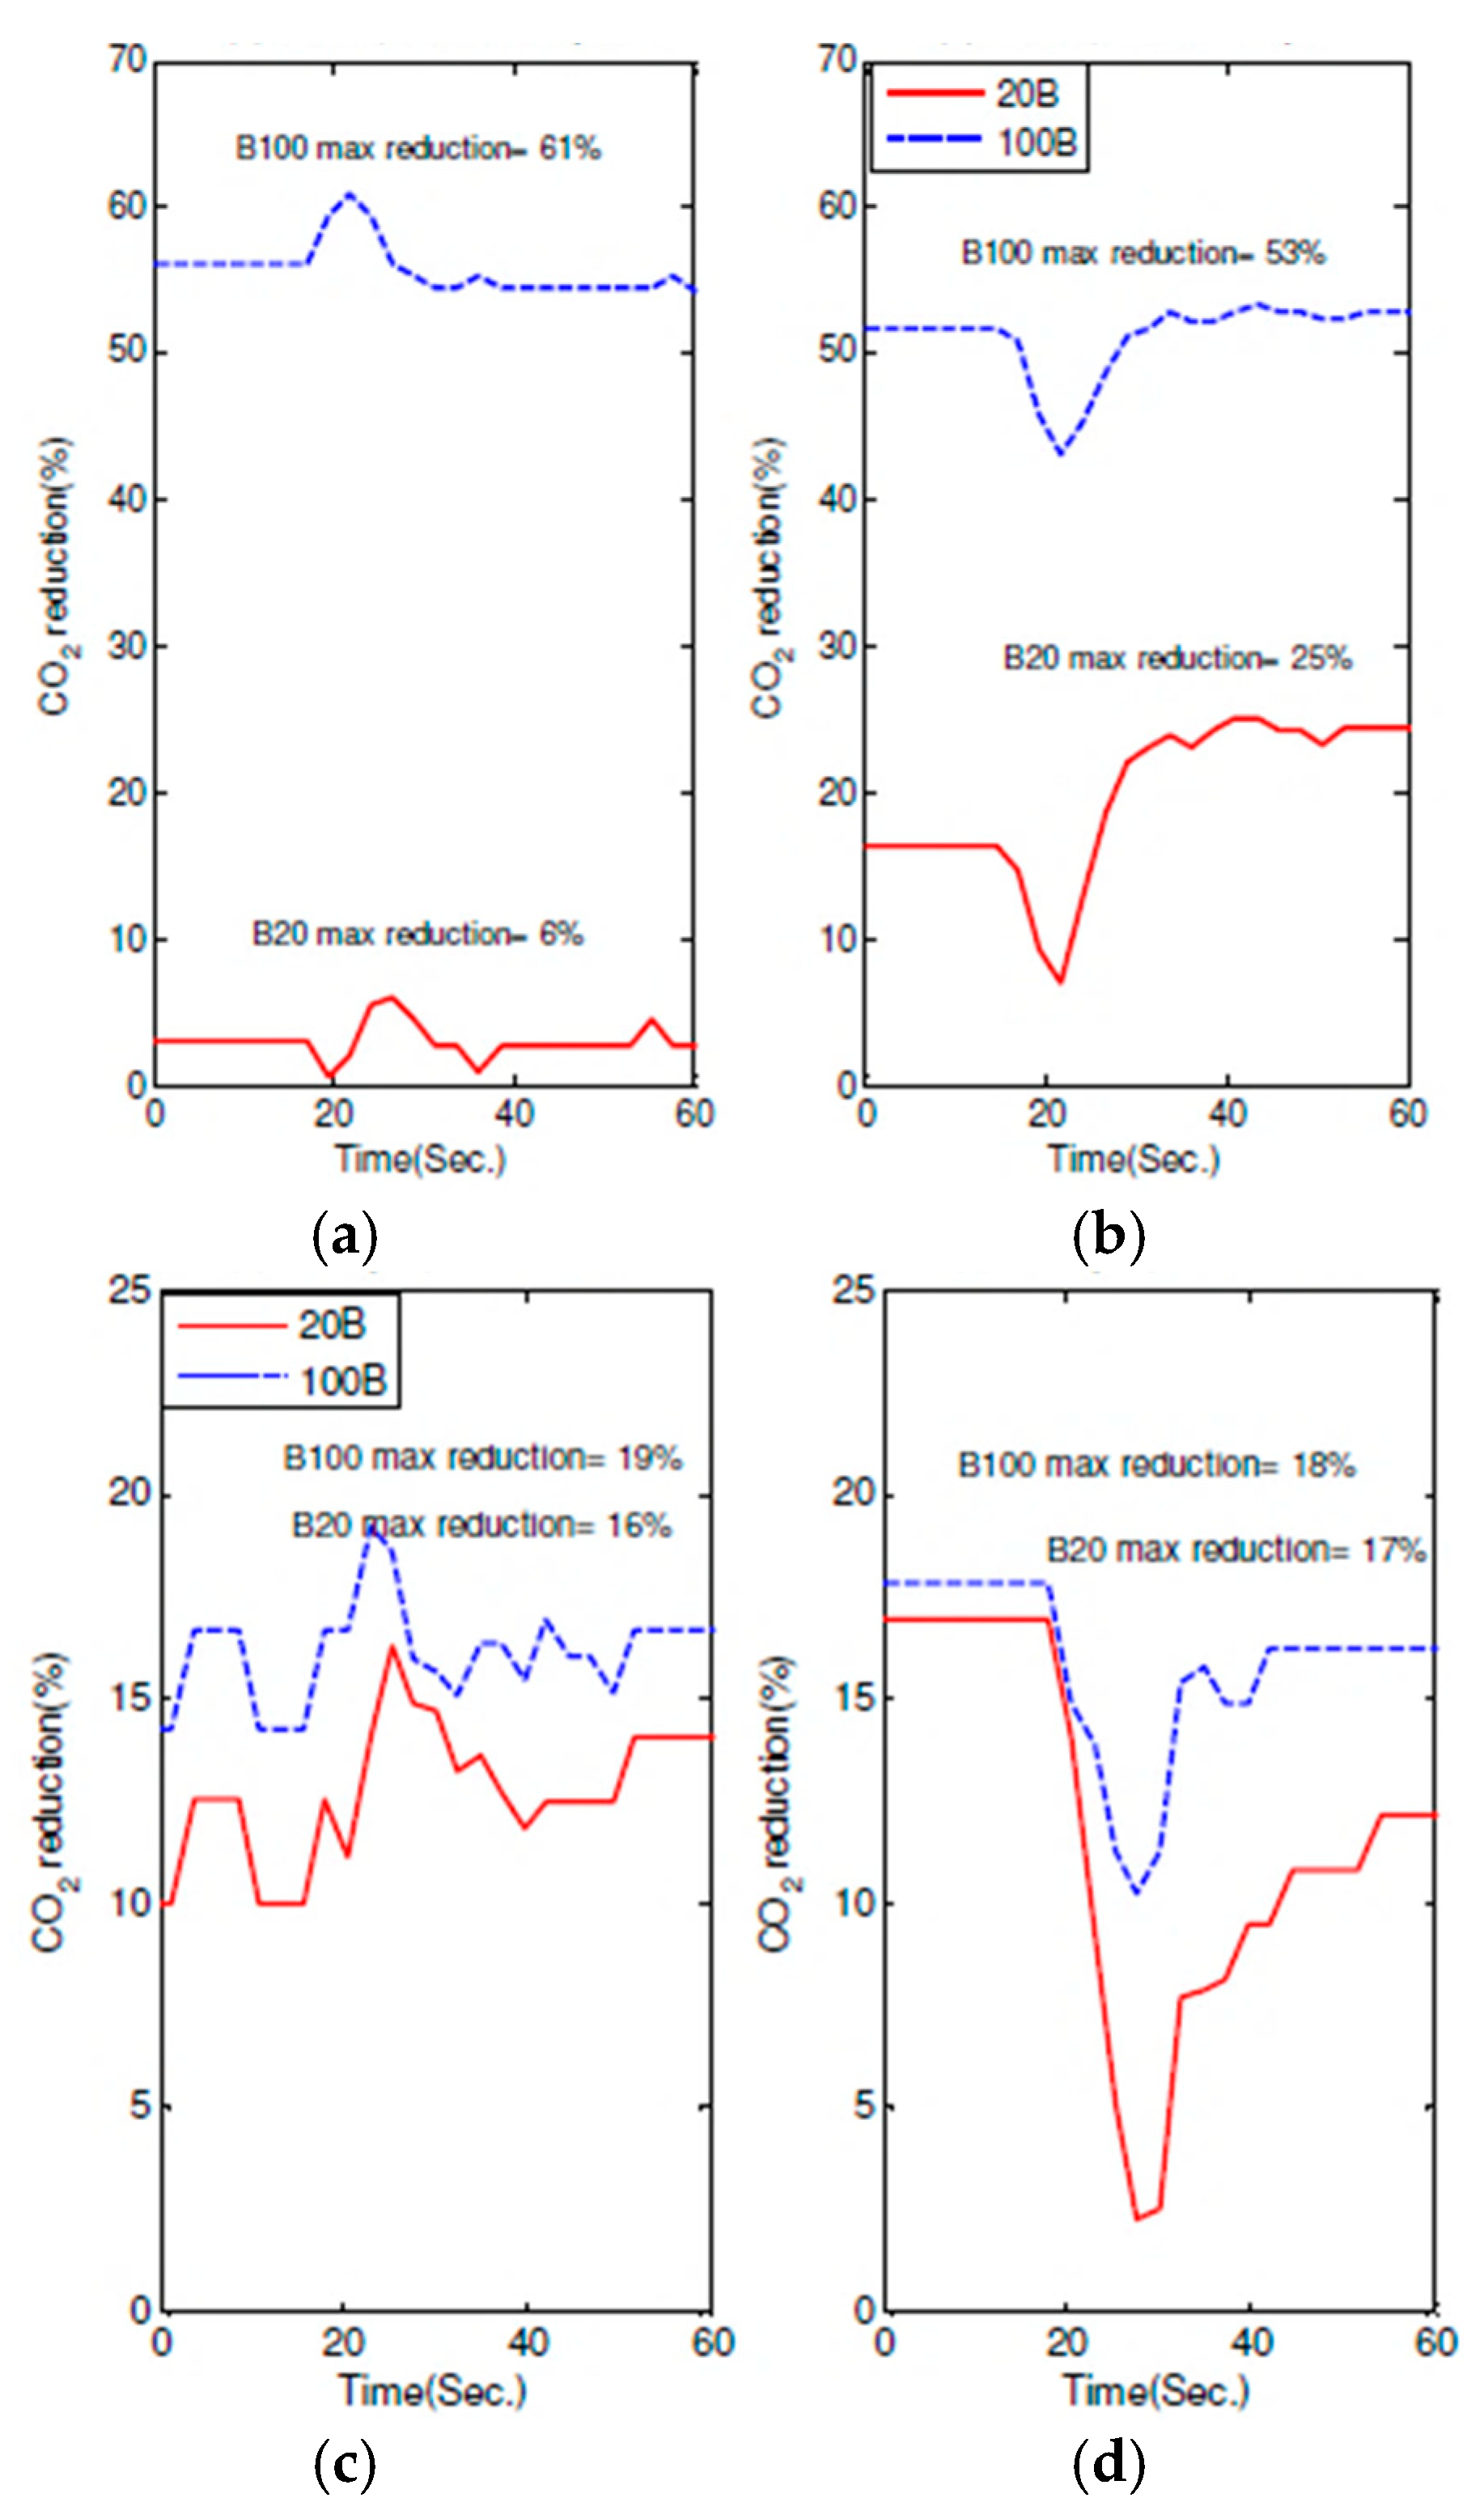
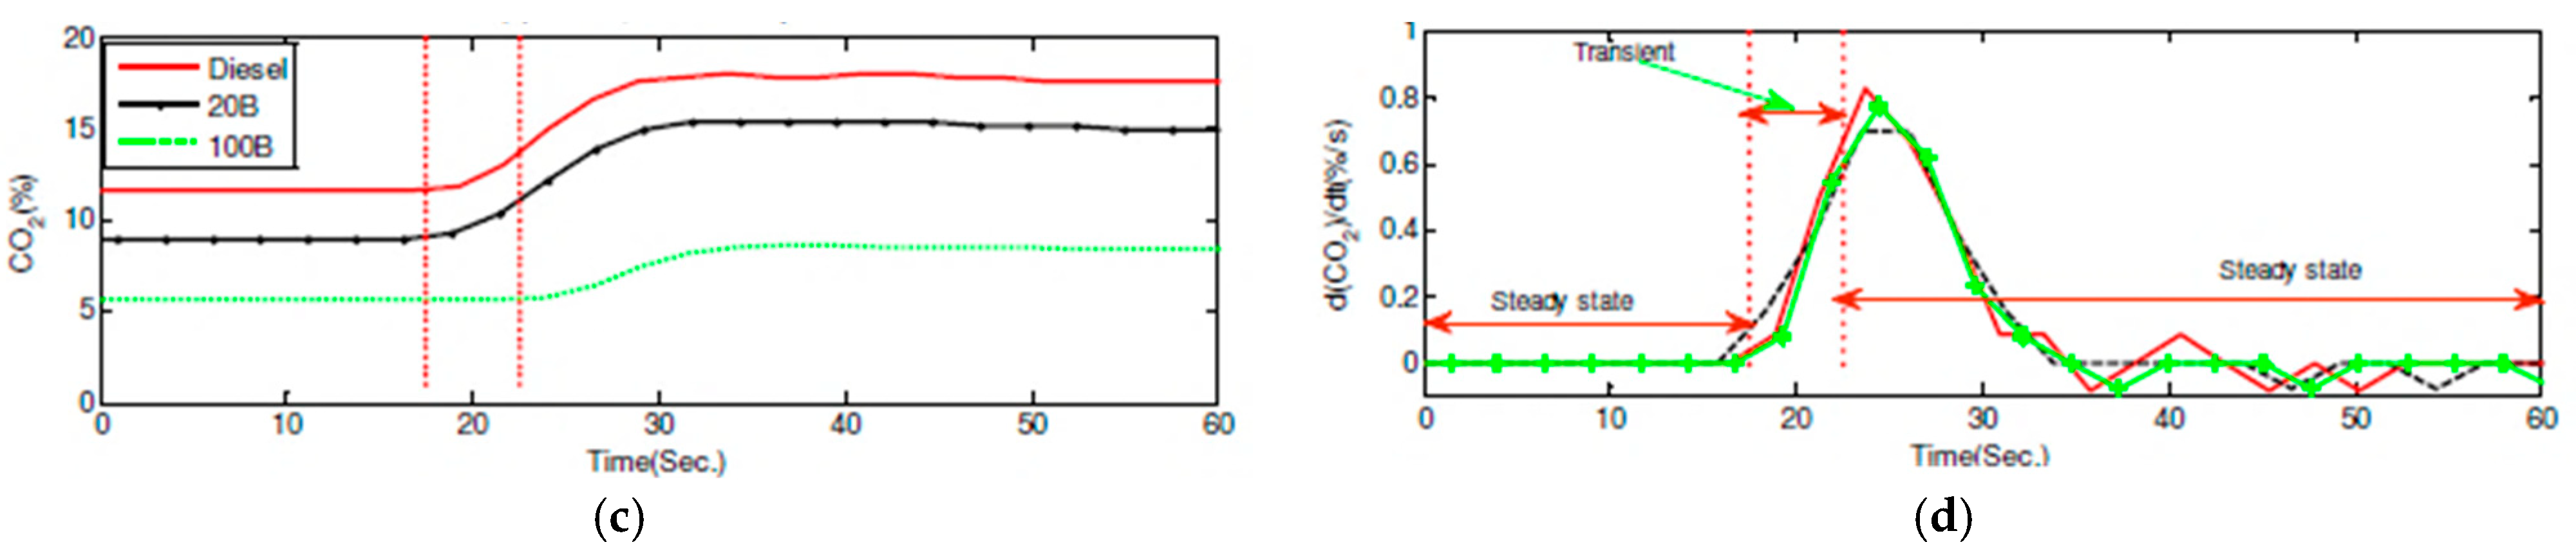
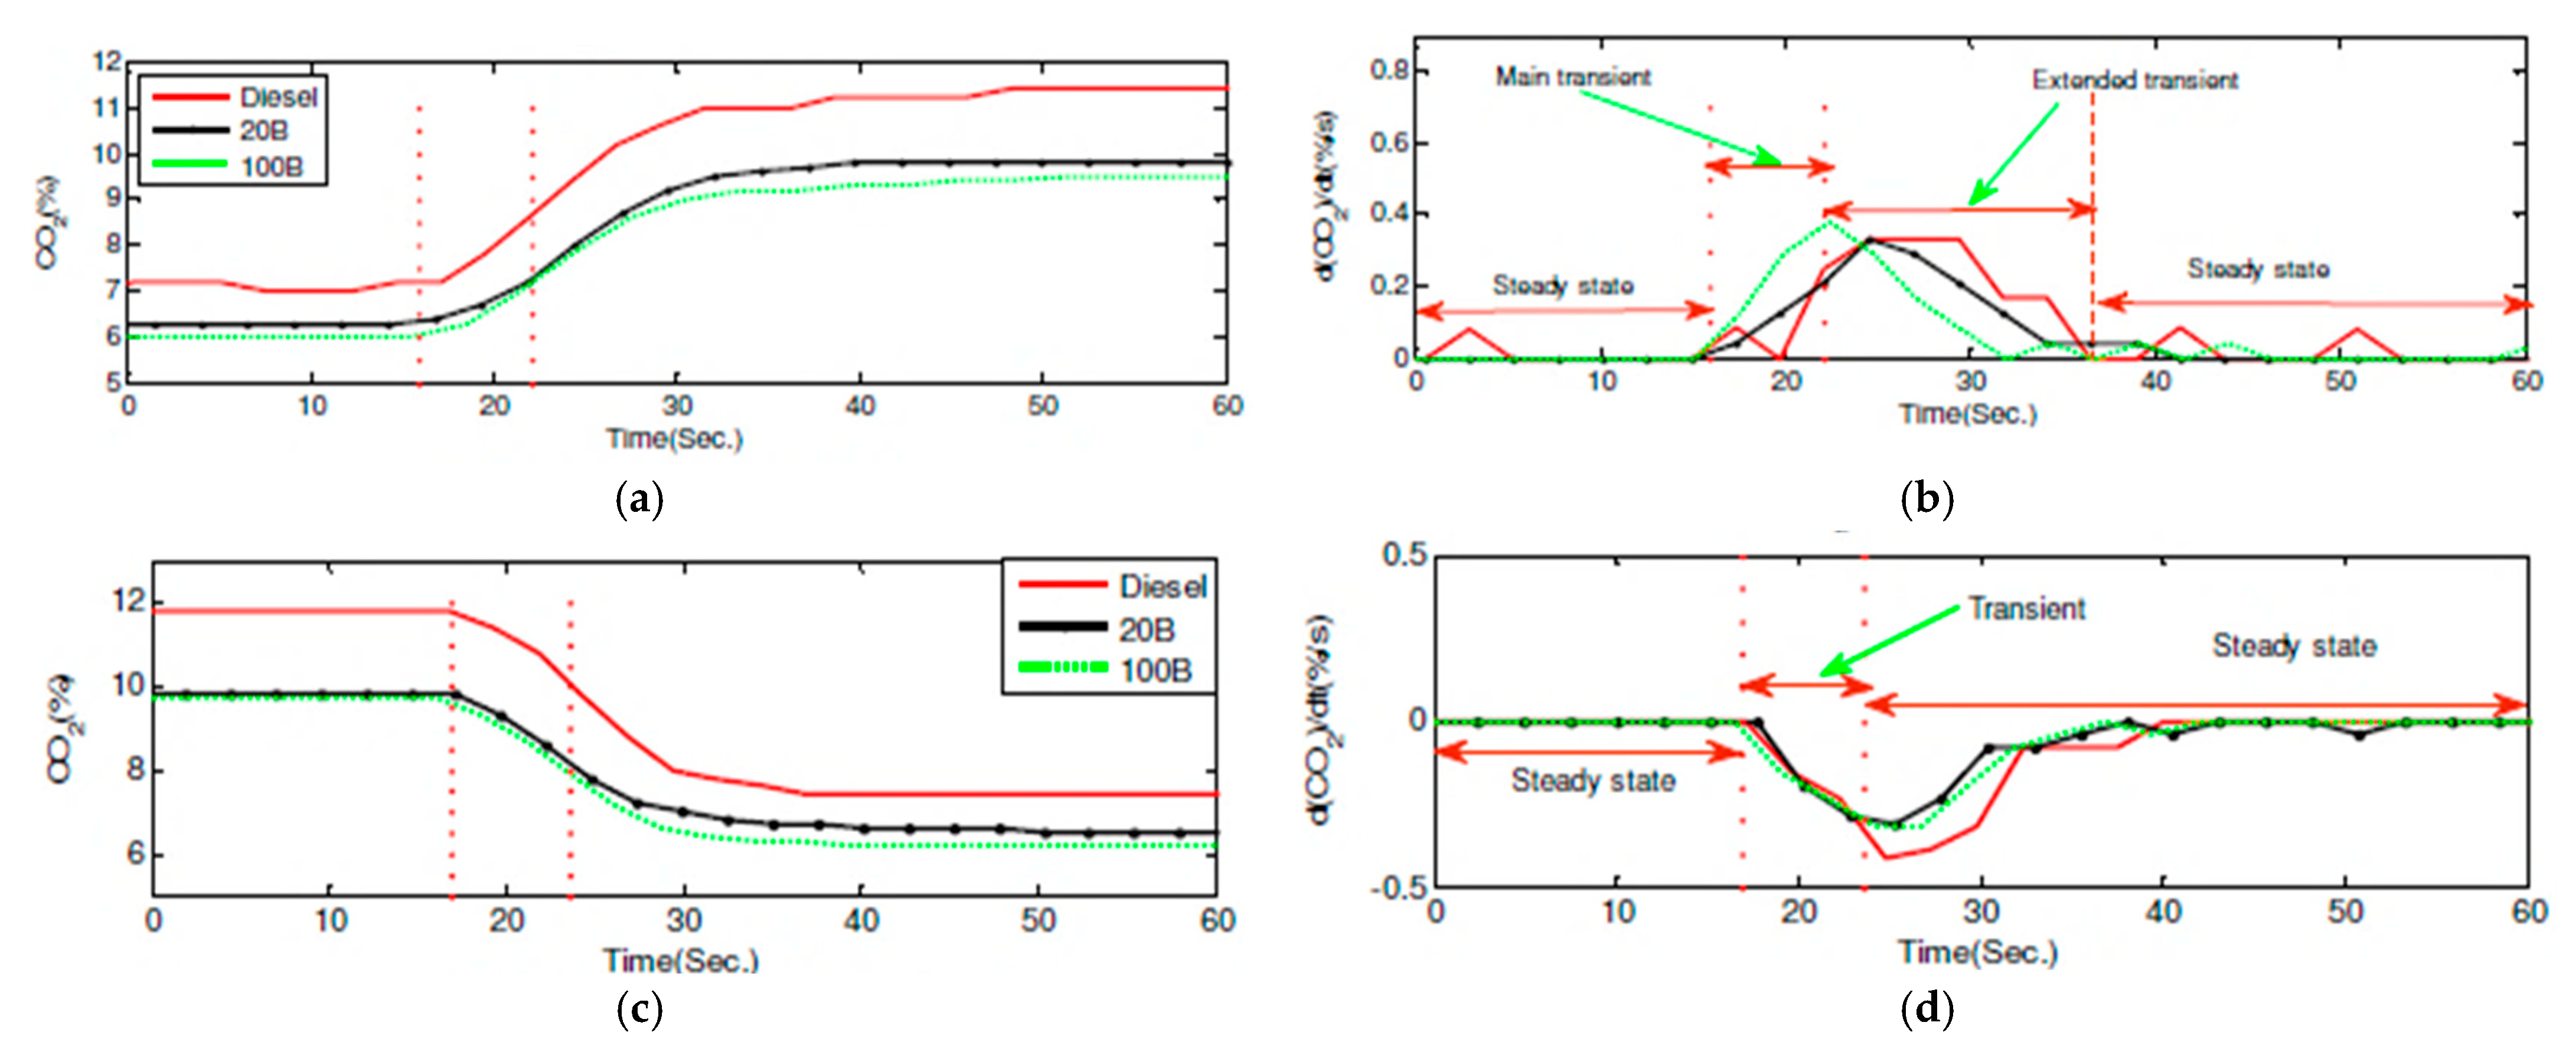
3.2.1. Carbon Dioxide (CO2) Emission
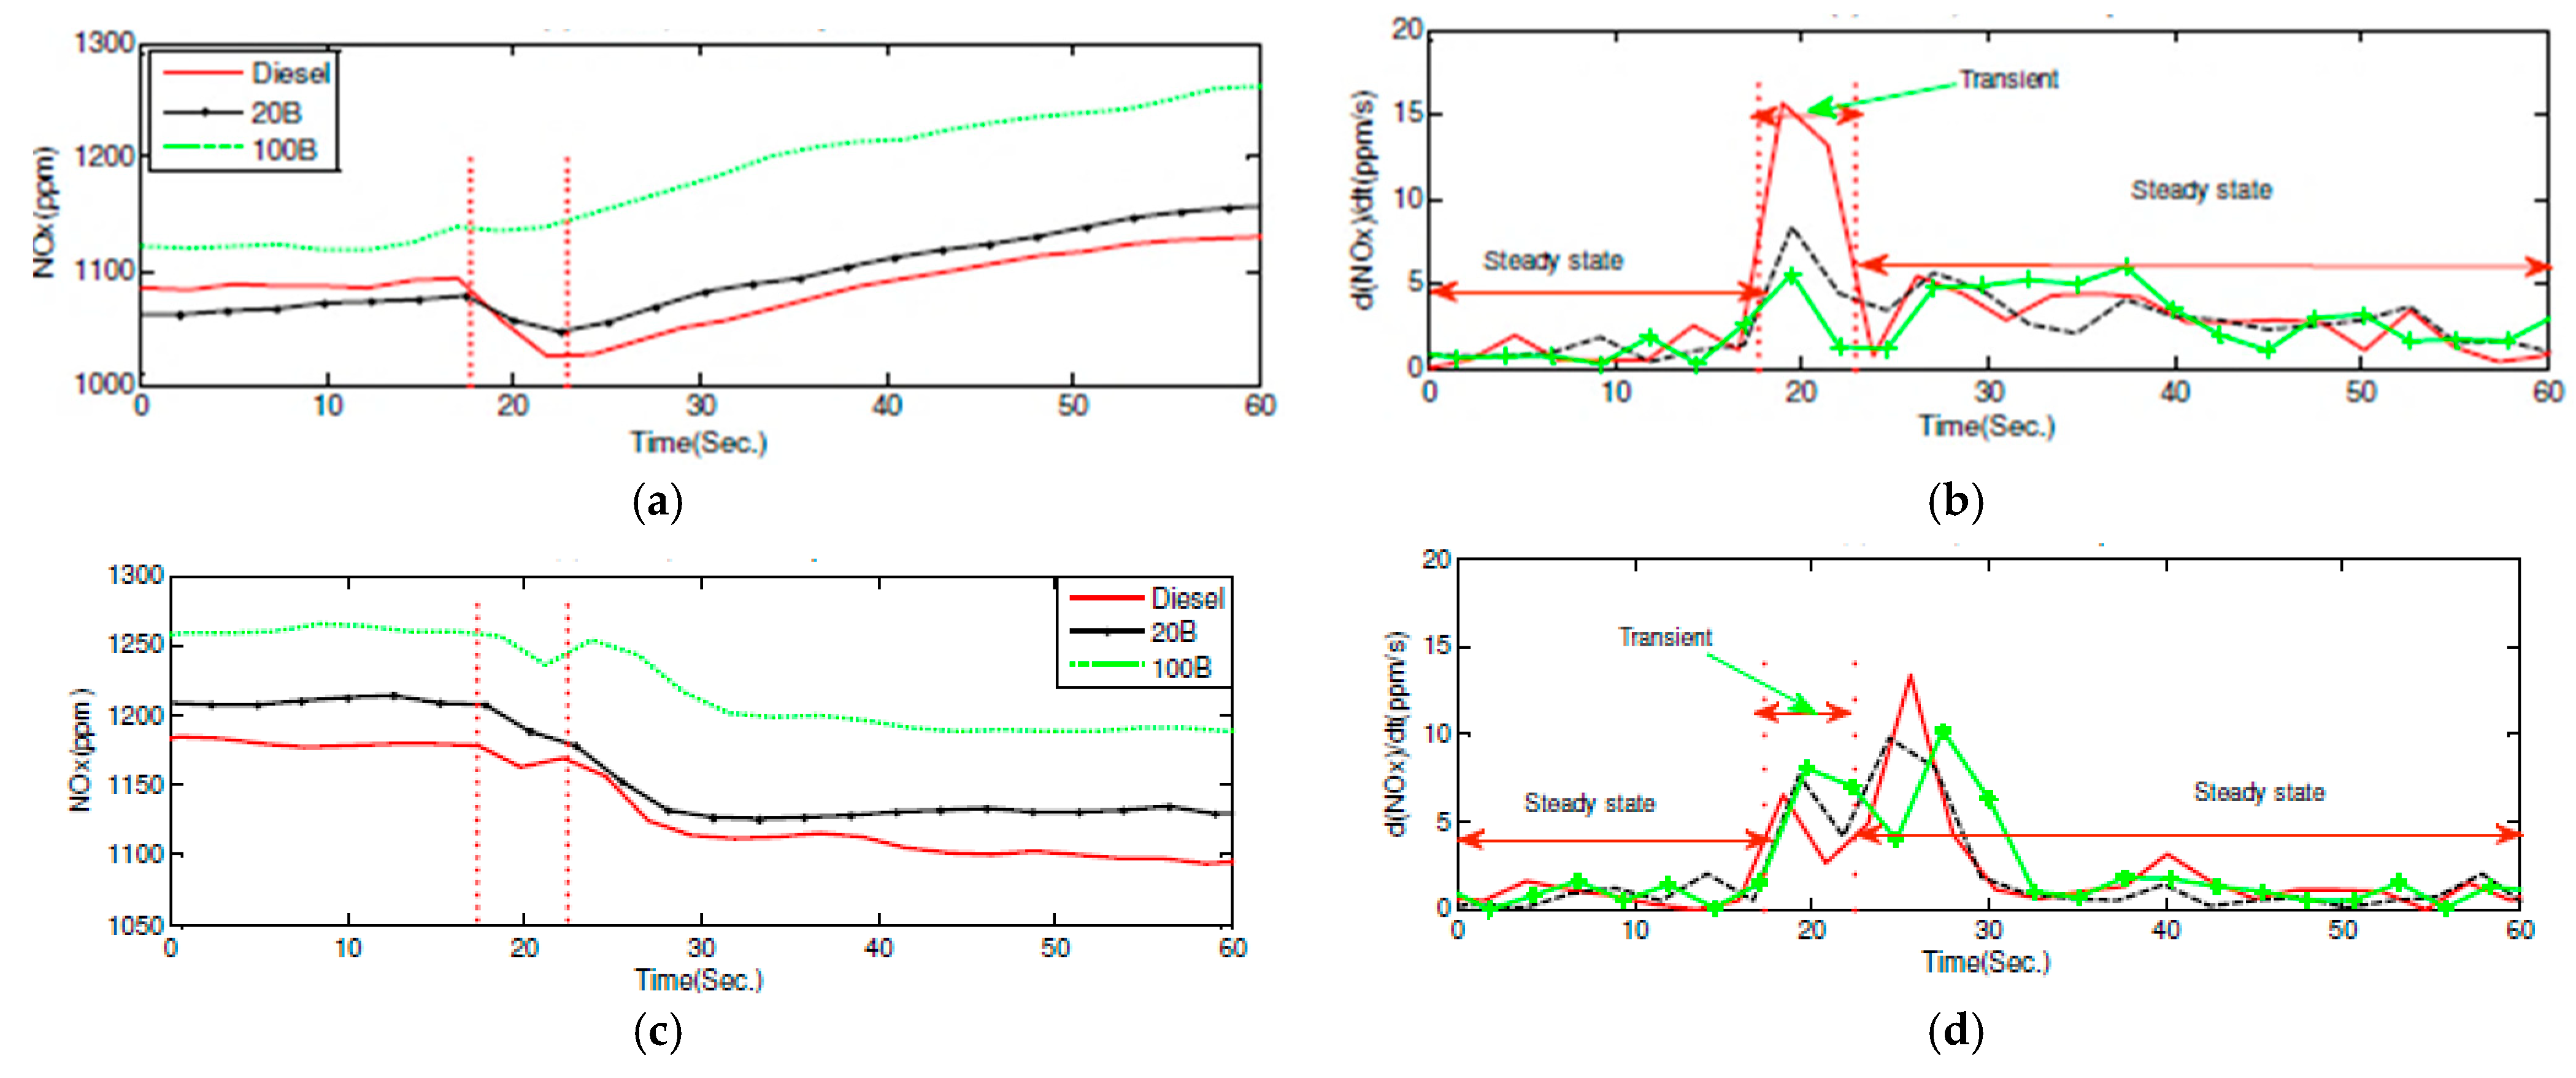
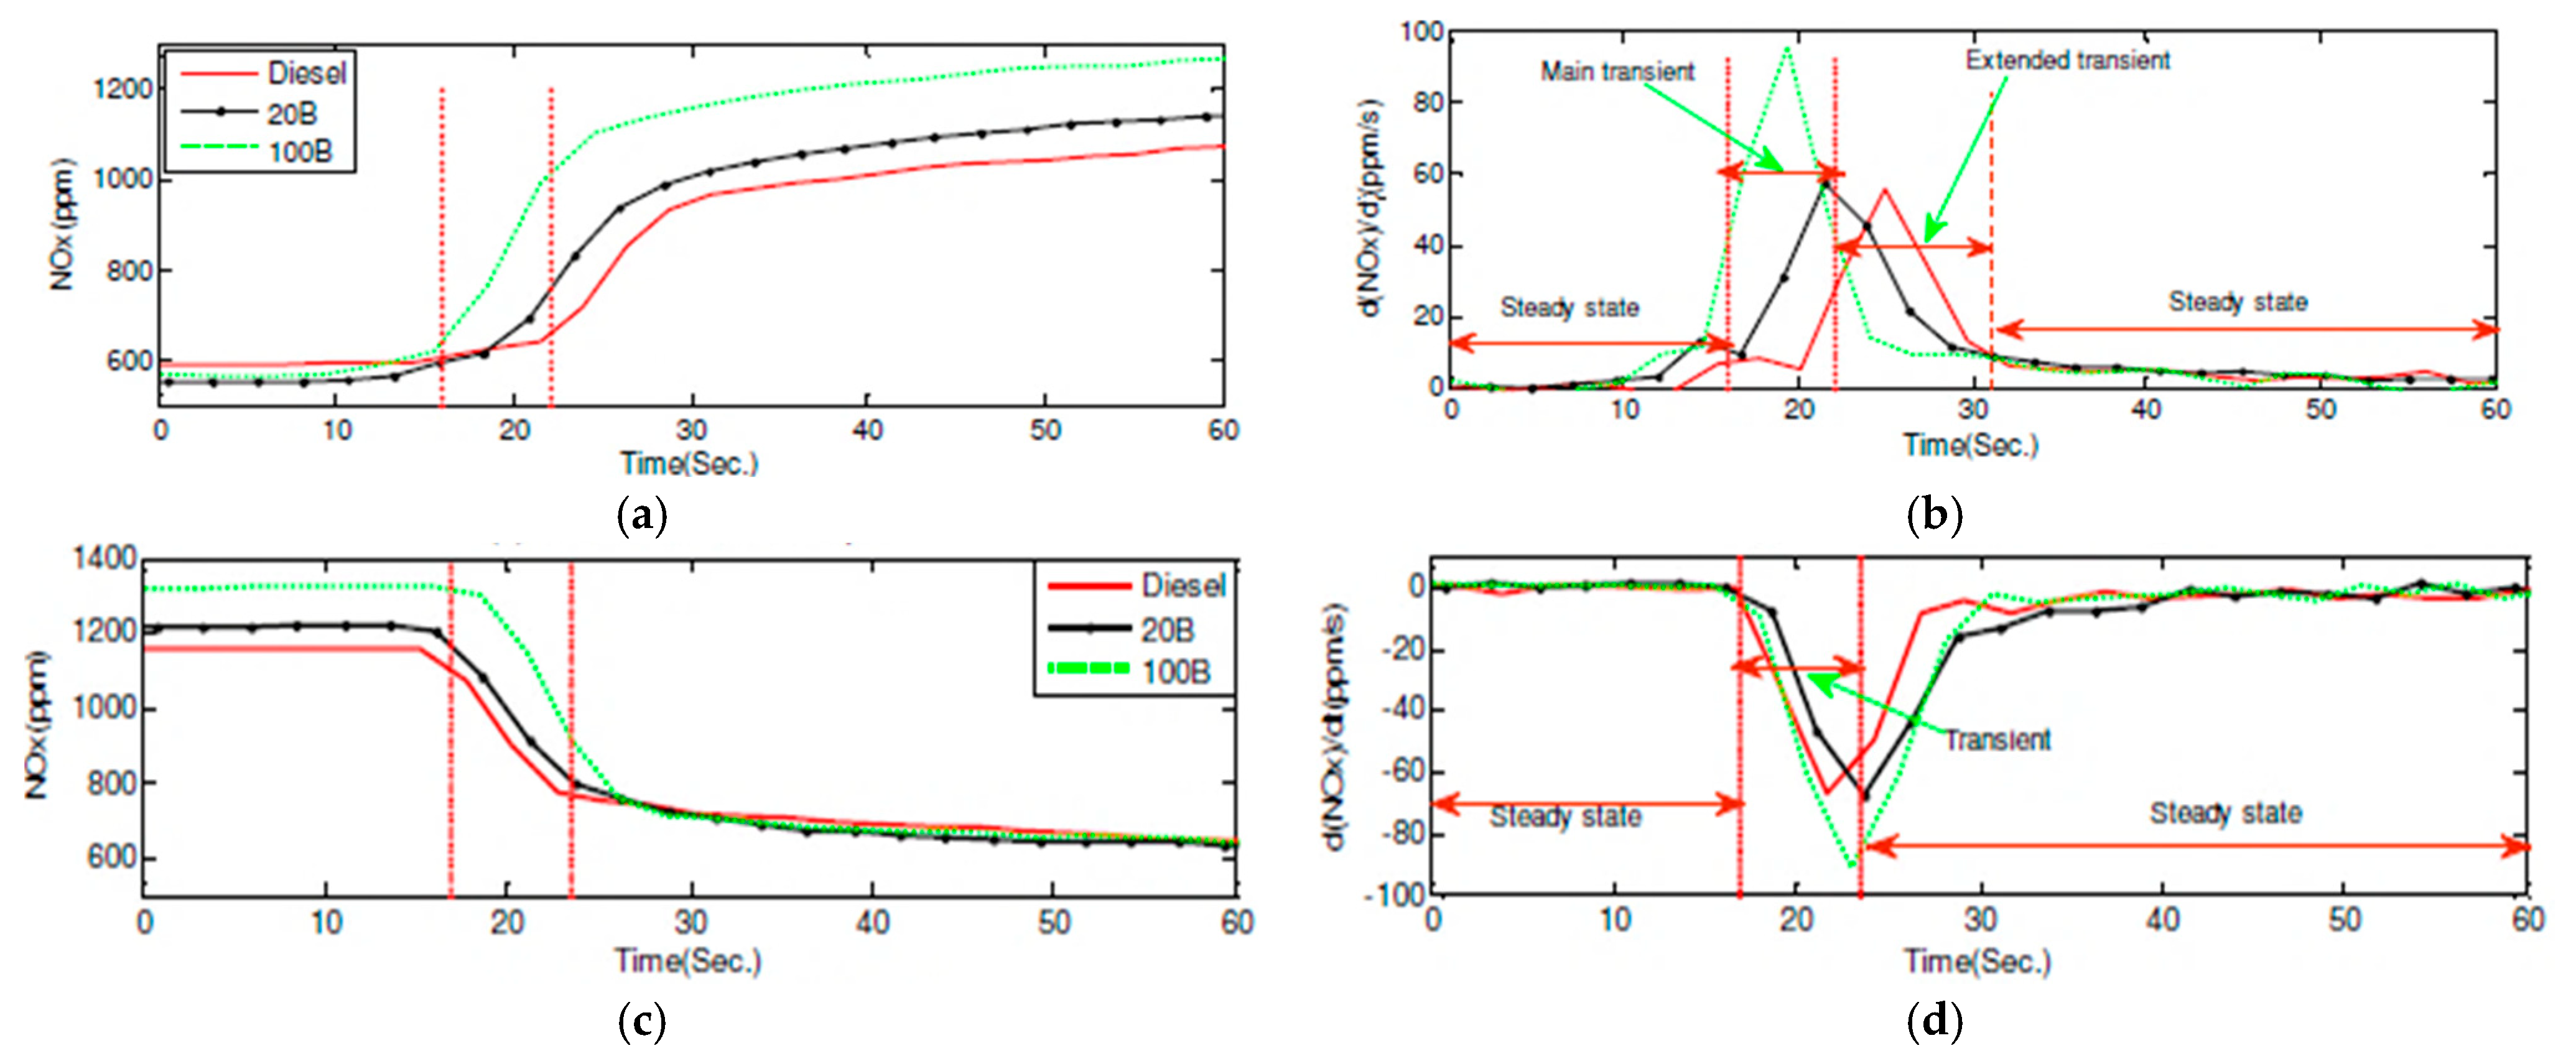
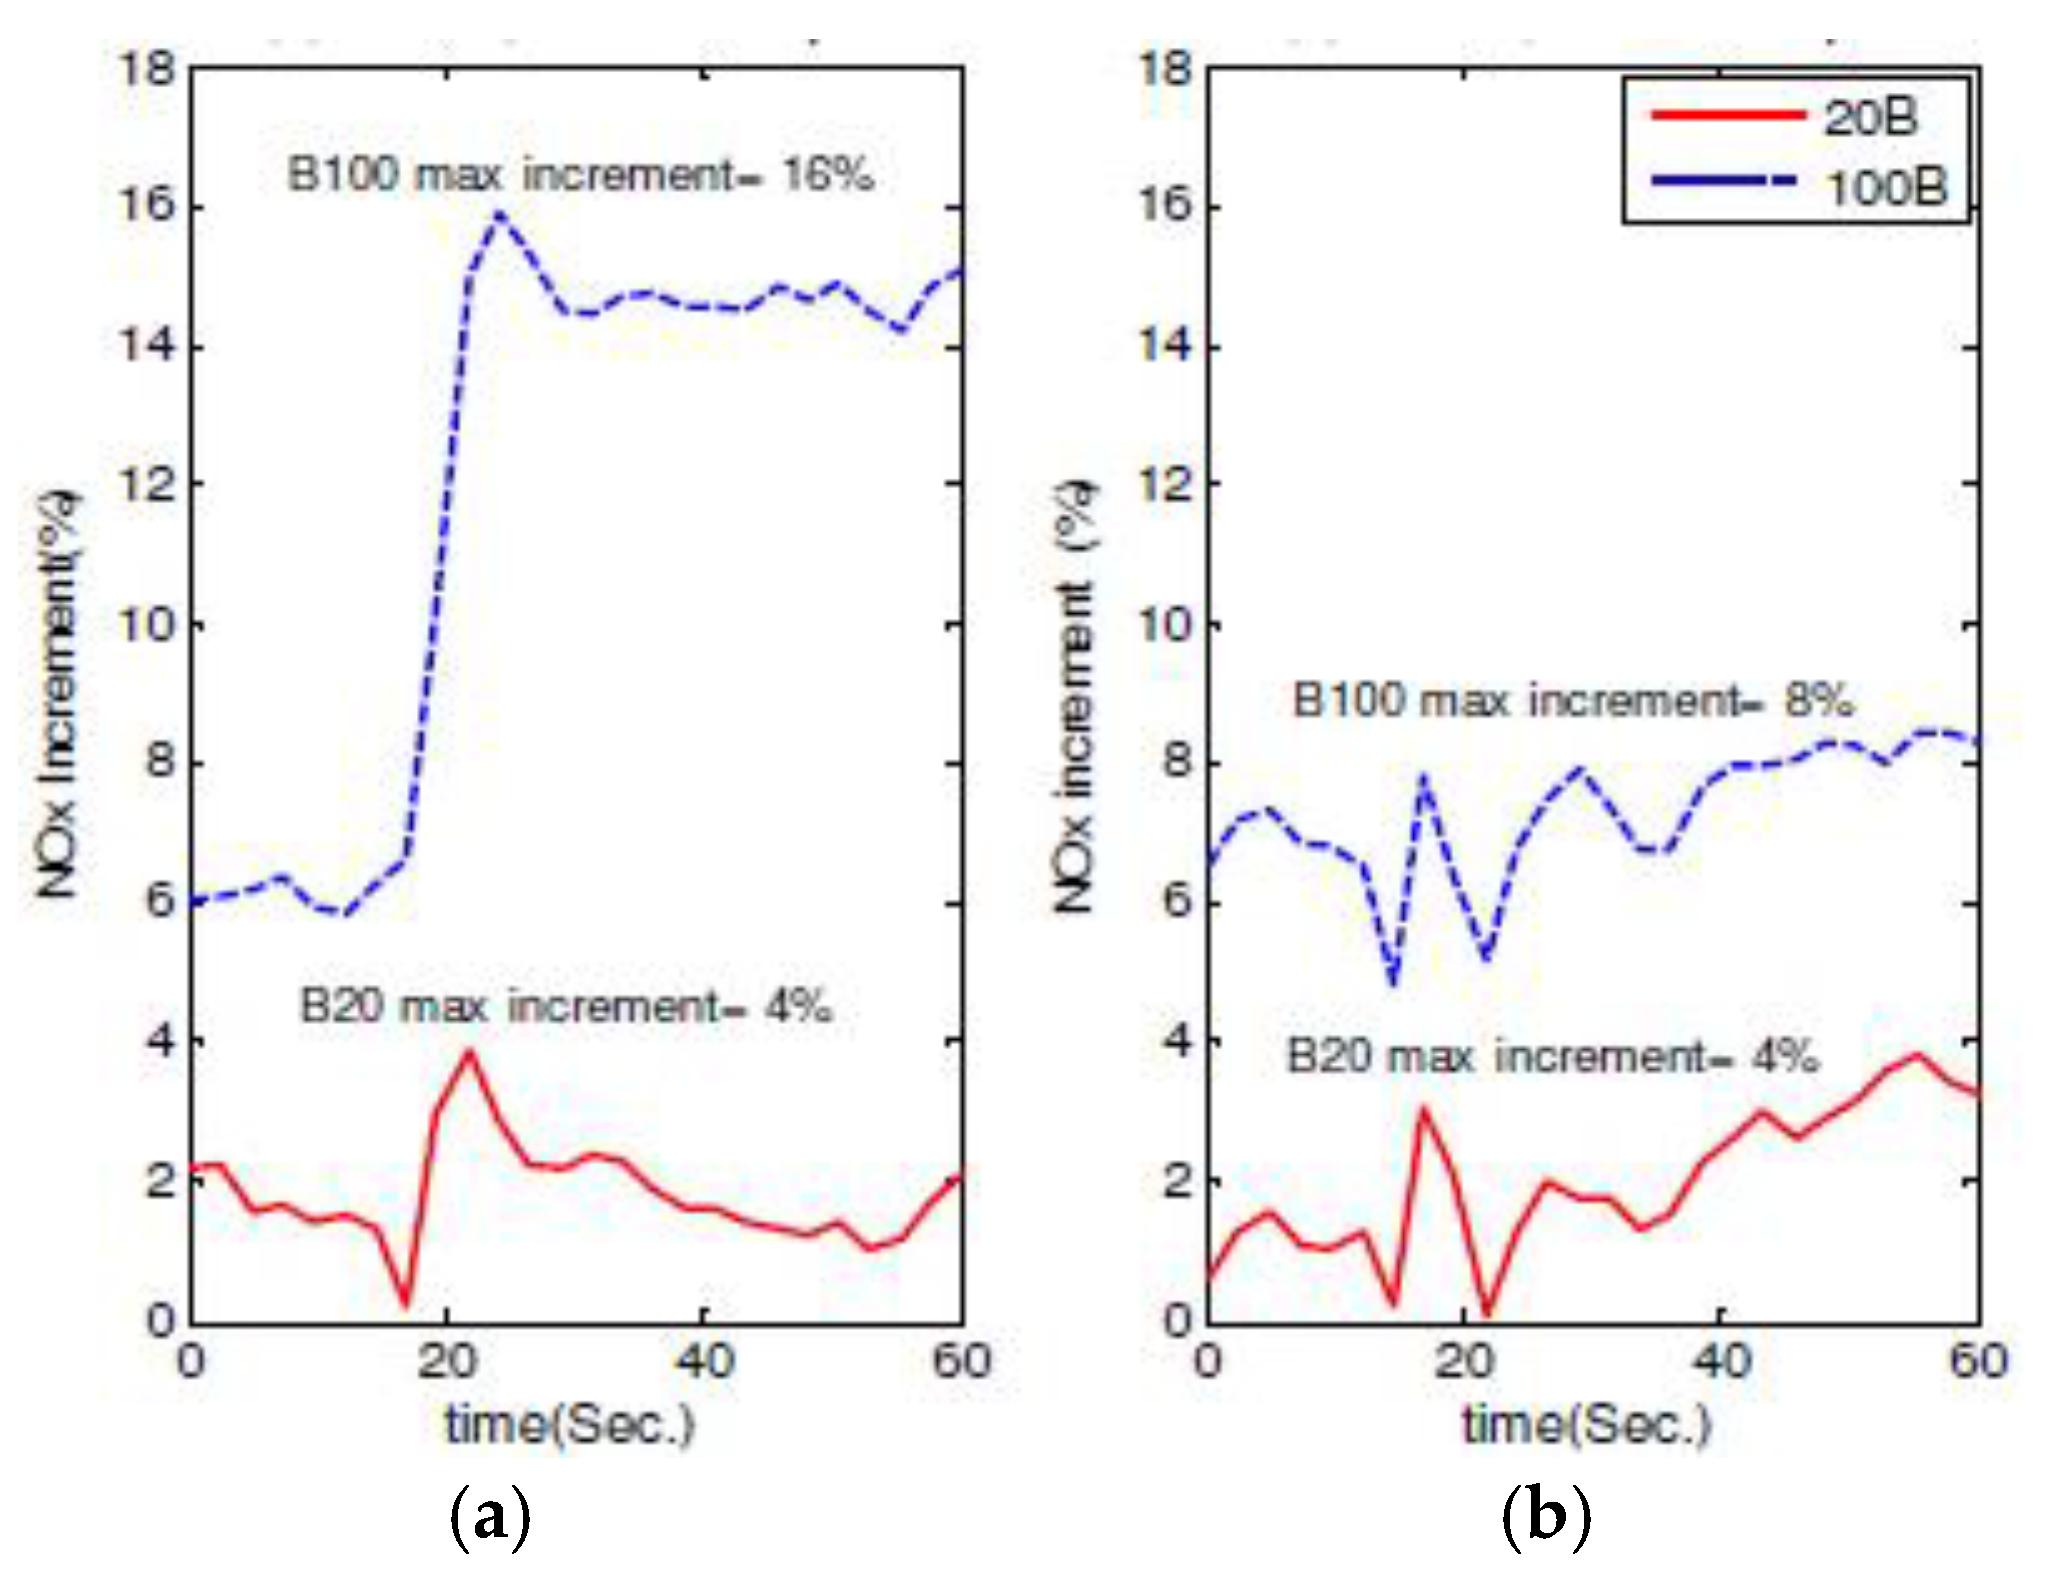
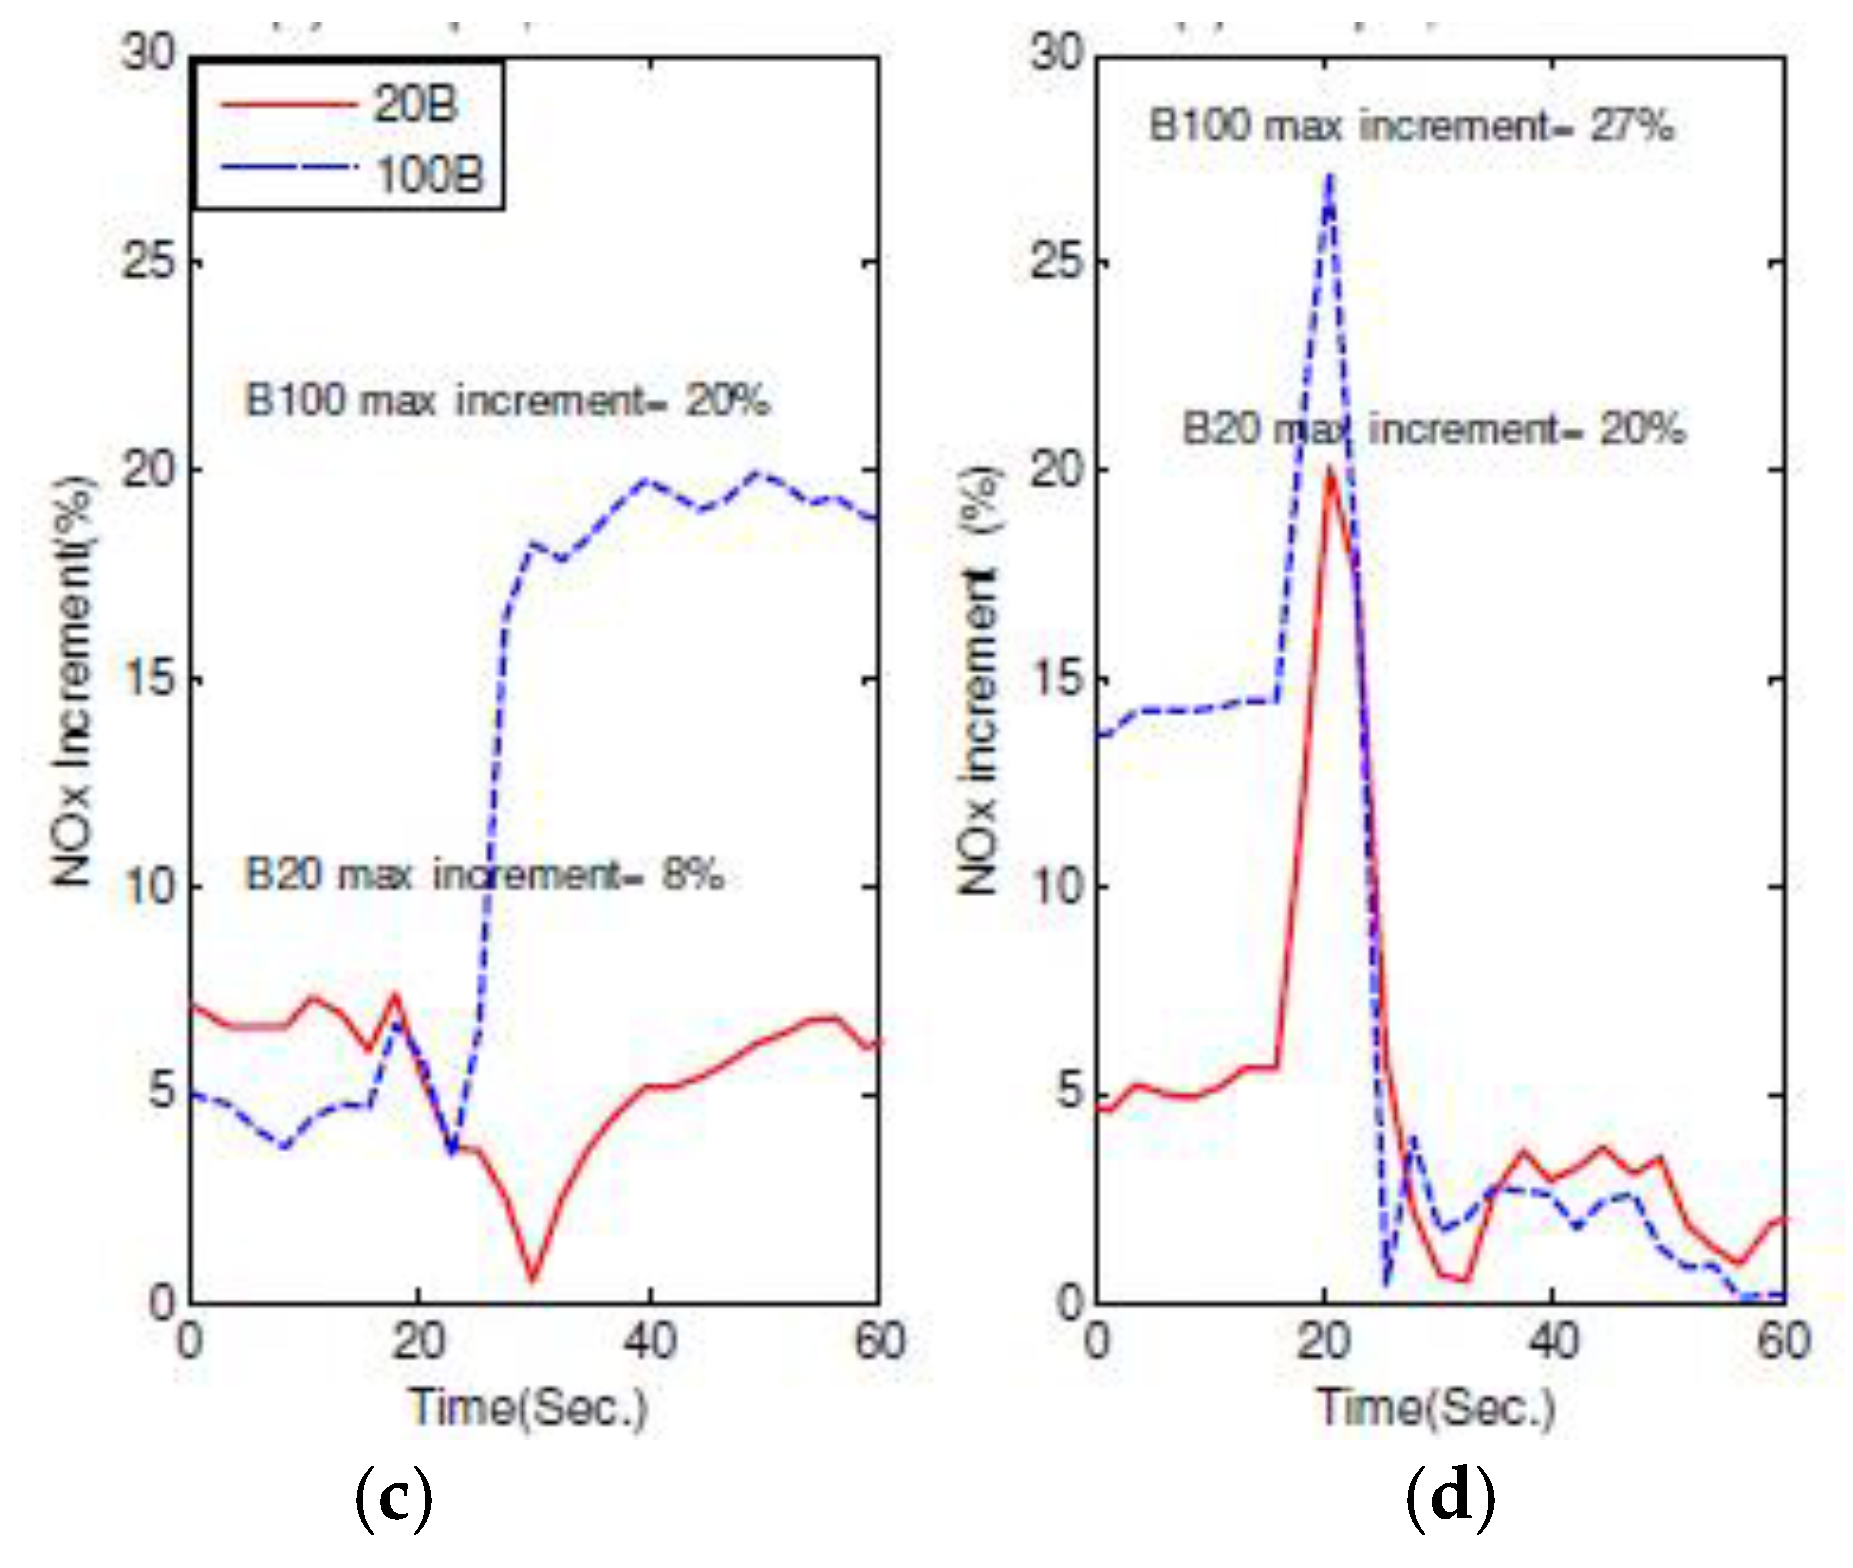
Figure 9 shows CO2 emissions from the engine with diesel and blends 20B and 100B at a speed transient of 1000 rpm to 1500 rpm. The engine load was 420 Nm. It is seen that the CO2 emission at 1000 rpm was higher than that at 1500 rpm by 25%, 35% and 5% for diesel, 20B and 100B fuels, respectively. All these decreased during acceleration. The reason for the decrease is that at higher engine speeds, the fuel/air equivalence ratio of the mix entering the cylinder increased, promoting more complete combustion. To attain the maximum speed, the quantity of fuel required to fully burn in the cylinder increases. Hence, the CO2 emission increases. Figure 9b shows the CO2 emission rate during acceleration.
The emission rates corresponding to diesel and blends 20B and 100B were observed to be irregular. The case with diesel showed the highest rate of change of 0.8%/s. The CO2 emission transient effects continued for 13 s after the transient operation was ended. Figure 10a,b shows the influence of engine deceleration from 1500 to 1000 rpm on CO2 emissions, during which CO2 emission increased with the engine speed decrease. Figure 10b shows that the rate of change of CO2 emission reached a maximum 1.5 s after the start of the engine transient and was stable 13 s after the end of the engine transient. On comparing the CO2 emission rate of change for acceleration (Figure 10b) and deceleration (Figure 10d), we deduce that the former attained a stable condition earlier by 3 s.
Figure 10 shows the effect of the torque transition on the diesel-, 20B- and 100B-fuelled engine’s parameters. In Figure 10a, the CO2 emission increased with the torque increase from 210 to 420 Nm. Figure 10c similarly shows the negative torque transition where the CO2 emission decreased. In both conditions, the engine with the higher torque emitted higher CO2 emissions and may be because there was an increase of the fuel/air equivalence ratio entering the cylinder at the maximum engine load. To produce the maximum torque, the fuel needed to burn completely in the cylinder. This correspondingly produced higher CO2 emissions. Figure 10b–d shows the rates of CO2 emissions to be 0.35%/s and 0.30%/s for the positive and negative torque transients, respectively. The emission rates for the diesel, 20B and 100B were irregular. During the acceleration and deceleration transients, the 100 B test case gave higher CO2 emissions.
Four transient conditions were considered: 1000–1500 rpm, 1500–1000 rpm, 210–420 Nm and 420 Nm–210 Nm. Figure 11 shows that for each, the 20B and 100B fuels resulted in lower CO2 emissions than the diesel fuel during both steady and transient operations. It shows the CO2 emission with the two biodiesel blends during acceleration and deceleration at a load of 420 Nm. The figure shows that during acceleration, 20B and B100 experienced reduced CO2 emission by 53% and 122%. Likewise, during deceleration, the CO2 emission with 20B and 100B reduced by 50% and 107%, respectively. The maximum reduction in emission was attained during the transient operation in both cases. The carbon dioxide emissions reduction remained rather constant during the pre-transient and post-transient steady-state conditions.
Figure 11c,d represents the CI engine’s CO2 emission reduction during the positive torque transient operation. This caused a non-uniform CO2 emission reduction. Figure 11c shows this inconsistent behaviour. Conversely, the CO2 emission was found to reduce by up to 16% and 19%, respectively, when the engine was run with the 20B blend and 100B. During the negative torque transition, with the same fuels, the CO2 emission reduced by up to 18% when compared to diesel. Under the speed transient (1000–1500 rpm) operating conditions investigated, the CO2 emission was maximally reduced due to the lower number of carbon atoms present in biodiesel than in diesel fuel (i.e., biodiesel: 77% and diesel: 87%). Hence, the biodiesel combustion with air gave lower CO2 emissions than diesel does.

3.2.2. NOx Emission

Figure 12 shows the effect of biodiesel blends on NOx emission from the CI engine at a speed transient of 1000–1500 rpm and a load of 420 Nm. It reveals fairly constant NOx emission values at pre-transient operation. On the other hand, post-transient, the NOx emission values increased as time progresses. This is because of the increased fuel/air equivalence ratio at higher engine speeds. During high torque and high-speed conditions, fuel is required to burn completely in the cylinder, and this causes higher NOx emissions. Figure 12b shows that the NOx emission rates for the speed acceleration are fairly uniform at both pre-transient and post-transient conditions for diesel, 20B and 100B. The rate of change of NOx emission for engine operation with biodiesel was lower than when both 20B and diesel were used. The engine run with diesel exhibited the highest rate of change of NOx emissions at 16 ppm/s.
Figure 12c,d depicts the effect of engine deceleration on NOx emission during the 1500–1000 rpm speed transient where the emission increased with the decrease in engine speed. Figure 12c shows that the rate of change of emission with time was nearly zero during pre-transient and post-transient operation. The maximum NOx emission rate was reached 3 s after the scheduled transient operation. On comparing the NOx acceleration and deceleration emission rates of change, it was found that the former emission rate was higher than the latter during the time range considered. In summary, both acceleration and deceleration resulted in higher NOx emissions for the engine run with 100 B.
Figure 13 shows the NOx emission values from the CI engine using diesel, the 20B blend and 100 B at 1500 rpm. These were measured during positive and negative torque transitions, respectively. Figure 13a shows that the NOx emission sharply increased with an increase in torque from 210 to 420 Nm. Correspondingly, Figure 13 a shows that the NOx emission decreased during the torque transition from 420 to 210 Nm. In both cases, the higher torque condition emitted higher NOx emission, and this is because, at the maximum engine load, the input fuel/air equivalence ratio increased. Figure 13b–d shows the rates of change of NOx emission in the positive and negative torque transitions for the three fuels. The 100 B fuel resulted in a higher rate of change in NOx emission in both directions of torque transition, with the maximum rate of 95% for the positive torque and 92% for the negative torque transient. The pre- and post-transient NOx emission rates were nearly zero for both positive and negative torque transitions. Post-transient, the transition effects on NOx emission were sustained for 10 s after the transition time.
Figure 14 shows the NOx emission increase by 20B and 100B over and above the value corresponding to the use of diesel fuel at a constant torque of 420 Nm. The values were measured during the 1000–1500 rpm and 1500–1000 rpm acceleration and deceleration, respectively. The NOx emission increased by around 3 and 16%, respectively, in comparison to the engine conditions when running with diesel fuel. Likewise, deceleration also increased the NOx emission by approximately 4 and 8% for the 20B biodiesel blend and 100 B, respectively. In Figure 14a, it is seen that the NOx emission sharply increases during the speed transient of 1000–1500 rpm and can be based on the fact that as the engine speed increases, the in-cylinder temperature increased, hence the increase in NOx emissions. Meanwhile, during the deceleration operation, the engine speed reduced, and the in-cylinder temperature gradually decreased because of the heat transfer, which results in a slow reduction of NOx emission. Figure 14b shows the effect of the torque transition on the NOx emission of the engine burning biodiesel at 1500 rpm.
The CI engine’s NOx emission characteristics running with 20B and 100B are shown in Figure 14c. It shows that there was an increase of up to 8% and 20%, respectively, during the positive torque transient of 210–420 Nm. Likewise, the NOx emission of the engine increased by approximately 20% for 20B and 27% for 100B. Biodiesel showed higher NOx emission, and this may because of the advanced combustion process occasioned by its higher viscosity and density. Its lower compressibility characteristics are also a factor. When biodiesel is injected into the engine’s cylinder, a rise in pressure occurs due to the pressure energy of the injection pump and due to the lower compressibility and hence higher bulk modulus. This causes quicker propagation towards the injectors. Effectively, the cylinder gas becomes fuel-rich and produces a higher peak temperature that promotes NOx formation.

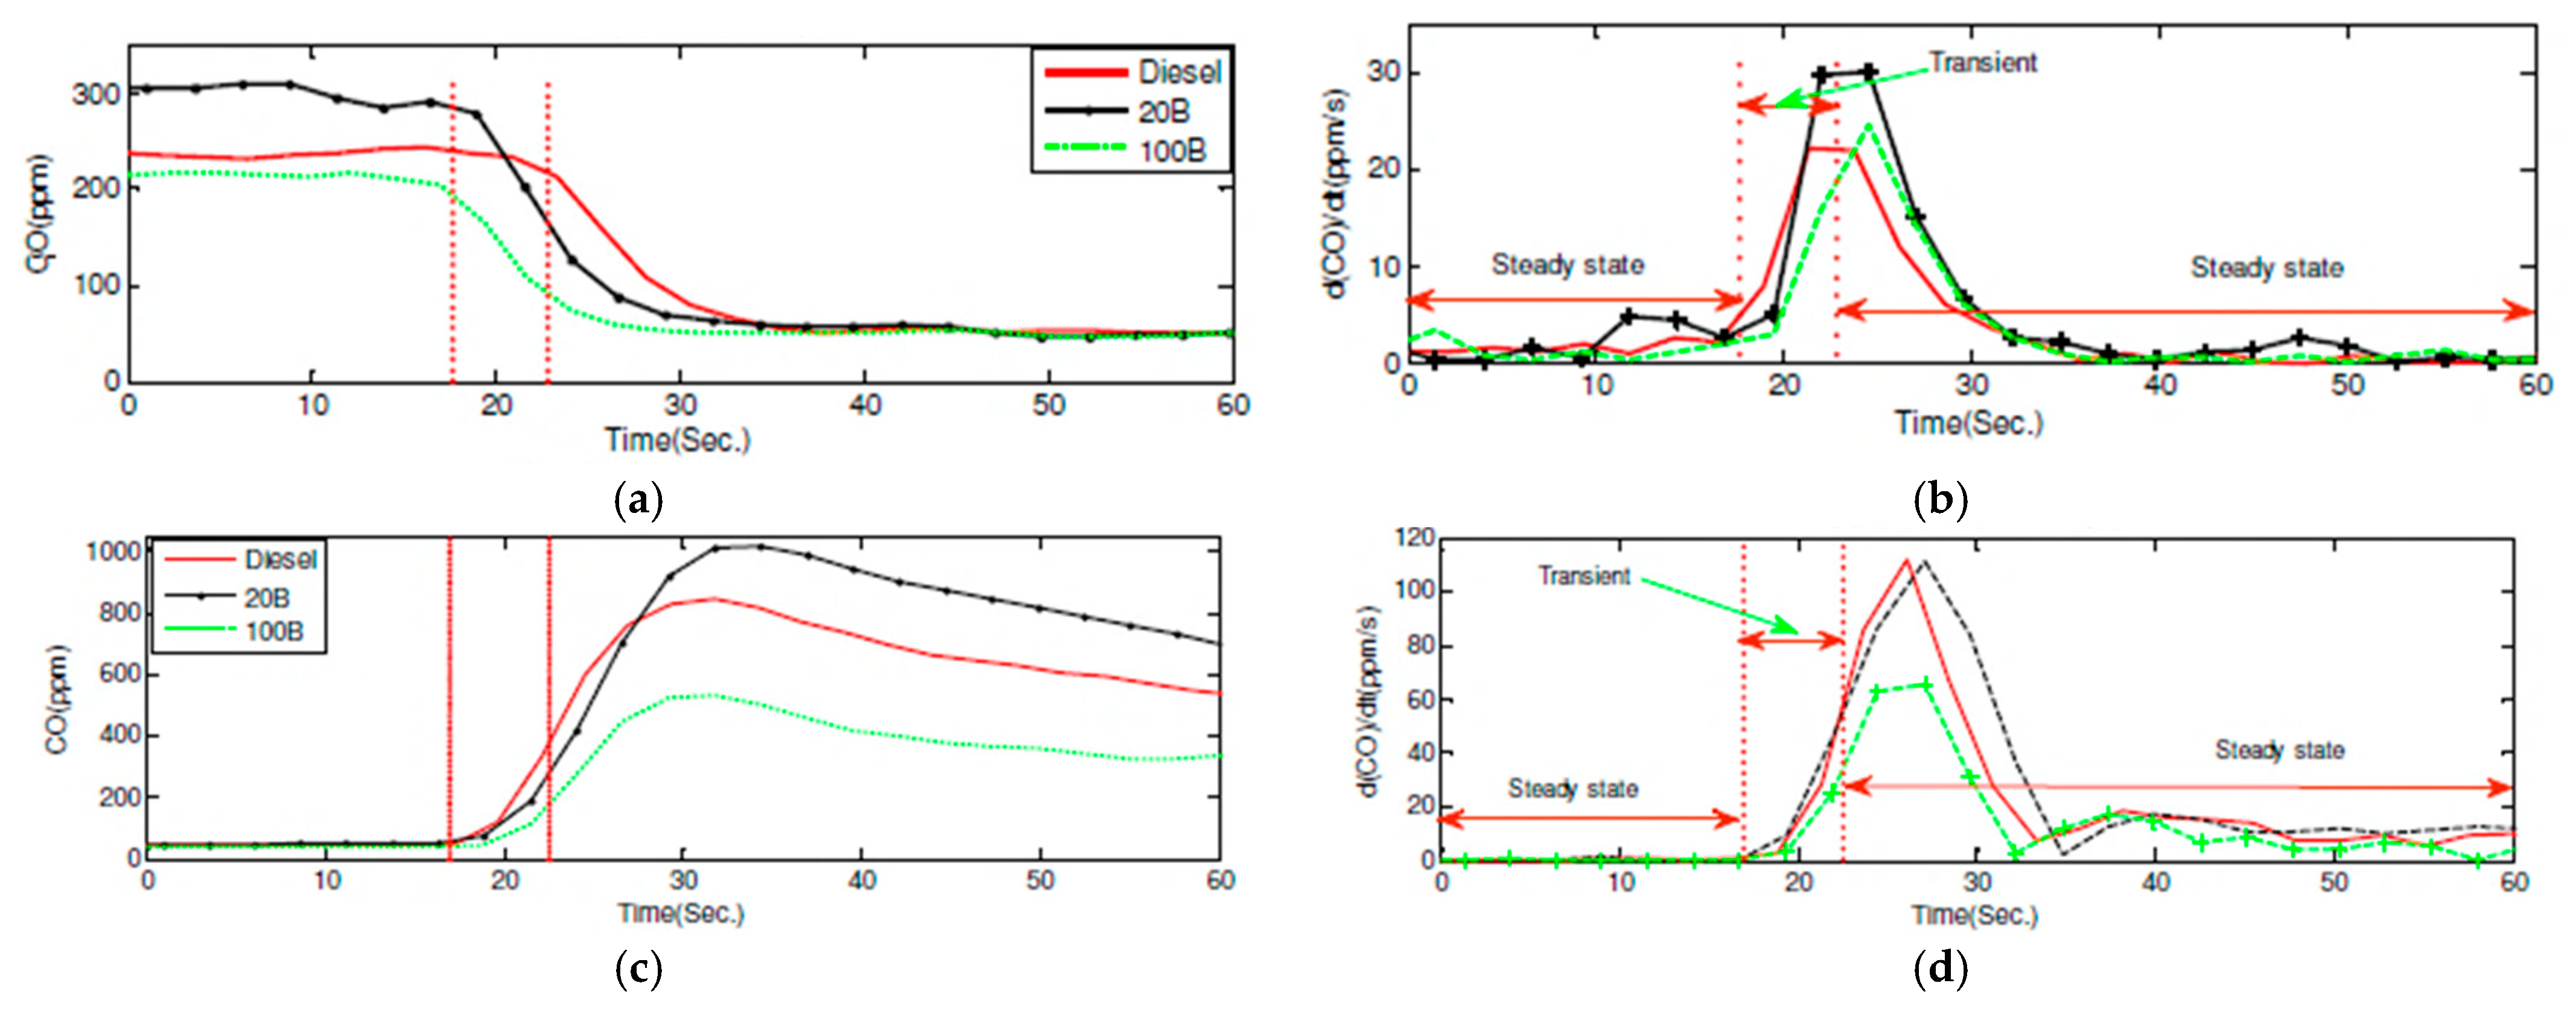
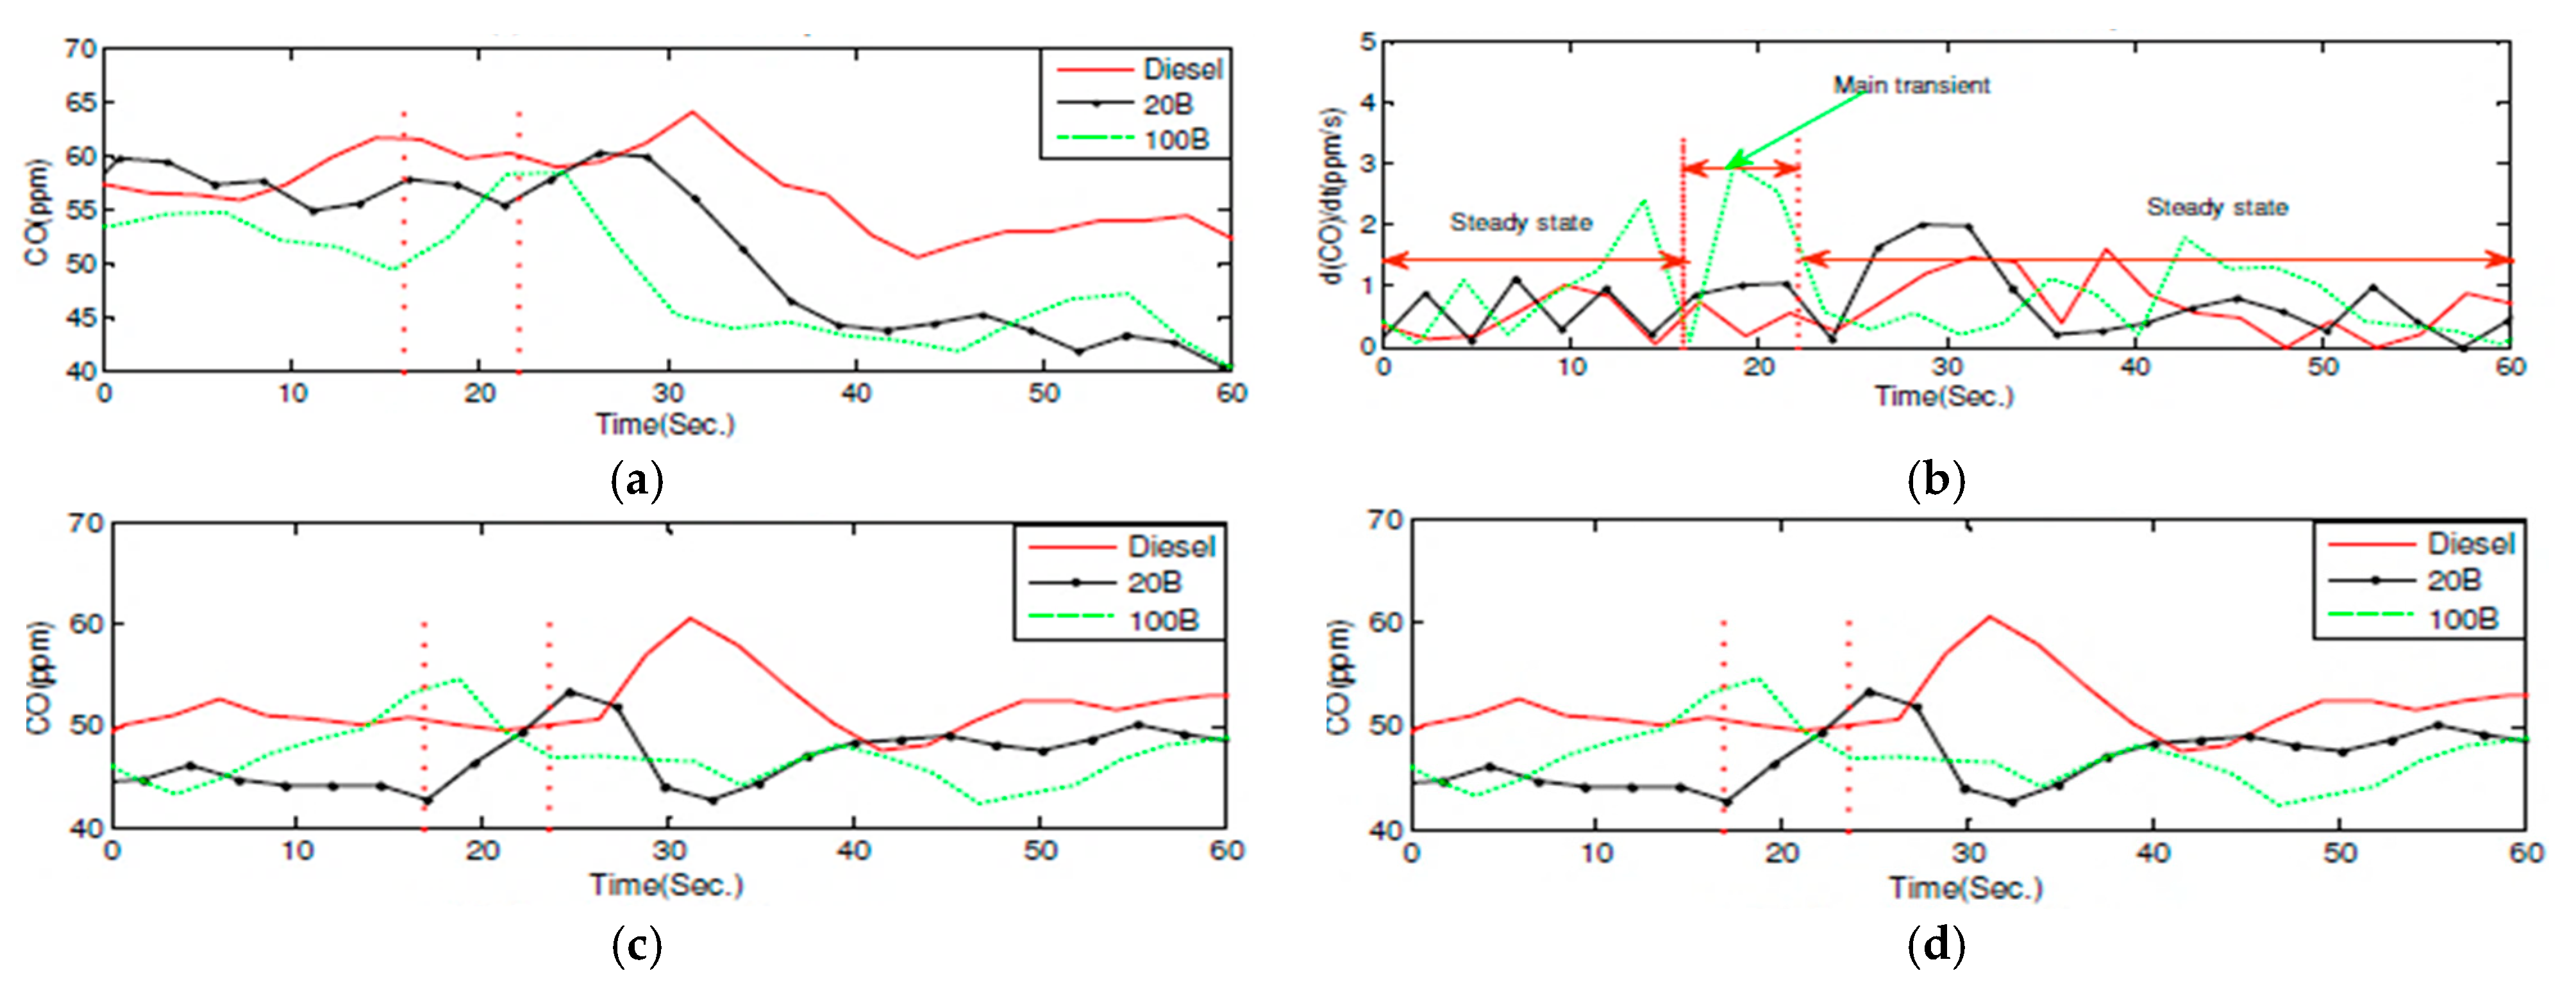
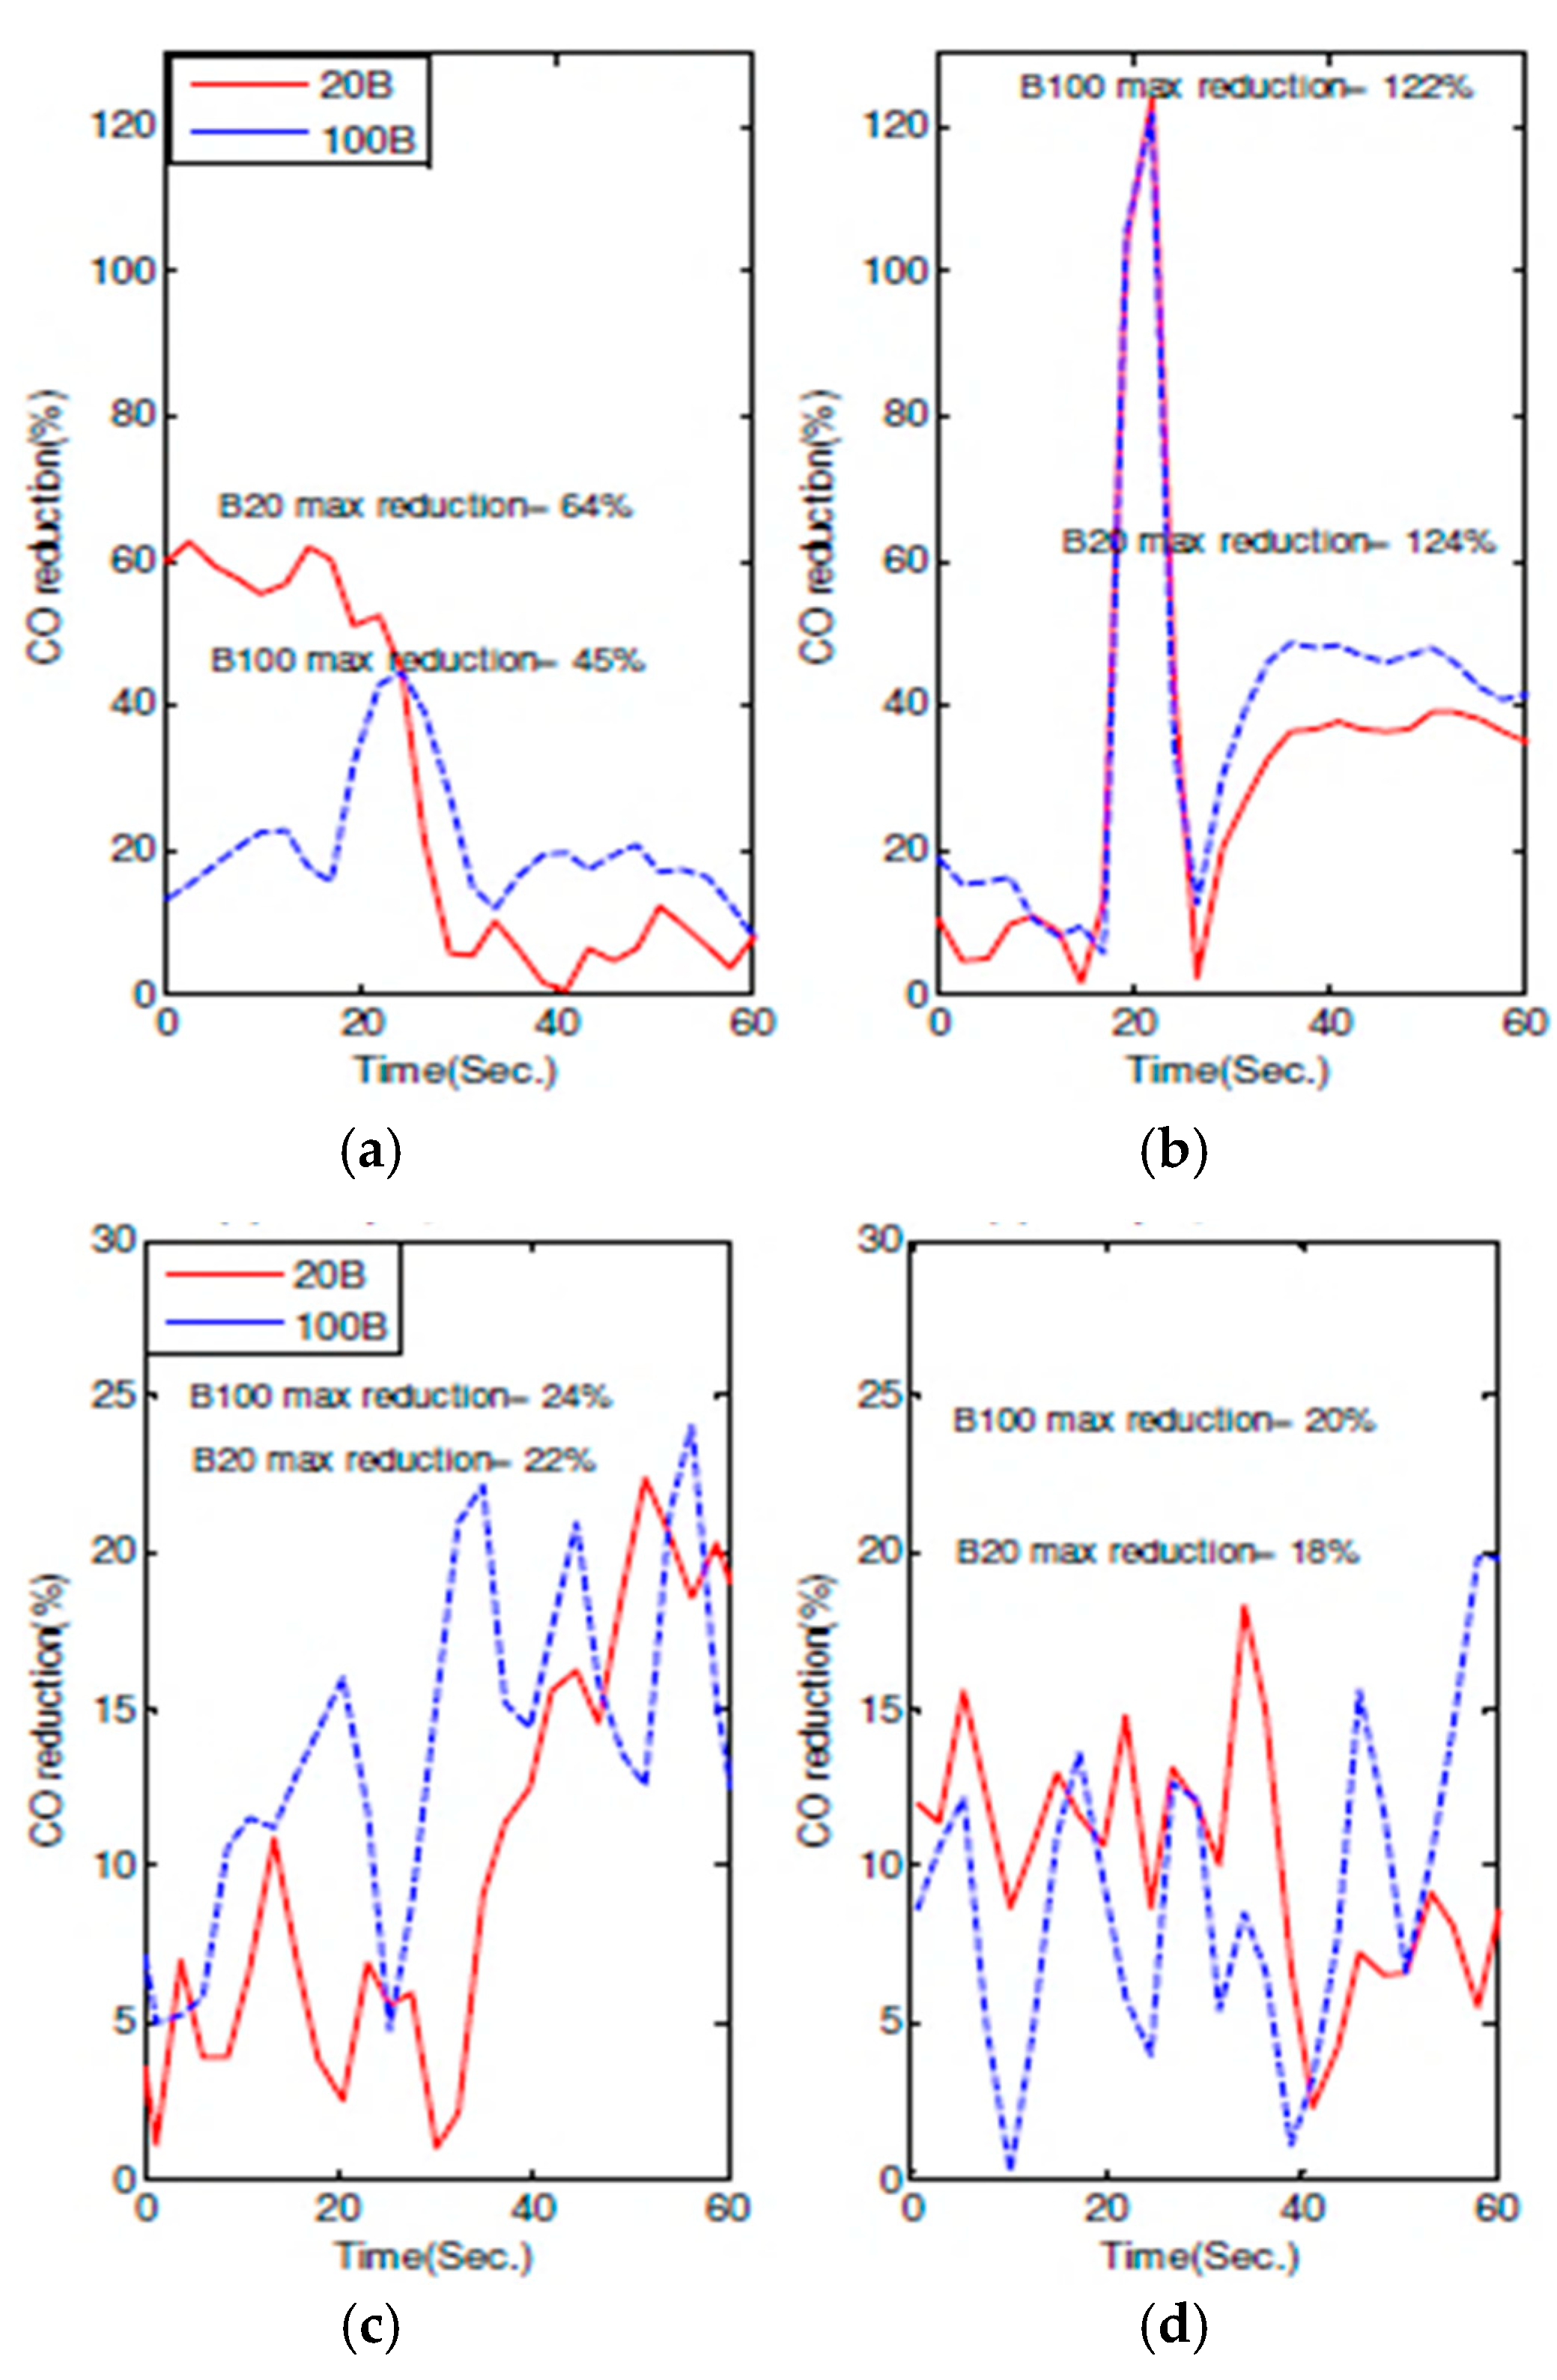
3.2.3. Carbon Monoxide (CO) Emission

Figure 15 shows the CI engine’s CO emission at a load of 420 Nm. The measurements were carried out at a speed transient of 1000 to 1500 rpm. It shows that the engine produces higher CO emissions during the lower engine speeds. This may be explained on the basis that at lower engine speeds, the temperature of the gases inside the cylinder was lower, which affects CO conversion to CO2. Figure 15a–c shows that the trends of CO and CO2 emission are opposite. At higher engine speeds, where the air/fuel equivalence ratios increased, there was a rise in the in-cylinder gas temperature. This correspondingly led to an increase in the kinetics or reaction rate of CO conversion to CO2, hence leading to lower CO emissions. Figure 15b depicts the rate of change of CO emissions where 20B gave the highest rate of emissions. This is followed by diesel in the transient stage. An extension to the effects of the transient operation occurred well into the post-transient steady conditions. Furthermore, the rate of change of CO emission extended beyond 16 s after the transient operation. In summary, the pre- and post-transient CO emission rate of change was nearly zero, indicating no rise in CO emission under steady operating conditions. Figure 15c gives the CI engine’s CO emission trend with time during speed deceleration from 1500 to 1000 rpm. It shows that the engine’s CO emission suddenly increased as the engine acceleration increased. Nonetheless, the major effects of the transient operation on CO emission became apparent after transient operations. Correspondingly, as given in Figure 15d, the transient effects continued for 18 s after the transient operation with diesel and 20B, producing maximum CO emission rates of approximately 110 ppm/s.
Figure 16 shows the effects of torque transition at 1500 rpm on CO emission of the engine running with diesel, 20B and 100B fuels. Figure 16a and Figure 17a show that the torque transients had no significant effects on CO emission at both positive and negative transients. In both transient directions, the emission rate varied between 0 and 3 ppm/s. These are as indicated in Figure 16b and Figure 17b where the maximum CO emission rate was 3 ppm/s during both transients.
Figure 17 indicates the influence of the biodiesel blend on the CI engine’s CO emission at speed and torque transients. During the speed transition condition, the engine running with 20B and 100B gave a decrease in CO emissions by up to 39 and 45%, respectively. During deceleration, the peak increases of 122% and 124% in CO emissions were attained for 20B and 100B, respectively. Consequently, Figure 19 shows the effect of fuel on CO emission at an engine speed of 1500 rpm during the torque transient. It is clear from the figure that the engine’s CO emission with 20B and 100B reduced by 22% and 24% for positive torque transition, and 18% and 22% for negative torque transition, respectively.

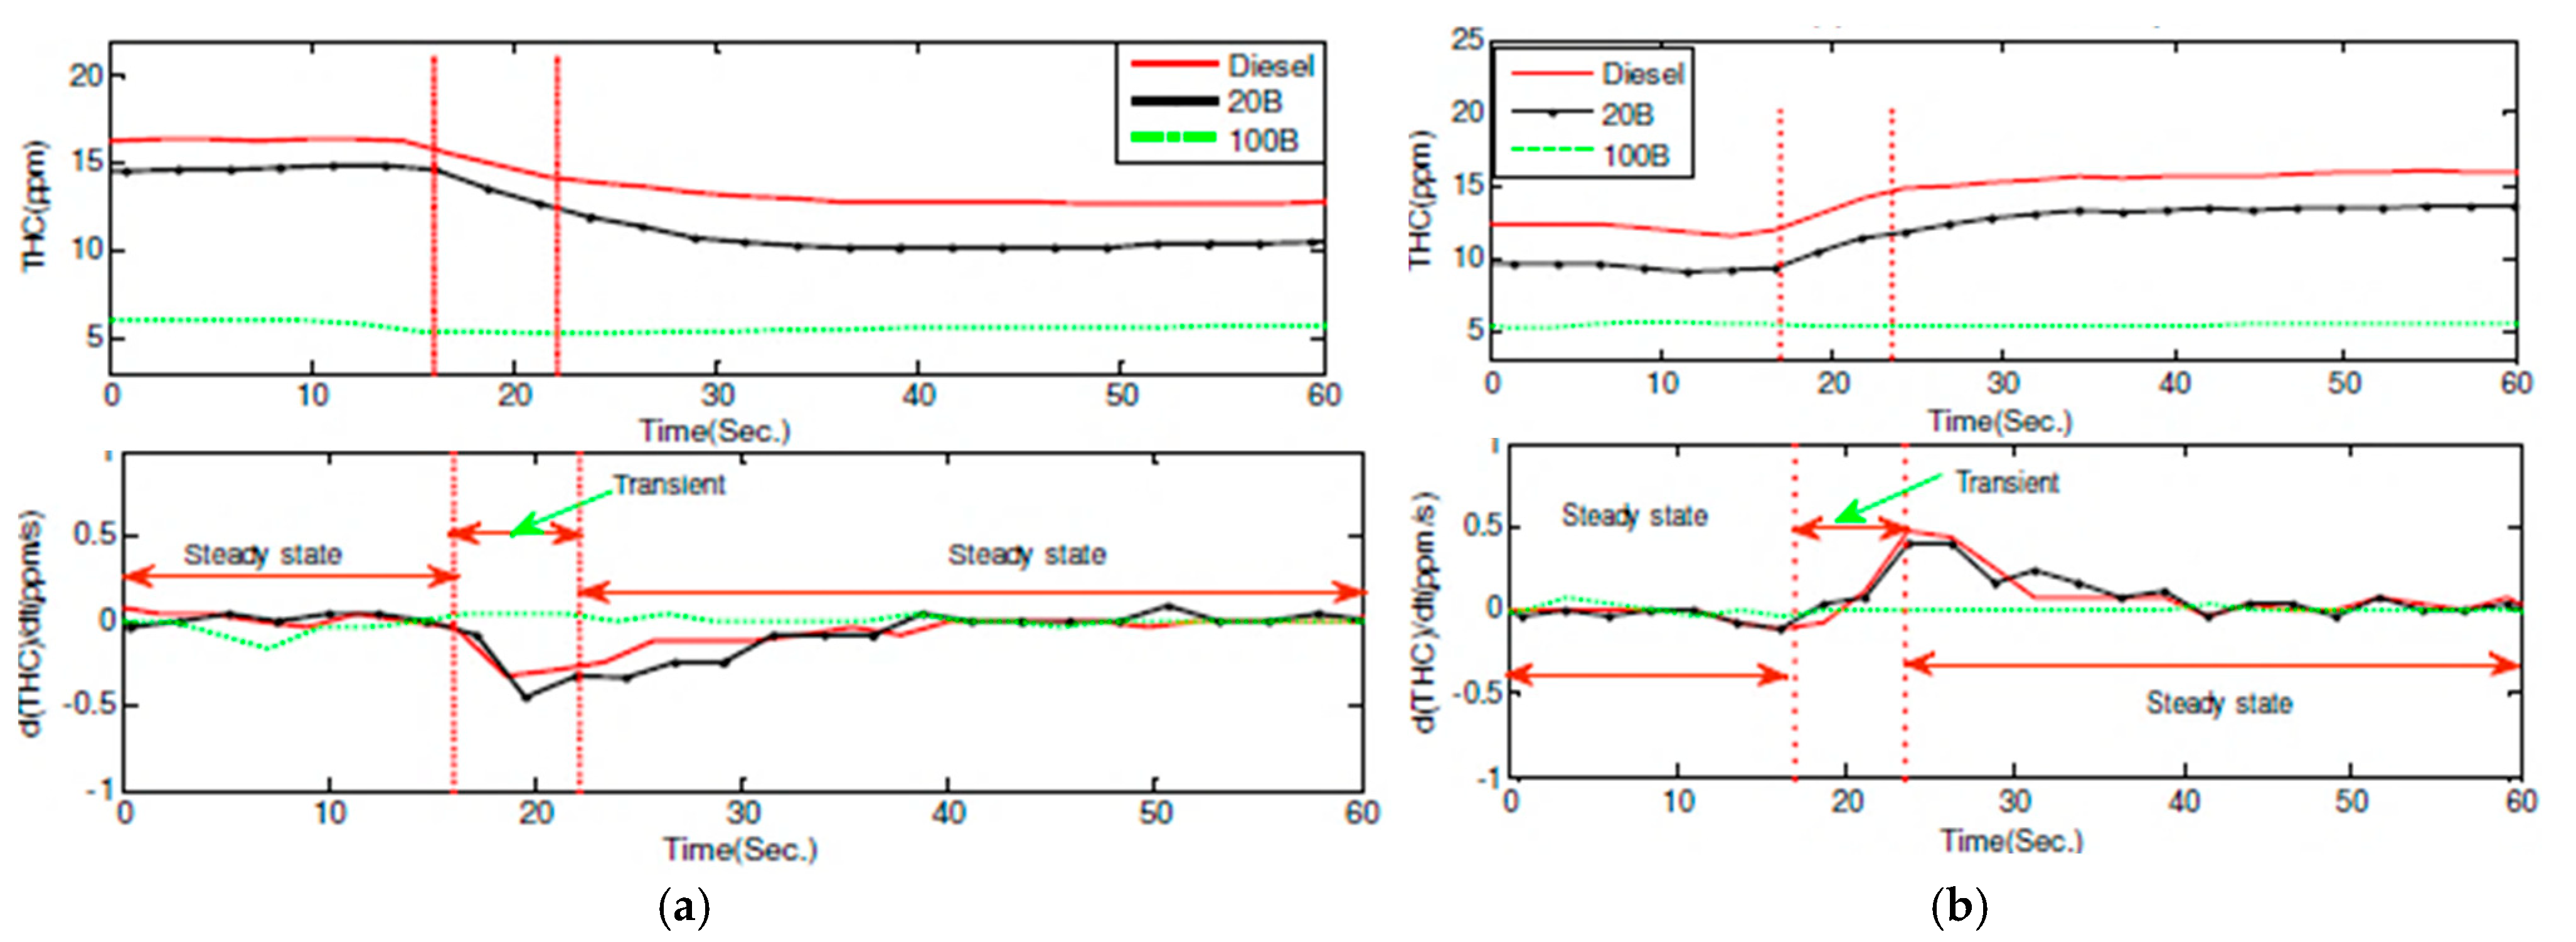
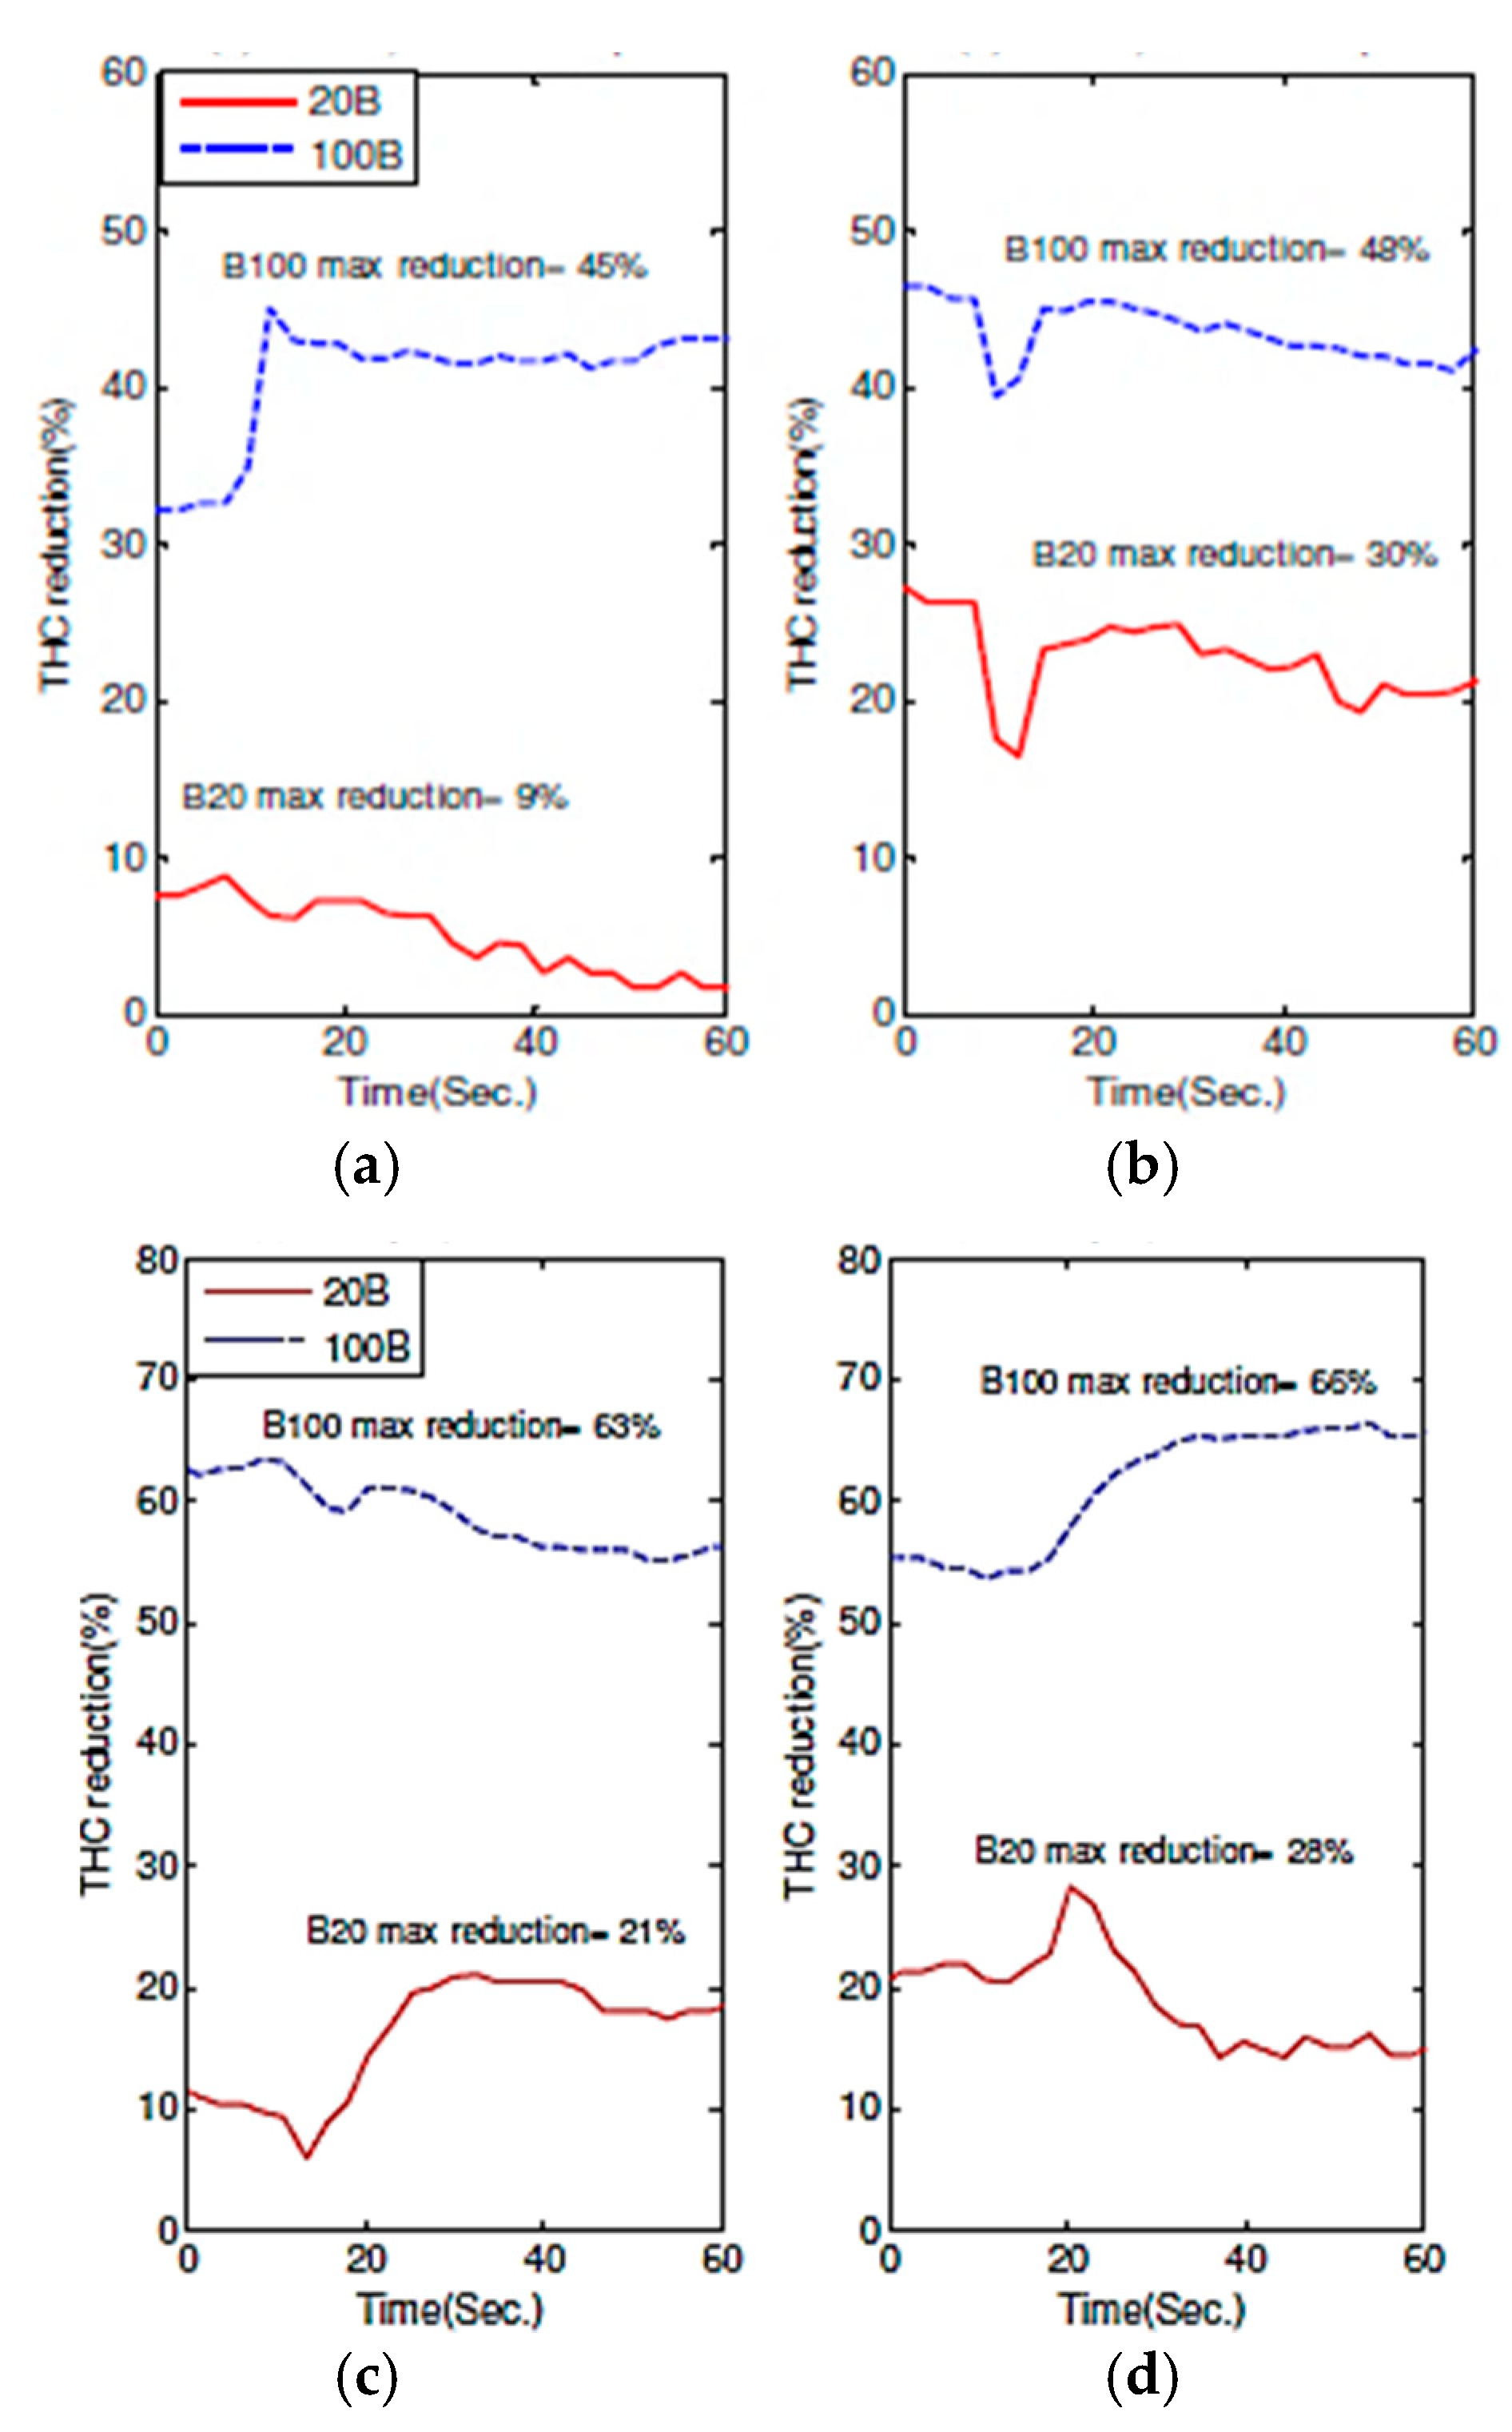
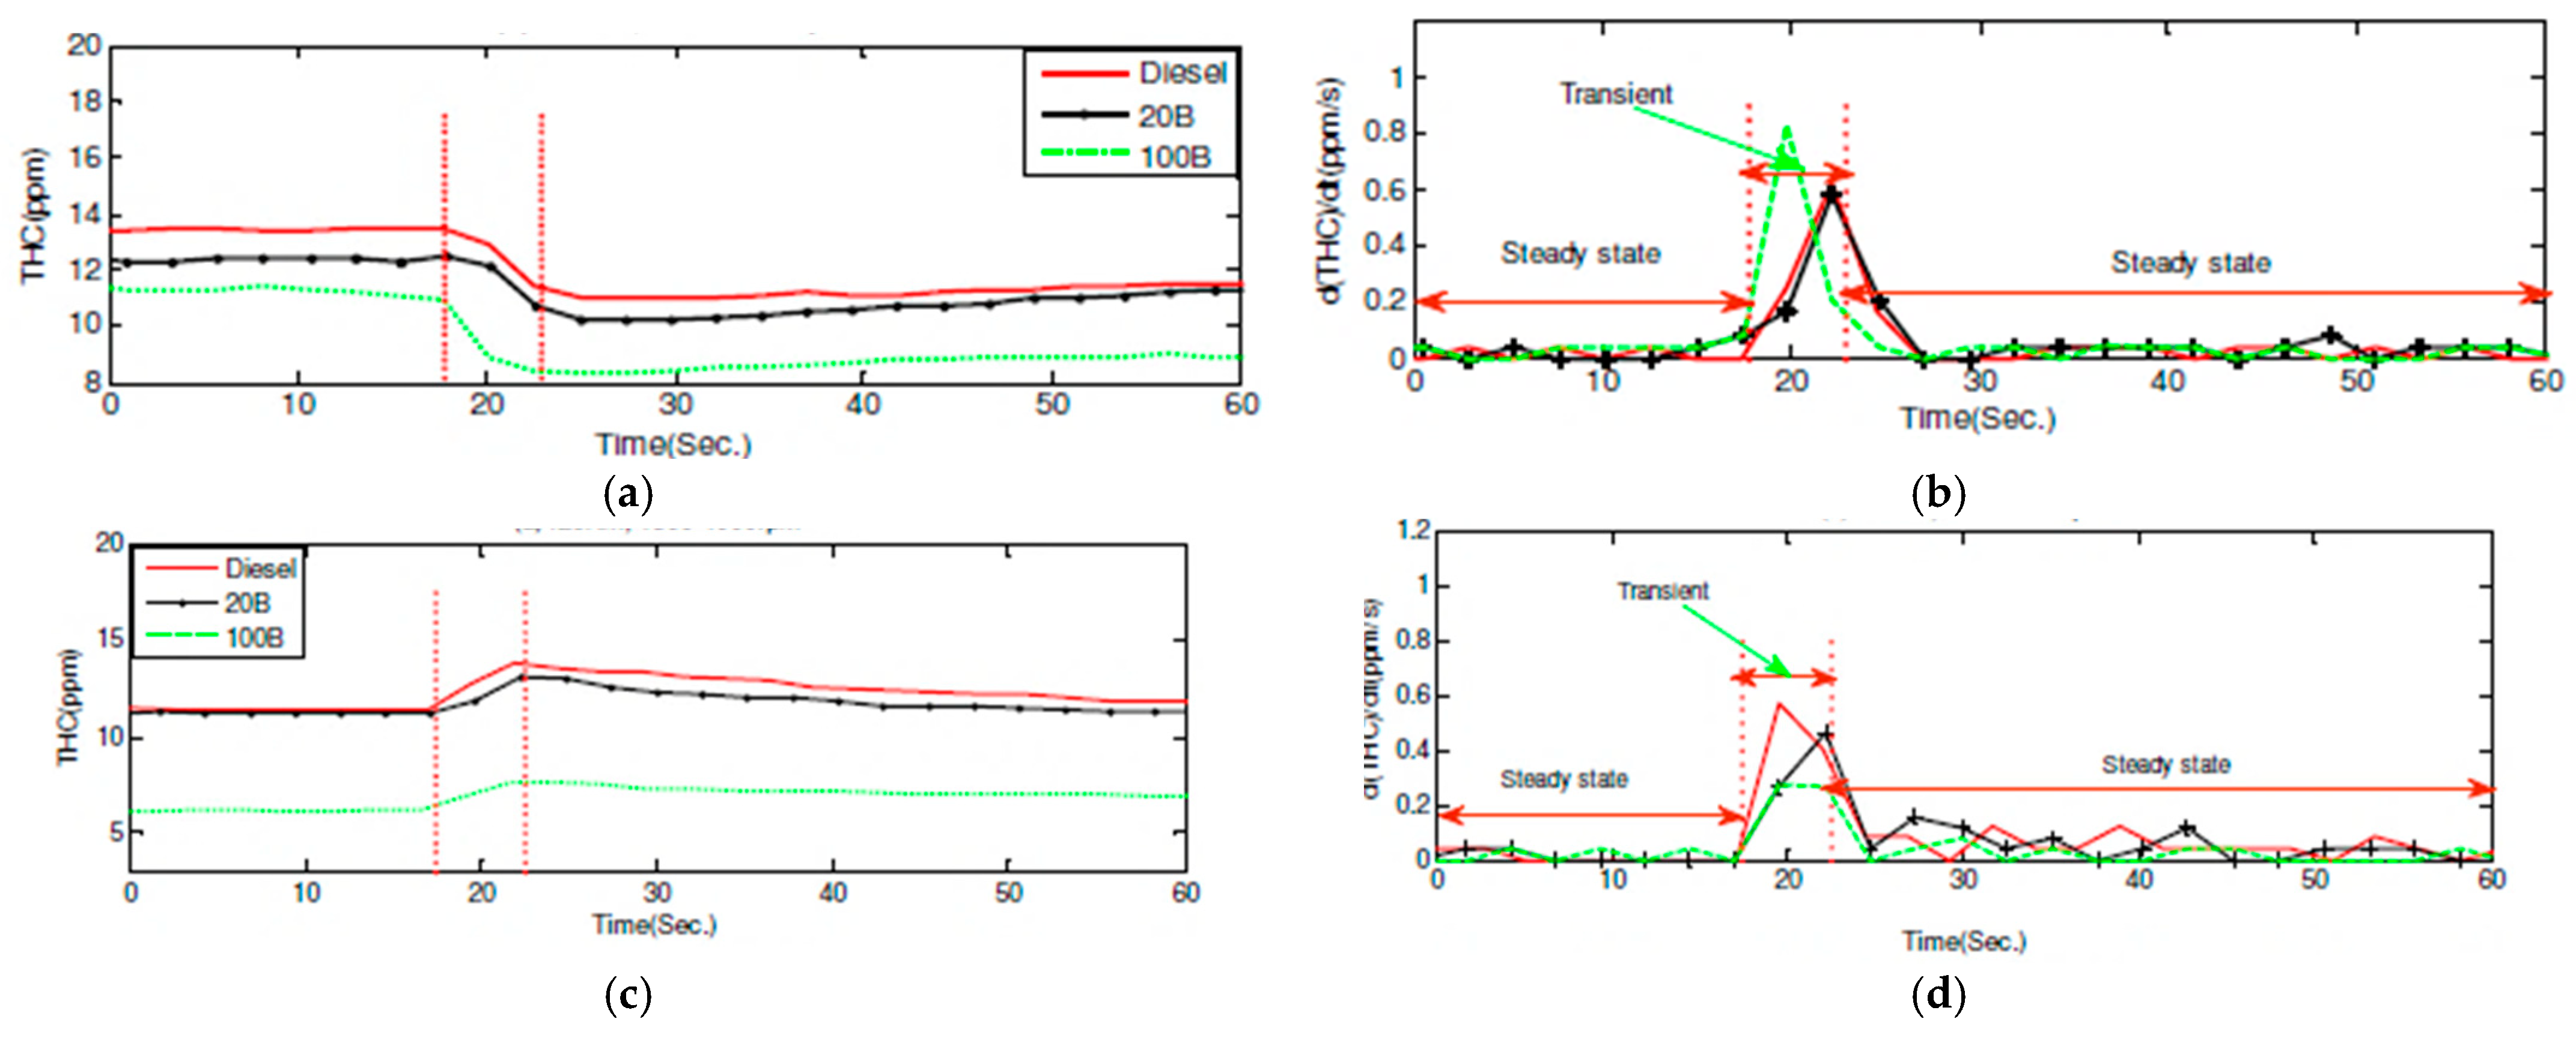
3.2.4. Total Hydrocarbon (THC) Emissions

Figure 18 shows the total hydrocarbon (THC) emission of the CI engine running with 20B and 100B. The engine load was 420 Nm and the speed transient was 1000–1500 rpm. The THC emission was shown to decrease during the engine acceleration operation. The figure shows that when the engine was run with 100B, the THC emissions were higher than for diesel and 20B under transient conditions. Furthermore, the pre- and post-transient rates of change of THC emissions were below 0.1%/s. It is noted that the transient operation did not significantly affect the post-transient steady operations. Figure 18a shows acceleration effects on THC emissions of the CI engine. It indicates a sharp THC emission increase with decreasing engine speed. Figure 18d shows that when run with diesel, the emissions rate was highest and was followed by 20B. Conversely, the pre- and post-transient emission rates were nearly zero, while the transient operation had an insignificant effect on the preceding steady operation under increased speed transient operation from 1000 to 1500 rpm.
Figure 19 shows the influence of torque transition on THC emission with the engine running with the three fuels at 1500 rpm. Figure 19a shows that the THC experienced a decrease as the torque increases from 210 to 420 Nm for the three fuels studied. As indicated by Figure 19b–d, the emission rates during positive and negative torque transitions varied between −0.5 and 0.5 ppm/s, and in both cases, the 100B THC emission rate progressed towards zero.
The total hydrocarbon emissions of the 20B biodiesel blend and 100B for the positive speed transient (1000–1500 rpm) are shown in Figure 20. In addition, biodiesel has a higher cetane number and this reduces the combustion delay by approximately 33% and 45% for 2B and by 9% and 48% for 100B. In a similar fashion, the THC was reduced by up to 21% and 63% and 28% and 66% during the torque transition operation, when using biodiesel blends of 25B and 100B, respectively, as it is depicted in Figure 20c,d. The reduction in THC could be because the biodiesel has a chemical composition with 11% oxygen, and this has two major effects, namely reduction of the number of carbon and hydrogen atoms that enter the cylinder and the complete combustion being guaranteed by the presence of oxygen atoms.

4. Conclusions

Given the global concerns on the effect of emissions due to fossil fuels on the environment, the use of petroleum-based fuels is experiencing serious re-examination. Alternatives to these are biofuels, which are foreseen to complement electric fuels especially for long-haul heavy-goods transport. This paper examined the performance and emission characteristics of a compression injection (CI) engine with diesel, a 20% biodiesel-diesel blend (i.e., 20B) and 100% biodiesel (100B) under various transient operating conditions. It was found that the performance of CI engines during transient operations can vary significantly from steady operation depending on whether diesel or biodiesel is used. Experiments were carried out on a direct injection, 4-stroke, CI engine at the University of Huddersfield. Data analysis was performed to compare the fuel flow rate, the exhaust gas temperature, the in-cylinder pressure and the nature of engine emissions (CO2, NOx, CO and THC) under speed and torque transients. Several important conclusions were drawn from the engine’s performance and emission characteristics during the various transient operations. Firstly, we found that the 100B fuel flow rate was higher than that of diesel by 16% and 14% for the acceleration and deceleration transient operations, respectively, under the same positive and negative speed transient operating conditions. Furthermore, the flow rate values increased to 17% and 15%, respectively, for positive and negative torque transient conditions. We found that during engine acceleration and deceleration, the maximum difference between the exhaust temperature with diesel and each of the biodiesels and the 20B blend is less than 2%. Conversely, at torque transients, running with biodiesel produces higher exhaust gas temperatures than that of running with diesel, by at least 7%. The influence of fuel type on engine emissions is significant as we found that lower CO2, CO and THC emission results when biodiesel is used during all the transient operations. However, using biodiesel as a fuel in the engine results in an increase in NOx emissions during both speed and torque transition conditions. Finally, we deduced that the influence of transient operations on emissions are not limited to the transient operation period but are propagated far beyond torque and speed transient condition and can continue for up to 20 s post-transient. Furthermore, the post-transient emission time span of NOx and CO is higher than those of the other emissions. This is due to the relationship between NOx emission and the nature of thermal production and dissipation during combustion within the engine’s cylinder. After the instant transient operations, the conditions within the cylinder change and these take a long time to stabilise due to the unsteady convection and conduction heat transfer processes in the cylinder. In conclusion, we have established that the performance of CI engines with biodiesel blends do not differ significantly when compared with conventional diesel. For example, there was less than 5% difference between the fuels in the peak engine pressure. Conversely, there is a marked decrease in Nox, CO and THC emissions. CO emission decreased by 25% and 50%, respectively, for the B20 blend and B100, respectively. This further underlines the importance of moving from petrol-based to biodiesel for heavy-goods vehicles, for example, without modifying current engines. As a recommendation for future work, the effect of other biodiesel blends need to be carried out over a wider range of torque and speed transients than have been investigated in this paper.

Author Contributions

Conceptualization: R.M. and B.C.T.; methodology R.M. and B.C.T.; software and experimentation B.C.T.; formal analysis, B.C.T.; data curation B.C.T.; writing—original draft preparation, B.C.T.; writing—review and editing, B.C.T., R.M. and A.M.A.; supervision, R.M. All authors have read and agreed to the published version of the manuscript.

Funding

This research received no external funding.

Data Availability Statement

The data in this paper can be made available upon reasonable request.

Conflicts of Interest

The authors declare no conflict of interest.

References

  1. Patel, A.; Arora, N.; Sartaj, K.; Pruthi, V.; Pruthi, P.A. Sustainable biodiesel production from oleaginous yeasts utilizing hydrolysates of various non-edible lignocellulosic biomasses. Renew. Sustain. Energy Rev. 2016, 62, 836–855. [Google Scholar] [CrossRef]
  2. Nguyen, T.; Khoa, N.; Tuan, L. The Correlation of Biodiesel Blends with the Common Rail Diesel Engine’s Performance and Emission Characteristics. Energies 2021, 14, 2986. [Google Scholar] [CrossRef]
  3. Alptekin, E.; Canakci, M. Determination of the density and the viscosities of biodiesel–diesel fuel blends. Renew. Energy 2008, 33, 2623–2630. [Google Scholar] [CrossRef]
  4. Tate, R.; Watts, K.; Allen, C.; Wilkie, K. The viscosities of three biodiesel fuels at temperatures up to 300 °C. Fuel 2006, 85, 1010–1015. [Google Scholar] [CrossRef]
  5. Tate, R.; Watts, K.; Allen, C.; Wilkie, K. The densities of three biodiesel fuels at temperatures up to 300 °C. Fuel 2006, 85, 1004–1009. [Google Scholar] [CrossRef]
  6. Freedman, B.; Bagby, M.O. Heats of combustion of fatty esters and triglycerides. J. Am. Oil Chem. Soc. 1989, 66, 1601–1605. [Google Scholar] [CrossRef]
  7. Yamane, K.; Ueta, A.; Shimamaoto, Y. Influence of physical and chemical properties of biodiesel fuels on injection, combustion and exhaust emission characteristics in a direct injection compression ignition engine. Int. Res. J. 2001, 2. [Google Scholar] [CrossRef]
  8. Gumus, M. A comprehensive experimental investigation of combustion and heat release characteristics of a biodiesel (hazelnut kernel oil methyl ester) fueled direct injection compression ignition engine. Fuel 2010, 89, 2802–2814. [Google Scholar] [CrossRef]
  9. Benjumea, P.; Agudelo, J.; Agudelo, A. Effect of altitude and palm oil biodiesel fuelling on the performance and combustion characteristics of a HSDI diesel engine. Fuel 2009, 88, 725–731. [Google Scholar] [CrossRef]
  10. Gao, Y.; Deng, J.; Li, C.; Dang, F.; Liao, Z.; Wu, Z.; Li, L. Experimental study of the spray characteristics of biodiesel based on inedible oil. Biotechnol. Adv. 2009, 27, 616–624. [Google Scholar] [CrossRef] [PubMed]
  11. Kegl, B.; Hribernik, A. Experimental Analysis of Injection Characteristics Using Biodiesel Fuel. Energy Fuels 2006, 20, 2239–2248. [Google Scholar] [CrossRef]
  12. Bannikov, M.G.; Tyrlovoy, S.I.; Vasilev, I.P.; Chattha, J.A. Investigation of the Characteristics of the Fuel Injection Pump of a Diesel Engine Fuelled with Viscous Vegetable Oil-Diesel Oil Blends. Proc. Inst. Mech. Eng. Part D J. Automob. Eng. 2006, 220, 787–792. [Google Scholar] [CrossRef]
  13. Soudagar, M.E.M.; Mujtaba, M.; RezaSafaeibcd, M.; Afzale, A.; V, D.R.; Ahmeda, W.; Banapurmath, N.; Hossainh, N.; Bashiri, S.; AnjumBadruddinjk, I.; et al. Effect of Sr@ZnO nanoparticles and Ricinus communis biodiesel-diesel fuel blends on modified CRDI diesel engine characteristics. Energy 2021, 215, 119094. [Google Scholar] [CrossRef]
  14. Khan, H.; Soudagar, M.E.M.; Kumar, R.H.; Safaei, M.R.; Farooq, M.; Khidmatgar, A.; Banapurmath, N.R.; Farade, R.A.; Abbas, M.M.; Afzal, A.; et al. Effect of Nano-Graphene Oxide and n-Butanol Fuel Additives Blended with Diesel—Nigella sativa Biodiesel Fuel Emulsion on Diesel Engine Characteristics. Symmetry 2020, 12, 961. [Google Scholar] [CrossRef]
  15. Szybist, J.; Song, J.; Alam, M.; Boehman, A.L. Biodiesel combustion, emissions and emission control. Fuel Process. Technol. 2007, 88, 679–691. [Google Scholar] [CrossRef]
  16. Yusuf, A.; Hanna, M.A. In-Cylinder Pressure Characteristics of a D.I. Heavy Duty Diesel Engine on Biodiesel Fuel. SAE 1997, 971683. [Google Scholar] [CrossRef]
  17. Monyem, A.; Van Gerpen, J.H. The effect of biodiesel oxidation on engine performance and emissions. Biomass-Bioenergy 2001, 20, 317–325. [Google Scholar] [CrossRef] [Green Version]
  18. Martyr, A.J.; Plint, M.A. Engine Testing: Theory and Practice, 3rd ed.; A Butterworth-Heinemann Title: Oxford, UK, 2007. [Google Scholar]
  19. Abu-Qudais, M. Exhaust gas temperature for knock detection and control in spark ignition engine. Energy Convers. Manag. 1996, 37, 1383–1392. [Google Scholar] [CrossRef]
  20. Morey, F.; Seers, P. Comparison of cycle-by-cycle variation of measured exhaust-gas temperature and in-cylinder pressure measurements. Appl. Therm. Eng. 2010, 30, 487–491. [Google Scholar] [CrossRef]
  21. Hountalas, D.T.; Mavropoulos, G.; Zannis, T.C.; Mamalis, S.D. Use of Water Emulsion and Intake Water Injection as NOx Reduction Techniques for Heavy Duty Diesel Engines. In SAE Technical Paper Series; SAE International: Warrendale, PA, USA, 2006. [Google Scholar]
  22. Al-Shemmeri, T.; Oberweis, S. Correlation of the NOx emission and exhaust gas temperature for biodiesel. Appl. Therm. Eng. 2011, 31, 1682–1688. [Google Scholar] [CrossRef]
  23. Abu-Zaid, M. Performance of single cylinder, direct injection Diesel engine using water fuel emulsions. Energy Convers. Manag. 2004, 45, 697–705. [Google Scholar] [CrossRef]
  24. Lin, C.-Y.; Lin, H.-A. Diesel engine performance and emission characteristics of biodiesel produced by the peroxidation process. Fuel 2006, 85, 298–305. [Google Scholar] [CrossRef]
  25. Lin, C.-Y.; Wang, K.-H. Diesel engine performance and emission characteristics using three-phase emulsions as fuel. Fuel 2004, 83, 537–545. [Google Scholar] [CrossRef]
  26. Ramadhas, A.; Muraleedharan, C.; Jayaraj, S. Performance and emission evaluation of a diesel engine fueled with methyl esters of rubber seed oil. Renew. Energy 2005, 30, 1789–1800. [Google Scholar] [CrossRef]
  27. Carraretto, C.; Macor, A.; Mirandola, A.; Stoppato, A.; Tonon, S. Biodiesel as alternative fuel: Experimental analysis and energetic evaluations. Energy 2004, 29, 2195–2211. [Google Scholar] [CrossRef]
  28. Raheman, H.; Phadatare, A. Diesel engine emissions and performance from blends of karanja methyl ester and diesel. Biomass-Bioenergy 2004, 27, 393–397. [Google Scholar] [CrossRef]
  29. Meng, X.; Chen, G.; Wang, Y. Biodiesel production from waste cooking oil via alkali catalyst and its engine test. Fuel Process. Technol. 2008, 89, 851–857. [Google Scholar] [CrossRef]
  30. Labeckas, G.; Slavinskas, S. The effect of rapeseed oil methyl ester on direct injection Diesel engine performance and exhaust emissions. Energy Convers. Manag. 2006, 47, 1954–1967. [Google Scholar] [CrossRef]
  31. Qi, D.; Geng, L.; Chen, H.; Bian, Y.; Liu, J.; Ren, X. Combustion and performance evaluation of a diesel engine fueled with biodiesel produced from soybean crude oil. Renew. Energy 2009, 34, 2706–2713. [Google Scholar] [CrossRef]
  32. Lapuerta, M.; Armas, O.; Fernández, J.R. Effect of biodiesel fuels on diesel engine emissions. Prog. Energy Combust. Sci. 2008, 34, 198–223. [Google Scholar] [CrossRef]
  33. Tesfa, B.; Mishra, R.; Gu, F.; Powles, N. Prediction models for density and viscosity of biodiesel and their effects on fuel supply system in CI engines. Renew. Energy 2010, 35, 2752–2760. [Google Scholar] [CrossRef] [Green Version]
  34. Tesfa, B.; Mishra, R.; Gu, F.; Ball, A. Water injection effects on the performance and emission characteristics of a CI engine operating with biodiesel. Renew. Energy 2012, 37, 333–344. [Google Scholar] [CrossRef] [Green Version]
  35. Tesfa, C.B.; Mishra, R.; Zhang, C.; Gu, F.; Ball, A.D. Commbustion and performance characteristics of CI (compression ignition) engine running with biodiesel. Energy 2013, 51, 101–115. [Google Scholar] [CrossRef] [Green Version]
  36. Tesfa, B.; Gu, F.; Mishra, R.; Ball, A. LHV predication models and LHV effect on the performance of CI engine running with biodiesel blends. Energy Convers. Manag. 2013, 71, 217–226. [Google Scholar] [CrossRef] [Green Version]
Figure 1. Experimental engine test facility layout.
Energies 14 05416 g001
Figure 2. Speed transient profiles. (a) Acceleration at 1000 to 1500 rpm; (b) deceleration at 1500 to 1000 rpm. Torque transition profiles for (c) positive torque transition from 210–420N and (d) negative transition from 420–210 Nm.
Energies 14 05416 g002
Figure 3. Time response during speed transients at 420 Nm of fuel flow rate for the CI with biodiesel with (a) positive and (b) negative speed transient. Fuel flow rate percentage increment with biodiesel blends for (c) positive and (d) negative speed transient. All are at engine loads of 420 Nm.
Energies 14 05416 g003
Figure 4. (a,b) CI time response during positive and negative torque transition at 420 Nm using biodiesel and (c,d) the corresponding fuel flow rate percentage increment at positive and negative torque transition respectively.
Energies 14 05416 g004
Figure 5. Exhaust temperature of the CI engine fuelled with diesel and biodiesel blends at a speed stable at 420 Nm. (a,b) Exhaust temperatures at positive and negative torque transients and (c,d) exhaust temperature % increase.
Energies 14 05416 g005
Figure 6. Time response of exhaust temperature for CI with biodiesel during (a) positive (210–420 Nm) and (b) negative torque transition at 1500 rpm. Corresponding temperature percentage change at (c) positive and (d) negative torque transition.
Energies 14 05416 g006
Figure 7. (a) In-cylinder peak pressure vs. time for CI engines running with different fuels during the positive speed transient and the (b) corresponding in-cylinder peak pressure at positive speed transient. (c) In-cylinder peak pressure during negative speed transient and the (d) corresponding rate of change of in-cylinder peak pressure vs. time during the negative speed transient.
Energies 14 05416 g007
Figure 8. (a) In-cylinder peak pressure variation for the CI with different fuels during positive torque transient and the (b) corresponding rate of change of in-cylinder peak pressure over time with positive torque transient. (c) In-cylinder peak pressures during negative torque transient; (d) rate of change of in-cylinder peak pressures during negative torque transient.
Energies 14 05416 g008
Figure 9. (a) Time variation of carbon dioxide emission of the CI engine with the three fuels during positive speed transient at engine load of 420 Nm; (b) corresponding rate of change of CO2 emission. (c) Time variation of carbon dioxide emission of the CI engine during negative speed transient at engine load of 420 Nm; (d) corresponding rate of change of CO2 emission at negative speed transient condition.
Energies 14 05416 g009aEnergies 14 05416 g009b
Figure 10. (a) Variation of CO2 emission in the CI engine with time with the three fuels during positive torque transient at 1500 rpm; (b) rate of change of CO2 emission with time. (c) Variation of CO2 emission of CI engines with time during positive torque transient at 1500 rpm; (d) corresponding rate of change of CO2 emissions during positive torque transient conditions.
Energies 14 05416 g010
Figure 11. (a,b)Time trace of percentage CO2 emission reduction using the 20B blend and 100B during the 100–5000 rpm speed transient condition at 420 Nm engine load. CO2 emission percentage reduction of CI engine with time by using different biodiesel blends at 1500 rpm engine speed for (c) positive and (d) negative torque transition.
Energies 14 05416 g011
Figure 12. (a) NOx emission of CI engine over time running with the three fuels during positive speed transient; (b) equivalent rate of change of NOx emission with time. (c) CI engine’s NOx emission time variation running with the tested fuels during a negative speed transient; (d) equivalent rate of change of NOx emission during the negative speed transient.
Energies 14 05416 g012
Figure 13. (a) CI engine’s NOx emission time variation running with the tested fuels during a positive speed transient; (b) equivalent rate of change of NOx emission during the positive speed transient. (c) Time variation of NOx emission during a negative torque transient; (d) corresponding rate of change NOx emission during negative torque transient.
Energies 14 05416 g013
Figure 14. Variation of NOx emission percentage reduction of CI engine with time with the biodiesel blend fuels during (a) positive and (b) negative speed transients of between 1000 and 1500 rpm. Variation of NOx emission percentage reduction in the CI engine running with the different biodiesel blends during (c) positive and (d) negative torque transient conditions.
Energies 14 05416 g014aEnergies 14 05416 g014b
Figure 15. (a) Positive speed transient emission characteristics of CO in the CI engine running with the three fuels during positive speed transient; (b) corresponding rate of change of CO emission. (c) CO emission characteristics in CI engine running with the three fuels during negative speed transient; (d) corresponding rate of change of CO emission.
Energies 14 05416 g015
Figure 16. (a) Engine CO emission running with the three fuels during positive torque transient at 1500 rpm; (b) corresponding rate of change of CO emission at the same conditions. (c) Variation of CO emission of CI engines with time for running with different fuels during the negative torque transient of 420 to 210 Nm at 1500 rpm; (d) rate of change of CO emission under the same conditions.
Energies 14 05416 g016
Figure 17. Time variation of percentage CO emissions reduction in the engine running 20B and 100B during the (a) positive and (b) negative speed transient at a torque of 420 Nm. Percentage CO emission reduction over time with 20B and 100 B at 1500 rpm during the (c) positive and (d) negative torque transient.
Energies 14 05416 g017
Figure 18. (a) THC emission in the engine with the three fuels during the negative speed transient at a torque of 420 Nm; (b) corresponding rate of change of THC emission. (c) THC emission in the engine with the three fuels during the positive speed transient at a torque of 420 Nm; (d) corresponding rate of change of THC emission.
Energies 14 05416 g018
Figure 19. (a) Top: Time variation of THC emission with the three fuels during positive torque at 1500 rpm; bottom: Attendant rate of change of THC emission (b) Top: THC emission in the CI engine running with biodiesel, 2B and 100B fuels during negative torque transient at 1500 rpm; bottom: Corresponding rate of change of THC emissions.
Energies 14 05416 g019
Figure 20. Percent reduction in THC emissions in the CI engine running with 20B blend and 100B during (a) positive and (b) negative speed transient conditions at 420 Nm torque. Percentage of THC emission reduction of the CI engine at (c) positive and (d) negative torque transition conditions at a constant engine speed of 1500 rpm.
Energies 14 05416 g020
Table 1. Characteristics of the test engine.
Engine TypeTurbo Charged Diesel Engine
Number of cylinders4
Bore103 mm
Stroke132 mm
Diameter of inlet valve36.5 mm
Diameter of exhaust valve33.2 mm
Compression ratio18.3
Number of valves16
Method of injectionDirect injection
Engine displacement4.399 litre
Cooling systemWater
Recommended speed850 rpm
Max power74.2 kW@ 2200 rpm
Table 2. The emission analyser type and measuring range.
Emission TypeAnalyser TypeMeasuring RangeUncertainty
COnon-dispersive infrared (NDIR)0–2000 ppm±2%
CO2non-dispersive infrared (NDIR)0–100%±2%
NOxheated chemiluminescent detector (HCLD)0–5000 ppm±2%
THCheated flame ionisation detector (HFID)0–100 ppm±1%
O2paramagnetic detector0–25%±1%
Publisher’s Note: MDPI stays neutral with regard to jurisdictional claims in published maps and institutional affiliations.

