Article

Annual Thermal Performance of an Industrial Hybrid Direct–Indirect Solar Air Heating System for Drying Applications in Morelos-México

by
Francisco Álvarez-Sánchez
1,
Jassón Flores-Prieto
1,* and
Octavio García-Valladares
2
1
Tecnológico Nacional de México—CENIDET, Int. Internado Palmira S/N, Cuernavaca 62490, Mexico
2
Instituto de Energías Renovables, Universidad Nacional Autónoma de México, Privada Xochicalco S/N, Centro, Temixco 62580, Mexico
*
Author to whom correspondence should be addressed.
Energies 2021, 14(17), 5417; https://doi.org/10.3390/en14175417
Submission received: 6 July 2021 / Revised: 19 August 2021 / Accepted: 24 August 2021 / Published: 31 August 2021

Abstract

:
A theoretical–experimental annual analysis of a hybrid industrial direct–indirect solar air heating system performance for drying was conducted considering temperatures, useful energy Qu, efficiency η, and solar fraction SF. The direct solar air heating system located in Morelos, México, has flat-plate solar air collectors, and the indirect system has flat-plate solar water collectors, a thermal storage tank, a cross-flow fin, and a tube heat exchanger. A validated TRNSYS program modeled the process; the validation was carried out by comparing each component outlet temperature and useful energy with the respective experimental field data. The analysis considered annual usage over seven days a week, nine hours a day (from 09:00 to 18:00 h), and three operation modes. For the direct, indirect, and hybrid operation modes, the Qu values were 31.60, 55.19, and 75.18 MWh/yr; the annual η values were 0.44, 0.41, and 0.42; and the annual SF values were 0.45, and 0.73 for the indirect and hybrid mode, respectively. The hybridization of the direct–indirect solar air heating system increased annual performance by up to 58% in Qu and 42% in SF. The parametric analysis showed that a characteristic working nomogram of the hybrid system could be achieved, correlating the useful energy, efficiency, solar fraction, and operation temperature at a specified mass flow rate, and working temperature.

1. Introduction

The industrial sector is one of the largest energy consumers worldwide; 50% of the energy generated goes to industrial processes [1]. The heat at low and medium temperatures (<250 °C) represents 44% of industrial demand [2]. In México, industrial heat represents 21% of the energy consumption, emitting around 64 Mt of CO2 yearly to the atmosphere [3,4]; enormous annual costs are originated from the combustion of polluting fossil fuels [5].
In recent years, solar heating for industrial processes has become an alternative to reduce fossil-fuel-burning and greenhouse gas emissions, making solar heating an issue in energy-related organizations and government agencies worldwide [6]. However, it is necessary to broaden the research to demonstrate the advantages of solar heating in the industrial process [7]. Drying is one of the most energy-intensive processes, representing around 12% of the manufacturing industry’s energy consumption [8]. Convective drying is one of the most common drying methods and consists of passing a hot air stream to supply heat to a product to remove moisture [9]. Usually, the air is heated by combustion flue gases, decreasing the quality of the product and producing air pollution. Thus, solar air heating systems are a technological alternative to reduce pollution and improve product quality in industrial drying applications. Solar air collectors are widely used in drying applications due to their feasibility and low costs [10]. They are classified as bare-plate and covered-plate solar air heaters. The more efficient are the covered-plate air heaters, which can reach higher temperatures [11]. The back-pass covered-plate solar air heaters get higher operation drying temperatures with considerable efficiencies, from 0.30–0.55 [12]. In recent years, PV/T collectors have been studied to produce thermal and electrical energy; the combined efficiency has been found to be up to 0.61 [13]; however, thermal efficiency is lower than water and air solar heaters.
In the literature, most solar air heating devices for drying are for low capacities and a reduced solar collector area [14,15,16,17,18,19,20,21,22,23]. The studies are few at an industrial scale. For instance, Janjai et al. [24] tested a 108 m2 direct solar air heating system (DSAHS) over seven days. The hot air was for a greenhouse dryer, and the maximum thermal efficiency was 0.55. Condorí et al. [25] assessed the performance of a 90 m2 DSAHS integrated into a tunnel dryer. The thermal efficiency was 35% during 14 testing days. For the DSAHS integrated into a dryer tunnel, García-Valladares et al. [26] assessed the performance of 111.1 m2; the useful energy was 3130 MJ, and the efficiency was 0.395 during three testing days. Ortiz-Rodríguez et al. [27] determined the thermal performance of a hybrid direct–indirect solar air heater integrated into a tunnel dryer. The DSAHS had a 111.1 m2 air solar collectors field, an indirect solar air heater of 92.4 m2 of solar water collectors field, a 6 m3 thermal storage tank, an air-water heat exchanger, and an auxiliary heater. For the hybrid systems, the useful energy was 3310 MJ, and the solar fraction was 0.80. The direct heater supplied 59% of the heating energy, with an efficiency of 0.560. The indirect heater provided the rest, with an efficiency of 0.404. As seen in testing periods of 2–14 days, efficiencies at the industrial scale are between 0.35 and 0.55. However, performance assessments of solar heaters of over a year in length are still scarce, limiting the ability to construct economic scenarios and reducing the possibilities of increasing the reliability of studies of solar projects.
The annual thermal performance assessment of solar thermal systems is most common in water heating and steam generation. For instance, El-Mkdami and Wahed [28] simulated in TRNSYS (Thermal Energy System Specialist, Madison, Wisconsin, USA) a solar water heating system for milk production. For selected locations, the useful annual energy and solar fraction were up to 161 MWh/yr and 0.97, respectively. Vargas-Bautista et al. [29] assessed the performance of solar water heaters integrated into an ethanol 5–10 wt% distillation process by TRNSYS simulation. The useful annual energy was up to 97.84 MWh/yr, the efficiency was 0.56, and the solar fraction was 0.80. Allouhi et al. [30] assessed a milk processing facility’s solar water heater performance by TRNSOL (Aiguasol, Barcelona España) simulation. The useful annual energy was 216.62 MWh/yr, and the solar fraction was 0.41. Bolognese et al. [31] assessed a pasta factory’s solar steam generation performance using Dymola-Dassault-Systems software (Paris, France). The useful energy was 21 MWh, and the annual solar fraction was around 0.23. Usually, the annual performance of solar heating systems is assessed mainly by numerical simulation to save time and expenses regarding experimental evaluations [32]. Additionally, numerical simulations reduce uncertainty in performance evaluation, improving the commercialization of solar heating technologies [33]. Usually, the annual performance of solar heating systems in industry has been limited to water heating and steam generation. Thus, there is a lack of annual thermal performance assessments of solar air heating systems applied to the drying process. Therefore, a yearly study of a hybrid industrial direct–indirect solar air heating system performance for drying usage located in Morelos, México, was conducted in terms of useful energy Qu, thermal efficiency η, and solar fraction SF, which in turn are a function of the operating temperature, air mass flow, auxiliary heating temperature, and meteorological conditions. A TRNSYS program modeled the process by comparing each component’s outlet temperature and useful energy with the respective experimental field data. The hybrid configuration included solar thermal storage to reduce energy consumption and assure service stability and continuity. The purpose was to find out the most efficient way of operating the system under different conditions. The hybrid system expands the possible applications of the present system for drying.

2. Materials and Methods

The study location and the solar air heating system configuration followed the project requirements of a PRODETES17-PCL-000020 award. The mathematical modeling and its validation approach are shown in this section.

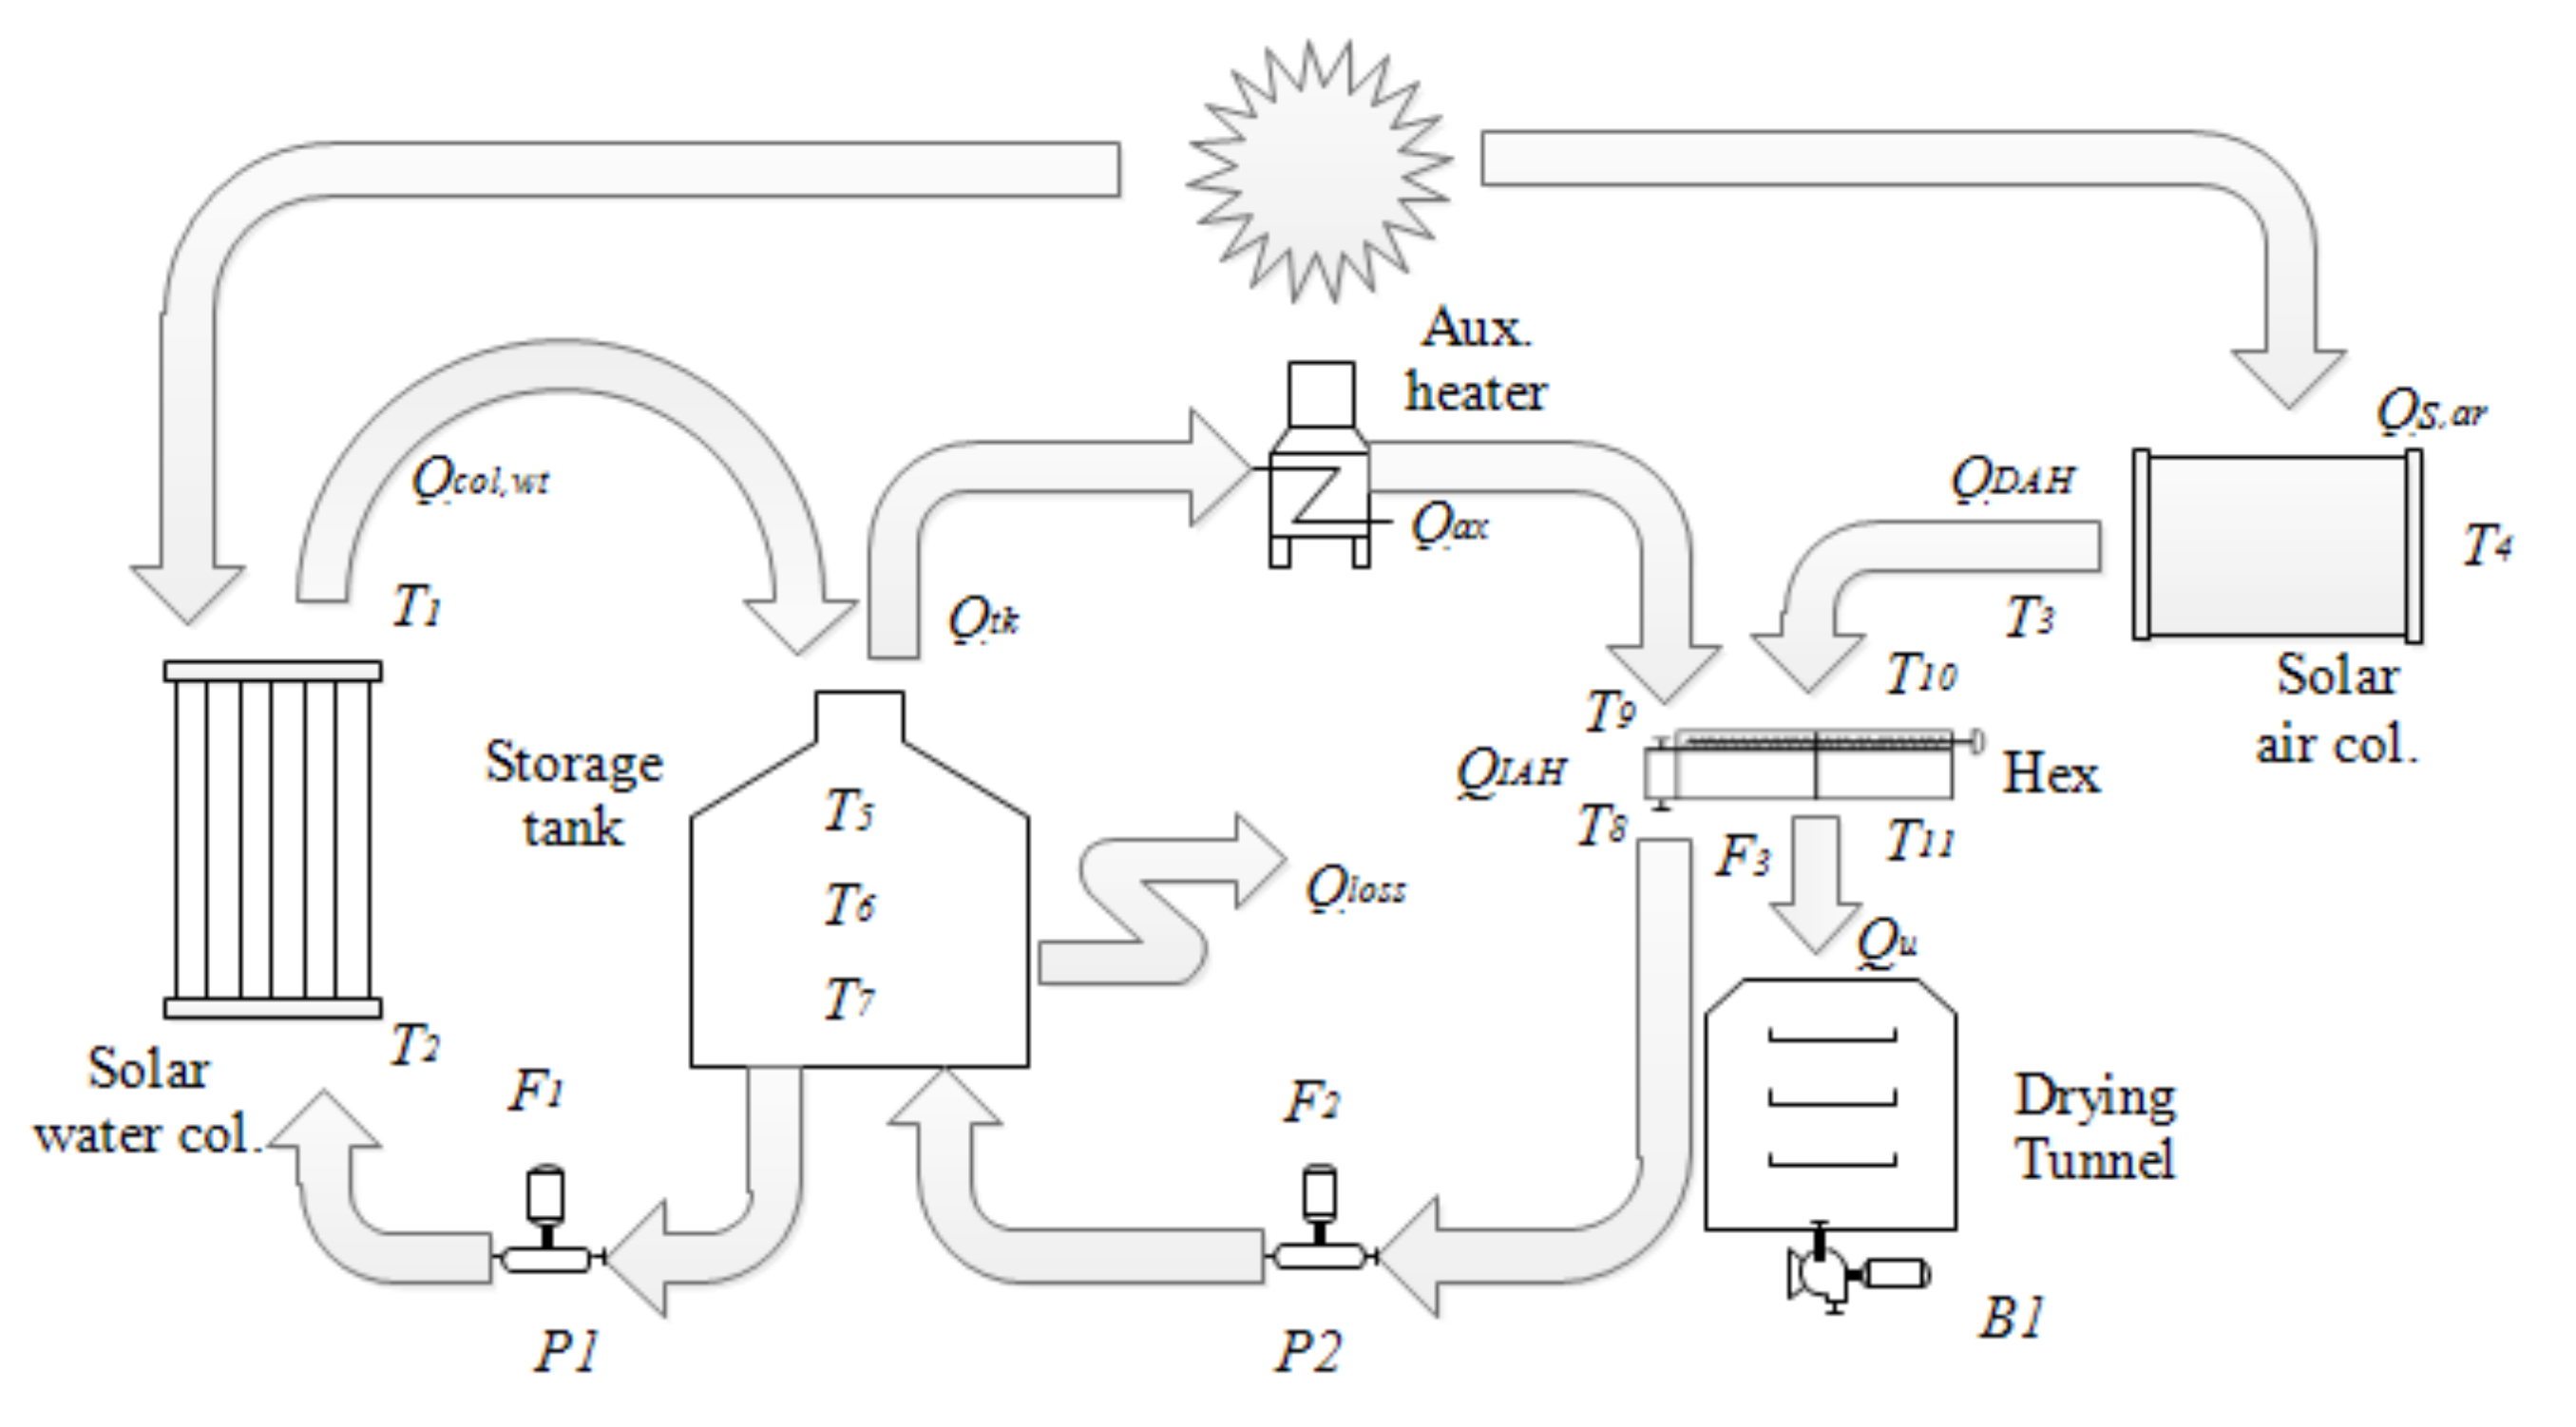
2.1. Location and Solar Heater Description

The study location is in Xochitepec-Morelos, México. According to Koppen classification, the climate is a dry tropical climate (Aw). The maximum, minimum, and average annual ambient temperatures are 31.4, 15.9, and 23.6 °C, respectively. The annual average relative humidity and yearly irradiation are around 58% and 2079 kWh-yr (20.5 MJ/m2-day), respectively. Figure 1 shows the hybrid air heating system comprising a direct air heating system and an indirect air heating system. Figure 2 shows the installed air and water solar collector fields, the storage tank, and the auxiliary heater. The direct air heating system has 16 solar air heaters of 37.2 m2 of the net area. The indirect air heating system has eight single-glazed water flat-plate solar collectors of 18.6 m2 of net area, eight double-glazed water flat-plate solar collectors of 18.6 m2 of net area, disposed of in a serial-parallel arrangement, as shown in Figure 3. A 2.5 m3 thermal storage tank and an air–water heat exchanger complements the system. With a variable frequency drive, two pumps of 0.37 kW recirculate the water in the solar water heating systems and in the air–water heat exchanger loop. The air flows through the solar heating system by a 2.23 kW blower with a variable frequency drive. The direct air heating system absorbs solar irradiance by the solar air collectors at the rate of Qs,ar, and the indirect air heating system does so by the single-glazed and double-glazed solar water collectors at the rate of Qs,SG and Qs,DG, respectively. The useful energy given by the solar air collectors is called QDAH. The QDAH heats the drying airflow and is re-heated by the indirect air heating at the rate of QIAH. In the indirect air heating system, the solar water collectors heat water at the rate of Qcol,SG for the single-glazed solar collectors and Qcol,DG for the double-glazed solar collectors. The heated water is stored in an insulated tank. The thermal storage tank supplies heated water to the water–air heat exchanger to increase the drying air temperature at the rate of Qtk. The QIAH is the sum of the Qtk and the Qax. The useful energy of the hybrid air heating system is Qu, given by the sum of QDAH and QIAH. Two water pumps, P1 and P2, and an air blower, B1, make the water and airflow through the solar heating system possible. Table 1 shows the equipment’s parameters and characteristics.
Solar air collectors heat the drying tunnel when we have enough solar radiation, while solar water collectors store energy to be used when solar radiation decreases to be able to continue the drying process with only solar energy for more time. In case of not having enough energy from both solar systems, the auxiliary heater heats the water and thus is able to continue operating. In the case of days with low radiation, the ambient air is preheated with the solar air collectors, and the auxiliary heater is used if necessary to heat the water–air heat exchanger circuit to be able to reach the appropriate temperatures inside the drying tunnel. The auxiliary heater set point temperatures are 65, 75, and 85 °C to guarantee proper operation, avoiding product degradation and heat exchanger inefficiencies.

2.2. Experimental Setup

The experiment allowed adjustments and validation of the simulation platform. Figure 3 shows the monitored variables. The adjustment was conducted to determine the storage tank loss coefficient ULtk and the heat exchanger effectiveness ε. The ULtk was determined by the log mean temperature difference method, as described in Section 2.3; for this purpose, the average storage tank temperature T6 and the environmental temperature Ta were monitored for six days. The effectiveness ε was determined following Section 2.3. The monitored inputs were the inlet and outlet temperature in the cold side, T9 and T10, and in the hot side, T8 and T7 of the water–air heat exchanger, and the cold side and hot side mass flow rate, F2 and F3, respectively. For the validation, the outlet temperature of air solar collectors T1, the outlet temperatures of solar water collectors T3 and T4, the tank temperature T6, and the heat exchanger outlet temperatures T10 were monitored. In the case of the storage tank, the monitored variable was the average temperature T6, which is the average temperature of upper T6a, middle T6b, and lower T6c storage tank temperature. The experimental equipment was composed of ten temperature sensors, two water mass flow meters (F1 and F2), one air velocity meter (F3), and one solar irradiance sensor (IT) installed at the collector plane, all of them handled by a data logger. The temperature was recorded by RTD thermometers (−60 to 200 ± 0.1 °C). The water mass flow rate was recorded by turbine flow meters (0.05–40 GPM, ±1%), and the air velocity was measured by a hot wire anemometer (0–40 m/s, ±2.0%). The solar irradiance was measured with an LI-COR LI-200R pyranometer, with an uncertainty of ±3% and a range 0–3000 W/m2. The data were recorded each minute by a Keysight 34980A data acquisition system.

2.3. Adjustment of the Simulator

The storage tank and the heat exchanger adjustment were performed considering the storage tank losses coefficient ULtk and the effectiveness ε, respectively. The storage tank’s overall heat losses coefficient was determined using the log mean temperature difference LMTD, following Equation (1). The storage tank initial temperature T6i was recorded; over the test, the storage tank lost energy to the ambient; therefore, T6 decreased slowly to a final and lower temperature T6f in a period t. The log mean temperature difference is assessed by Equation (1) and ULtk estimating by Equation (2).
L M T D   =   ( ( T 6 i     T a )     ( T 6 f     T a ) ) / ( ( l n ( ( T 6 i     T a )     ( T 6 f     T a ) )
U L t k   = m C p w T 6 i     T 6 f T A s t L M T D
Equation (3) describes the heat exchanger effectiveness ε.
ε   =   F 2 C P w t ( T 8     T 7 ) F 3 C p a r ( T 8     T 9 )
where F2 is the hot side flow rate, and F3 is the cold side flow rate, T8 and T7 are the heat exchanger hot side inlet and outlet temperatures, T9 is the cold side inlet temperature, and Cpwt and Cpar are the water and air specific heat at constant pressure, respectively.

2.4. Theoretical Model

Equation (4) asses the useful energy of solar air collectors QDAH, Equation (5) is for the single-glazed solar water collectors useful energy Qcol,SG, and Equation (6) is for the double-glazed solar water collectors useful energy Qcol,DG, where Tav,ar = (T1 + T2)/, Tav,SC = (T3 + T5)/2 and Tav,DG = (T4 + T5)/2.
Q D A H = t 1 t 2 a 0     a 1 T a v , a r     T a I T     a 2 ( T a v , a r     T a ) 2 I T Q s , a r   d t
Q c o l , S G   = t 1 t 2 a 0     a 1 T a v , S G     T a I T     a 2 ( T a v , S G     T a ) 2 I T Q s , S G   d t
Q c o l , D G   = t 1 t 2 a 0     a 1 T a v , D G     T a I T     a 2 T a v , D G     T a ) 2 I T Q s , D G   d t
Qs,ar, Qs,SG, and Qs,DG are the incident solar radiation over the air solar collectors, the single-glazed and the double-glazed solar water collectors fields, respectively, and are determined by Equations (7)–(9).
Q s a r = t 1 t 2 A a r I T   d t
Q s , S G = t 1 t 2 A w t , S G I T   d t
Q s D G = t 1 t 2 A w t , D G I T   d t
Equation (10) describes the energy storage in the tank Qtk.
Q t k   =   m t k C p w t ( T 6 i     T 6 f )
where the mtk is the heated water mass, Cpwt is the water-specific heat, T6i and T6f are the initial and final storage tank temperature, respectively. Equation (11) describes the useful energy transferred from the water to the air in the heat exchanger QIAH, which involves the delivered energy by the water storage heating system and the auxiliary.
Q I A H = t 1 t 2 ε   C a r ( T 10     T 9 )   d t
where ε is the effectiveness, and Car is the thermal capacitance. The useful thermal energy Q u , thermal efficiency η , overall efficiency η 0 , and solar fraction S F are determined by Equations (12)–(15), following energy balances in the hybrid system; where η 0 considers thermal and electrical blower consumption.
Q u   =   Q D A H   +   Q I A H
η = Q u Q s , S G   +   Q s , D G   +   Q s , a r   +   Q a x
η 0 = Q u   Q s , S G   +   Q s , D G   +   Q s , a r   +   Q a x   +   Q e l e
S F = Q u     Q a x Q u

2.5. Simulation Program

The annual useful energy Qu, efficiency η, and solar fraction SF of the hybrid air solar heater were determined by component-based dynamic simulations using TRNSYS. The simulation was carried out in a quasi-dynamic state. The program development was according to the components approach, following Section 2.4, and to the thermal performance parameters according to Section 2.1.
The useful energy of solar air collectors was simulated considering Equation (4), and likewise, the useful energy of single- and double-glazed solar water collectors was simulated by Equations (5) and (6), respectively. The components used in the simulation are shown in Figure 4, and the physical parameters are shown in Table 1. In TRNSYS, the components’ subroutines are called types. Type 1b simulates the air and water solar collectors, type 60f the storage tank, type91 the heat exchanger, and type 6 the auxiliary heater. Additionally, type 3b, type 3b-2, and type3a simulate Pump1, Pump2, and the air blower. Type 14h is the operation control of the solar air collectors; likewise, type 2b is the differential temperature controller for the solar water collectors; type 109 is the input meteorological data in TMY format. Type24 is a forcing function used to integrate useful energy in annual periods. The Equation (1) subroutine enters the data required for the simulation, and the Equation (2) subroutine calculates the annual useful energy Qu, solar fraction SF, and efficiency η. The type 65c subroutine plots and saves the results into a data file.

2.6. Simulator Validation

The simulator validation was conducted by comparing experimental and simulated outlet temperatures, considering the solar air collectors T1, the single- and double-glazed solar water collectors fields T3 and T4, and the heat exchanger T10. In the storage tank case, the comparison considered the average temperature T6, which is the average temperature of upper T6a, middle T6b, and lower T6c storage tank temperature. Two days of experimental data for each element (solar air collectors, solar water collectors, storage tank, and heat exchanger) were considered for the temperature comparative in the validation.
The comparative study of the solar air collectors field used three days of experimental data from 22 April 2020 and 13 July 2020 between 13:00 and 16:00 and 15 July 2020 between 13:00 and 16:00. The comparison was conducted for the solar water collectors field and the storage tank with two days of measured data from 14 July 2020 and 17 July 2020 between 11:00 and 16:00. The comparative was carried out for the heat exchanger with experimental data from 21 August 2020 between 16:40 and 18:00. The simulation precision was determined by the RMSE, following Equation (16).
R M S E = ( T e x p     T s i m ) 2 n

3. Results and Discussion

The simulation platform validation and the annual performance in terms of the useful energy, the solar fraction, and thermal efficiency are presented, along with a characteristic annual thermal performance nomogram of the hybrid solar heater.

3.1. Adjustment and Validation Simulator

The simulation platform adjustment was with experimental data from April–July 2020. The ambient temperature, solar irradiance, and relative humidity during the experiments are presented in Table 2. According to Section 2.3, the storage tank heat losses coefficient was 3.21 W/m2K, and the heat exchanger effectiveness was 0.39 ± 0.16. Figure 5 shows the comparison between simulated and experimental outlet temperature T3, useful energy QDAH. The RMSE values of T1_sim and T1_exp were 1.1, 1.1, and 1.6 °C on the first, second, and third days. The %MAE values of QDAH_sim and QDAH_exp were 0.62, 1.23, and 4.1%. The temperature difference ranged from −3.9 to 4.1 °C over the three testing days, as shown in Figure 4.
Figure 6a–d shows the comparison between the single-glazed solar water collectors simulated and experimental outlet temperature T3 and useful energy Qcol,SG. On the first and second day of testing, the outlet temperature T3 RMSE values were 1.8 and 1.3 °C, and the useful energy %MAE values were 7.0 and 1.82%. The temperature difference range was −3.0 to 0.6 °C over the testing days. Figure 6e–h shows the double-glazed solar collectors field outlet temperature T4 comparison. On the first and second day of testing, the RMSE values were 1.23 and 1.0 °C, and the %MAE values were 5.0 and 3.12%, respectively. The temperature difference range was −2.7 to 0.6 °C during the three testing days.
Figure 7 shows the simulated and experimental storage tank average temperature comparison. The T6 RMSE was 1.4 °C and the useful energy %MAE was 5.5%. In the case of the storage tank, the average temperature T a v , t k and RMSE was 0.8 °C, and the temperature difference range was −1.9 to 1.1 °C.
Figure 8 shows the heat exchanger comparison between simulated and experimental outlet temperature T10 and useful energy QIAH during 21 August 2020. The RMSE was 0.5 °C, and the %MAE was 3.0%.
In the temperature comparison, the lower average RMSE was at the heat exchanger cold side outlet temperature T10, which was 0.5 °C. The higher average RMSE was the water solar collectors’ outlet temperature T3 (1.5 °C). Following the previous results, the maximum %MAE of the useful energy in the solar water collectors was 7.0%, and the minimum was 3.0% in the heat exchanger. Thus, the comparative results showed good agreement between simulated and experimental outlet temperature and the useful energy with the applied adjustment.

3.2. Thermal Performance Assessment

3.2.1. Simulation Description

The annual thermal simulation was carried out by one-hour time step with a usage profile of 09:00–18:00. The air mass flow rate F3 was 3050 kg/h, the water mass flow rate measured was at the water collectors field, and the processing circuit was F1:1470 and F2:1980 kg/h. The operation modes were mode 1: direct solar air heating system alone; mode 2: indirect solar air heating system alone, and mode 3: hybrid air solar heating system. The auxiliary heater was used if the solar radiation was not enough to have an air temperature at the entrance of the drying chamber suitable for the drying process, which occurred on cloudy or low radiation days or at night. In mode 2 and mode 3, the auxiliary heating supply to the water from the storage tank required heat to reach the set point temperatures used in the study (65, 75, and 85 °C): mode 2: indirect solar air heating system alone with the auxiliary heating supply hot water at 75 °C; mode 3: hybrid air solar heating system operating simultaneously from 09:00–18:00.

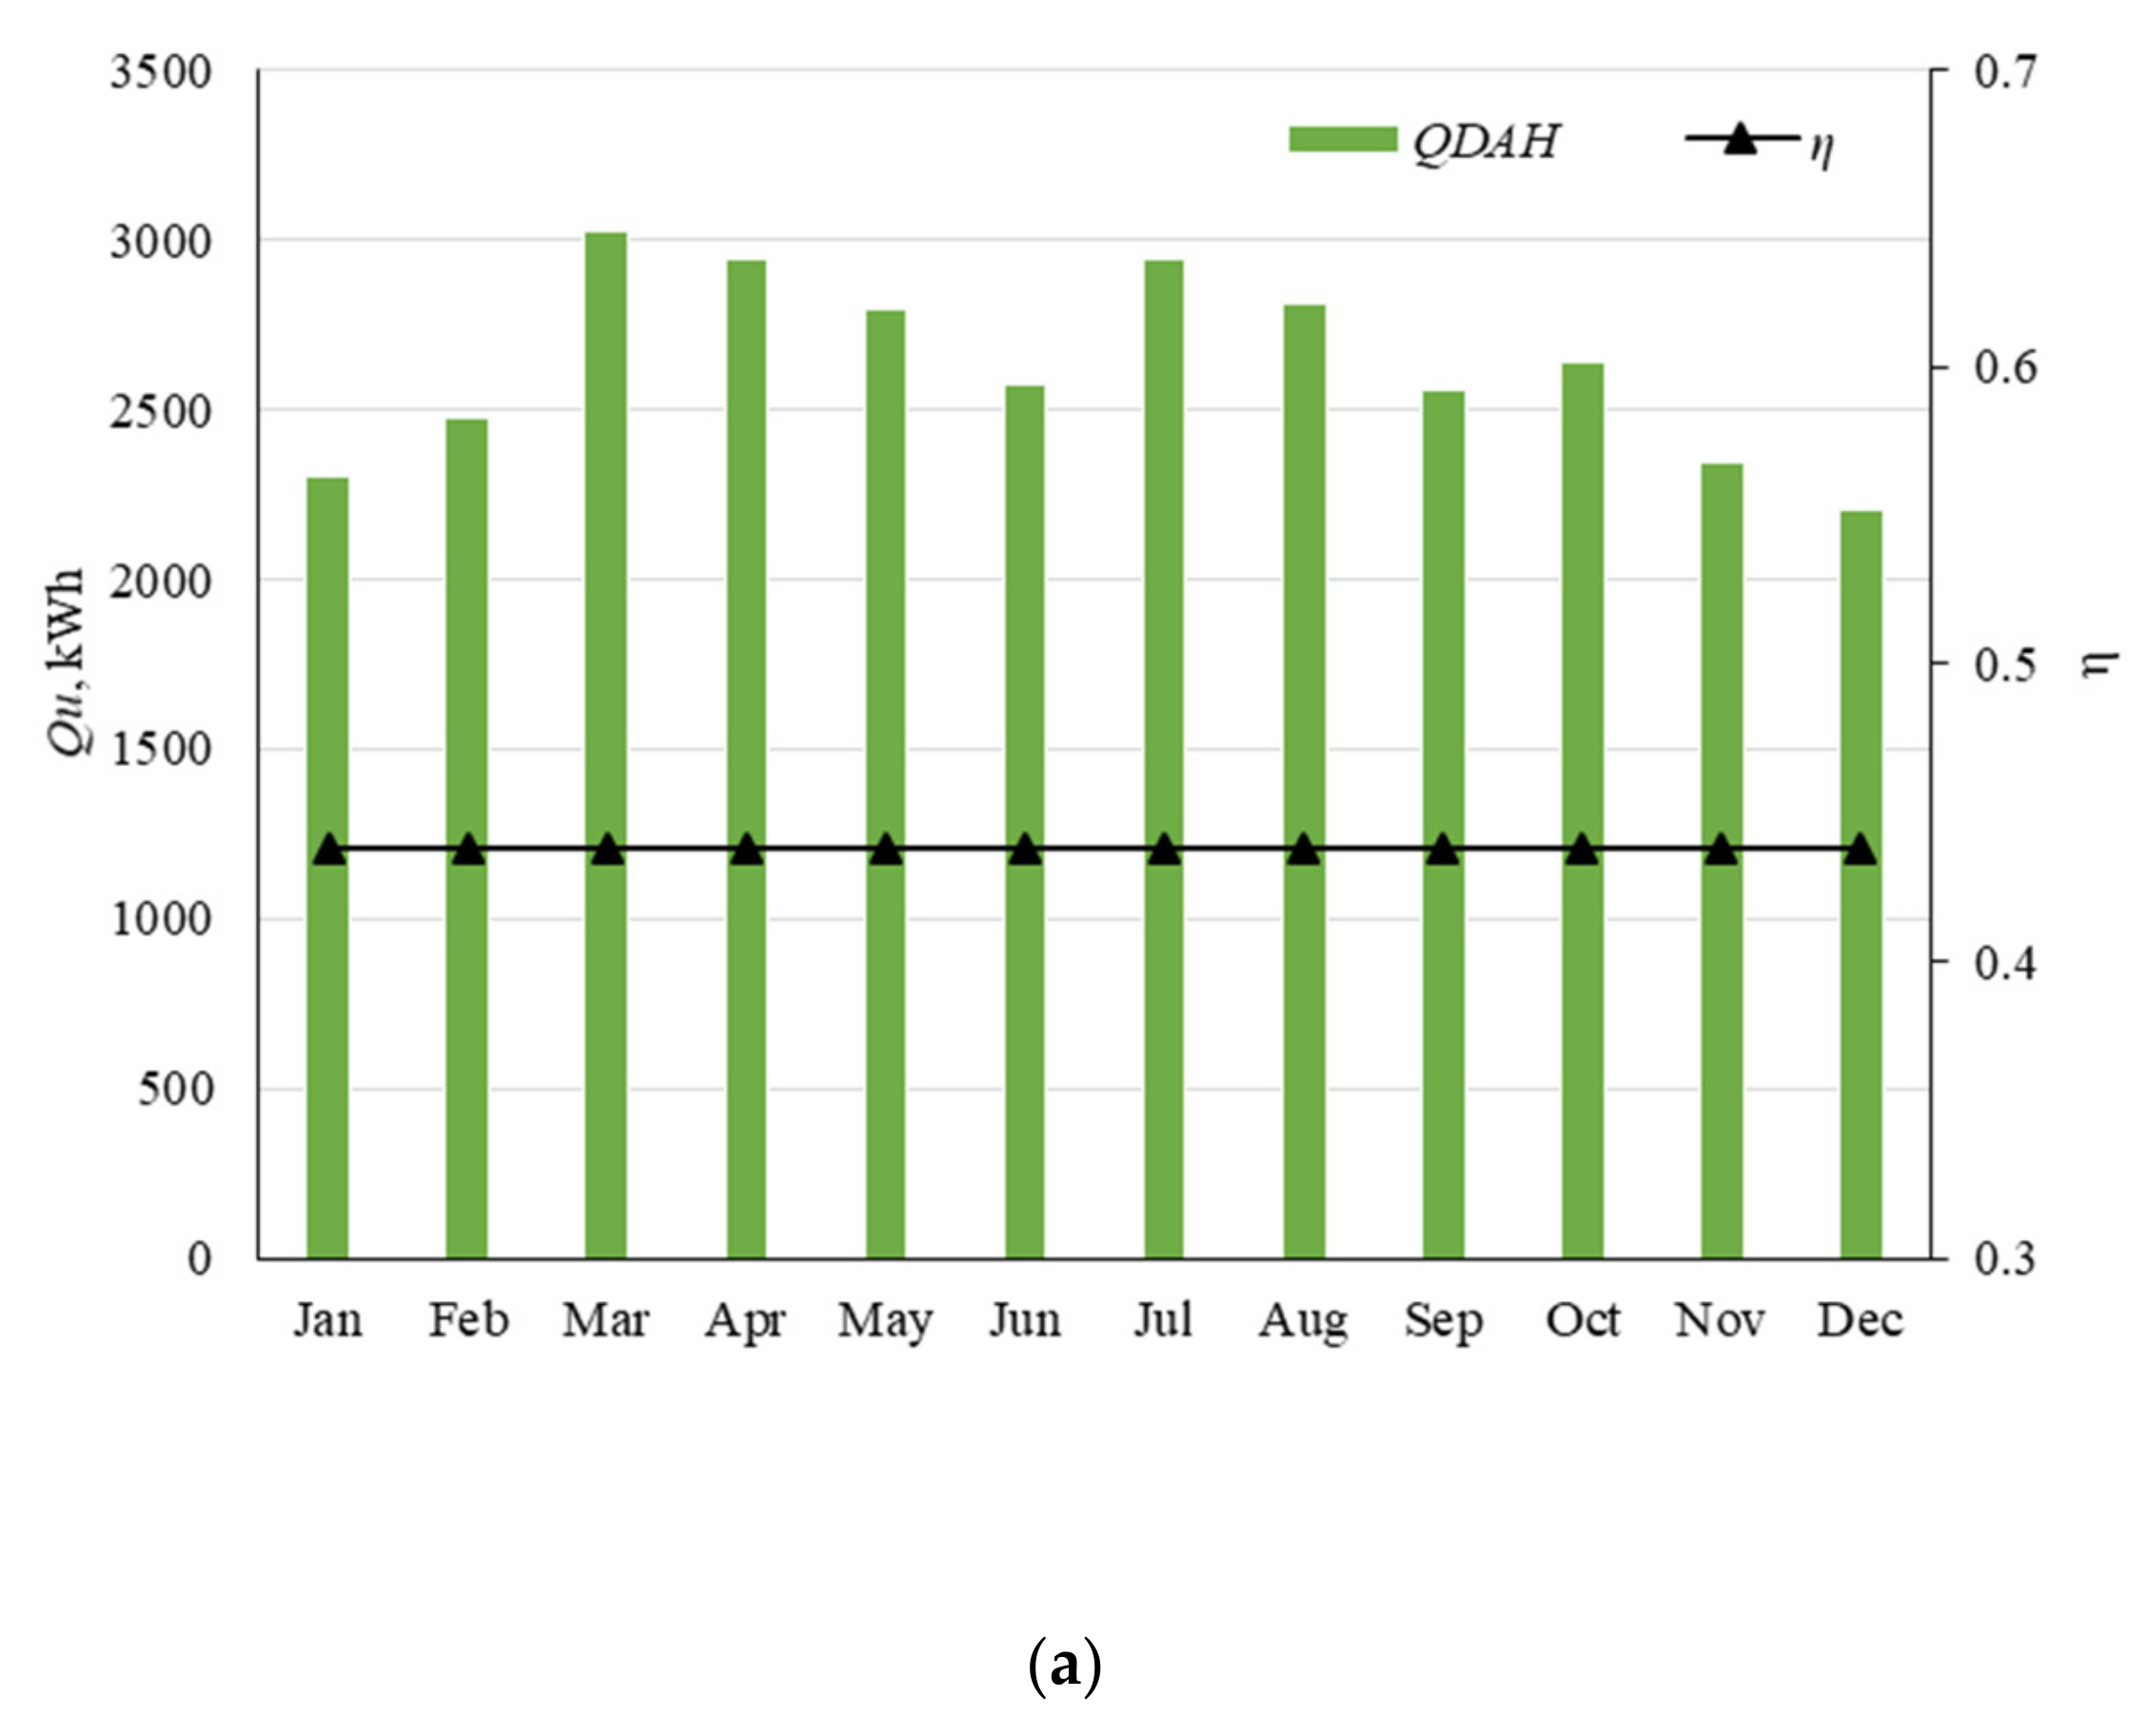
3.2.2. Thermal Performance

Figure 9a–c shows the annual thermal performance for the three proposed modes, according to Section 2.3. The useful annual energy amounts were 31.60, 55.19, and 75.18 MWh. The overall efficiencies were 0.40, 0.37, and 0.39. The thermal efficiencies were 0.44, 0.41, and 0.42. The solar fractions were 0.45 and 0.73 for modes 2 and 3; as observed, SF only applied to modes 2, and 3, following Equation (14). The hybridization allowed increasing the useful energy by 58% and 27% compared with mode 1 and mode 2. Compared with mode 2, the hybrid mode allowed increasing the solar fraction from 0.45 to 0.73, which represents a 42% improvement.
Figure 10 shows the annual maximum, minimum, and average temperature. As seen, in mode 1, the system output temperature was 15.0–54.75 °C, and the average temperature was 37.3 °C; in mode 2, the range was 36.3–53.4 °C, with an average of 45.7 °C; and in mode 3, the range was 39.0–67.6 °C, with an average of 53.8 °C. As observed in mode 1, the minimum temperature corresponded to the ambient temperature because the air heating system did not run significantly.
In the annual thermal performance assessment, the results show that the hybrid mode (mode 3) is most suited for applications where the required drying temperature is higher than 40 °C. However, auxiliary heating is needed, and the thermal efficiency is lower than direct air heating (Mode 1). Mode 1 is more convenient for lower drying temperature applications because it is not necessarily auxiliary heating and has higher thermal efficiency (0.44). Thermal performance varies from month to month due to the natural variation of solar radiation. For Mode 1, the monthly useful energy was 2300–2945 kWh, and the thermal efficiency was 0.44. For Mode 2, the monthly useful energy was 4286–4926 kWh, the thermal efficiency was 0.39–0.43, and the solar fraction was 0.31–0.62. For Mode 3, the monthly useful energy was 5838–6518 kWh, the thermal efficiency was 0.41–0.43, and the solar fraction was 0.57–0.86. As seen, the thermal performance changes through the seasons over the year. Hence, a more accurate annual performance assessment must consider these thermal performance changes.

3.2.3. Sensitivity Analysis

Figure 11 shows the correlation coefficient matrix using Pearson coefficients: positive values are directly proportional, and negative values are inversely proportional. As observed, the solar useful energy Qusol was highly correlated (>0.90) with the solar radiation Qsol and the drying temperature T10, and had a strong relationship (>0.80) with the ambient temperature. The solar fraction SF showed a high correlation (>0.90) with the ambient temperature Ta, the solar radiation Qsol, the drying temperature T10, and the useful energy Qusol; additionally, the solar fraction SF presented a strong correlation with the efficiency (>0.80). The efficiency presented a strong correlation (>0.80) with the ambient temperature Ta, the solar radiation Qsol, the drying temperature T10, the useful energy Qusol, and the solar fraction SF. As expected, the ambient temperature Ta and the solar radiation Qsol were the meteorological variables that correlated better with the thermal performance parameters Qusol, SF, and efficiency. Solar radiation and ambient temperature were the most influential environmental variables on performance. A negative correlation of the wind velocity with the thermal performance parameters could be expected. However, the relative humidity RH and the wind velocity had a low correlation coefficient with all thermal performance parameters. The weak correlation factor may have been caused due to the dataset and not by physical phenomena. The auxiliary energy Qax negatively correlated with the ambient temperature Ta, the solar radiation Qsol, the drying temperature T10, the solar useful energy Qusol, the solar fraction SF, and the efficiency. Therefore, the greater the auxiliary energy Qax, the lower the thermal performance.

3.2.4. Hybrid Mode Parametric Study

The hybrid mode parametric study was conducted considering three set point temperatures in the auxiliary water heater (65, 75, and 85 °C) and a mass flow rate between 1000–20,000 kg/h. Figure 12a shows the output temperature and efficiency as a function of the mass flow rate, and Figure 12b shows the useful energy and solar fraction as a function of the mass flow. In both cases, the system simulated was under three temperature set points in the auxiliary heater. At lower flow rates, the temperature and the solar fraction increased, but at the same time, the useful energy and the efficiency decreased. The maximum temperature was at 1000 kg/h and a set point temperature of 85 °C. The annual thermal efficiency and annual average temperature ranges were 0.29–0.48 and 34.1–68.54 °C, respectively. Following Figure 12b, the annual useful energy and the annual solar fraction were 39.17–207.31 MWh and 0.30–0.99. The graphical tool developed through the parametric study allowed consideration of solar thermal design and optimization according to the temperature and mass flow rate requirements of the specific drying process.
The annual thermal efficiency and flow rate relationship was almost linear between 1000–4000 kg/h; the annual efficiency changes concerning the flow rate were up to 7000 kg/h. On the other hand, the annual efficiency changes due to the auxiliary heater set point presented an average variation of 2.0%. Thus, the annual efficiency was more sensitive to the flow rate than the auxiliary heater set point temperature, and the drying temperature was affected by both flow rate and auxiliary heater set point temperature. In the same way, the annual solar fraction increased, and the yearly useful energy decreased almost linearly between 1000–4000 kg/h.

4. Conclusions

In this study, the yearly thermal performance assessment of a direct–indirect air solar heating system for drying was conducted by TRNSYS, adjusting and validating the annual simulator with experimental data. The simulation platform adjustment considered the storage tank loss coefficient and the heat exchanger effectiveness. The storage tank loss coefficient of 3.21 W/m2K was calculated by the log mean difference temperature method and field data. One-day field data determined the heat exchanger effectiveness of 0.39. The simulator validation compared numerical and experimental outlet temperature, and the useful energy of each major component and the deviation were determined by the RMSE and the %MAE, respectively. The maximum average RMSE of 1.5 °C and the %MAE of 7.0 were found in the single-glazed solar collectors field.
The yearly useful energy values were 31.60, 55.19, and 75.18 MWh; the thermal efficiencies were 0.44, 0.41, and 0.42 in each of three operations modes; considering blower consumption, the total efficiencies were 0.40, 0.37, and 0.39 for Mode 1, Mode 2, and Mode 3, respectively. The electric consumption represented a 3% decrease in efficiency. The annual SF values were 0.45 and 0.73 for Mode 2 and Mode 3, respectively. The hybrid direct–indirect solar air heating system presented an increased annual performance of 58% of the yearly useful energy compared with the direct mode and 42% of the yearly solar fraction compared with the indirect mode. The best thermal yearly efficiency was for the hybrid direct–indirect operation mode. However, the average yearly temperature was the smallest at 37.3 °C. The maximum annual average temperature was in the hybrid direct–indirect solar-aux air heating system at 53.8 °C.
In the parametric study, the hybrid solar system could reach a solar fraction up to 0.98 and a thermal efficiency of 0.48, depending on the mass flow rate. The mass flow rate increased, as did the efficiency, but the temperature also decreased. However, it is crucial to consider the required air temperature and mass flow rate. The optimization tool developed allows the operating parameters to be determined according to the needed thermal output for the drying process of an industrial hybrid direct–indirect solar air heating system. The annual performance assessment of solar air heating systems allows determining the performance and drying temperatures in the long term under variable conditions.
The hybridization increases technical and operation issues, as well as opportunities of specific applications. The operation strategies of a hybrid drying system are more complicated than solar drying with only air solar heaters. The operation modes have to be changed manually in the studied system, making the operation more complicated. A control scheme also increases the investment as well as the operating costs. For instance, Mode 3 (hybrid systems) increases the initial investment by almost three times than Mode 1 (direct air heating), although Mode 3 can work with higher drying temperatures and longer operation periods. Further research should determine the economic viability and the possible improvements for each specific product to be dried. This experimental set up was monitored and built for research purposes, which justifies having several different modes of operation.

Author Contributions

Conceptualization, formal analysis, writing—review and editing, and visualization, F.Á.-S., J.F.-P. and O.G.-V. Methodology, validation, sofware, investigaction, data curation, and writing—original draft preparation, F.Á.-S. and J.F.-P. Resources, project administration and funding acquisition J.F.-P. and O.G.-V. Supervision, J.F.-P. All authors have read and agreed to the published version of the manuscript.

Funding

This research were funded by the CONACYT, PRODEP and UNAM, grant numbers projects PRODETES17-PCL-000020, PRODEP-CENIDET-CA-18 and UNAM-PAPIIT IN103021, respectively; and the APC was funded by PRODEP.

Institutional Review Board Statement

Not applicable.

Informed Consent Statement

Not applicable.

Data Availability Statement

Not applicable.

Acknowledgments

The authors are grateful to CONACYT, for financial support by means of a scholarship.

Conflicts of Interest

The authors declare no conflict of interest.

Nomenclature

a0First-term solar collector thermal efficiency equation (-)
a1Second-term solar collector thermal efficiency equation, W/m2K
a2Third-term solar collector thermal efficiency equation, W/m2 K2
ASTStorage tank area, m2
Awt,DGDouble-glazed solar collector area, m2
Awt,SGSingle-glazed solar collector area, m2
CarThermal capacitance of air, kJ/K
Cp,arSpecific heat of air, kJ/kgK
Cp,wtSpecific heat of water, kJ/kgK
LMTDLog mean temperature difference, K
ITSolar irradiance on tilt surface W/m2
QEnergy, kWh
QaxAuxiliary heat, kWh
Qcol,DGDouble-glazed solar collectors useful energy, kWh
Qcol,SGSingle-glazed solar collectors useful energy, kWh
Qs,arSolar energy incident on DAH, kWh
Qs,DGSolar energy incident on double-glazed collectors, kWh
Qs,SGSolar energy incident on single-glazed collectors, kWh
QtkStorage tank useful energy, kWh
QuUseful energy, kWh
RMSERoot-mean-square error (-)
SFSolar fraction (-)
t1Initial time, minutes
t2Final time, minutes
TaAmbient temperature, °C
ULtkTank loss coefficient, W/ m2K
Greek letters
εHeat exchanger effectiveness (-)
η Thermal efficiency (-)
η 0 Overall efficiency (-)
Subscripts
DAHDirect air heating
DAHSDirect air heating system
HAHHybrid air heating
IAHIndirect air heating
IAHSIndirect air heating systems

References

  1. U.S. Energy Information Administration. International Energy Outlook 2019 with Projections to 2050; U.S. Energy Information Administration: Washington, DC, USA, 2019.
  2. Sharma, A.K.; Sharma, C.; Mullick, S.C.; Kandpal, T.C. Solar Industrial Process Heating: A Review. Renew. Sustain. Energy Rev. 2017, 78, 124–137. [Google Scholar] [CrossRef]
  3. Solar Payback. Available online: https://www.solar-payback.com/wp-content/uploads/2018/06/Solar-Payback_Calor-Solar-para-la-Industria_Mexico.pdf (accessed on 15 January 2021).
  4. Inventario Nacional de Emisiones de Gases y Compuestos de Efecto Invernadero. Available online: https://www.gob.mx/inecc/acciones-y-programas/inventario-nacional-de-emisiones-de-gases-y-compuestos-de-efecto-invernadero (accessed on 22 January 2021).
  5. Sarafraz, M.M.; Safaei, M.R.; Leon, A.S.; Tlili, I.; Alkanhal, T.A.; Tian, Z.; Goodarzi, M.; Arjomandi, M. Experimental Investigation on Thermal Performance of a PV/T-PCM (Photovoltaic/Thermal) System Cooling with a PCM and Nanofluid. Energies 2019, 12, 2572. [Google Scholar] [CrossRef] [Green Version]
  6. International Renewable Energy Agency. Solar Heat for Industrial Processes. In Technology Brief; International Renewable Energy Agency: Abu Dhabi, United Arab Emirates, 2015. [Google Scholar]
  7. Jos, F.; Montero, I.; Arranz, I.; Lozano, F.J.; Matamoros, M.; Rodr, P. Analysis of Potential Use of Linear Fresnel Collector for Direct Steam Generation in Industries of the Southwest of Europe. Energies 2019, 12, 4049. [Google Scholar] [CrossRef] [Green Version]
  8. Motevali, A.; Chayjan, R.A. Effect of Various Drying Bed on Thermodynamic Characteristics. Case Stud. Therm. Eng. 2017, 10, 399–406. [Google Scholar] [CrossRef]
  9. Das Purkayastha, M.; Nath, A.; Chandra Deka, B.; Lata Mahanta, C. Thin Layer Drying of Tomato Slices. J. Food Sci. Technol. 2011, 50, 654. [Google Scholar] [CrossRef] [PubMed] [Green Version]
  10. Khanlari, A.; Ozge, H.; Doğuş Tuncer, A.; Şirin, C.; Bilge, Y.; Yilmaz, Y.; Güngör, A. Experimental and Numerical Study of the Effect of Integrating plus- Shaped Perforated Baffles to Solar Air Collector in Drying Application. Renew. Energy 2020, 145, 1677–1692. [Google Scholar] [CrossRef]
  11. Ekechukwu, O.V.; Norton, B. Review of Solar-Energy Drying Systems III: Low Temperature Air-Heating Solar Collectors for Crop Drying Applications. Energy Convers. Manag. 1999, 40, 657–667. [Google Scholar] [CrossRef]
  12. Pérez-Espinosa, R.; García-Valladares, O.; Pilatowsky, I. Numerical Modeling and Experimental Validation of Back-Pass Rectangular Ducts Solar Air Heaters. Appl. Therm. Eng. 2020, 171, 115018. [Google Scholar] [CrossRef]
  13. El Manssouri, O.; Hajji, B.; Tina, G.M.; Gagliano, A.; Aneli, S. Electrical and Thermal Performances of Bi-Fluid PV/Thermal Collectors. Energies 2021, 14, 1633. [Google Scholar] [CrossRef]
  14. Nabnean, S.; Janjai, S.; Thepa, S.; Sudaprasert, K.; Songprakorp, R.; Bala, B.K. Experimental Performance of a New Design of Solar Dryer for Drying Osmotically Dehydrated Cherry Tomatoes. Renew. Energy 2016, 94, 147–156. [Google Scholar] [CrossRef]
  15. Boughali, S.; Benmoussa, H.; Bouchekima, B.; Mennouche, D.; Bouguettaia, H.; Bechki, D. Crop Drying by Indirect Active Hybrid Solar—Electrical Dryer in the Eastern Algerian Septentrional Sahara. Sol. Energy 2009, 83, 2223–2232. [Google Scholar] [CrossRef]
  16. Čipliene, A.; Novošinskas, H.; Raila, A.; Zvicevičius, E. Usage of Hybrid Solar Collector System in Drying Technologies of Medical Plants. Energy Convers. Manag. 2015, 93, 399–405. [Google Scholar] [CrossRef]
  17. López-Vidaña, E.C.; Méndez-Lagunas, L.L.; Rodríguez-Ramírez, J. Efficiency of a Hybrid Solar-Gas Dryer. Sol. Energy 2013, 93, 23–31. [Google Scholar] [CrossRef]
  18. Montero, I.; Miranda, M.T.; Sepúlveda, F.J.; Arranz, J.I.; Rojas, C.V.; Nogales, S. Solar Dryer Application for Olive Oil Mill Wastes. Energies 2015, 8, 14049–14063. [Google Scholar] [CrossRef] [Green Version]
  19. Arkian, A.H.; Najafi, G.; Gorjian, S.; Loni, R.; Bellos, E.; Yusaf, T. Performance Assessment of a Solar Dryer System Using Small Parabolic Dish and Alumina/Oil Nanofluid: Simulation and Experimental Study. Energies 2019, 12, 4747. [Google Scholar] [CrossRef] [Green Version]
  20. Yassen, T.A.; Al-Kayiem, H.H. Experimental Investigation and Evaluation of Hybrid Solar/thermal Dryer Combined with Supplementary Recovery Dryer. Sol. Energy 2016, 134, 284–293. [Google Scholar] [CrossRef]
  21. Hao, W.; Liu, S.; Mi, B.; Lai, Y. Mathematical Modeling and Performance Analysis of a New Hybrid Solar Dryer of Lemon Slices for. Energies 2020, 13, 350. [Google Scholar] [CrossRef] [Green Version]
  22. Tiwari, S.; Tiwari, G. Exergoeconomic analysis of photovoltaic-thermal (PVT) mixed mode greenhouse solar dryer. Energy 2016, 114, 155–164. [Google Scholar] [CrossRef]
  23. Tiwari, S.; Bhatti, J.; Tiwari, G.; Al-Helal, I. Thermal modelling of photovoltaic thermal (PVT) integrated greenhouse system for biogas heating. Sol. Energy 2016, 136, 639–649. [Google Scholar] [CrossRef]
  24. Janjai, S. A Greenhouse Type Solar Dryer for Small-Scale Dried Food Industries: Development and Dissemination. Int. J. Energy Environ. 2012, 3, 383–398. [Google Scholar]
  25. Condorí, M.; Duran, G.; Echazú, R.; Altobelli, F. Semi-Industrial Drying of Vegetables Using an Array of Large Solar Air Collectors. Energy Sustain. Dev. 2017, 37, 1–9. [Google Scholar] [CrossRef]
  26. García-Valladares, O.; Ortiz, N.M.; Menchaca, A.C.; Pilatowsky, I. Solar Thermal Drying Plant for Agricultural Porducts. Part 1: Direct Air Heating System. Renew. Energy 2019, 148, 1302–1320. [Google Scholar] [CrossRef]
  27. Ortiz-Rodríguez, N.M.; García-Valladares, O.; Pilatowsky-Figueroa, I.; Menchaca-Valdez, A.C. Solar-LP Gas Hybrid Plant for Dehydration of Food. Appl. Therm. Eng. 2020, 177, 115496. [Google Scholar] [CrossRef]
  28. El Mkadmi, C.; Wahed, A. Optimization of a Solar Thermal System for Low Temperature Industrial Heating Process. In Proceedings of the 2016 International Renewable and Sustainable Energy Conference, Marrakech, Morocco, 14–17 November 2016; pp. 313–319. [Google Scholar] [CrossRef]
  29. Vargas-Bautista, J.P.; García-Cuéllar, A.J.; Pérez-García, S.L.; Rivera-Solorio, C.I. Transient Simulation of a Solar Heating System for a Small-Scale Ethanol-Water Distillation Plant: Thermal, Environmental and Economic Performance. Energy Convers. Manag. 2017, 134, 347–360. [Google Scholar] [CrossRef]
  30. Allouhi, A.; Agrouaz, Y.; Benzakour Amine, M.; Rehman, S.; Buker, M.S.; Kousksou, T.; Jamil, A.; Benbassou, A. Design Optimization of a Multi-Temperature Solar Thermal Heating System for an Industrial Process. Appl. Energy 2017, 206, 382–392. [Google Scholar] [CrossRef]
  31. Bolognese, M.; Viesi, D.; Bartali, R.; Crema, L. Modeling Study for Low-Carbon Industrial Processes Integrating Solar Thermal Technologies. A Case Study in the Italian Alps: The Felicetti Pasta Factory. Sol. Energy 2020, 208, 548–558. [Google Scholar] [CrossRef]
  32. Lugo, S.; Octavio, G.; Best, R.; Hernández, J.; Hernández, F. Numerical Simulation and Experimental Validation of an Evacuated Solar Collector Heating System with Gas Boiler Backup for Industrial Process Heating in Warm Climates. Renew. Energy 2019, 139, 1120–1132. [Google Scholar] [CrossRef]
  33. Montoya-Márquez, O.; Flores-Prieto, J.J. Heat Removal Factor in Flat Plate Solar Collectors: Indoor Test Method. Energies 2018, 11, 2783. [Google Scholar] [CrossRef] [Green Version]
Figure 1. Solar hybrid air heating system.
Energies 14 05417 g001
Figure 2. Components of the solar air heating system.
Energies 14 05417 g002
Figure 3. Solar air heating system instrumentation.
Energies 14 05417 g003
Figure 4. Simulation platform.
Energies 14 05417 g004
Figure 5. T1 and QDAH theoretical–experimental comparison. (a) 13/July/2020 T1; (b) 13/July/2020, QDAH; (c) 15/July/2020, T1; (d) 15/July/2020, QDAH; (e) 22/April/2020, T1; (f) 22/April/2020, QDAH.
Energies 14 05417 g005aEnergies 14 05417 g005b
Figure 6. Solar water collectors theoretical–experimental outlet temperature and useful energy comparison. (a) 14/July/2020, T3; (b) 14/July/2020, Qcol,SG; (c) 17/July/2020, T3; (d) 17/July/2020, Qcol,SG; (e) 14/July/20, T4; (f) 14/July/2020, Qcol,DG; (g) 17/July/2020, T4; (h) 17/July/2020, Qcol,DG.
Energies 14 05417 g006aEnergies 14 05417 g006b
Figure 7. Storage tank experimental–simulated comparative, 17/July/2020.
Energies 14 05417 g007
Figure 8. Heat exchanger experimental–simulated comparative, 21/August/2020. (a) T10; (b) QIAH.
Energies 14 05417 g008
Figure 9. Useful energy Qu, efficiency η and solar fraction SF. (a) Mode 1; (b) Mode 2; (c) Mode 3.
Energies 14 05417 g009aEnergies 14 05417 g009b
Figure 10. Maximum, minimum, and average drying temperature T10. (a) Mode 1; (b) Mode 2; (c) Mode 3.
Energies 14 05417 g010aEnergies 14 05417 g010b
Figure 11. Sensitivity analysis.
Energies 14 05417 g011
Figure 12. Parametric study. (a) Temperature T10 vs. Efficiency η; (b) Qu vs. SF.
Energies 14 05417 g012
Table 1. Solar heating components characteristics.
ParameterValueParameterValue
Air solar collector Double-glazed solar water collector
Number of air collectors16Number of collectors8
Cpar, kJ/kg K1.01Cpwt, kJ/kg K4.19
Aar, m22.326Awt,DG m22.326
a0 (-)0.5421a0 (-)0.6738
a1, W/m2K5.1838a1, W/m2K2.0513
a2, W/m2K0.0011a2, W/m2K0.0010
Single-glazed solar water collector Storage tank
Number of collectors8Height, m1.60
a0 (-)0.7468Diameter, m1.55
a1, W/m2K3.42Storage volume, m32.0
a2, W/m2K0.013Average boiler efficiency 0.91
Azimuth, °0.0
Title, °18.0
Table 2. Meteorological variables.
DayTa, °CIT, W/m2RH, %
22 April 202030.9–35.9311–98137.2–48.9
13 July 202025.1–29.4683–93545.0–63.9
14 July 202025.3–30.7544–908503.0–65.0
15 July 202024.2–30.8722–91249.1–57.9
17 July 202025.6–31.3664–90136.7–54.1
21 August 202026.5–33.1102–68252.9–58.0
Publisher’s Note: MDPI stays neutral with regard to jurisdictional claims in published maps and institutional affiliations.

