Article

Comparison of Optimized and Conventional Models of Passive Solar Greenhouse—Case Study: The Indoor Air Temperature, Irradiation, and Energy Demand

by
Saleh Mohammadi
1,
Esmail Khalife
2,*,
Mohammad Kaveh
1,
Amir Hosein Afkari Sayyah
1,
Ali Mohammad Nikbakht
3,
Mariusz Szymanek
4,* and
Jacek Dziwulski
5
1
Department of Mechanic of Biosystems Engineering, University of Mohaghegh Ardabili, Ardabil 56199-11367, Iran
2
Department of Civil Engineering, Cihan University-Erbil, Kurdistan Region, Erbil 44001, Iraq
3
Department of Mechanic of Biosystems Engineering, University of Urmia, Urmia 57561-51818, Iran
4
Department of Agricultural, Forest and Transport Machinery, University of Life Sciences in Lublin, Głęboka 28, 20-612 Lublin, Poland
5
Department of Strategy and Business Planning, Faculty of Management, Lublin University of Technology, Nadbystrzycka 38, 20-618 Lublin, Poland
*
Authors to whom correspondence should be addressed.
Energies 2021, 14(17), 5369; https://doi.org/10.3390/en14175369
Submission received: 29 July 2021 / Revised: 21 August 2021 / Accepted: 24 August 2021 / Published: 28 August 2021
(This article belongs to the Special Issue Energy Security and the Transition toward Green Energy Production)

Abstract

:
This study was carried out to optimize a computational model of a new underground passive solar greenhouse to improve thermal performance, storage, and saving of heat solar energy. Optimized and conventional passive solar greenhouse were compared in regards of indoor air temperature, irradiation, and energy demand. Six different materials were used in the conventional model. In addition, TRNSYS software was employed to determine heat demand and irradiation in the greenhouse. The results showed that the annual total heating requirement in the optimized model was 30% lower than a conventional passive solar system. In addition, the resulting average air temperature in the optimized model ranged from −4 to 33.1 °C in the four days of cloud, snow, and sun. The average air temperature in the conventional passive solar greenhouse ranged from −8.4 to 24.7 °C. The maximum monthly heating requirement was 796 MJ/m2 for the Wtype87 model (100-mm lightweight concrete block) and the minimum value was 190 MJ/m2 for the Wtype45 model (50-mm insulation with 200-mm clay tile) in a conventional passive solar greenhouse while the monthly heating requirement estimated 126 MJ/m2 for the optimized greenhouse model. The predictability of the TRNSYS model was calculated with a coefficient of determination (R2) of 95.95%.

1. Introduction

The energy consumption improvement in a greenhouse is the main problem for greenhouse sustainable agriculture. Over the last few decades, many important attempts have been done to realize this target. In the beginning, energy screens at greenhouses were introduced for the first time [1]. Later, studies focused on the possibilities of greenhouse temperature integration [2] and, thereafter, energy leakage in greenhouse construction was taken into consideration [3,4]. The key parameter to reduce greenhouse gases can be attained by reducing energy demand. Since the beginning of 20th century, researchers have focused on harvesting energy during the summer to consume during winter in semi-closed greenhouses [5]. However, this type of greenhouses necessitates heavy investments and are not economical unless enough additional production is anticipated. This problem caused another approach be considered to reduce investment costs.
The best approach is to reduce the heat requirement by insulation and using sustainable resources such as using saved heat during the day and using it at night. As the cover materials of greenhouse are considered for the greatest light transmission, the insulating attributes of a greenhouse building are lower than those of a regular building. From the other side, up to 90% of total energy demand of greenhouses belongs to heating systems [6]. In cold climate conditions, greenhouse heating demands are considerably increased and this problem limits closed greenhouse applicability. Accordingly, experiments have showed that semi-closed greenhouses equipped with heat recovery could effectively decrease heating usage during the summer up to 50%, while the reductions during the rest of the year was insignificant [7]. In another study, Wong et al. who conducted a study to assess the closed greenhouse with seasonal heat storage designed for Canada climate condition and they claimed an 86% reduction in annual greenhouse gas emissions [8]. Lately, Yildiz et al. compared three types of greenhouse (regular, semi-closed, and closed greenhouse) with heat pumps in Canada [9]. Their results showed that the semi-closed greenhouse provided remarkable savings in energy consumption as well as water consumption in comparison with the conventional greenhouse. For greenhouse with seasonal storage systems, an interesting property which to be considered is the surplus energy ratio. The surplus energy ratio is the excess heat in the summer months to the heating demand in the winter months ratio [10]. A study conducted by Vadiee and Martin showed a surplus energy ratio of about three in an ideally closed system greenhouse [10]. They also reported that the key parameter on the return period of a closed system greenhouse with seasonal heat storage is the load of the system [10]. Shamim et al. investigated the role of the north wall in a solar greenhouse and in heat storage [11]. The north wall has a key role in designing greenhouses due to the fact that most received solar radiation in passive greenhouses comes from the south wall and south roof, while heat mainly passes out through the north wall. A significant reduction on heating requirement can be obtained by employing a heat storing north wall that could store received solar energy during the daytime for release at night. The material of a massively thick thermal mass is brick or cement blocks that filled with some materials contain high heat capacity such as sand and concrete [12].
In a study, Santamouris studied that the thermal performance of several heat storing north walls in greenhouses and argued that it could reduce heating demand around 35–50% which depends on the type of greenhouses and its location [13]. Gupta and Tiwari in 2005 investigated on the effect of several type of north wall material such as brick, concrete, and mud and concluded that the effect concrete wall has higher energy saving than other materials [14]. Also, Ghasemi et al. studied on energy saving capacity of the north wall constructed with brick and covered by concrete in different greenhouse size in Iran and claimed that application of a brick north wall in average size greenhouse could improve energy consumption up to 13.4% [15].
Among different simulation software, TRNSYS (TRaNsient System Simulation) is a comprehensive and extensible simulation software for multi-zone buildings such as a greenhouse. It is well developed to validate energy concepts of a closed system, such as a building hot water system, air conditioner equipment, control management, renewable energy systems, etc. In addition, described graphical components could easily be connected together by a mathematical model in the Simulation Studio in TRNSYS [16].
In recent years, several efforts have been done by using TRNSYS to design and analyze different greenhouses and it has been successfully evaluated by several researchers for the feasibility of prediction and modeling energy consumption of a greenhouse. Carlini et al. (2012) simulated thermal behavior and heat and light exchange between the outside and inside atmosphere of a greenhouse using TRNSYS [17]. Marucci et al. (2013) evaluated energy efficiency of a greenhouse using a simulation of the construction materials used and climatic conditions by employing TRNSYS [18]. Vadiee and Martin (2012) used TRNSYS in their study in order to calculate thermal load, energy required for a closed greenhouse, and compared the model to the experimental findings [19]. In another study, Zhang et al. (2015) presented an accurate model developed in TRNSYS for the amount of heat storage in soil [20]. In the study conducted by Patil et al. (2013) it was found that TRNSYS successfully simulated solar energy storage in some type of energy storage systems inside the greenhouse [21]. Modeling of thermal efficiency was precisely developed using TRNSYS [22]. Thermal modeling of a geothermal system was done using TRNSYS and the study findings were compared to experimental research performed by Chargui et al. revealed high accuracy of the inside temperature and the energy required estimation of a greenhouse [23]. In a study conducted by Candy et al., who modeled a greenhouse built in a cold and out of reach area in the Nepal, confirmed that TRNSYS potentially is able to determine humidity and inside temperature of a greenhouse during daylight time. However, they found that there were a small difference between the recorded temperature and that estimated at night time by the model, which could be related to the exact definition of axial fan and holes.
Literature review shows that TRNSYS has high potential for inside temperature calculations and energy required of the greenhouse. However, examination of various studies showed that most of the studies focused on the weather condition modeling in conventional greenhouses. To the best knowledge of the authors there is no study which has estimated energy requirement and inside temperature of a novel underground greenhouse. Indeed, the model was developed for an optimized greenhouse which was located one meter in depth and the north wall was built from excavated soil to prevent heat loss. In this research, several types of north wall materials (wood, brick, clay tile, concrete, and sheet metal) with variable thicknesses was modeled by TRNSYS3D software and compared with an optimized passive solar greenhouse model. The model used validated by measurement of indoor air temperatures in a constructed passive solar greenhouse. This comparison helps to recognize the more optimized model and the information of indoor air temperature and the energy demand in it.

2. Materials and Methods

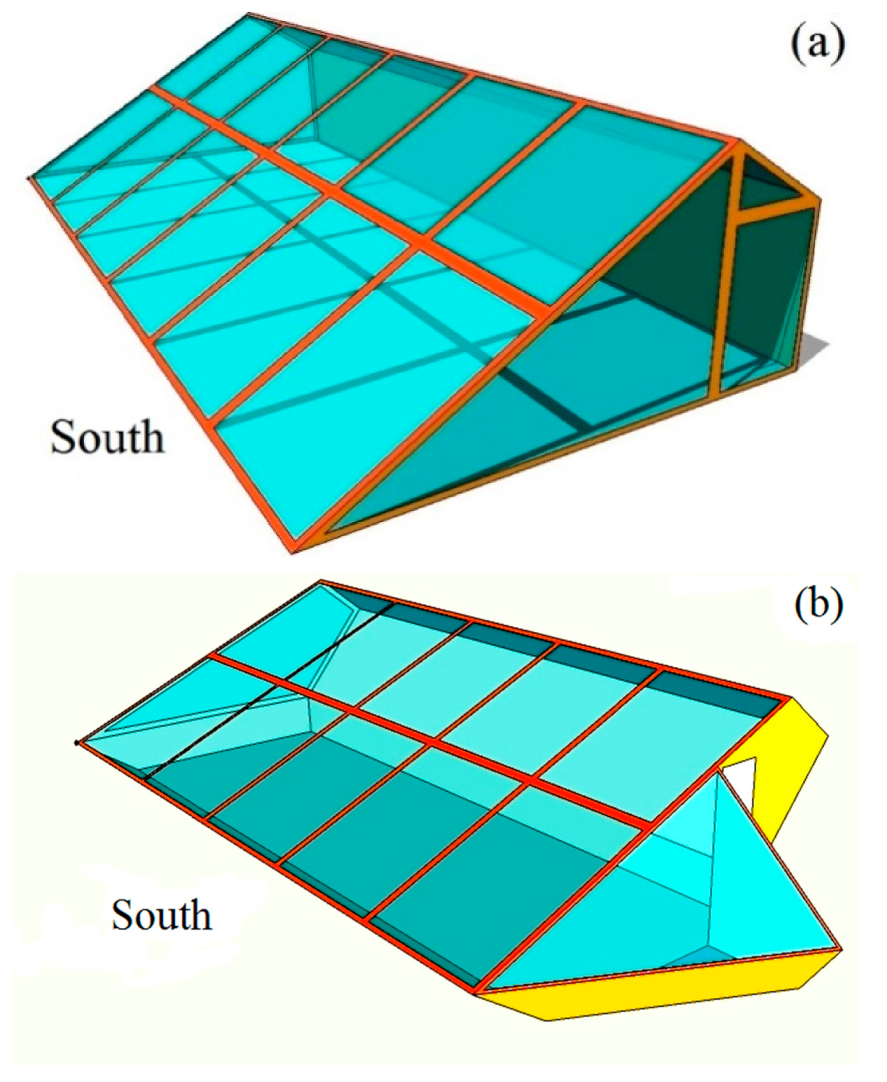
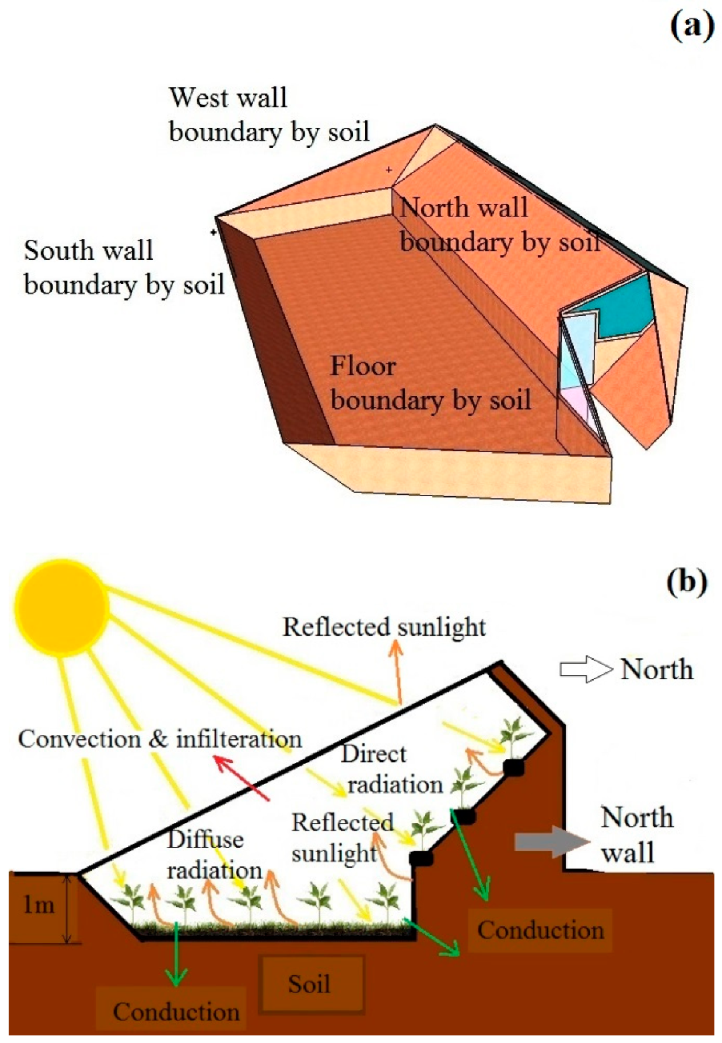
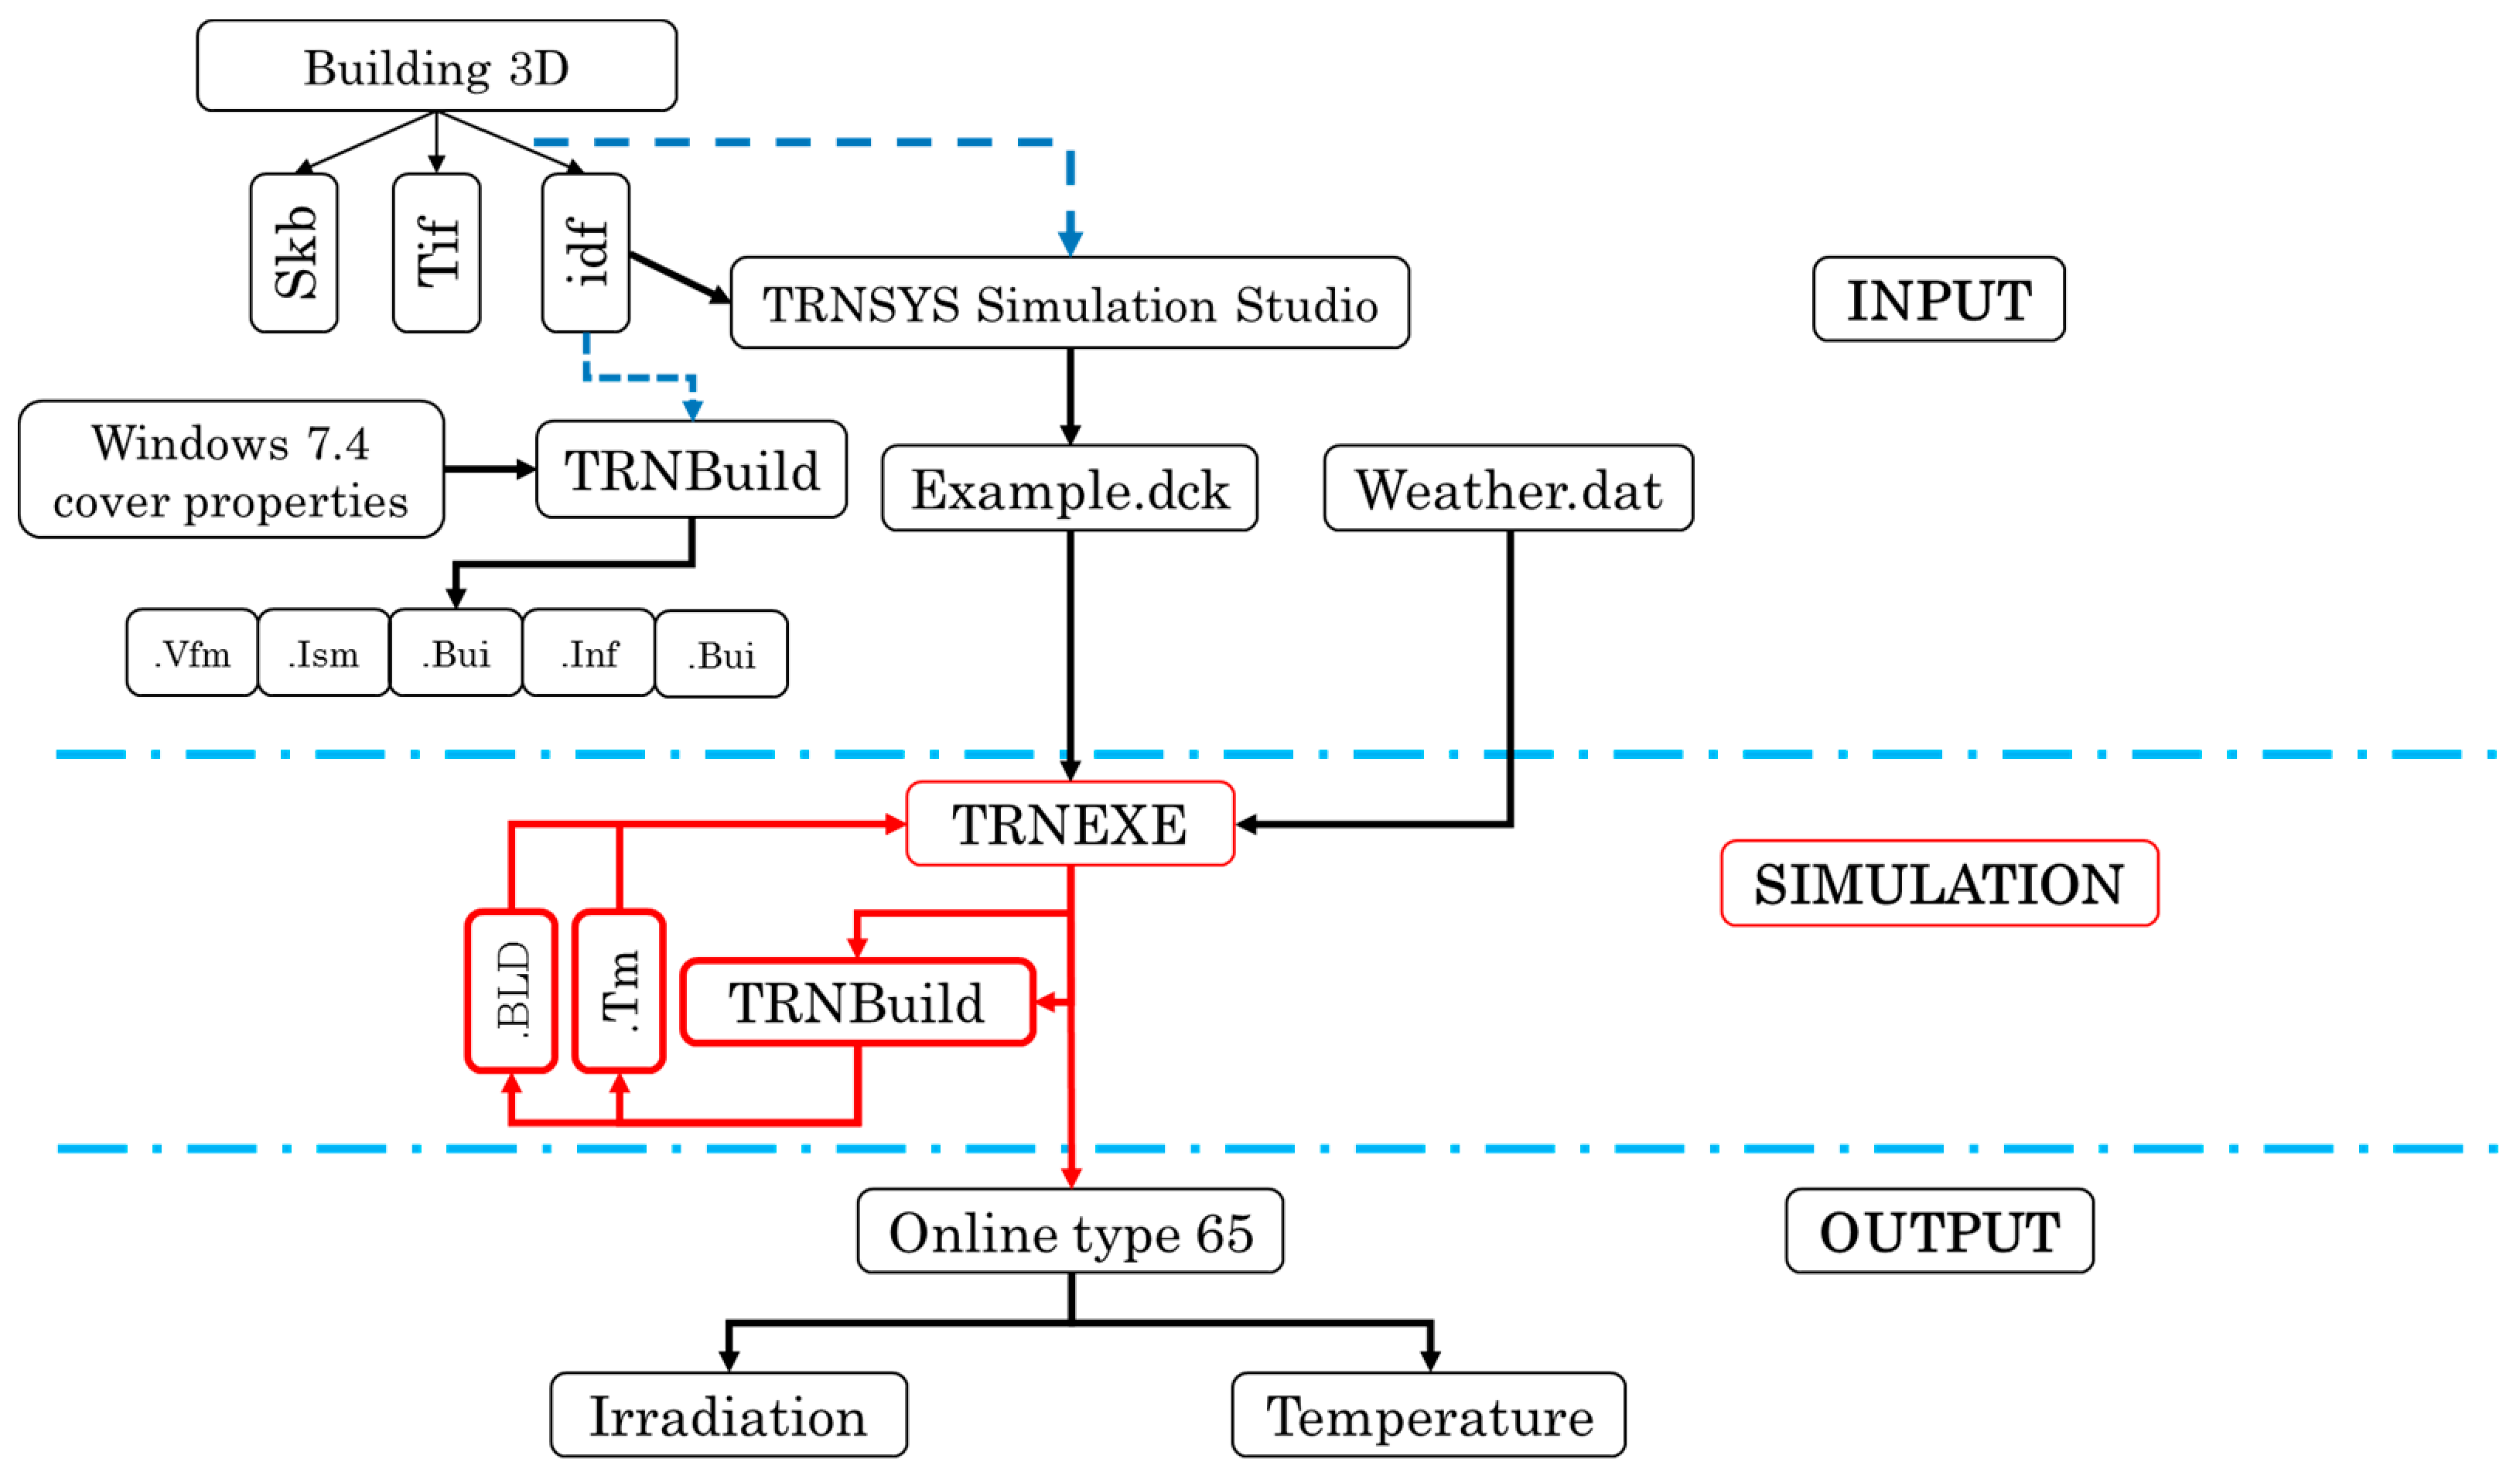
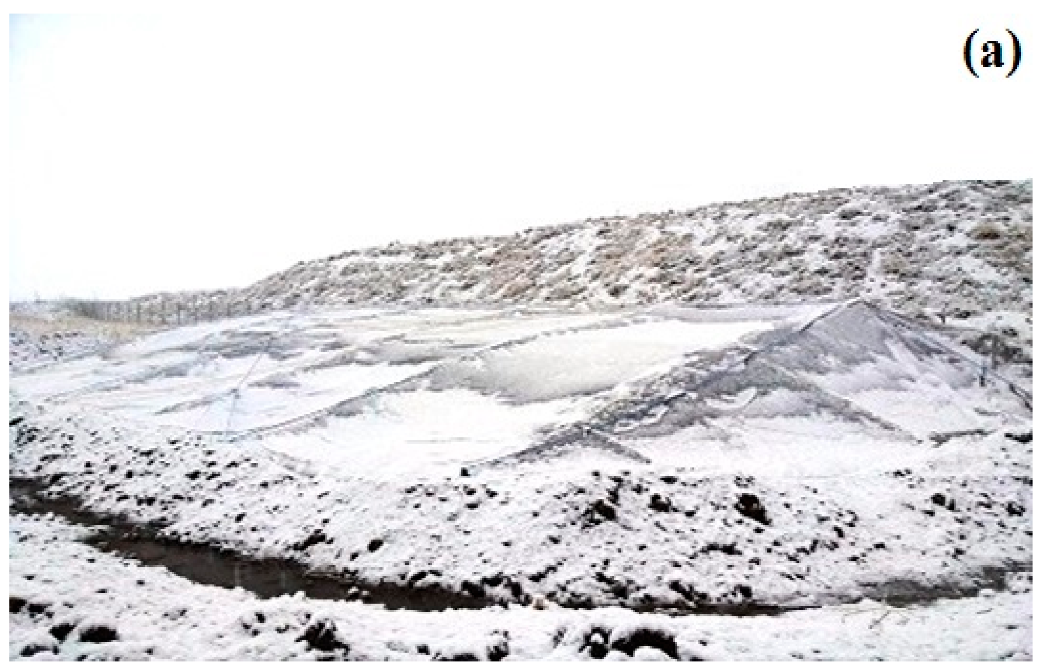
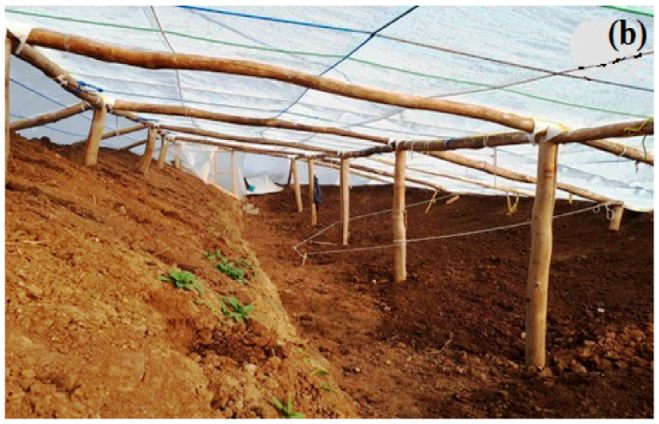
2.1. Design and Modeling

In the present study, three steps were used to construct the greenhouse building modeling: Sketch UP, 3-D drawing tool, and TRNBUILD, an interface to add the physical properties of the building to the geometry definition. These steps were drawing a three-dimensional model of the building in Sketch UP, importing the 3-D model to TRNBUILD for adding the thermal properties of the greenhouse, and, at last, creating the greenhouse information file (BUI) which consequently was imported to TRNSYS. In the following, a dynamic simulation model of the greenhouse thermal performance was developed using TRNSYS simulation. This aim was done by importing the geometry of the greenhouse into TRNSYS (type 56). In Figure 1 the designs of passive solar conventional (Figure 1a) and the optimized greenhouse model are observed (Figure 1b).

2.2. Types of Wall

Different wall types were employed in modeling passive solar conventional greenhouses which are shown in Table 1. Physical characteristics of the walls were defined in TRNSYS software. These walls have been used in different regions of the world and many researchers have studied them [20,24,25,26].
In the optimized model, all of the used bars are woody because of its thermal insulation property. The greenhouse structure was well insulated by soil walls and a floor 6.00 × 17.40 m2 and glazing on the south wall climate. The north wall was created by the excavated soil of floor while in the conventional passive solar greenhouse was built by light weight concrete block, heavy weight concrete, wood, and common brick. The north wall size contained three parts of 5.11, 18.00, 46.86, and 19.00 m2 (sum 88.97 m2), of which, 18 m2 of them was placed below the ground surface. The bottom part of the south, west, and east wall were sloping and constructed below the ground surface.
The overall roof area of each three sides (south, east, and west) was 168.48 m2. In addition, the area under cultivation was 168.55 m2 that consisted of ground floor and the bottom part of the south, west, and east. The highest indoor point of the greenhouse was 3.20 m at the center of greenhouse floor. Thermal conductivity coefficient and thermal resistance of employed polyethylene were 0.4796 W/m∙K and 0.41 m2∙K/W, respectively. The door and ventilation flaps have been installed on the front corners of the greenhouse in east and west side (Figure 2a,b).

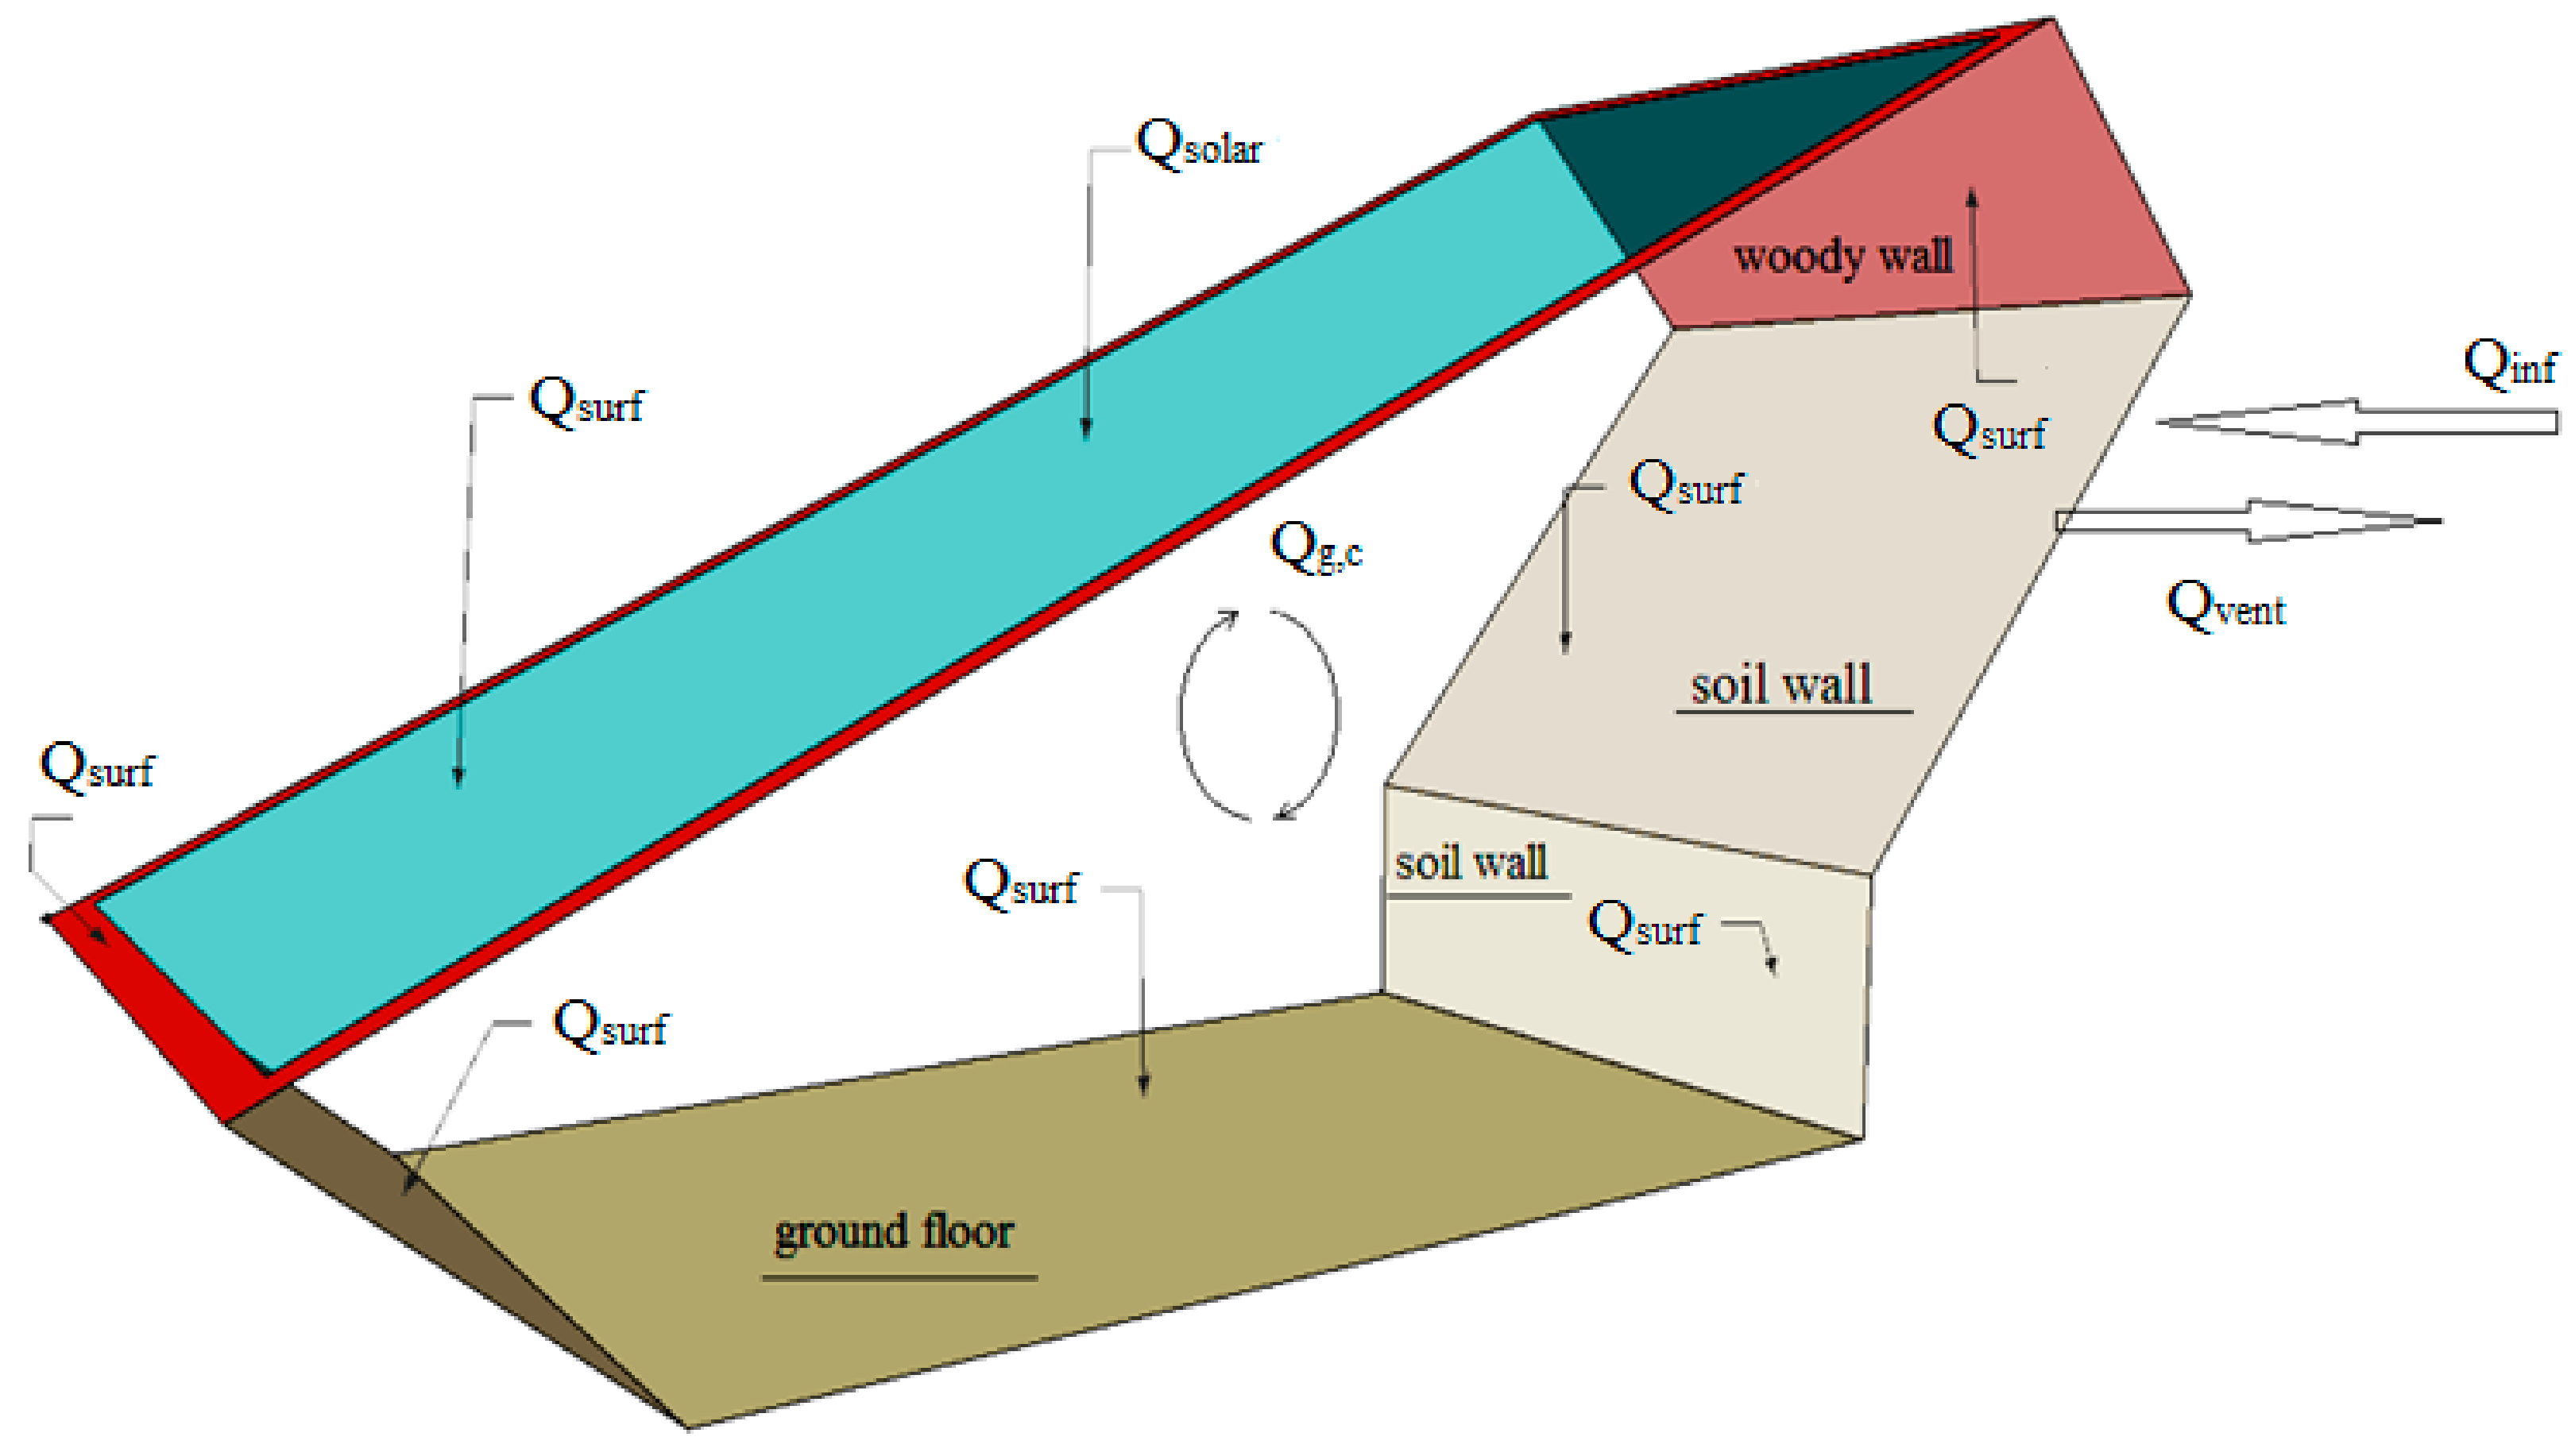
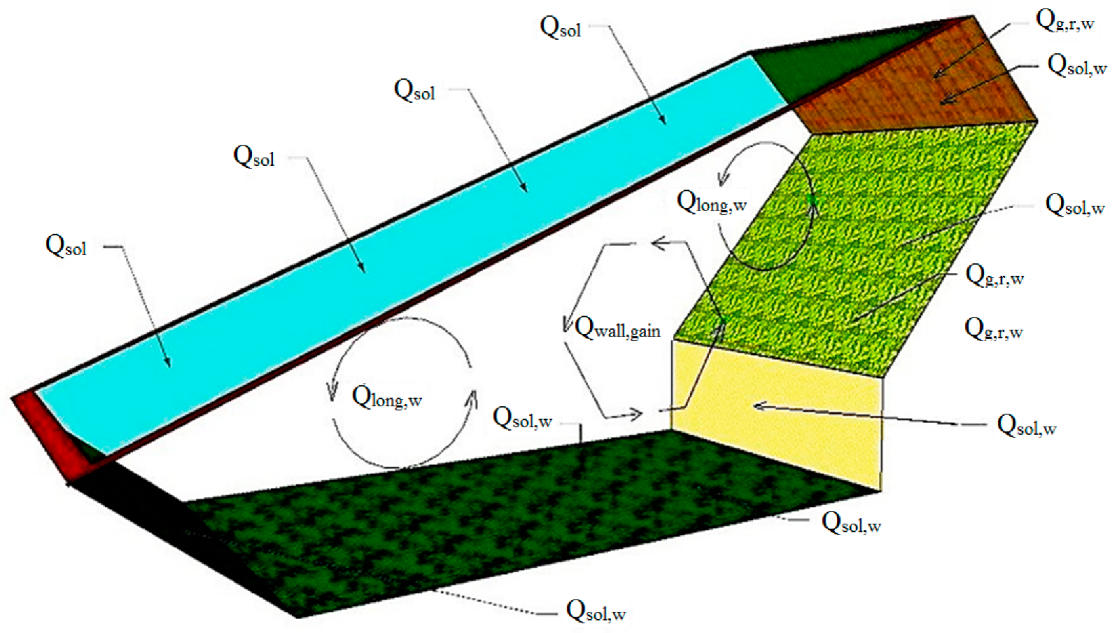
2.3. Math Calculation

Energy and mass balance equations were employed in TRNSYS for calculating the temperature and humidity in the proposed zones. All types of the energies used are elaborated in Figure 3. For this goal, the sensible energy balance for an arbitrary thermal zone i is defined by following equation [16]:
Q ˙ i   =   Q ˙ surf , i   +   Q ˙ inf , i   +   Q ˙ vent , i   +   Q ˙ gc , i   +   Q ˙ cplg , i
where Q ˙ i is the net heat gain, Q ˙ surf,i is the total heat loss from the surface (including walls, roofs, and floor), Q ˙ inf,i is the infiltration gains (air flow from outside only), Q ˙ vent,i is the ventilation heat gain from the user defined source, Q ˙ gc,i is the internal convective heat gain by crops, people, and other equipment, and Q ˙ cplg,i is the convective heat gain [16].
Q ˙ inf , i   =   V ˙ · 𝜌 · C P   ( T outside , i     T air )
Q ˙ vent , i   =   V ˙ · 𝜌 · C P   ( T ventilation , i     T air )
Q ˙ cplg , i   =   V ˙ · 𝜌 · C P   ( T Zone , i     T air )
where Cp is the fluid specific heat (kJ/kg∙K), V ˙ is the rate of attic infiltration of outside air (m3/h), ρ is the density of outside air (kg/m3), TZone is the zone temperature (°C), and Tventilation is the temperature of ventilation air (°C).
Radiative heat flow to the wall and cover calculated from Equation (5):
Q ˙ r , w   =   Q ˙ g , r , w   +   Q ˙ sol , w   +   Q ˙ long , w   +   Q ˙ wall - gain
where Q ˙ r,w is the radiative gains for the wall surface temperature node, Q ˙ g,r,w is the radiative air node internal gains received by wall, Q ˙ sol,w is the solar gains through zone windows received by walls, Q ˙ long,w is the longwave radiation exchange between this wall and all other walls and windows (εi = 1), and Q ˙ wall-gain is the user-specified heat flow to the wall or window surface. All of these quantities are given in kJ/h [16]. Figure 4 presents the all taypes of the heat flow.
The energy balance of the greenhouse was calculated using the sum of heat source and heat sinks in the greenhouse due to various heat transfer phenomena (TRNSYS 17 Multizone Building modeling) [16].
Heat Storage = Heat gains (Heat source) + Heat losses (Heat sinks)
In the optimized model, the walls were composed of soil to reduce amount of heat loss (Figure 1b). To energy storage, the south side of the greenhouse was only covered by polyethylene film due to more energy storage. During the winter nights the soil surface temperature is higher than the indoor air temperature [26] which is due to the heat storage of the absorbed solar radiation by soil during the day [27]. In fact, the absorbed solar radiation by the soil surface in the greenhouse led to heating the air in the greenhouse and was transferred to the deeper soil on winter days [28].

2.4. Model of Energy Demand, Temperature, and Radiation Calculation
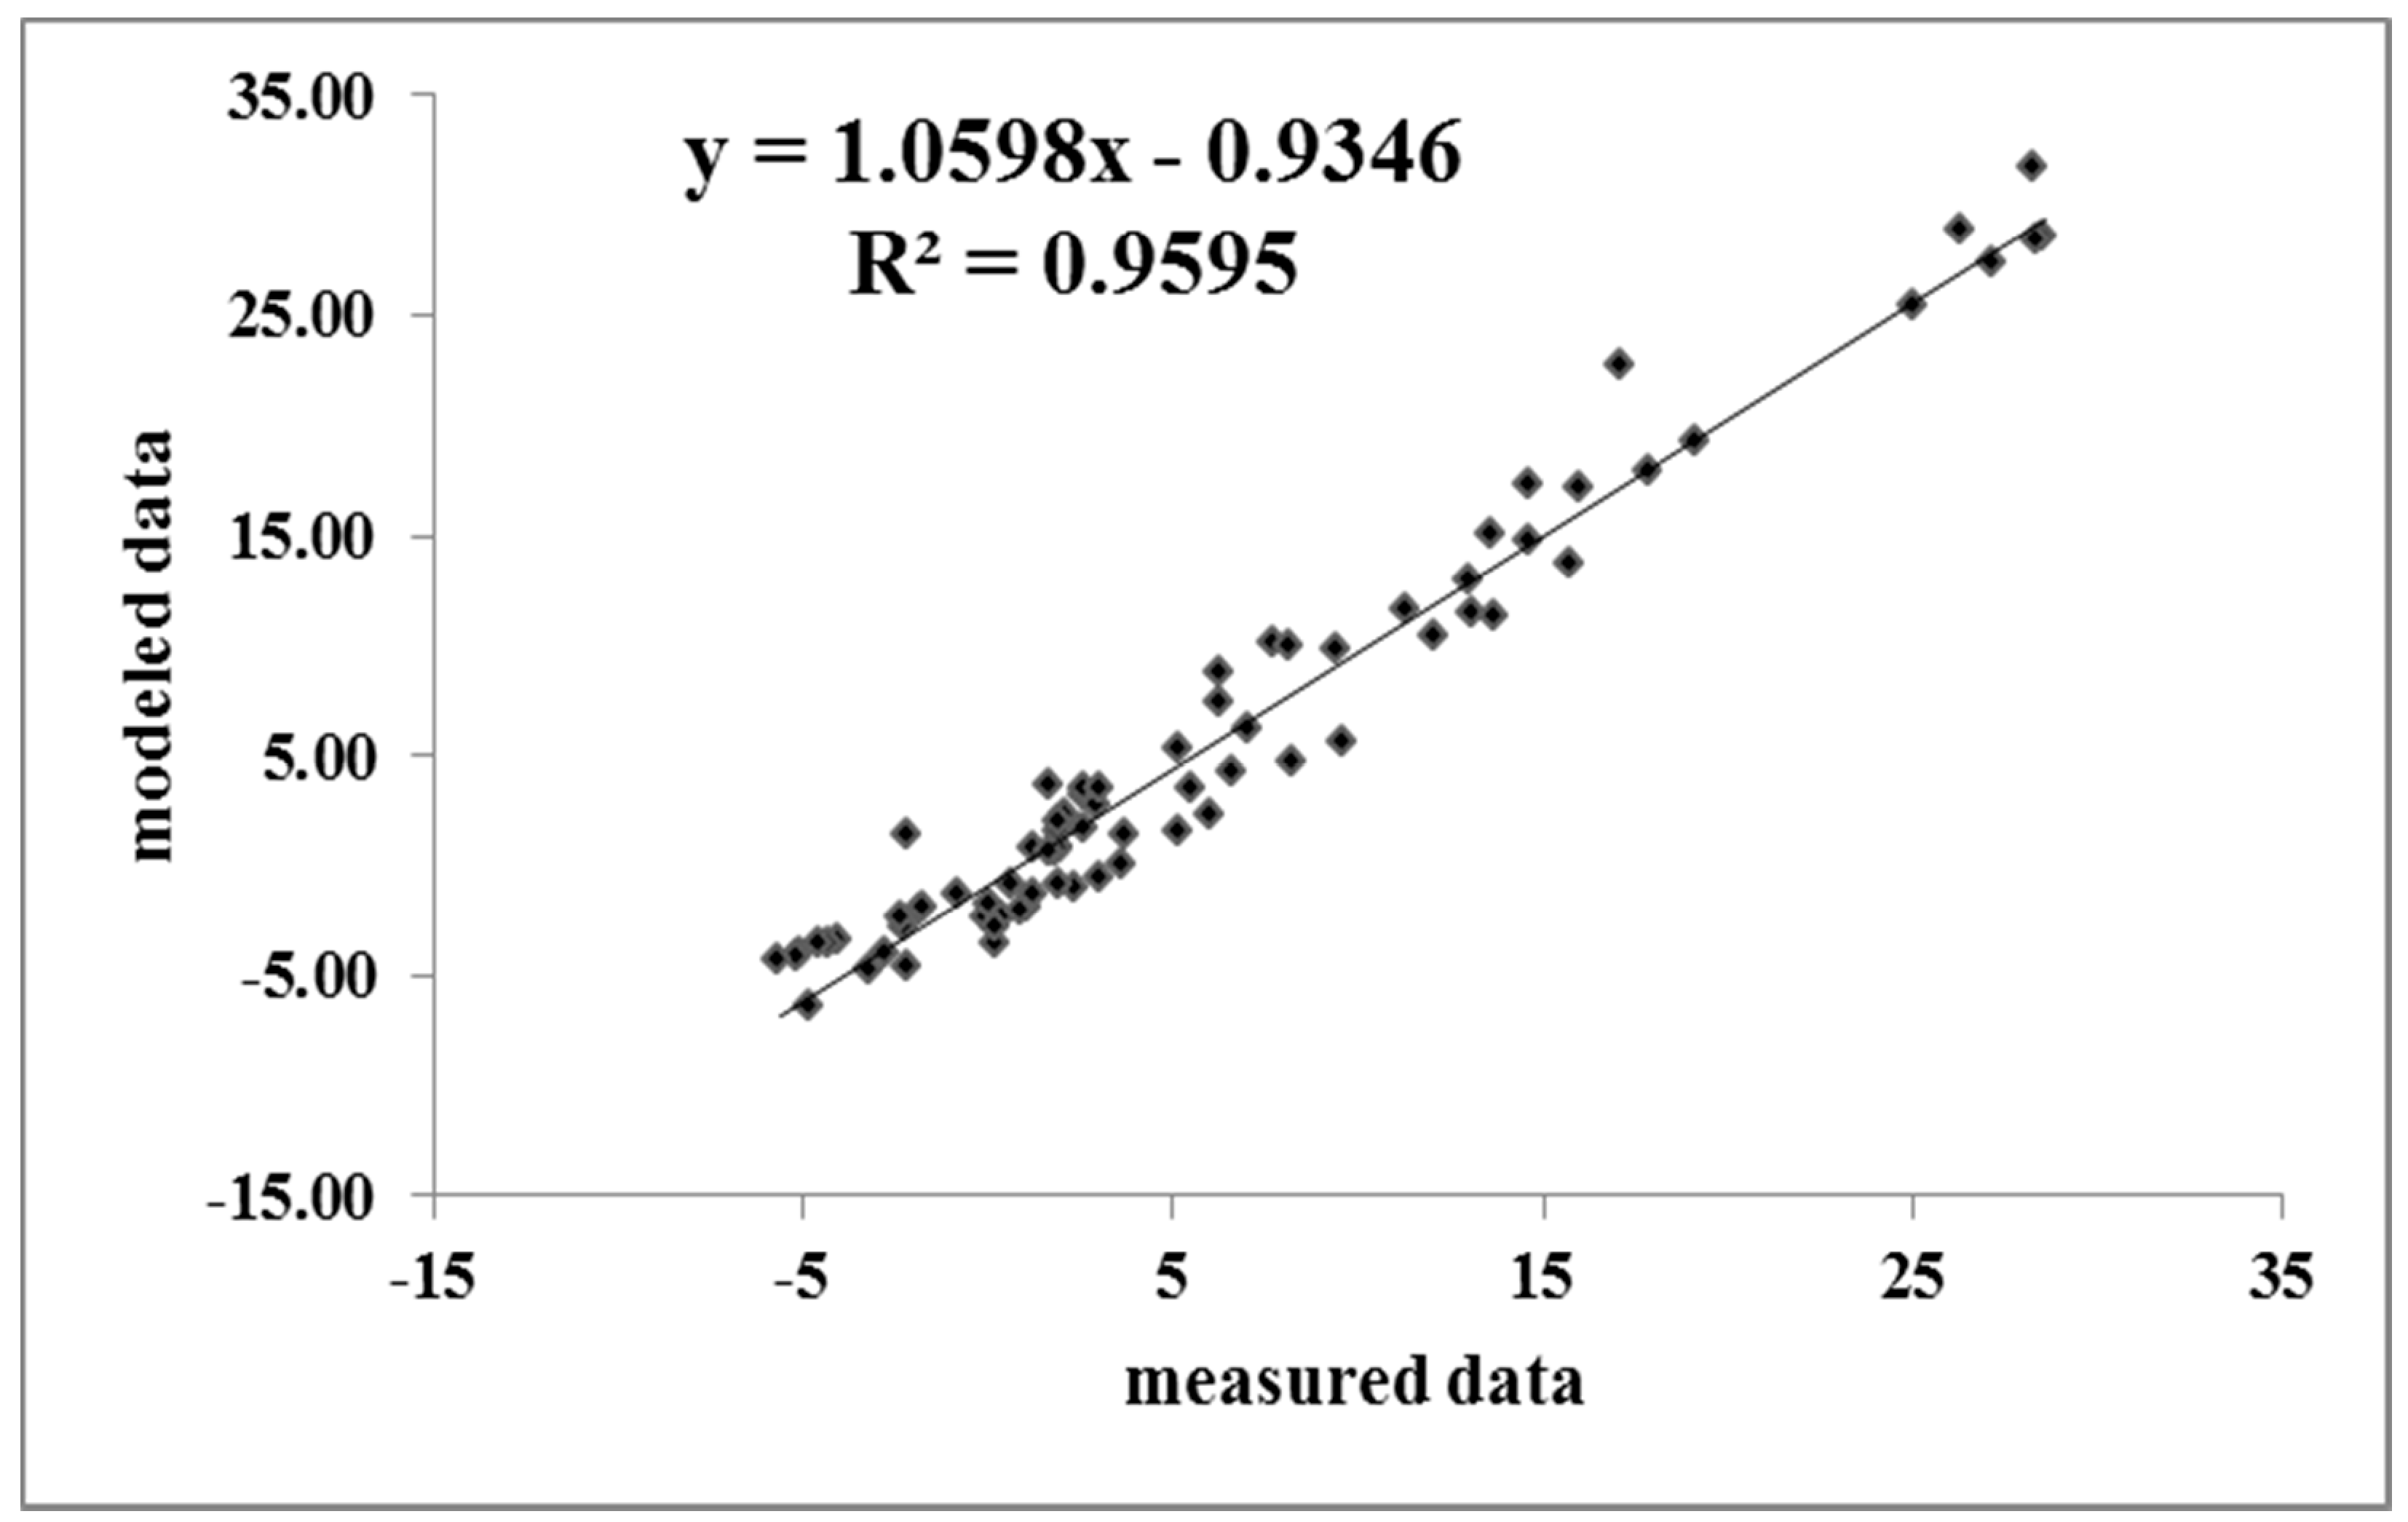
The process of present modeling detailed in the following flowchart (Figure 5). All of the components of the model were connected in TRNSYS simulation studio. The software window 7 (Berkeley lab, Berkeley, CA, USA) was used to calculate transmittance properties of the cover (TRNSYS 17 manual). To simulate the thermal behavior, TYPE56 requires several building data like geometrical data, wall construction data, and some other data which influence analyzing the greenhouse building, such as radiation, ambient temperature, humidity, and building schedules. At first, the data collected and then defined for the TRNSYS simulation. Figure 5 shows a schematic flow diagram of present thermal building simulation with TRNSYS.

2.5. Validation

Assessment and validation of simulated model was done by constructing a solar greenhouse particular to the cold climate condition (Figure 6a). All used bars were woody because of its thermal insulation property. The greenhouse structure was well insulated by soil walls and glazing on the south wall climate (Figure 6b). The north wall was constructed by excavated soil of the floor while in the conventional passive solar greenhouses are commonly built by light weight concrete block, heavy weight concrete, wood, and common brick (Figure 6b). The bottom part of the south, west, and east wall were inclined and constructed below the ground surface. In addition, the area under cultivation was 168.55 m2 that consisted of the ground floor and the bottom part of the south, west, and east. The highest indoor point of the greenhouse was 3.20 m at the center of greenhouse floor (Figure 6b). Thermal conductivity coefficient and thermal resistance of employed polyethylene were 0.4796 W m−1 K−1 and 0.41 m2 K W−1, respectively. The door and ventilation flaps installed on the front corners of the greenhouse in east and west side (Figure 6a,b) [29].
Analysis of regression is shown in Figure 7. Results showed a significant linear regression between the values of the measured and simulated models. The coefficient of determination (R2) indicated 95.95% between values obtained from the measured and modeled data.

3. Results and Discussion

To better understand the optimization in the present greenhouse model, the comparison was made between the data obtained from the greenhouse interior temperature, amount of radiation emitted from the walls and floor, and the amount of demand energy in the TRNSYS compared between optimized models and conventional passive solar greenhouses with different north walls.
The total incident solar radiation in a conventional passive solar greenhouse and optimized model on 11–14 January (2019) is presented in Figure 8. According to this finding, the maximum radiation was recorded for the east and south walls in the optimized model. In addition, the results showed that the radiation was measured from 8:30 to 17:00 in 11 January. It observed an increase in radiation at 10 h and reached its maximum at 12:30 at the east wall. In addition, the maximum radiation at the south wall measured at 15:30 in the optimized model, while this parameter occurred at 13:30 in the conventional model. This difference is due to the floor in the optimized model being 1 m more underground compared to that of the conventional model (Figure 1a,b).
Figure 9 presents the average indoor air temperatures in the optimized and conventional greenhouse models. These data were recorded for the four nights. The results of average air temperature in the optimized model were from −4 to 33.1 °C with a mean of 6.1 °C for the four days of cloud, snow, and sun. In addition, findings showed that the average air temperature in the conventional passive solar greenhouse changed from −8.4 to 24.7 °C with a mean value of 3 °C.
When soil started to release heat from 20:00 to 8:00, the measured average outdoor air temperature was varied from −4.3 to −13.7 °C. The findings revealed that the average indoor–outdoor temperature difference during the four days were from 5.8 to 41.4 °C and 3.9 to 28.9 °C for the optimized model and the conventional passive solar greenhouse, respectively.
Figure 10 showed the amount of required heat to keep the indoor temperature of the greenhouse during the night and days between 16 to 25 °C in both of models on 11–14 January (2019). Findings assessment showed that the amount of heat demand during the hours of 12 to 16 in the optimized model was zero while in the conventional greenhouse (wall of e120) it varied from 100 to 10,000 kJ on 11 January which could be well related to the characteristics of the design optimization model.
Obtained results showed that the maximum heating demand was recorded between 5:00 and 7:00 and the minimum value recorded from 11 to 16. However, analyzing data revealed that the energy demand was zero when the radiation on the surface of the south side was higher than 2500 kJ/hr∙m2 which was accrued when the indoor temperature was more than 16 °C. In research conducted by Beshada et al. (2006), who used a thermal blanket to cover the greenhouse at night, the results obtained showed that in the coldest day in February, the lowest recorded nighttime temperature in the inside greenhouse was −4.9 °C while the outdoor greenhouse temperature was −29.2 °C. In another study, Wei et al. (2017) who used a solar water heating method using solar energy in a water storage tank for heating the greenhouse during the night [26]. In this system, the air temperature greenhouse increased 3.7 °C at night. The inside–outside temperature difference ranged from 14.3 to 21 °C [25,26]. In the study of Bin et al., they could maintain the indoor temperature above 8.2 °C by removable back walls when the minimum temperature in the polyethylene greenhouse was 2.9 °C [30]. The maximum difference of indoor and outdoor in single span greenhouses was 9 °C whereas the systems of a half-removable and fully-removable back wall was 6.8 and 6.1 °C, respectively. Recently, Jieyu et al., in 2017, built a greenhouse including a north wall which could store heat energy during the day. They employed this saved energy using fans for heating the greenhouse during the nights. However, the air temperature in the greenhouse ranged from 1.18 to 12.56 °C while whiteout storage heat ranged from −3.9 to 12.56 °C [30,31]. In the present study, indoor and outdoor temperatures of the greenhouse were below zero for 168 and 982 h, respectively. In regards to investigating the heating of a greenhouse in a cold climate, Candy et al. investigated a solar greenhouse and their findings showed that the lowest temperature was around 2 to 3 °C which happened at 7:00 a.m. [24]. More specifically, the average air temperature of the indoor greenhouse was 3.5 °C between sunset and sunrise, which indicated the fact that their greenhouse could lead to a 1.2 °C higher air temperature than the average outdoor. During daytime, the average air temperature inside the greenhouse was 14.3 °C while the average outdoor was 7.4 °C [24]. In another research, Zhang et al., 2015 investigated greenhouse heating in a cold climate and their results showed that the maximum temperature was monitored in the floor greenhouse on a cloudy day and maximum temperature was recorded in the greenhouse ceiling on a sunny day. The indoor air temperature varied from −5 to 10 °C while outdoor air temperatures were −4 to 29.2 °C. In addition, they reported that the average indoor–outdoor air temperature difference during nights were 2.4 and −13.1 °C, respectively [20].
Table 2 shows the average variation of total heating requirement in the optimized greenhouse model compared with conventional one. More specifically, the annual total heating requirement in optimized model was 29,975 MJ while the minimum value in the type of passive solar system greenhouse was 42.2 GJ. The heating demand was always lower for the optimized model than the conventional passive solar greenhouse. In addition, results showed zero heating demand for the summer months (June, July, and August) for both models.
The reason for these results was because the optimized model was designed on the basis of getting more radiation than the conventional passive solar greenhouses (Figure 1, Figure 2 and Figure 6). Indeed, the higher average indoor temperature was recorded for the optimized model compared with the conventional passive solar greenhouses (Figure 8). This is because of receiving more light on the east side in the optimized model from 8:30 to 12:30 (Figure 1 and Figure 2). Obtained results showed that the present design was ideal to minimize heating requirement in the optimized model due to the fact that the soil insulated the greenhouse well against heat and cold. This is due to the type of greenhouse structure in which the north wall was made of soil and the lower parts of the north, south, west, and east walls were sloping and also constructed below the ground surface). In a study, Shamim et al. predicted 300 MJ/m2 in January for a monthly heating requirement in passive solar greenhouse [11]. However, the results of the present study showed that the maximum monthly heating requirement is 796 MJ/m2 in the Wtype87 model and the minimum of amount was 190 MJ/m2 for the Wtype45 model in a conventional passive solar greenhouse, while the monthly heating requirement was estimated at 126 MJ/m2 for the optimized greenhouse model. In other research, the conventional greenhouse model was evaluated at 325 MJ/m2 by TRNSYS. This result was higher than what was reported by Rashed et al. (2018) who obtained heat demand by 700 GJ∙M−2. year−1 in a conventional greenhouse (184 m2) using TRNSYS (128 GJ for greenhouse per year) [32].
Regarding the lower heating energy demands obtained through the application of TRNSYS in optimized model related to increased insulation properties of walls. Employing walls characterized by a lower transmittance allows a more thermally isolated greenhouse walls in optimized model.

4. Conclusions

This paper focused on comparison of greenhouse shape and position design parameter in two models (the conventional passive solar greenhouse and the optimized model of a passive solar greenhouse). In addition, the key parameter of the north wall material investigated in 12 models of a conventional passive solar greenhouse and an optimized model. The 3-D model of them was designed in Google-sketchUP and then summarized and analyzed by TRNSYS software. The temperature, irradiation, and heat demand data compared in the optimization model and other types of available walls in conventional passive solar greenhouses.
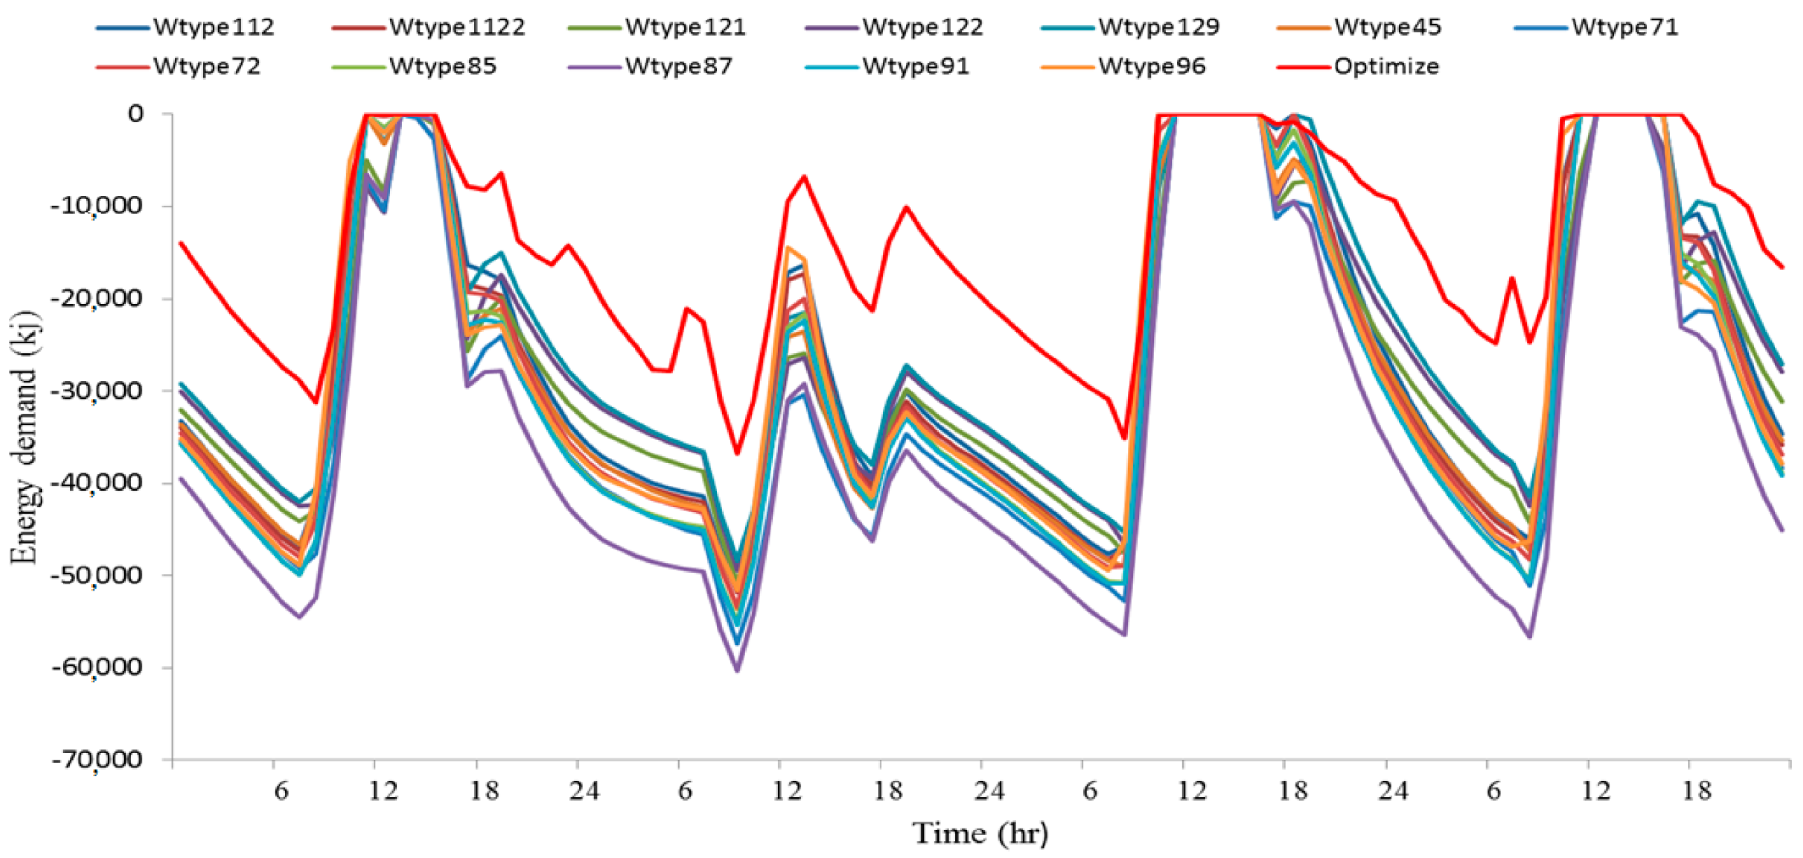
  • In conventional passive solar greenhouses, the greenhouse heating demand is seen as minimum in walls of Wtype45 (50-mm insulation with 200-mm clay tile) and maximum in Wtype87 (100-mm lightweight concrete block).
  • In the optimized model, the north wall and parts of the south, east, and west walls were constructed with soil that decreased heat demand in comparison with Wtype45 (50-mm insulation with 200-mm clay tile).
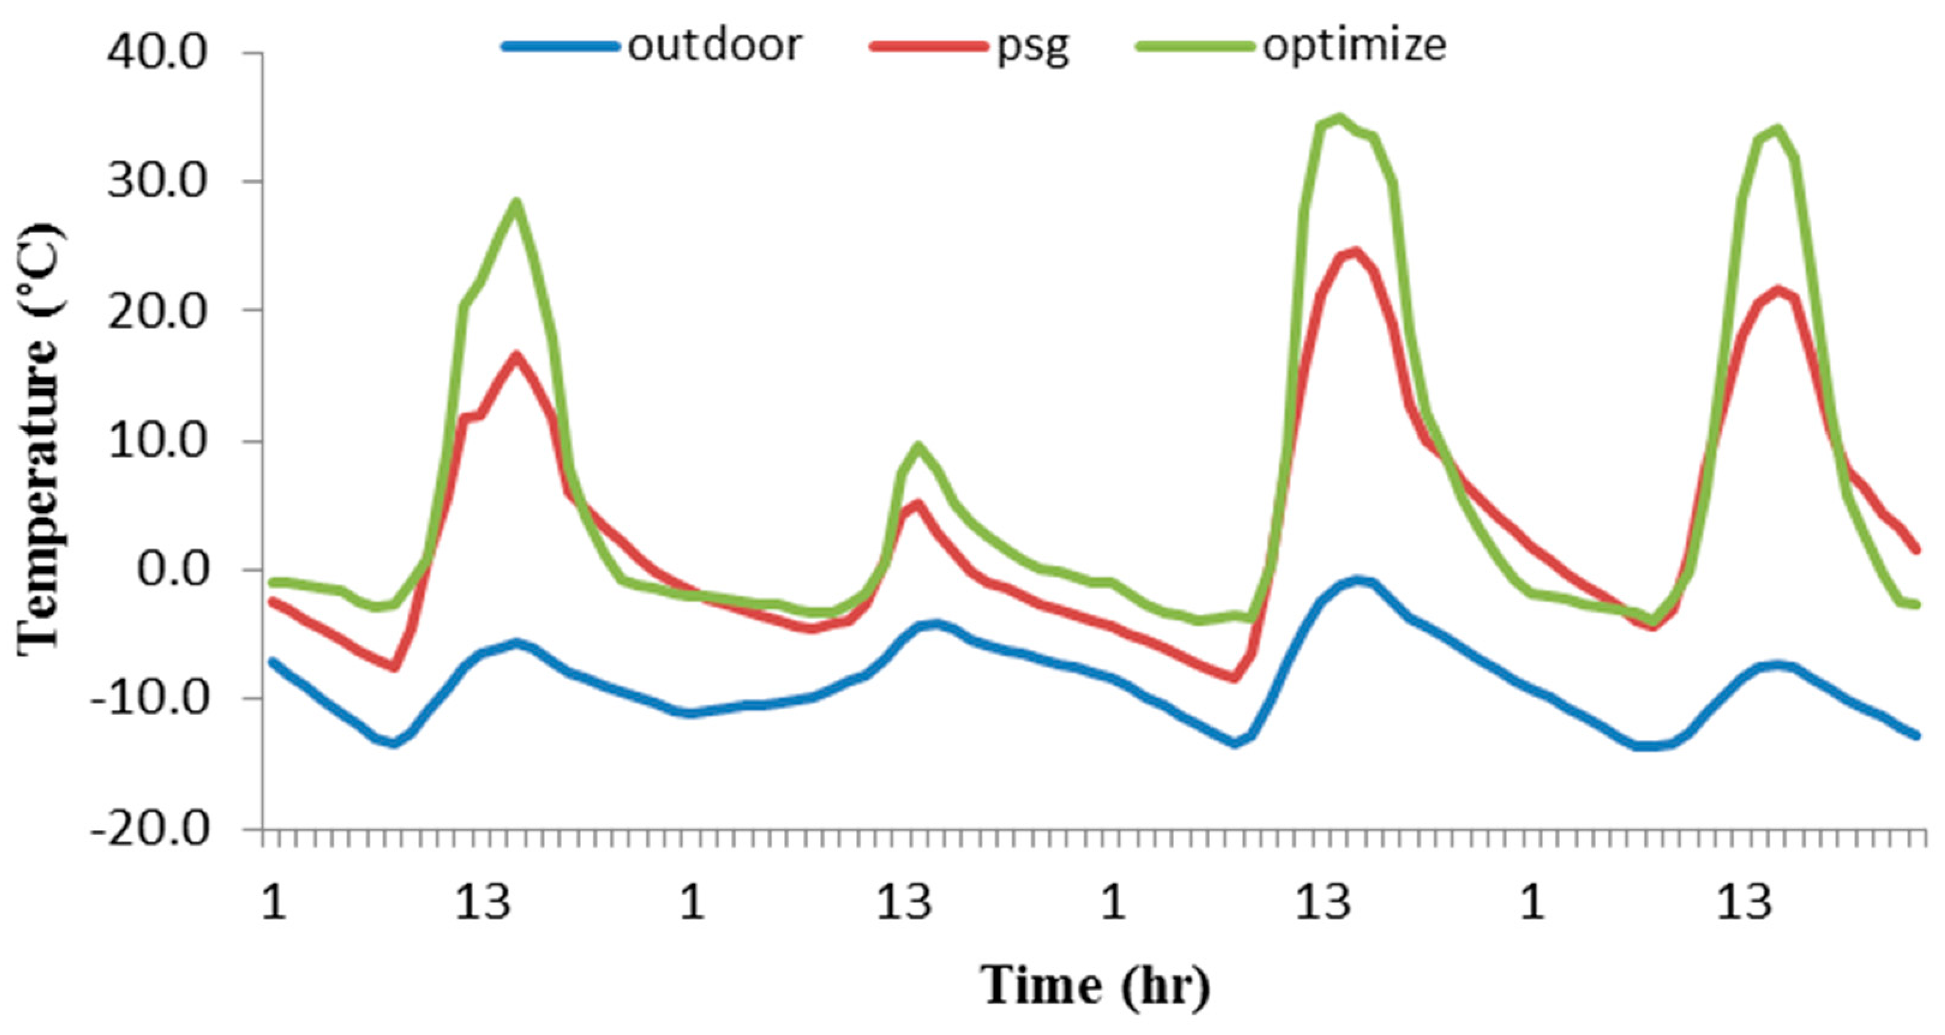
  • In the optimized model, irradiation in the east and south walls was more than conventional passive solar greenhouses. In addition, Indoor air temperature in the optimized model was more than the conventional models on sunny days in the winter.
  • One of the biggest sources of global warming comes from huge energy consumption in agriculture field. This provides a challenge for researchers around the world to find new ways for energy consumption reduction.
  • A current study revealed that the present optimized greenhouse model has lower energy consumption compared to the other types of greenhouses.

Author Contributions

Conceptualization, methodology, software, S.M.; writing—review and editing, E.K.; software, M.K.; formal analysis, S.M. and M.K.; investigation, S.M.; resources, A.H.A.S. and A.M.N.; data curation, M.S. and J.D.; visualization, S.M. and E.K. All authors have read and agreed to the published version of the manuscript.

Funding

This research received no external funding.

Institutional Review Board Statement

Not applicable.

Informed Consent Statement

Not applicable.

Data Availability Statement

Data sharing is not applicable to this article.

Conflicts of Interest

The authors declare that they have no known competing financial interests or personal relationships that could have appeared to influence the work reported in this paper.

Nomenclature

TRNSYSTRaNsient System Simulation
3-Dthree dimensions
Wtype112150 mm insulation with 50 mm wood
Wtype12185 mm insulation with 200 mm common brick
Wtype122200 mm common brick with 50 mm insulation
Wtype129Face brick and 200 clay tile with 50 mm insulation
Wtype4550 mm insulation with 200 mm clay tile
Wtype71200 mm clay tile with air space
Wtype72200 mm clay
Wtype85100 mm lightweight concrete block and 25 mm insulation
Wtype87100 mm lightweight concrete block
Wtype91100 mm clay tile and 25 mm insulation
Wtype96Sheet metal with 75 mm insulation
Q ˙ inet heat gain
Q ˙ surf,itotal heat loss from the surface
Q ˙ inf,iinfiltration gains
Q ˙ vent,iventilation heat gain
Q ˙ gc,iinternal convective heat gain
Q ˙ cplg,iconvective heat gain
V ˙ rate of attic infiltration
ρ density
Cpfluid specific heat
Toutside,iOutside temperature
TairAir temperature
Tventilation,itemperature of ventilation
TZone,izone temperature
Q ˙ r,wradiative gains for the wall surface temperature node
Q ˙ g,r,wradiative air node internal gains received by wall
Q ˙ sol,wsolar gains through zone windows received by walls
Q ˙ long,wlongwave radiation exchange between the wall and all other walls and windows
Q ˙ wall-gainuser-specified heat flow to the wall or window surface
R2coefficient of determination

References

  1. Grange, R.; Hurd, R. Thermal screens—Environmental and plant studies. Sci. Hortic. 1983, 19, 201–211. [Google Scholar] [CrossRef]
  2. De Koning, A. Long-term temperature integration of tomato. Growth and development under alternating temperature regimes. Sci. Hortic. 1990, 45, 117–127. [Google Scholar] [CrossRef]
  3. Asdrubali, F.; Cotana, F.; Messineo, A. On the evaluation of solar greenhouse efficiency in building simulation during the heating period. Energies 2012, 5, 1864–1880. [Google Scholar] [CrossRef] [Green Version]
  4. Chung, M.; Park, J.-U.; Yoon, H.-K. Simulation of a central solar heating system with seasonal storage in Korea. Sol. Energy 1998, 64, 163–178. [Google Scholar] [CrossRef]
  5. Opdam, J.; Schoonderbeek, G.; Heller, E.; De Gelder, A. Closed greenhouse: A starting point for sustainable entrepreneurship in horticulture. In Proceedings of the International Conference on Sustainable Greenhouse Systems-Greensys 2004, Leuven, Belgium, 31 October 2005; pp. 517–524. [Google Scholar]
  6. Sturm, B.; Maier, M.; Royapoor, M.; Joyce, S. Dependency of production planning on availability of thermal energy in commercial greenhouses–A case study in Germany. Appl. Therm. Eng. 2014, 71, 239–247. [Google Scholar] [CrossRef]
  7. Kaukoranta, T.; Näkkilä, J.; Särkkä, L.; Jokinen, K. Effects of lighting, semi-closed greenhouse and split-root fertigation on energy use and CO2 emissions in high latitude cucumber growing. Agric. Food Sci. 2014, 23, 220–235. [Google Scholar] [CrossRef]
  8. Wong, B.; McClung, L.; Snijders, A.; McClenahan, D.; Thornton, J. The application of aquifer thermal energy storage in the Canadian greenhouse industry. In Proceedings of the International Symposium on High Technology for Greenhouse Systems: GreenSys2009, Quebec, QC, Canada, 14–19 June 2009; pp. 437–444. [Google Scholar]
  9. Yıldız, İ.; Yue, J.; Yıldız, A.C. Air Source Heat Pump Performance in Open, Semi-closed, and Closed Greenhouse Systems in the Canadian Maritimes. In Progress in Clean Energy; Springer: Berlin/Heidelberg, Germany, 2015; Volume 1, pp. 183–191. [Google Scholar]
  10. Vadiee, A.; Martin, V. Thermal energy storage strategies for effective closed greenhouse design. Appl. Energy 2013, 109, 337–343. [Google Scholar] [CrossRef]
  11. Ahamed, M.S.; Guo, H.; Taylor, L.; Tanino, K. Heating demand and economic feasibility analysis for year-round vegetable production in Canadian Prairies greenhouses. Inf. Process. Agric. 2019, 6, 81–90. [Google Scholar] [CrossRef]
  12. Ahamed, M.S. Thermal Environment Modeling and Optimization of Greenhouse in Cold Regions. Ph.D. Thesis, University of Saskatchewan, Saskatoon, SK, Canada, 2018. [Google Scholar]
  13. Santamouris, M.; Argiriou, A.; Vallindras, M. Design and operation of a low energy consumption passive solar agricultural greenhouse. Sol. Energy 1994, 52, 371–378. [Google Scholar] [CrossRef]
  14. Gupta, R.; Tiwari, G. Thermal modellina of a greenhouse having a north wall using periodic analysis and its experimental validation. Int. J. Ambient. Energy 2005, 26, 115–128. [Google Scholar] [CrossRef]
  15. Mobtaker, H.G.; Ajabshirchi, Y.; Ranjbar, S.F.; Matloobi, M. Solar energy conservation in greenhouse: Thermal analysis and experimental validation. Renew. Energy 2016, 96, 509–519. [Google Scholar] [CrossRef]
  16. TRNSYS. Multizone Building Modeling with Type56 and TRNBuild; Solar Energy Laboratory, University of Wisconsin: Madison, WI, USA, 2017. [Google Scholar]
  17. Carlini, M.; Honorati, T.; Castellucci, S. Photovoltaic greenhouses: Comparison of optical and thermal behaviour for energy savings. Math. Probl. Eng. 2012, 2012, 1–10. [Google Scholar] [CrossRef]
  18. Marucci, A.; Carlini, M.; Castellucci, S.; Cappuccini, A. Energy efficiency of a greenhouse for the conservation of forestry biodiversity. Math. Probl. Eng. 2013, 2013, 1–7. [Google Scholar] [CrossRef]
  19. Vadiee, A.; Martin, V. Energy management in horticultural applications through the closed greenhouse concept, state of the art. Renew. Sustain. Energy Rev. 2012, 16, 5087–5100. [Google Scholar] [CrossRef]
  20. Zhang, L.; Xu, P.; Mao, J.; Tang, X.; Li, Z.; Shi, J. A low cost seasonal solar soil heat storage system for greenhouse heating: Design and pilot study. Appl. Energy 2015, 156, 213–222. [Google Scholar] [CrossRef]
  21. Patil, R.; Atre, U.; Nicklas, M.; Bailey, G.; Power, G. An Integrated Sustainable Food Production and Renewable Energy System with Solar & Biomass CHP; American Solar Energy Society: Austin, TX, USA, 2013. [Google Scholar]
  22. Mashonjowa, E.; Ronsse, F.; Milford, J.R.; Pieters, J. Modelling the thermal performance of a naturally ventilated greenhouse in Zimbabwe using a dynamic greenhouse climate model. Sol. Energy 2013, 91, 381–393. [Google Scholar] [CrossRef]
  23. Chargui, R.; Sammouda, H.; Farhat, A. Geothermal heat pump in heating mode: Modeling and simulation on TRNSYS. Int. J. Refrig. 2012, 35, 1824–1832. [Google Scholar] [CrossRef]
  24. Candy, S.; Moore, G.; Freere, P. Design and modeling of a greenhouse for a remote region in Nepal. Procedia Eng. 2012, 49, 152–160. [Google Scholar] [CrossRef] [Green Version]
  25. Beshada, E.; Zhang, Q.; Boris, R. Winter performance of a solar energy greenhouse in southern Manitoba. Can. Biosyst. Eng. 2006, 48, 1–8. [Google Scholar]
  26. Lu, W.; Zhang, Y.; Fang, H.; Ke, X.; Yang, Q. Modelling and experimental verification of the thermal performance of an active solar heat storage-release system in a Chinese solar greenhouse. Biosyst. Eng. 2017, 160, 12–24. [Google Scholar] [CrossRef]
  27. Joudi, K.A.; Farhan, A.A. A dynamic model and an experimental study for the internal air and soil temperatures in an innovative greenhouse. Energy Convers. Manag. 2015, 91, 76–82. [Google Scholar] [CrossRef]
  28. Chen, W.; Liu, W. Numerical simulation of the airflow and temperature distribution in a lean-to greenhouse. Renew. Energy 2006, 31, 517–535. [Google Scholar] [CrossRef]
  29. Sayyah, A.H.A.; Mohammadi, S.; Nikbakht, A.M.; Khalife, E. Modeling and Design a Special Type of Passive Solar Greenhouse in Cold Climate by TRNSYS. J. Agric. Sci. 2020, 26, 488–498. [Google Scholar]
  30. Wei, B.; Guo, S.; Wang, J.; Li, J.; Wang, J.; Zhang, J.; Qian, C.; Sun, J. Thermal performance of single span greenhouses with removable back walls. Biosyst. Eng. 2016, 141, 48–57. [Google Scholar] [CrossRef]
  31. Li, J.; Li, L.; Wang, H.; Ferentinos, K.P.; Li, M.; Sigrimis, N. Proactive energy management of solar greenhouses with risk assessment to enhance smart specialisation in China. Biosyst. Eng. 2017, 158, 10–22. [Google Scholar] [CrossRef]
  32. Rasheed, A.; Lee, J.W.; Lee, H.W. Development and optimization of a building energy simulation model to study the effect of greenhouse design parameters. Energies 2018, 11, 2001. [Google Scholar] [CrossRef] [Green Version]
Figure 1. Designs of passive solar conventional (a) and optimized greenhouse model (b).
Energies 14 05369 g001
Figure 2. The part of walls that are composed of soil in 3-D (a) and 2-D (b).
Energies 14 05369 g002
Figure 3. Convection heat flux into the air node.
Energies 14 05369 g003
Figure 4. Radiative Heat Flows to the Walls and floor.
Energies 14 05369 g004
Figure 5. Dynamic building simulation Diagram in TRNSYS.
Energies 14 05369 g005
Figure 6. Outside (a) and inside (b) of greenhouse in winter.
Energies 14 05369 g006aEnergies 14 05369 g006b
Figure 7. Relationship between the measured and modeled data of indoor temperature of the greenhouse.
Energies 14 05369 g007
Figure 8. Total incident solar radiation in the conventional passive solar greenhouse and the optimized model.
Energies 14 05369 g008
Figure 9. The average indoor air temperatures in the optimized and PSG models.
Energies 14 05369 g009
Figure 10. The amount of heat demand in the optimized and other types of passive solar greenhouse.
Energies 14 05369 g010
Table 1. Different employed type of walls for modeling greenhouses.
NameTypeProperties
22Wtype112150-mm insulation with 50-mm wood
32Wtype12185-mm insulation with 200-mm common brick
33Wtype122200-mm common brick with 50-mm insulation
40Wtype129Face brick and 200-mm clay tile with 50-mm insulation
91Wtype4550-mm insulation with 200-mm clay tile
120Wtype71200-mm clay tile with air space
121Wtype72200-mm clay
135Wtype85100-mm lightweight concrete block and 25-mm insulation
137Wtype87100-mm lightweight concrete block
142Wtype91100-mm clay tile and 25-mm insulation
147Wtype96Sheet metal with 75-mm insulation
Table 2. Monthly average requirement heating (MJ) in the optimized model and types of conventional passive solar greenhouse.
TimeWtype112Wtype1122Wtype121Wtype122Wtype129Wtype45Wtype71Wtype72Wtype85Wtype87Wtype91Wtype96Optimize
January19,443.419,901.920,013.219,270.918,318.020,841.922,778.420,532.521,321.124,269.821,525.320,314.212,173.9
February11,436.611,812.711,244.110,467.89946.912,297.613,734.712,282.412,927.515,289.413,069.812,219.36039.9
March6814.97072.66081.45492.55344.37211.48216.77370.57888.89677.77973.17488.62975.8
April924.2999.4181.281.4143.2704.9834.61042.11276.61941.41271.81303.698.6
May131.5143.62.60.03.87486.8147.7201.5352.5197.8224.93.4
June0.00.00.00.00.00.00.00.00.00.00.00.00.0
July0.00.00.00.00.00.00.00.00.00.00.00.00.0
August0.00.00.00.00.00.00.00.00.00.00.00.00.0
September0.00.00.00.00.00.00.00.00.00.00.00.00.0
October875.2930.5244.9146.5228.9702.1817.5963.01143.31652.81141.51169.6212.0
November5520.05752.54446.63838.83846.75752.36587.26007.06463.48027.16532.86145.52381.5
December11,169.911,579.110,811.99,943.09,434.412,019.213,517.312,048.712,724.115,218.412,875.212,056.16090.5
Summary56,315.758,192.453,026.049,240.947,266.359,576.466,573.160,393.963,947.776,445.464,588.560,926.629,975.7
Publisher’s Note: MDPI stays neutral with regard to jurisdictional claims in published maps and institutional affiliations.

