Abstract
The article deals with the problem of the effects of using a wooden church on thermal and humidity conditions forming inside. Religious services in the studied site were provided several times a year. The building was not used in the remaining time. The analysis of the effects of the frequency of religious services and the number of people at the services on the formation of temperature and humidity conditions in the wooden church is provided in this paper. The effect of the presence of people in the church on CO2 concentration fluctuations was also studied. Analysis of the results showed that external conditions have the greatest effect on internal microclimate substitutions. The presence of people affects temporary fluctuations in internal parameters. Both the number of people attending the service and the time of year are important. An indoor air temperature amplitude of 9.4 °C was recorded during the winter period. The CO2 level in the church during the service exceeded the limit value of 1000 ppm, reaching 1800 ppm in the extreme case, which could result in decreased comfort for people. The high CO2 concentration may have been caused by a lack of effective ventilation in the building. The obtained simulation results showed a high agreement of the theoretical data with the measurement results (correlation 0.91). The analysis of three simulation variants showed that the people attending the services have a significant share in the gains of thermal energy inside the church. In order to meet the assumptions for variant 1, there are no requirements to start the heating system, assuming a similar schedule of services.
1. Introduction
The formation of optimal internal environment conditions in historical buildings is essential to maintain the valuable objects or paintings inside such buildings in good condition. Artifacts forming collections in such buildings react differently to variations in temperature and relative humidity, which may affect their mechanical, biological and chemical damage [1]. Historical buildings usually require meeting the necessary conditions of the indoor environment. An improper microclimate can result in damage to exhibits and structural damage of partitions [2]. It is particularly important to keep the relative humidity at an appropriate level, as fluctuations are particularly harmful to polychrome wood and oil paintings painted on canvas [3]. The reaction of wooden objects to fluctuations in relative humidity may not be immediately apparent [4]. Wood is a hygroscopic material and its humidity depending on the surrounding conditions. However, the moisture content of wood reaches the so-called equilibrium moisture content when exposed to a given temperature and humidity [5]. The stability of relative humidity can be affected by excessive or insufficient ventilation. Most historic buildings have natural ventilation. Air exchange depends on the tightness of windows and doors, the way of use and leaks in the building structure [6,7].
The microclimate inside is affected by numerous factors, including the applied building materials, insulation, heating and air conditioning systems, as well as the tightness of partitions [8,9]. The wooden church, which was built as a place of worship, has become a museum object over time. Because of this, such a building faces the task of providing adequate conditions not only for the worshipers, but also for the protection of the exhibits located in this building and the architecture of the building itself [10]. Maintaining the internal microclimate in museums is difficult, because the conditions should be suitable for valuable objects while remaining comfortable for visitors [9]. The thermal comfort of people and the preservation of monuments have different microclimate requirements [11]. Furthermore, visitors can affect the formation of the indoor environment [2]. In temperate climates, the thermal balance in religious buildings can be disturbed for short periods of time by heating, artificial lighting or the presence of people [1,9]. The objectives of microclimate studies range from monitoring the indoor microclimate and its effect on buildings to suggesting energy-related retrofits for the building [12,13,14,15,16].
Varas-Muriel M. J. and Fort R. [12] monitored the Our Lady of the Assumption Church at Algete, Spain, for 15-months. The authors studied the microclimate inside the church in which heating was installed. The results were used to determine the impact of any disturbances on the conservation of works of art. Measurements inside the building were made using twenty iButton DS1923-F5 (T/Rh) sensors with recording every 30 min. Additionally, for ad hoc monitoring, a three-dimensional network of 65 iButton sensors was used, which were placed in 11 helium-filled balloons. External parameters were measured with 12-bit HOBO H8 ProSeries ONSET sensor.
Silva et al. [13] monitored the Church of Santa Maria de Belém, which is part of the Jerónimos Monasteryin Portugal. The research is used to monitor the indoor climate related to the degradation of materials. The research object does not have a HVAC system and is naturally ventilated. Measurements were taken at six measurement points inside the facility and one outside, using the 10kPT103J2 thermistor for air temperature measurement and the Sensirion SHT31-DIS for relative humidity measurement. Data were collected in 10-min intervals for 15months.
Studies on the microclimate involve the increasingly popular numerical models which can be used, e.g., for the non-stationary analysis of selected physical parameter variability [8,17].
The analysis involved a wooden, unheated church where services were held several times a year. The paper attempts to answer the questions: How does the frequency of religious services and the number of people at services affect the temperature and humidity conditions in a wooden church? How much energy should be used to ensure the minimum temperature in the church at 0, 8 and 16 degrees Celsius?
2. Materials and Methods
The study was conducted in a 16th century wooden church located in Ptaszkowa (southern Poland). The church was built in the Gothic style, maintaining the single-nave type. It is characterized by a log frame construction of walls, the church was boarded from the outside (Figure 1a). The temple was built on stone foundations. On the western side, a tower was built on a square plan using pole construction. In 1929 the church was enlarged with a transept. A vestry was added to the presbytery from the north, and a vestibule from the south. The presbytery and the vestry have flat ceilings, while an apparent domed vault was erected at the intersection of the transept and the nave. The walls and ceiling of the church are decorated with paintings (Figure 1b). The wooden floor was laid directly on the ground and the saddle roofs were covered with sheet metal. There is natural ventilation in the church. Air exchange takes place through doors, windows and leaky partitions.
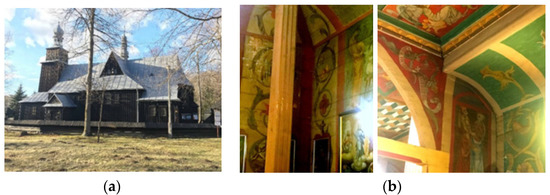
Figure 1.
South elevation of the church (a) and wall paintings (b).
Continuous measurements of temperature and relative humidity of indoor air were conducted in the studied building in the period from 1 May 2018 to 1 May 2019. In this period the indoor and outdoor air temperatures were measured using PT-100 sensors with a resolution of 0.1 °C and a measurement error of ±0.1 °C. A DTH22 sensor with a measuring range of 0–100% and an accuracy of 0.3% was used to measure the relative humidity of indoor and outdoor air. Measurements were taken every 6 min.
Figure 2 shows the location of the measurement points. The recorders were placed at different heights, sensors with index “0” were located at 1.0 m, with index “1” at 1.8 m, with “2” at 2.5 m and with index “3” at 4.5 m.
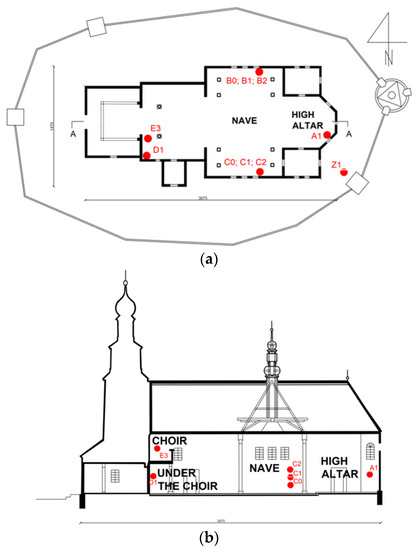
Figure 2.
Location of measurement points:(a) plan of the church,(b) cross-section of the church.
The analysis of momentary CO2 concentration was conducted in the church during the service. The measurement was performed using a Nanosens DP-24 Gas Substance Meter, with a measurement range of 0–5000 ppm, accurate to ±50 ppm. The number of people in the church was monitored during services.
The results obtained will be used to evaluate the effect of the number of people attending the service on the microclimate of the room, including CO2 concentration. The analysis will include the days on which the services were held.
To achieve one of the research objectives, the numerical method of calculating elementary balances (MEB) was used, in which heating cases were simulated for different values of minimum temperatures of internal air. For this purpose, a model of the church geometry was built (Figure 3),taking into account the exact physical parameters of building partitions (Table 1). Technical parameters were adopted on the basis of PN-EN ISO 6946: 20008. The MEB calculation model was validated with the use of measurement data. The calculations were performed with the use of the WUFIplus® ver. 3.2.0.023 software (Fraunhofer Institut fur Bauphysik, Holzkirchen Branch, Germany). The validation results were subjected to statistical correlation analysis, previously checking the normality of the distribution using the Kolomogorov–Smirnov test, and then using the Spearman’s rank test. After completing the validation of the model and the validation calculations, the variant analysis was started, which took into account the following assumptions: variant 1—minimum air temperature inside the church at 0.0 °C, the remaining characteristics as in the existing state; variant 2—minimum air temperature inside the church at 8.0 °C, the remaining characteristics as in the existing state; and variant 3—minimum air temperature inside the church at 16.0 °C, the remaining characteristics as in the existing state. For each of the abovementioned variants, the courses of internal air temperature and heating power, necessary to maintain the assumed conditions, were obtained with a time step of 60 min (as in the measurements). A detailed analysis of the energy needs of the church was made, with particular emphasis on the period of the mass, in which the presence of the faithful was taken into account. The model also included heat gain from people with a value of 100 W/person. This value was the average between the profit from a person without physical activity in a sitting position (95 W/person) and a person in a standing position (106 W/person). The mentioned relationships were adopted based on PN-B-02025:2001 “Calculation of seasonal heat demand for heating residential buildings and collective housing.”
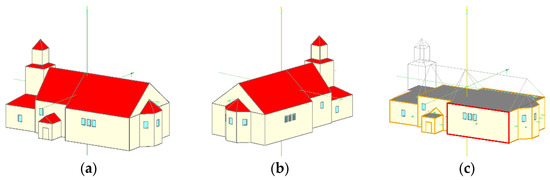
Figure 3.
Geometric model of the church, built inWUFIplus® ver. 3.2.0.023 software (Fraunhofer Institut fur Bauphysik, Holzkirchen Branch, Germany): (a)—south-east orientation; (b)—north-east orientation; (c)—heating zone, beneath attached zone (unheated).

Table 1.
Simulated building materials and technical parameters.
Assumed was also a natural air change 0.3 h−1 and infiltration of 0.2 h−1. The climatic data for a typical meteorological year for Krakow (TRY) available in WUFIplus® were used in the calculation variant analysis. The heating system has been modeled as ideal, providing adequate heating power to maintain the required air temperature inside the church. The obtained model validation results were analyzed for mean arithmetic difference in comparison to the measured data. The mean error was determined based on Formula (2), where: Δθ—mean error; θp—measured temperature; θo—calculated temperature; N—number of measurements.
3. Results
The course of temperature and relative humidity of outdoor air is shown in Figure 4. The annual mean outdoor air temperature was 9 °C and the relative humidity was 80%. Air temperature extremes in the summer half year (April–September) were −5.6 °C in April and 32.6 °C in August. The warmest month was August, with a mean monthly air temperature of 19 °C. The highest monthly mean relative humidity in the summer half of the year occurred in September and amounted to 81.0%. The coldest month of this half year was April, with a mean temperature of 8.5 °C, and the lowest mean monthly relative humidity also occurred in April (70.7%).
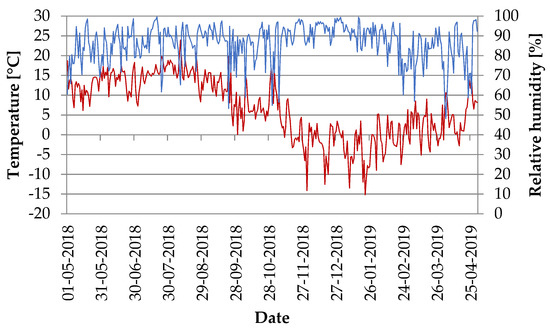
Figure 4.
The course of temperature and relative humidity of the air outside.
In the winter half year, the lowest outdoor air temperature was −17.2 °C in January, while the highest was 25.1 °C in March. The warmest month of the winter half year was October, with a mean monthly air temperature of 9.7 °C, and the coldest one was January (−4.1 °C). The highest monthly mean relative humidity occurred in the month of December (92.7%) and the lowest in March (72.9%).
Figure 5 and Figure 6 show the effect of the number of people attending the service on the temperature development in the church. During the summer half year, and thus the presence of higher outdoor temperatures, there is a greater exchange of outdoor air with indoor air, through open windows and doors before and during the service. However, during the winter, air exchange is minimized to open doors when people enter and leave the church.
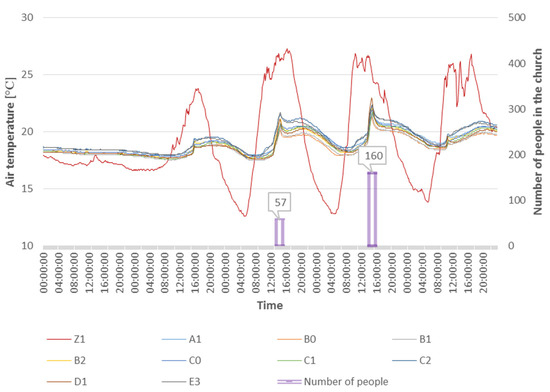
Figure 5.
The course of air temperature and relative humidity inside and outside the building, during the summer period (19 July–23 July 2018).
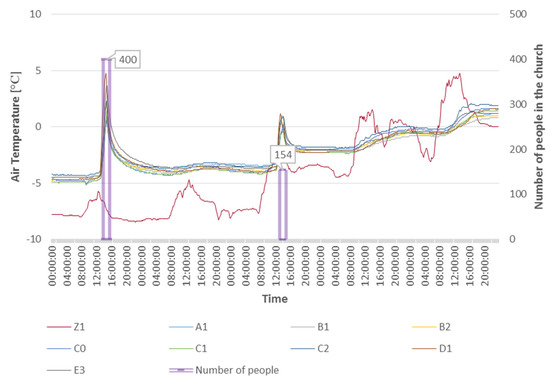
Figure 6.
The course of air temperature and relative humidity inside and outside the building, during the winter period (24 January–28 January 2019).
There was one religious service attended by 57 people on 21 July 2018 and 160 people attended the next service on 22 July 2018. In the days leading up to the services, you can see the dependence of indoor temperature on outdoor conditions. During the service, there is a noticeable increase in the temperature of the air inside the church due to the participation of the worshipers, as well as a greater exchange of indoor and outdoor air through the open doors during the service. The cooling of the site, after services, is affected by the drop in outside air temperature.
On 24 January 2019, 400 people attended the service, resulting in a large increase in temperature due to heat emission from people. After the service, the temperature dropped, but did not return to the −5 °C temperature that prevailed in the church before the service, despite similar external conditions. On 26 January 2019, the temperature in the church increased during the service, but the rise was lower than on 24 January 2019 due to fewer people attending the service. There was a noticeable increase in the outside air temperature, which increased with each passing day and affected the air temperature inside the church.
Religious services cause a temporary increase in indoor air temperature. More frequent services could contribute to higher indoor air temperatures and cyclical fluctuations in temperature and relative humidity in the church.
Instantaneous variations in air temperature and relative humidity inside the temple are shown in Figure 7 and Figure 8. The fluctuation is due to the use of the church, and because of its function (a supporting church), services are held only a few times a year. Two days were chosen for the analysis, two each from the characteristic periods of summer and winter, during which there were 298 and 400 people in the church, respectively. The figures show a 24 h period, beginning 3 h before the service begins.
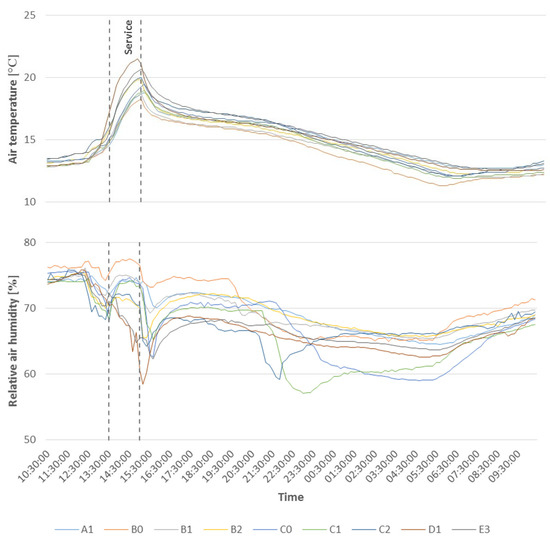
Figure 7.
The course of air temperature and relative humidity inside the building in summer (20 May 2018).
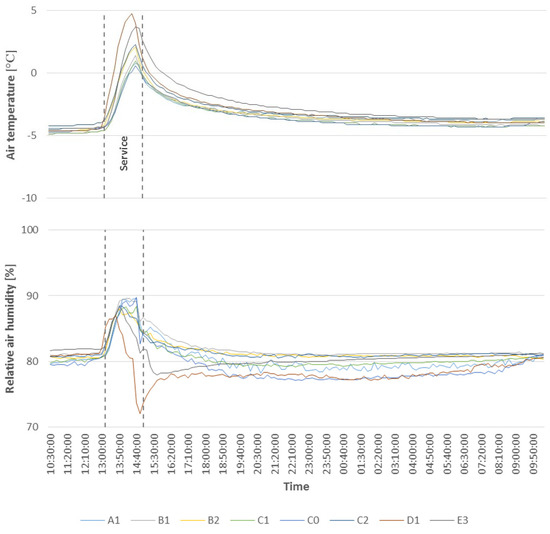
Figure 8.
The course of air temperature and relative humidity inside the building during the winter period (24 January 2019).
On 20 May 2018, one service was held with 298 people in attendance. The daily outside means were 13.4 °C for air temperature and 73.6% for relative humidity. On the other hand, in the church, the mean daily air temperature was 14.8 °C and relative humidity was 71.3%. The highest temperature at the apogee was 21.5 °C (point D1), and recorded an increase of 7.2 °C from the temperature value at this measurement point, at the beginning of the service. The lowest temperature increase during the service was recorded at point B0 and was 4.3 °C. The largest variation in relative humidity was recorded at point D1 and was 14.9%, while the smallest at point A1 where the difference was 3%. Table 2 shows the duration of equilibration of the air temperature in the church, to the temperature that prevailed in the church, before the service began. Time measured from the conclusion of the service.
Table 2.
The effect of worship service on the formation of internal temperature in the church, during summer (298 people, 20 May 2018).
The highest increase in air temperature was under the choir, and this zone also takes the most time to equalize the air temperature to pre-service conditions. The faster temperature drop in the “C” points may be due to the close location of the church entrance doors.
The time required for the air temperature to equilibrate to previous conditions is affected by external conditions. The mean daily outdoor air temperature on 20 May 2018 was 13.4 °C, while the outdoor air temperature difference during the analyzed 24 h is 17 °C.
One service was held on 24 January 2019 with approximately 400 people in attendance. The daily mean on that day was −7.8 °C for air temperature and 92.2% for relative humidity. However, the mean daily air temperature inside the facility was −3.6 °C, and the relative humidity was 80.7%. The biggest differences of analyzed parameters, during the service, were recorded at point D1 and they amounted to 9.4 °C for air temperature and 15% for relative humidity. The lowest fluctuation was recorded at point A1 for air temperature, with 5.2 °C, and at point E3 for relative humidity (7.1%). As can be seen, the indoor air temperature before the service was about −5 °C, and after the service, the higher indoor temperature was maintained for the following days until the next service on 26.01.2019. This was despite similar daily mean outdoor air temperatures on 24 January 2018 (−7.8 °C) and 25 January 2018(−7.1 °C).
When analyzing the results obtained, it is possible to notice the effect of people on the formation of microclimate inside the church. Temporary fluctuations of microclimate parameters are visible during services and are caused by heat emission from people. Greater differences in temperature and relative humidity can be seen during services attended by a larger number of people, regardless of the season. However, in the winter period, the differences of the analyzed parameters, during the service, are higher compared to the summer period. This is affected by the greater cooling of the church, and thus the heat given off from the people is more apparent. The large fluctuations in temperature and relative humidity under the choir may be due to the location of the sensor, with a lower ceiling in this area, and more people gathering during the service. The outdoor conditions play a major role in shaping the microclimate inside the facility during the analyzed services. The presence of people affects temporary fluctuations in internal conditions. A larger number of people results in greater fluctuations in air temperature and relative humidity during the service (Figure 4 and Figure 5). The effect of external conditions can be seen in the time it takes for the facility to cool down after the service. Due to the lower temperatures in May and the larger amplitude of the outside air temperature, the time required for the church to cool down was shorter despite the larger number of people attending the service and the larger variation in the indoor microclimate conditions than in July, as can be seen in Figure 4. Such rapid fluctuations in air temperature and relative humidity can contribute to damage to the exhibits inside the building.
The changes in CO2 levels during the service are shown in Figure 9. The measurement was taken during a service attended by approximately 160 people. The maximum value of CO2 concentration in the air was taken as 1000 ppm. This value has been exceeded, with concentrations reaching as much as over 1800 ppm. Before the service started, the CO2 concentration was 400 ppm, and then CO2 concentration was growing as the number of people and the duration of the service increased. Such a high concentration of carbon dioxide can affect the comfort of people staying in the church. It can cause headache, respiratory problems, and odor-related discomfort [18].
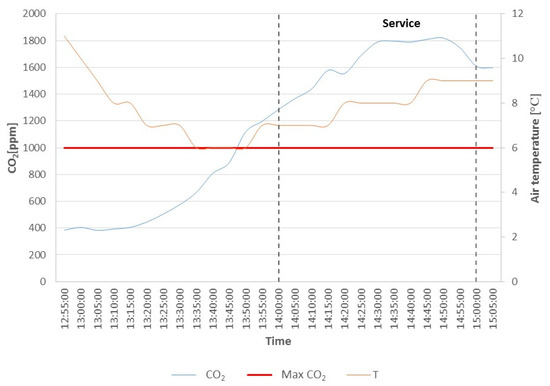
Figure 9.
CO2 concentration during the service in winter time.
In comparison, CO2 levels measured by Varas-Muriel et al. [18] ranged from 400 to 600 ppm in an empty church during August and September. However, when there was a church service, CO2 values increased to 900–950 ppm and occasionally to over 1200 ppm. Figure 10 shows theCO2 concentration in a brick church during the summer (26–28 July).
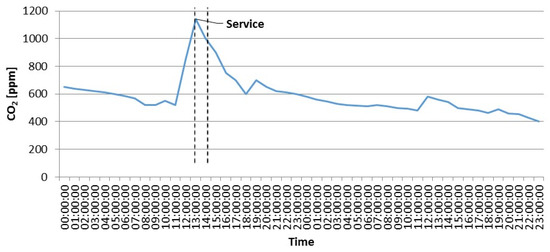
Figure 10.
CO2 concentration in the church during the summer period.
In the graph above, you can see that the maximum CO2 concentration in summer was 1140 ppm. CO2 concentration in summer is more than 600 ppm lower, compared to the concentration measured in winter. Because of that, it can be assumed that the CO2 concentration in the building is lower in summer, which may be related to the higher air exchange in summer, through open doors and windows. However, the concentration remains high during winter, with closed doors and a small volume of the building. The church should be ventilated to ensure the comfort of those attending the service. The concentration measurement was performed in winter, when the air exchange takes place only through leaky partitions and open doors when entering and leaving.
After a thorough analysis of the variability of the indoor microclimate from the measurement data, numerical modeling was started, which was aimed at verifying the value of the necessary energy inputs for maintaining the assumed indoor air conditions. Research has shown that the temperature in the building drops below 0.0 °C in winter. This phenomenon definitely adversely affects the preservation of the paintings and exhibits inside the church in a proper condition. The numerical analysis was also aimed at verifying the necessary energy inputs for two additional temperatures of internal air, those that meet the current minimum temperature requirements for this type of facility. In the first stage, the calculation tool was validated (Figure 11).
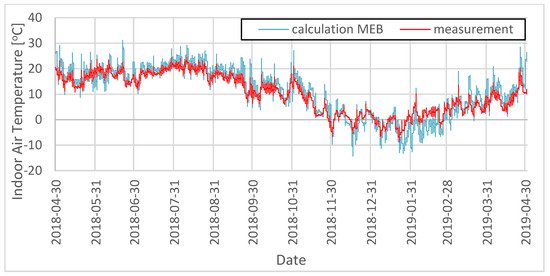
Figure 11.
The internal air temperature in the church is measured and calculated.
Correlation analysis was performed for results obtained from temperature measurement points based on the Spearman’s Rank Test (the data distribution was not normal). The data distribution normality was tested previously using the Shapiro–Wilk Test. The correlation coefficient was 0.91. The mean error was determined based on the Formula (2).
Its value was 1.13 °C per year, which means the accuracy of the simulation compared to the measurements was in the range of the average error of approx. 1 °C.
The analysis of the simulation results showed the existing demand for heating cells in the tested facility for the three tested variants (Figure 12).
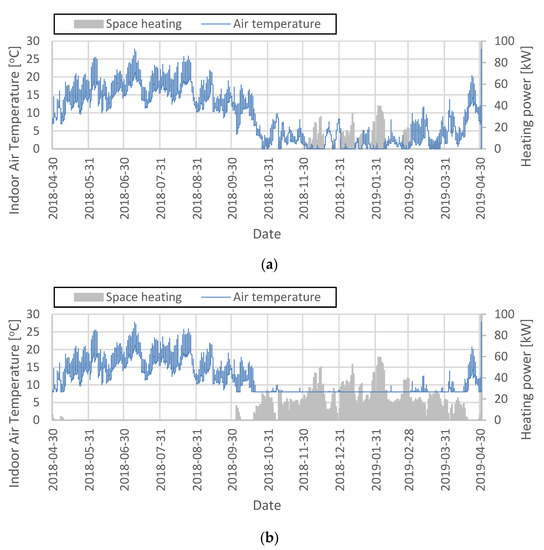
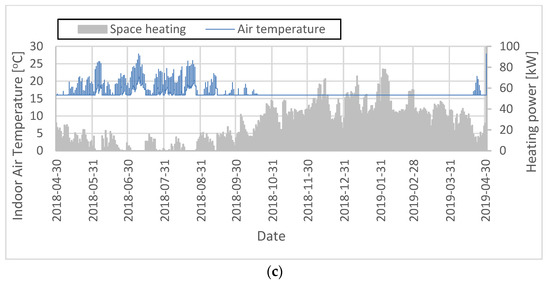
Figure 12.
Energy demand for heating purposes against the background of internal air temperature: (a)—variant 1; (b)—variant 2; (c)—variant 3.
The maximum heating power for variant 1 (minimum internal air temperature 0 °C) is 39.65 kW and falls on 3 February 2019. In variant 2, a minimum internal air temperature of 8 °C was assumed. The analysis of the heating power demand for such conditions clearly indicates the need to provide 59.45 kW of heating power to meet this condition (Figure 12b). In this case, the highest demand for heating purposes falls on 3 February 2019, as in variant 1. On the same day, the highest demand for heating purposes was also recorded for variant 3 (minimum internal air temperature 16 °C) the power of the heating system was 78.21 kW.
The above dependencies are reflected in the year-round exploitation period, assuming daily masses (on Sundays and weekdays). However, the examined facility is used periodically; therefore, a detailed analysis of heating needs is carried out below, only for the days on which the services were held. The share of the faithful in the heat gains was also verified, which reduced the demand for heating purposes in relation to the church without the presence of the faithful. For this purpose, Table 3 lists the dates of the services together with the number of believers. The analysis assumed that the heating system will be turned on 1 h before the service and will be turned off after the end of Holy Mass. Therefore, there is a 2 h heating cycle for one service.
Table 3.
Heating demand during services.
The analysis of the heating demand simulation results for the 3 variants showed that the internal air temperature was kept above 0 °C in all monasteries, without the need to start the heating system. This is due to the energy gains from people attending the services, the values of which ranged from 3.8 kW to 49.6 kW depending on the date of the service. In variant 2, the necessity to reheat the air inside the church during services 9 and 14 was noted, because heat gains from people were lower than the total heat demand, in order to maintain the air temperature inside the level at ≥8 °C. Adopting a minimum internal air temperature of ≥16 °C (variant 3) results in the necessity to start the heating system at five services (no. 7, 9, 11, 12 and 14). The greatest demand for heating power was 21.8 kW (including profits from people) on 26 January 2019.
The thermal inertia of such buildings is relatively small, which makes the thermal conditions inside them very susceptible to changes in environmental conditions (temperature, wind speed, insolation), as well as changes in internal heat sources. Maintaining the internal temperature at an appropriate level requires a relatively large amount of energy. In the case of real conditions (measurement), the heat gains came only from the faithful. After the end of the Mass, the time delay in achieving the internal and external air temperature equilibrium ranged from 11 to 14 h in the summer period. In the winter, the cooling of the interior was much faster 4–6 h after the end of the service.
4. Discussion
Most microclimate studies concern monitoring the indoor climate and improving it through ventilation systems, or selecting an appropriate heating system [12,13,14,15]. Some authors have pointed out that the temporal evolution of the parameters in the indoor environment can be affected by the presence of people [1,9]. These types of temporary fluctuations in temperature and relative humidity are more rapid in a wooden unheated church. This is due to the low heat accumulation by the partition. The wooden church in southern Poland provides an example of that. Camuffo [19] points out that these fluctuations disrupt the natural microclimate and can have a negative effect on the preservation of exhibits. Sudden spikes in temperature and fluctuations in relative humidity can be devastating to polychromes, carvings, and even the structure of the studied church. Varas-Muriel M. J. and Fort R. [12] note that the presence of humans indoors has no significant effect on microclimate. However, this is due to the large dimensions of the church they studied. The presence of people significantly affects the conditions inside because of the small size of the church in Ptaszkowa. Particularly, large changes are visible under the choir, as this part of the church has a low ceiling and reduced air movement. In a study in Spanish churches, it was noted that the effect of people on the indoor environment is significant, but only when the church is full, such as during holidays. Between April and October, the temperature rise in the most populated areas was up to 7 °C [18]. A similar relation was observed in the studied church, with the temperature increase being the highest in the places where most people gather (in the nave and under the choir). With 300 people in the summer, there was an increase in temperature of up to 7.2 °C. The same studies by Varas-Muriel et al. [18] include an analysis of CO2 concentrations, and the authors noted that the most commonly recorded concentrations in an empty church were 400–600 ppm, defining mean air quality. Concentrations rose to 600–1000 ppm with people present, indicating moderate air quality. When the church was full, the concentration values exceeded 1000 ppm, which posed a threat to the health of the worshipers. In their study, Bencs et al. [20] recorded values of 1200–1700 ppm when the church wasfull, exceeding the limit values and possibly affecting the comfort of people. They also noted that gaseous contaminants can caused a threat to exhibits. In the church in Ptaszkowa, also before the service, CO2 levels reached about 400 ppm, and then exceeded the limit value and reached 1800 ppm. The obtained simulation results showed that people attending church services had a significant share in the thermal energy gains inside the church. In order to meet the assumptions for variant 1, there are no requirements to start the heating system, assuming a similar schedule of services. In the other two variants it would be necessary to install a heating system in the church, e.g., radiant heaters. The validated calculation model will be used by the authors for further analyses in order to optimize the number of the faithful in the church, taking into account fluctuations not only in air temperature, but also in the relative humidity of the internal air. In this case, it will be possible to lengthen or shorten the heating period, which will translate into optimization and stabilization of the hygrothermal conditions in the tested facility.
5. Conclusions
The external conditions have the greatest impact on changes in the microclimate in rooms. The presence of people affects the momentary fluctuations in internal parameters. Both the number of people attending the service and the time of year are important. In connection with the above, the following conclusions were made:
- In the winter, a significant influence of the faithful on the formation of thermal and humidity conditions in the examined unheated wooden church was found. The greatest fluctuations in air temperature in the building amounted to 9.4 °C (with 400 people attending the mass).
- In the summer period, the influence of the faithful on the amplitude of the air temperature inside the church is almost two times smaller compared to the winter period (the maximum amplitude was 4.5 °C), but it should be noted that even a small number of people (57 in July) affects the visible fluctuations in the microclimate of the church due to its small cubature.
- The periodic nature of the use of the church has an influence on large fluctuations in thermal and humidity conditions.
- More frequent services could help reduce the impact of outdoor conditions on the indoor microclimate. The facility would not have time to cool down before the next service, and therefore human heat emissions would play a greater role.
- The test results showed that this type of facility has insufficient ventilation. The CO2 level in the church during the service exceeds the limit of 1000 ppm, reaching even 1800 ppm, which can affect people’s comfort.
- In terms of the conservation aspect, rapid changes in the indoor climate in historic buildings are harmful. They can have a negative impact on the conservation of exhibits, contributing to their faster deterioration. Historic buildings should have a constant microclimate that allows valuable buildings to be kept unchanged for a long time.
- The tested object meets the minimum temperature requirements of ≥0 °C, without the need to heat the interior.
- In order to maintain an indoor air temperature of ≥8 °C, the building should be equipped with a 60 kW heating system. This power corresponds to the conditions in which people do not live in the church.
Author Contributions
Conceptualization, G.N., P.S. and M.M.; methodology, G.N., M.M. and P.S.; software, M.M. and P.S.; formal analysis, M.M., P.S., G.N. and P.S.; investigation, G.N. and P.S.; resources, G.N., M.M. and P.S.; data curation, M.M., G.N. and P.S.; writing—original draft preparation, G.N., M.M. and P.S.; writing—review and editing, G.N., M.M. and P.S.; visualization, M.M. and P.S.; supervision, G.N. and P.S.; All authors have read and agreed to the published version of the manuscript.
Funding
This research received no external funding.
Institutional Review Board Statement
Not applicable.
Informed Consent Statement
Not applicable.
Conflicts of Interest
The authors declare no conflict of interest.
References
- Silva, H.E.; Henriques, F.M.A. Preventive conservation of historic buildings in temperate climates. The importance of a risk-based analysis on the decision-making process. Energy Build. 2015, 107, 26–36. [Google Scholar] [CrossRef]
- Sharif-Askari, H.; Abu-Hijleh, B. Review of museums’ indoor environment conditions studies and guidelines and their impact on the museums’ artifacts and energy consumption. Build. Environ. 2018, 143, 186–195. [Google Scholar] [CrossRef]
- Ferdyn-Grygierek, J.; Grygierek, K. HVAC control methods for drastically improved hygrothermal museum microclimates in warm season. Build. Environ. 2019, 149, 90–99. [Google Scholar] [CrossRef]
- Bratasz, Ł.; Kozłowski, R. Laser sensors for continuous in-situ monitoring of the dimensional response of wooden objects. Stud. Conserv. 2005, 50, 7–15. [Google Scholar] [CrossRef]
- Bratasz, Ł.; Kozłowska, A.; Kozłowski, R. Analysis of water adsorption by wood using the Guggenheim-Anderson-de Boer equation. Eur. J. Wood Wood Prod. 2011, 70, 445–451. [Google Scholar] [CrossRef] [Green Version]
- Mleczkowska, A.; Strojecki, M.; Bratasz, Ł.; Kozłowski, R. Particle penetration and deposition inside historical churches. Build. Environ. 2016, 95, 291–298. [Google Scholar] [CrossRef]
- Ferdyn-Grygierek, J.; Kaczmarczyk, J.; Blaszczok, M.; Lubina, P.; Koper, P.; Bulińska, A. Hygrothermal Risk in Museum Buildings Located in Moderate Climate. Energies 2020, 13, 344. [Google Scholar] [CrossRef] [Green Version]
- Kupczak, A.; Sadłowska-Sałęga, A.; Krzemień, L.; Sobczyk, J.; Radoń, J.; Kozłowski, R. Impact of paper and wooden collections on humidity stability and energy consumption in museums and libraries. Energy Build. 2018, 158, 77–85. [Google Scholar] [CrossRef]
- Ferdyn-Grygierek, J.; Baranowski, A. Internal environment in the museum building—Assessment and improvement of air exchange and its impact on energy demand for heating. Energy Build. 2015, 92, 45–54. [Google Scholar] [CrossRef]
- Martinez-Molina, A.; Boarin, P.; Tort-Ausina, I.; Vivancos, J.-L. Assessing visitors’ thermal comfort in historic museum buildings: Results from a Post-Occupancy Evaluation on a case study. Build. Environ. 2018, 132, 291–302. [Google Scholar] [CrossRef] [Green Version]
- Bratasz, Ł.; Kozłowski, R. Entwicklung der neuen EU-Normen—The CEN TC346 draft standard on heating historic churches: Minimising disturbance to the indoor climate. KlimagestaltungimSpannungsfeldzwischenKulturguschutz und Nutzerwünschen, Tagungsblatt des 1. Konservierungswissenschaftlichen Kolloqiums 2007, 18, 24–31. [Google Scholar]
- Varas-Muriel, M.J.; Fort, R. Microclimatic monitoring in an historic church fitted with modern heating: Implications for the preventive conservation of its cultural heritage. Build. Environ. 2018, 145, 290–307. [Google Scholar] [CrossRef]
- Silva, H.E.; Coelho, G.B.A.; Henriques, F.M.A. Climate monitoring in World Heritage List buildings with low-cost data loggers: The case of the Jerónimos Monastery in Lisbon (Portugal). J. Build. Eng. 2020, 28, 101–129. [Google Scholar] [CrossRef]
- Aste, N.; Torre, S.D.; Adhikari, R.S.; Buzzetti, M.; Del Pero, C.; Leonforte, F.; Manfren, M. Sustainable church heating: The Basilica di Collemaggio case-study. Energy Build. 2016, 116, 218–231. [Google Scholar] [CrossRef]
- Semprini, G.; Galli, C.; Farina, S. Reuse of an ancient church: Thermal aspect for integrated solutions. Energy Procedia 2017, 133, 327–335. [Google Scholar] [CrossRef]
- Nawalany, G.; Sokołowski, P.; Michalik, M. Experimental Study of Thermal and Humidity Conditions in a Historic Wooden Building in Southern Poland. Buildings 2020, 10, 118. [Google Scholar] [CrossRef]
- Kabatova, V.; Durica, P. Zmierzone i symulowane wartości temperatury w wybranej ścianie drewnianego budynku z uwzględnieniem kierunku kardynalnego. Transp. Res. Procedia 2019, 40, 718–723. [Google Scholar]
- Varas-Muriel, M.J.; Fort, R.; Martínez-Garrido, M.I.; Zornoza-Indart, A.; López-Arce, P. Fluctuations in the indoor environment in Spanish rural churches and their effects on heritage conservation: Hygro-thermal and CO2 conditions monitoring. Build. Environ. 2014, 82, 97–109. [Google Scholar] [CrossRef] [Green Version]
- Camuffo, D.; Pagan, E.; Bernardi, A.; Becherini, F. The impact of heating, lighting and people in re-using historical buildings: A case study. J. Cult. Herit. 2004, 5, 409–416. [Google Scholar] [CrossRef]
- Bencs, L.; Spolnik, Z.; Limpens-Neilen, D.; Schellen, H.L.; Jütte, B.A.H.G.; van Grieken, R. Comparison of hot-air and low-radiant pew heating systems on the distribution and transport of gaseous air pollutants in the mountain church of RoccaPietore from artwork conservation points of view. J. Cult. Herit. 2007, 8, 264–271. [Google Scholar] [CrossRef]
Publisher’s Note: MDPI stays neutral with regard to jurisdictional claims in published maps and institutional affiliations. |
© 2021 by the authors. Licensee MDPI, Basel, Switzerland. This article is an open access article distributed under the terms and conditions of the Creative Commons Attribution (CC BY) license (https://creativecommons.org/licenses/by/4.0/).