Abstract
This study uses natural fibre, which is moisture absorbent, as an innovative and economical filler for insulating oil. Rice husk (RH) is a natural fibre known to have water-absorbing properties and used as a supplementary cementitious material. This research utilises the water-absorbing properties of RH to improve the physicochemical and dielectric properties of insulating oil. RH was refined into a fine powder at a diameter of less than 63 µm. Palm oil (PO) was synthesised with RH at concentrations of 0 g/L, 0.01 g/L, and 0.1 g/L. The moisture-absorbent properties of RH were analysed by using Fourier-transform infrared (FTIR) spectroscopy. The particle size and distribution of RH in PO were also obtained using a scanning electron microscope (SEM) and a Zeta particle analyser. The breakdown voltage (BDV) strength of PO with RH was measured according to IEC 60156, and the dielectric frequency response was investigated in the range of 102–105 Hz. RH is proven to absorb moisture from PO, as the O–H band intensity at the 3350 cm−1 is increased from the experimental results. Therefore, the mean BDV and dielectric insulation properties of PO dispersed with RH also increased accordingly.
1. Introduction
Mineral oil (MO) has been used as the dielectric liquid in transformers since 1899, for more than 75 years as a cooling agent, and to prevent internal short circuit [1]. However, it has many disadvantages, such as being unsustainable. It is also flammable, with a low flashpoint of 144 °C. When it leaks, it is very toxic to the environment and human health. Thus, natural ester (NE) has been studied as an environmentally friendly alternative to MO.
Sources of naturally occurring esters, or NEs, include fats and oils obtained from animals and plants. Oil is fat that has a melting point below room temperature, while solid fat has a melting point above room temperature [2]. Meat fats are obtained from three kinds of domesticated animals: lard from pigs, tallow from cattle and sheep, and milk fat or butter from cows. Oil from plants is recovered from oilseeds and oil-bearing fruits and nuts [3]. Plant-based NEs are more suitable than animal-based NEs in terms of production costs, and fewer processes are involved in obtaining plant-based NEs.
Natural esters (NEs) obtained from renewable sources such as vegetable oils have 95–100% greater biodegradability than mineral oils (MO), which are only 30% biodegradable [4]. In addition to being consumed as food, vegetable oils have been used as biodiesel since 2011 in Malaysia, with a 5% vegetable oil composition in diesel [5]. They have a high flashpoint of about 300 °C, so they are less flammable than MO [6]. Moreover, they have a BDV range of 49–97 kV, compared to MO, with a range of 45–85 kV [6].
Palm oil (PO) is a type of NE, of which Malaysia produced 26% of the global output in 2019, at 19 × 109 kg [7]. The viscosity of PO can be as high as 58 mm2/s at 40 °C, depending on the type of PO used [8]. The breakdown voltage of PO is around 31 kV [9]. PO is reported to have been used in transformers since 2009 [10], but only limited information is available. However, POs have disadvantages, such as higher viscosity than MO [8], being prone to oxidation, and readily absorbing moisture [1]. Thus, modifications are needed in order to improve the properties of PO further.
NEs can be modified by adding fillers. Two techniques are used to synthesize NEs with fillers: the one-step method and the two-step method [11]. The one-step method synthesises and disperses fillers in the NEs simultaneously. The two-step method is when the fillers and the base oil are prepared in two different steps. First, the fillers are prepared separately using the chemical or physical method; next, the fillers are dispersed in a base oil.
Fillers allow heat transfer out of the fluid to increase the conduction and convection coefficients [11]. Furthermore, fillers also increase the breakdown voltage (BDV) of the fluid. Another advantage of fillers is that their properties can be modified before they are added to oil. Fillers that have been studied in liquid dielectrics are in the form of nanoparticles—namely, iron oxide (Fe2O3), titanium dioxide (TiO2), and silica (SiO2) [12]. However, they are expensive to make and hazardous to human health.
Hussein et al. [13] studied the effect of the concentration of TiO2 on the thermal conductivity of PO. It was found that as the concentration of TiO2 increased to 9% of the nanofluid volume fraction, the thermal conductivity also increased by almost 9%. Mohamad et al. [11] studied the dielectric and physicochemical properties of PFAE-based oils prepared with three types of fillers: (1) conductive Fe3O4 nanoparticles, (2) semi-conductive TiO2 nanoparticles, and (3) insulating Al2O3 nanoparticles. For each sample, the concentration of the filler was 0.01 g/L. The BDV of PFAE-based oils with NPs increased from 27.5 kV to more than 35 kV, improving by 27%. Mohamad et al. deduced that conductive fillers acted as electron scavengers and slowed the negatively charged particles present in the oil, which also slowed the dielectric breakdown event. However, the viscosity of PFAE-based oils was independent of the presence of NPs. Saenkhumwong and Suksri [14] compared the effects of ZnO and TiO2 fillers at various concentrations (0.01 g/L, 0.05 g/L, 0.10 g/L, 0.15 g/L, and 0.20 g/L) on the dielectric properties of palm ester. From the study’s results, as the concentration of fillers increased, so too did the BDV of palm ester, with improvement of between 7% and 54%, and between 6% and 44%, for TiO2 and ZnO, respectively. In a study by Oparanti et al. [15], the BDV of palm kernel oil increased by 38%, from 21 kV to 29 kV, when Al2O3 was added at 0.6 wt%. When TiO2 at 0.6 wt% was added to palm kernel oil, the BDV increased by 33%, from 21 kV to 28 kV. Beyond 0.6 wt%, there was no further increment of the BDV.
Natural fibre may be a suitable filler candidate from renewable sources. Natural fibre contains cellulose, a linear natural polymer found in plant cell walls [16]. This can be extracted from the plant cell walls using harsh chemicals, specific enzymes, or intense mechanical forces, in order to be used as fillers. About 1015 kg of natural fibres are produced annually [17] as byproducts; hence, researchers have studied them for their usage, and to reduce natural fibre wastage. They can be applied as fuel substitutes for power generation [18], enhancement of mechanical properties [19], thermal conductivity, and high-voltage (HV) insulation [20]. Natural fibres have been used as fillers in lubricant oil to improve its physicochemical properties, such as viscosity [21]. However, there are not many studies on applying natural fibres as insulating oil fillers [20]. Natural fibres are naturally hydrophilic [21], so they also have potential as moisture absorbents in insulating oil.
RH is a natural fibre composed of cellulose (35%), hemicellulose (25%), lignin (20%), ash (17%) (94% silica), and moisture (~3%) by weight [22]. RH is mainly used for mechanical reinforcement, and as a supplementary cementitious material, because of its water-absorbing properties [19]. To improve the adhesion of RH to composites, RH is treated with an alkali (NaOH) between 2% and 10% to remove hemicellulose and lignin [23]. However, NaOH-treated RH would slightly reduce the ash content, which also contains silica. RH can be further synthesized to produce pure silica via acid leaching [19], but this would remove its natural fibre characteristics. To replace fillers such as Fe2O3, TiO2, and SiO2, the natural fibre candidate should improve the insulating properties of HV insulating oil. A new type of natural-fibre-based filler from RH can be made by taking advantage of the insulating enhancement properties of silica in RH.
Many studies on insulating oil with inorganic fillers have been published to improve its thermal properties [13] and breakdown voltage [11]. However, there is only one study by He et al. [20] that uses natural fibre for the dielectric enhancement of insulating oil, even though extensive studies on natural fibres have been conducted in various fields. Hence, natural fibre was chosen as the organic filler for insulating oil in this study. The effects of natural fibre on the physicochemical and dielectric properties are presented and discussed in this study. This paper is divided into five sections: Section 1 is the introduction, followed by Section 2, which describes the material used, sample preparation, and experimental setup. Section 3 and Section 4 analyse the experimental results, while Section 5 presents the conclusions.
2. Materials and Methods
2.1. Sample Preparation
The natural fibre filler was prepared from rice husk (RH) obtained from a local rice mill. The RH was washed with distilled water and filtered to remove dust and rocks. After the RH was air-dried, it was ground into a fine powder and sieved to obtain an average size of less than 63 µm.
The natural ester used in this study was refined palm oil (PO). The PO was dried in a Memmert UM400 drying oven at 80 °C for 24 h. Next, the PO was cooled at room temperature for 24 h. Using a two-step method, the filler (RH) was added to 500 mL of palm oil according to the composition, as shown in Table 1, and stirred using a magnetic stirrer. Then, the samples—PORH1 and PORH2—were sonicated in a Branson 5510 sonicator bath for 30 min at 24 °C to obtain homogeneous fluids. Four batches for each sample—PO, PORH1, and PORH2—were prepared, and then the samples were kept at room temperature.

Table 1.
Weight fraction of NE formulation samples.
2.2. Physicochemical Analysis
Fourier-transform infrared spectroscopy (FTIR) analyses were performed on PO, RH, and filtered RH suspended in PO (RH (filtered)) using a PerkinElmer 100 Spectrometer at a frequency between 400 cm−1 and 4000 cm−1 at room temperature, in order to confirm the moisture-absorbent properties of RH. RH (filtered) was prepared by filtering the RH suspended in PO using a micron filter paper.
Scanning electron microscopy (SEM) analysis was performed using a JEOL JSM-5610LV microscope to confirm the size of sieved RH—which was below 63 µm—and to analyse its morphology. The particle-size distribution (PSD) of PORH1 and PORH2 was obtained by using a Zetasizer Nano ZS. The sample preparation for PSD was the same as in Section 2.1. Next, 2 mL of each sample was transferred to a cuvette cell, and analysed with the Zetasizer Nano NS three times at room temperature. The three sets of PSD data were averaged and presented in a distribution graph.
2.3. Dielectric Properties
The breakdown voltage (BDV) test was conducted according to IEC60156 using a Megger OTS100AF Oil Tester. The gap between two mushroom-shaped electrodes was adjusted to 2.5 mm using the Megger Thickness Tool. The oil chamber was filled with the sample to 400 mL. Then, the breakdown voltage test was carried out, with a total reading of 18.
The impedance measurement of the samples was conducted by using electrochemical impedance spectroscopy (EIS). The measurement was obtained at a frequency range of 50–0.1 kHz at 0.4 Vrms at room temperature. Two stainless steel electrodes of similar size were used, with 30 mm diameter and 10 mm thickness. A 4 cm × 4 cm piece of Kraft paper with a thickness of 1 × 10⁻⁴ m was placed between the two electrodes. The electrodes and the Kraft paper were fully immersed in each sample.
The real (Z′) and imaginary (Z″) components at different applied frequencies were recorded via EIS. The impedance expression is described in detail in [24,25].
The complex permittivity (εr*) expression is given by:
where ε′ is the real part of permittivity and ε″ is the imaginary part of permittivity. The real and imaginary parts of permittivity are calculated by using these formulae:
where is the real component of impedance, is the imaginary component of impedance, f is the frequency of the electric field, and is the free space capacitance between the electrodes as described in [24].
εr* = ε′ + ε″
3. Results and Discussions
3.1. FTIR Results
Figure 1a,b shows the FTIR spectra of PO, RH, and RH (filtered). In Figure 1a, the FTIR spectra of RH and RH (filtered) are in good agreement with the results obtained by Choi et al. [17]. The absorption band at 3350 cm−1 in RH and RH (filtered) is assigned to the O–H stretching vibration of water molecules [18]. The presence of alky moieties of palmitic saturated fatty acid is substantiated by the absorption band at 2856 and 2926 cm−1 [26] in both samples. The absorption band at 1746 cm−1 in PO is assigned to C=O stretching, showing the presence of oleic acid [26]. The bands at the range of 1440–1480 cm−1 in PO are attributed to the O–H in-plane bending vibration intensity [27], while the wavenumber at 1164 cm−1 is assigned to C–O stretching, corresponding to the characteristics of an ester group [28]. The broad peaks at 458 and 1048 cm−1 are attributed to the stretching vibrations of the siloxane (Si–O–Si) groups [18] in RH and RH (filtered).
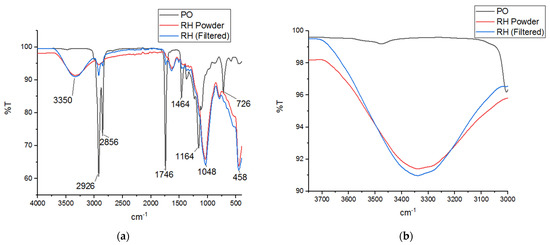
Figure 1.
(a) FTIR spectra of PO, RH and RH (filtered) between 400 cm−1 and 4000 cm−1, and (b) expanded FTIR spectra of PO, RH powder, and RH (filtered) between 3000 cm−1 and 3750 cm−1.
In Figure 1b, RH (filtered) is shown to have higher O–H intensity than RH. Suleiman et al. [27] reported the effect of moisture content—which is relative to the intensity of O–H stretching vibration intensity—on breakdown voltage (BDV). When the moisture content increased, the intensity of O–H would also increase, and reduced the BDV of the NE. In this experiment, it may be deduced that the presence of RH reduced the moisture content of PO, which, in turn, also improved the BDV of PORH1 and PORH2.
3.2. Particle Size Results
Figure 2 shows the SEM image of RH at 400× magnification. The RH particles in the SEM image are carbon-coated, and some of them are indicated by the green arrows. Each individual RH particle has a width of approximately less than 10 µm and a length of less than 50 µm. The SEM image confirmed that RH was successfully sieved at a micron size of less than 63 µm.
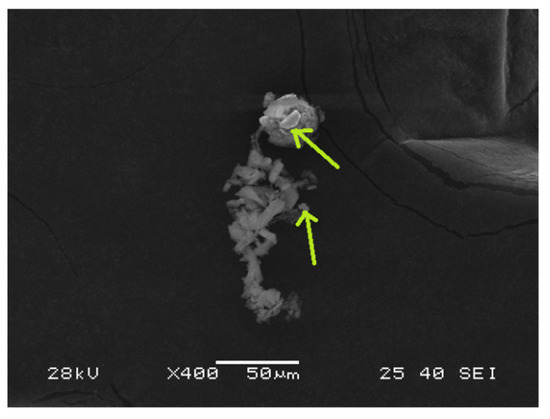
Figure 2.
SEM image of rice husk (RH) at 400× magnification.
The particle-size distributions (PSDs) of PORH1 and PORH2 are shown in Figure 3. A relative intensity size distribution graph is suitable for detecting the smallest amount of aggregation [29]. In Figure 3, PORH1 consists of two different particle sizes, with approximately 1 nm and 900 nm. For PORH2, the two different particle sizes are approximately 50 nm and 1 µm. According to the SEM image, the size of RH may not be between 1 nm and 50 nm. It is more reasonable for RH sizes to be between 900 nm and 1 µm.
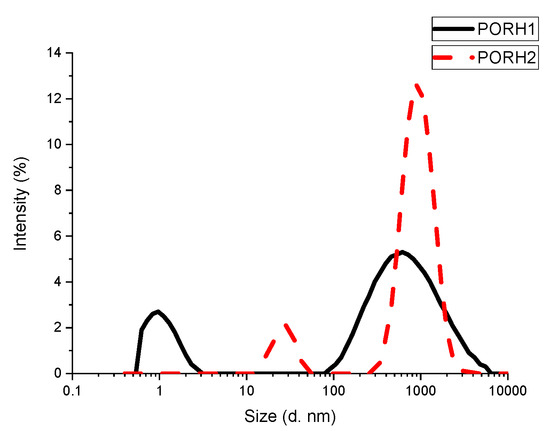
Figure 3.
Relative intensity distribution of RH size.
In a study by Abbasi and Baheti [30], agglomeration occurred in the wider particle size region. However, in this study, the wider particle size of RH in PSD was its actual size as confirmed in the SEM image, and not because of agglomeration. The small peaks in Figure 3 are probably due to contaminations in the cuvette cell, or to microbubbles [6] in the PO when transferring the sample into the cuvette cell.
3.3. BDV Results of PO
Table 2 shows the mean BDV of PO, PORH1, and PORH2. As stated in IEC 60156, 30 kV is the mineral oil’s standard BDV [31]. Mineral oil has a lower BDV than PO, according to the results. As seen in Table 2, unfilled PO has the lowest mean BDV compared to RH-filled PO. From Table 2, when the filler amount is 0.01 g/L or 0.1 g/L, the PO’s mean BDV improves by 20% and 37%, respectively. The silica content in the RH is associated with the BDV enhancement. In oil, silica becomes electron traps, limiting free electron flow [32]. RH could behave similarly to electron traps in this experiment due to the presence of silica which, under electrical stress, inhibits the free electrons’ movement. In a study by He et al. [20], cellulose-filled natural ester oil also improved the BDV; their findings show that the electrical conductivity of the natural ester oil decreases by 22% at 0.05 wt% of cellulose concentration. Hypothetically, in this experiment, by adding RH, the electrical conductivity of PORH1 and PORH2 was reduced, thus improving the BDV.
Table 2.
Mean breakdown voltage of PO samples.
Additionally, silica is a hydrophilic material [32] that readily absorbs water or moisture from the PO. There is a possibility that, on the filler, an orderly water layer is formed, forming a conductive path across its surface. Therefore, the filler’s surface would have a more robust local conductivity, resulting in a high shallow trap density, collecting and releasing fast-moving electrons, delaying the movement of electrons in the oil, and preventing space charge accumulation in PO. The PO’s breakdown strength would be improved because of the reduced charge accumulation.
Figure 4 shows the mean and standard deviation (SD) of the BDV of PO, PORH1, and PORH2. As shown in Figure 4, PORH2 has the lowest SD of 3.8; however, PORH1 has the highest SD of 9.7. The coefficient of variance of BDV is 16.4%, 23.6%, and 8.1% for PO, PORH1, and PORH2, respectively. The statistical trend for the SD and the coefficient of variance is the same, confirming that PORH2 has the most stable BDV results compared to pure PO and PORH1. A statistical analysis by Rajeswari et al. [32] reported that corn oil without any filler has a higher coefficient of variance (6.13%) than corn oil with fillers (5.13–5.21%) under BDV testing at a 2.5-mm electrode gap distance. Based on the analysis carried out by Rajeswari et al., fillers can statistically improve the BDV results of natural ester oil.
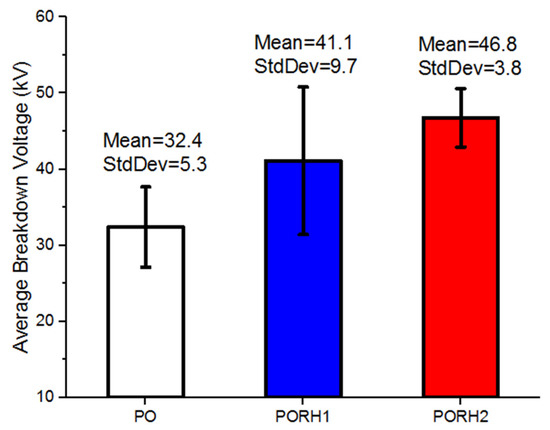
Figure 4.
Breakdown voltage of PO, PORH1, and PORH2.
3.4. Frequency Response Analysis Results of PO
The results of real permittivity (ε′) as a function of frequency and RH concentration are shown in Figure 5. For each PO sample, the permittivity of each sample showed similar characteristics, with different values in relation to frequency. The permittivity value for each sample is higher at a lower frequency. Subburaj et al. [8] stated that the high value of the dielectric constant of vegetable oil was because of its high moisture absorbance capability. Moisture that may still be present in the vegetable oil became free particles that could be easily polarized. By the addition of RH, the dielectric constant of PO was reduced. The RH particles may absorb moisture that is present in PO.
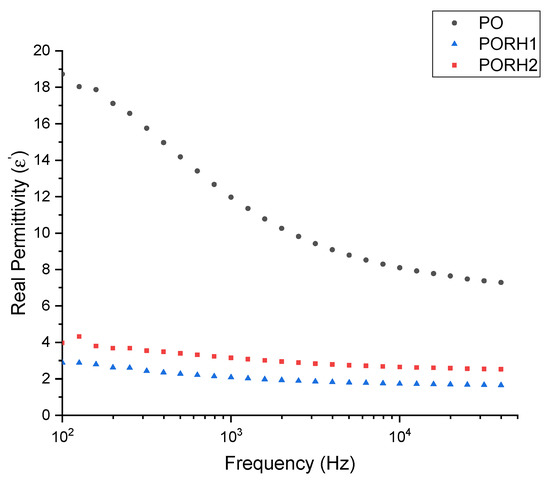
Figure 5.
Real permittivity as a function of applied frequency and RH concentration.
PORH1 has the lowest permittivity, followed by PORH2 and PO. RH is cellulosic, and acts as a polar species. As the quantity of RH increases, the polar species also increases in PO, which increases the value of permittivity.
The previous model is no longer valid at higher frequencies when the real permittivity remains constant after 104 kHz. Each sample shows a decreasing permittivity value because the dipole moments could not keep up in time with the increasing frequency to align their positive and negative charges.
The results of imaginary permittivity (ε″) as a function of applied frequency and RH concentration are shown in Figure 6. For each sample, imaginary permittivity shows similar characteristics, with different values in relation to frequency. PO shows higher imaginary permittivity than PORH1 and PORH2.
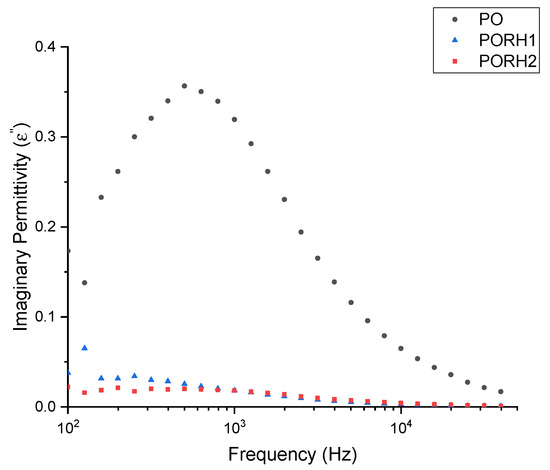
Figure 6.
Imaginary permittivity as a function of applied frequency and RH concentration.
As the frequency increases towards 1 kHz, the imaginary permittivity of PO becomes larger before it drops. Free moisture molecules—which are polar—may be present in PO and increase the imaginary permittivity. However, as the frequency gets higher, the previous model is no longer valid when the imaginary permittivity remains constant after 105 kHz; the imaginary permittivity is influenced by the increment of frequency [9], and decreases.
The effect of the concentration of RH is shown in the BDV results in Table 2. BDV increases when more RH is added to the PO. A similar pattern can also be seen in that the imaginary permittivity decreases when more RH is added, showing that the improvement of BDV is correlated with the decrease in imaginary permittivity.
4. Discussions
The deterioration of BDV is mainly caused by the agglomeration of filler that exists in insulation oil at higher filler concentrations [20]. RH tends to agglomerate, especially when the concentration of RH is increased in a solid composite [22]. To prevent agglomeration, RH can be modified by a surface treatment method to improve the interfacial adhesion between the matrix of a base material and the natural fibre (RH) [23]. A commonly used surfactant for the surface treatment of filler is oleic acid (OA). In a study conducted by Li et al. [33], the concentration of OA on the surface of fillers would reach a constant, and it would not oversaturate over 20% proportion of OA to fillers, because OA can only bond to the surface of fillers. The TEM images of fillers without surfactant were agglomerated compared to fillers with surfactant [33].
The PO contains around 40% OA [9], which may act as a surfactant on the surface of RH. Although the size of RH is more than a thousand nanometres (<63 µm), in low volume, the surface of RH may be fully covered by OA. The effect of OA on RH is shown in Figure 3, where the particle size of RH is in the 1-µm region, as confirmed by the SEM image in Figure 2. Another peak should exist at particle size region wider than 1 µm if agglomeration existed in the RH-filled PO.
In a study carried out by Khor et al. [34], the dielectric permittivity of RH was more than 10, but when RH was added into a polymer composite, the dielectric permittivity of RH was less than 5 [22]. In this work, when RH was added at low volumes, the dielectric permittivity of RH and PO were totalled up, lowering the dielectric permittivity values of PORH1 and PORH2.
PO, a type of vegetable oil, contains O–H groups from its fatty acids, which can absorb water 20–50 times more than saturated hydrocarbons of mineral oil [35]. Hence, PO may absorb moisture when being transferred into the oil chamber. The relative permittivity of water is 80 [36], which could contribute to the higher permittivity of PO compared to PORH1 and PORH2, as shown in Figure 6. The effect of water molecules in PO is also apparent at a higher frequency. The higher imaginary permittivity value is also a measurement of the degree of moisture present in a dielectric insulating liquid [37].
RH may absorb the water molecules in the PO as a moisture absorbent, which is supported by the FTIR results shown in Figure 1b, since natural fibres are naturally hydrophilic [19] and reduce the imaginary permittivity of PORH1 and PORH2. The dependency of grain and seed permittivity on moisture content has been extensively reviewed by Nelson [38]; it was found that as the moisture content increases, the permittivity also increases. A study conducted by Jiang et al. [39] also discovered that the water content of cellulose impregnated with natural ester was higher than that of mineral oil. In a dielectric system with oil–natural fibre insulation, water is prone to migrating between oil and natural fibre in order to reach a relative moisture saturation equilibrium.
Dielectric relaxation processes occur for PO when the dielectric permittivity decreases, while the imaginary permittivity increases, as shown in Figure 6 between 102 and 103 Hz. The increase in imaginary permittivity may be due to the increase in conduction. When more moisture content is present, the ionization energy of ions is reduced, increasing the PO’s electrical conductivity [40].
5. Conclusions
In this paper, the effect of RH on the structures and dielectric properties of PO was evaluated. RH was shown to be water absorbent from the FTIR results, explaining the improvement in the BDV of PO by 27% and 44% when RH at 0.01 g/L and 0.10 g/L, respectively, were added. In contrast, the BDV improvement of natural ester oil with TiO2 at 0.6 wt% was 33%—lower than that of RH at 0.1 g/L. The dielectric permittivity of PO was also improved by adding RH. Overall, RH was proven to be a suitable natural fibre replacement for inorganic fillers in insulating oil.
Author Contributions
S.S.J. and M.Z.H.M. designed the study. S.S.J. performed the experiment, analysed the results, and wrote the paper with feedback from M.Z.H.M., Z.J., K.N.M.A., J.D. and H.A.I. All authors have read and agreed to the published version of the manuscript.
Funding
This research was funded by Universiti Malaysia Sabah, grant number SGI0132-2020 and the APC was funded by Universiti Malaysia Sabah.
Institutional Review Board Statement
Not applicable.
Informed Consent Statement
Not applicable.
Data Availability Statement
Not applicable.
Acknowledgments
The authors would like to thank Mohd Afifi Mohd Nasir from the Institute for Tropical Biology and Conservation, Universiti Malaysia Sabah, Malaysia for supporting this work through lab work and analysis.
Conflicts of Interest
The authors declare no conflict of interest.
References
- Mahanta, D.K.; Laskar, S. Electrical Insulating Liquid: A Review. J. Adv. Dielectr. 2017, 7, 1730001. [Google Scholar] [CrossRef]
- O’Brien, R.D. Raw Materials. In Fats and Oils; CRC Press: Boca Raton, FL, USA, 2009; pp. 1–72. [Google Scholar]
- O’Brien, R.D. Fats and Oils Processing. In Fats and Oils; CRC Press: Boca Raton, FL, USA, 2009; pp. 73–196. [Google Scholar]
- Champa, V.; Nagashree, A.N.; Sumangala, B.V.; Nagabhushana, G.R. Breakdown Behaviour of New Bio-Degradable Dielectric Coolants under 50Hz AC for Different Electrode Configurations. Mater. Today Proc. 2018, 5, 3099–3108. [Google Scholar] [CrossRef]
- Nambiappan, B.; Ismail, A.; Hashim, N.; Ismail, N.; Shahari, D.N.; Idris, N.A.N.; Omar, N.; Salleh, K.M.; Hassan, N.A.M.; Kushairi, A. Malaysia: 100 Years of Resilient Palm Oil Economic Performance. J. Oil Palm Res. 2018, 30, 13–25. [Google Scholar] [CrossRef]
- Taslak, E.; Arikan, O.; Kumru, C.F.; Kalenderli, O. Analyses of the Insulating Characteristics of Mineral Oil at Operating Conditions. Electr. Eng. 2018, 100, 321–331. [Google Scholar] [CrossRef]
- Palm Oil Explorer. Available online: https://ipad.fas.usda.gov/cropexplorer/cropview/commodityView.aspx?cropid=4243000&sel_year=2020&rankby=Production (accessed on 19 January 2021).
- Subburaj, S.K.; Rengaraj, M.; Mariappan, R. Evaluating Critical Characteristics of Vegetable Oil as a Biodegradable Insulating Oil for Transformer. Int. J. Emerg. Electr. Power Syst. 2020, 21, 20200128. [Google Scholar] [CrossRef]
- Makmud, M.Z.H.; Illias, H.A.; Chee, C.Y.; Sarjadi, M.S. Influence of Conductive and Semi-Conductive Nanoparticles on the Dielectric Response of Natural Ester-Based Nanofluid Insulation. Energies 2018, 11, 333. [Google Scholar] [CrossRef]
- Maneerot, S.; Pattanadech, N. Effect of Contaminant on Breakdown Characteristics of Mineral Oil and Commercial Natural Ester. In Proceedings of the 2018 15th International Conference on Electrical Engineering/Electronics Computer, Telecommunications and Information Technology (ECTI-CON), Chiang Rai, Thailand, 18–21 July 2018; pp. 688–691. [Google Scholar]
- Mohamad, M.S.; Zainuddin, H.; Ghani, S.A.; Chairul, I.S. AC Breakdown Voltage and Viscosity of Palm Fatty Acid Ester (PFAE) Oil-Based Nanofluids. J. Electr. Eng. Technol. 2017, 12, 2333–2341. [Google Scholar]
- Attarilar, S.; Yang, J.; Ebrahimi, M.; Wang, Q.; Liu, J.; Tang, Y.; Yang, J. The Toxicity Phenomenon and the Related Occurrence in Metal and Metal Oxide Nanoparticles: A Brief Review From the Biomedical Perspective. Front. Bioeng. Biotechnol. 2020, 8, 822. [Google Scholar] [CrossRef] [PubMed]
- Hussein, A.M.; Kadirgamma, K.; Noor, M.M.; Aik, L.K. Palm Oil Based Nanofluids for Enhancing Heat Transfer and Rheological Properties. Heat Mass Transf. 2018, 54, 3163–3169. [Google Scholar] [CrossRef]
- Saenkhumwong, W.; Suksri, A. The Improved Dielectric Properties of Natural Ester Oil by Using ZnO and TiO2 Nanoparticles. Eng. Appl. Sci. Res. 2017, 44, 148–153. [Google Scholar]
- Oparanti, S.O.; Khaleed, A.A.; Abdelmalik, A.A. Nanofluid from Palm Kernel Oil for High Voltage Insulation. Mater. Chem. Phys. 2021, 259, 123961. [Google Scholar] [CrossRef]
- Nagarajan, K.J.; Balaji, A.N.; Ramanujam, N.R. Extraction of Cellulose Nanofibers from Cocos Nucifera Var Aurantiaca Peduncle by Ball Milling Combined with Chemical Treatment. Carbohydr. Polym. 2019, 212, 312–322. [Google Scholar] [CrossRef]
- Choi, K.; Do Nam, J.; Kwon, S.H.; Choi, H.J.; Islam, M.S.; Kao, N. Microfibrillated Cellulose Suspension and Its Electrorheology. Polymers 2019, 11, 2119. [Google Scholar] [CrossRef]
- Azat, S.; Korobeinyk, A.V.; Moustakas, K.; Inglezakis, V.J. Sustainable Production of Pure Silica from Rice Husk Waste in Kazakhstan. J. Clean. Prod. 2019, 217, 352–359. [Google Scholar] [CrossRef]
- Chouksey, A.; Dev, N.; Kumari, S. Review Paper on Utilization Potential of Rice Husk Ash as Supplementary Cementitious Material. In Sustainable Construction and Building Materials; Das, B.B., Neithalath, N., Eds.; Springer: Singapore, 2019; pp. 673–684. ISBN 9789811333170. [Google Scholar]
- He, S.; Han, L.; Liu, L.; Wang, J.; Huang, Z.; Hau, S. Preparation and Properties of Nano-Cellulose Modified Natural Ester Liquids. In Proceedings of the 2019 2nd International Conference on Electrical Materials and Power Equipment (ICEMPE), Guangzhou, China, 7–10 April 2019; pp. 294–297. [Google Scholar]
- Awang, N.W.; Ramasamy, D.; Kadirgama, K.; Samykano, M.; Najafi, G.; Sidik, N.A.C. An Experimental Study on Characterization and Properties of Nano Lubricant Containing Cellulose Nanocrystal (CNC). Int. J. Heat Mass Transf. 2019, 130, 1163–1169. [Google Scholar] [CrossRef]
- Khalf, A.I.; Ward, A.A. Use of Rice Husks as Potential Filler in Styrene Butadiene Rubber/Linear Low Density Polyethylene Blends in the Presence of Maleic Anhydride. Mater. Des. 2010, 31, 2414–2421. [Google Scholar] [CrossRef]
- Bisht, N.; Gope, P.C. Effect of Alkali Treatment on Mechanical Properties of Rice Husk Flour Reinforced Epoxy Bio-Composite. Mater. Today Proc. 2018, 5, 24330–24338. [Google Scholar] [CrossRef]
- Dabbak, S.Z.A.; Illias, H.A.; Ang, B.C.; Latiff, N.A.A.; Makmud, M.Z.H. Electrical Properties of Polyethylene/Polypropylene Compounds for High-Voltage Insulation. Energies 2018, 11, 1448. [Google Scholar] [CrossRef]
- Citroni, R.; Di Paolo, F.; Di Carlo, A. Replacing Noble Metals with Alternative Metals in MID-IR Frequency: A Theoretical Approach. In Proceedings of the AIP Conference Proceedings, Gold Coast, QLD, Australia, 2–3 May 2018. [Google Scholar]
- Javed, M.; Shaik, A.H.; Khan, T.A.; Imran, M.; Aziz, A.; Ansari, A.R.; Chandan, M.R. Synthesis of Stable Waste Palm Oil Based CuO Nanofluid for Heat Transfer Applications. Heat Mass Transf. 2018, 54, 3739–3745. [Google Scholar] [CrossRef]
- Suleiman, A.A.; Muhamad, N.A.; Bashir, N.; Murad, N.S.; Arief, Y.Z.; Phung, B.T. Effect of Moisture on Breakdown Voltage and Structure of Palm Based Insulation Oils. IEEE Trans. Dielectr. Electr. Insul. 2014, 21, 2119–2126. [Google Scholar] [CrossRef]
- Maharana, M.; Nayak, S.K.; Sahoo, N. Karanji Oil as a Potential Dielectrics Liquid for Transformer. IEEE Trans. Dielectr. Electr. Insul. 2018, 25, 1871–1879. [Google Scholar] [CrossRef]
- Nobbmann, U. Intensity-Volume-Number: Which Size Is Correct? Available online: https://www.materials-talks.com/blog/2017/01/23/intensity-volume-number-which-size-is-correct/ (accessed on 20 May 2021).
- Abbasi, R.; Baheti, V. Preparation of Nanocellulose from Jute Fiber Waste. J. Text. Eng. Fash. Technol. 2018, 4, 101–104. [Google Scholar] [CrossRef][Green Version]
- Mehta, D.M.; Kundu, P.; Chowdhury, A.; Lakhiani, V.K.; Jhala, A.S. A Review of Critical Evaluation of Natural Ester Vis-a-Vis Mineral Oil Insulating Liquid for Use in Transformers: Part II. IEEE Trans. Dielectr. Electr. Insul. 2016, 23, 1705–1712. [Google Scholar] [CrossRef]
- Rajeswari, R.; Chandrasekar, S.; Karthik, B. Statistical Analysis of Partial Discharge, Lightning Impulse and BDV Characteristics of Nano SiO2-Corn Oil for HV Insulation Applications. J. Electr. Eng. Technol. 2019, 14, 877–888. [Google Scholar] [CrossRef]
- Li, Z.; Zhu, Y. Surface-Modification of SiO2 Nanoparticles with Oleic Acid. Appl. Surf. Sci. 2003, 211, 315–320. [Google Scholar] [CrossRef]
- Khor, S.F.; Md Yusoff, M.H.A.; Cheng, E.M.; Rojan, M.A.; Johar, B.; Chik, A.; Talib, Z.A.; Poobalan, B. Dielectric Spectroscopy on Mixture of Rice Husk, Rice Husk Ash and Rice Bran from 4 Hz to 1 MHz. Int. J. Geomate 2016, 11, 2150–2154. [Google Scholar] [CrossRef]
- Koch, M.; Tenbohlen, S.; Stirl, T. Diagnostic Application of Moisture Equilibrium for Power Transformers. IEEE Trans. Power Deliv. 2010, 25, 2574–2581. [Google Scholar] [CrossRef]
- Rajab, A.; Tsuchie, M.; Kozako, M.; Hikita, M.; Suzuki, T. PD Behaviors of Monoester Insulating Oil under Different Moisture Contents. Telkomnika 2018, 16, 481–487. [Google Scholar] [CrossRef][Green Version]
- Mohamad, N.A.; Azis, N.; Jasni, J.; Kadir, M.Z.A.A.; Yunus, R.; Yaakub, Z. Physiochemical and Electrical Properties of Refined, Bleached and Deodorized Palm Oil under High Temperature Ageing for Application in Transformers. Energies 2018, 11, 1583. [Google Scholar] [CrossRef]
- Nelson, S.O. Grain and Seed Moisture Sensing Applications. In Dielectric Properties of Agricultural Materials and their Applications; Elsevier: Amsterdam, The Netherlands, 2015; pp. 77–108. [Google Scholar]
- Jiang, J.P.; Du, B.X.; Cavallini, A. Effect of Moisture Migration on Surface Discharge on Oil-Pressboard of Power Transformers under Cooling. IEEE Trans. Dielectr. Electr. Insul. 2020, 27, 1743–1751. [Google Scholar] [CrossRef]
- Li, Y.; Yu, Q.; Zhang, C.; Li, F.; Yang, J.; Ai, L.; Jiang, H.; Zhong, L. Influence of Moisture Content on Dielectric Properties of Pressboard Impregnated in Mineral Insulating Oil and Natural Ester. In Proceedings of the 2017 IEEE 19th International Conference on Dielectric Liquids(ICDL), Manchester, UK, 25–29 June 2017; pp. 1–4. [Google Scholar]
Publisher’s Note: MDPI stays neutral with regard to jurisdictional claims in published maps and institutional affiliations. |
© 2021 by the authors. Licensee MDPI, Basel, Switzerland. This article is an open access article distributed under the terms and conditions of the Creative Commons Attribution (CC BY) license (https://creativecommons.org/licenses/by/4.0/).