Article

Experimental Comparison between Spherical and Refractive Optics in a Concentrating Photovoltaic System

Department of Industrial Engineering, University of Salerno, Via Giovanni Paolo II, 132, 84084 Fisciano (Salerno), Italy
Energies 2021, 14(15), 4603; https://doi.org/10.3390/en14154603
Submission received: 7 June 2021 / Revised: 20 July 2021 / Accepted: 26 July 2021 / Published: 29 July 2021
(This article belongs to the Special Issue Advances in Concentrator Photovoltaics Technology)

Abstract

:
Since there are not standard configurations of the Concentrating Photovoltaic (CPV) systems, several types of optics are designed and analyzed. In this paper, the optical performances of a spherical mirror and a commonly used Fresnel lens of the same diameter are compared, highlighting their impact on the CPV system energy performance. First, the absolute and percentual variation trends of optical concentration factor and optical efficiency as function of the distance between each optical system and receiver are analyzed. The concentration levels obtained by means of the spherical mirror are much higher than the Fresnel lens, with maximum values of optical efficiency equal to 72.8% and 24.1%, respectively. The analysis of the concentration reduction due to a solar-tracking failure has also allowed the estimation of the acceptance angle, thus observing that the spherical mirror requires a less accurate solar tracker with respect to the Fresnel lens, especially if a secondary optics is adopted. As for the energy comparison, the spherical mirror allows increase of the Triple-Junction (TJ) cell temperature up to about 65 °C higher than the environmental temperature and to reach an electrical power of about 15 W in correspondence of a concentrated solar radiation of 470 kW/m2. Finally, the deviation between the cumulative electric energy produced by the TJ cell in the cases of correct and incorrect solar tracking and for the configurations with and without secondary optics has been also evaluated for both the optics. The equations experimentally obtained in this paper represent a more accurate tool to describe the physical phenomenon in comparison with the equations theoretically obtained for similar CPV systems. The results can be used to design a real CPV system that adopts a Fresnel lens or a spherical mirror. The equations experimentally obtained in this paper represent a more accurate tool to describe the physical phenomenon in comparison with the equations theoretically obtained for similar CPV systems. The results can be used to design a real CPV system that adopts a Fresnel lens or a spherical mirror.

1. Introduction

Concentrating Photovoltaic (CPV) systems adopt optical components to concentrate the direct sunlight decreasing the necessary solar cell area proportionally to the concentration factor [1]. This parameter indicates how many times the solar radiation [2] incident on the primary optics is concentrated on the solar cells [3]. CPV systems use Multi-Junction (MJ) solar cells [4], much more efficient than the silicon cells [5] used in the traditional photovoltaic modules [6]. However, the CPV technology must overcome the technical and economic challenges to achieve success in the energy market [7]. New configurations, components and materials are still being created and tested [8] to decrease the CPV system cost.
The optical systems are a key factor in the reduction of the overall CPV system cost. In fact, the substitution of the expensive PV materials with more affordable mirrors and/or lenses is proportional to the concentration levels achieved. Moreover, secondary optics can improve acceptance angle and optical tolerance of a CPV system, thus allowing the use of more cost-effective solar trackers. Finally, optical systems have the greatest impact on the CPV energy performance [9].
Hence, several typologies of optical systems are being developed and analyzed. There is a wide improving opportunity for solar concentrator designs and technologies. Several geometries, working principles, materials can be adopted with different advantages and disadvantages. It is possible to classify the optical systems in several ways. A first classification that considers if the sunlight is conveyed on a small or larger area or along a line, divides the optics in point-focus, dense array and line-focus systems [10]. According to the concentration methodology, the optics can be reflective or refractive [11]. Another classification, relevant for the performance analysis, takes into account the achievable concentration factor and the optical systems can be divided into concentration low, medium, high and ultrahigh optical systems [12].
Considering the point-focus optics, most of them are of refractive type and above all Fresnel lenses. For example, a high concentrator photovoltaic/thermal (HCPV/T) system based on point-focus Fresnel lens has been studied in [9]. In [13] the electrical performance of a point-focus CPV system adopting the Fresnel lens is experimentally investigated. In [14] both electrical and thermal parameters are analyzed to evaluate the potential energy production of a CPV system which adopts a Fresnel lens as primary optics. The different methodologies for the optical performance evaluation of a Fresnel lens are discussed in [15]. On the contrary, applications of reflective point-focus optics are minor [16]. Some of them are constituted by parabolic mirror as primary optics. A more complex design is reported in [17] where a double reflection Cassegrain CPV [18] with parabolic dish and hyperbolic mirror is analyzed. However, most of the applications of reflective optics are used in dense array [19,20] or in line-focus systems [21,22] in different applications [23].
Despite their current less use, the point-focus reflective optics have good potentialities to overcome the performance limits of the refractive optics, thus leading to more convenient CPV systems. Hence, in this paper a comparison between a refractive and a reflective point-focus optics, constituted by a Fresnel lens and a spherical mirror of the same area respectively, is presented. First, the two optics are compared from an optical point of view highlighting the levels of concentration achievable and the acceptance angles, also in the presence of secondary optics. Moreover, the energy performance of a CPV system equipped with each of such optics are experimentally measured and compared. In the literature and technical practice there is not a standard configuration of a CPV system. There are many configurations of this type of systems and then the equations obtained experimentally in this paper, in prefixed operating conditions, can be used to size and to study the performance of similar CPV systems and represent a more accurate tool to describe the physical phenomenon in comparison with the equations theoretically obtained.

2. Experimental Point-Focus CPV System

The point-focus CPV system adopted in the experimental analysis is reported in Figure 1. It has been realized at the Applied Thermodynamics Laboratory of University of Salerno and presents two different types of primary optics (refractive and reflective). The refractive optics is a Fresnel lens made of PMMA [24], with diameter and thickness respectively equal to 0.3 m and 4·10¯3 m and focal distance of 0.239 m. The reflective optics presents a spherical mirror with diameter of 0.3 m and focal distance of 0.215 m. He has been subjected to an aluminizing treatment to reflect the solar radiation within the TJ cell operation wavelength range
Both the primary optics focus the solar radiation on a receiver constituted by TJ solar cell and passive finned cooling system. The TJ cell is constituted by InGaP/GaAs/Ge (Table 1). The reflection coefficient of the spherical mirror is equal to about 0.90, while the transmission coefficient of the Fresnel lens is about 0.80. For each TJ cell, a pyramid-shaped light-guide, characterized by major base and minor base areas respectively equal to 0.016 m × 0.016 m and 0.01 m × 0.01 m and by a height of 0.075 m, is used as secondary optics. It allows to make uniform the concentrated solar radiation coming from spherical mirror and Fresnel lens to avoid spherical and chromatic aberration problems respectively, and to improve the optical efficiency.
A tracking system is adopted in the experimental CPV system to converge the maximum DNI on the receiver. The experimental plant presents three degrees of freedom allowing both the solar tracking and the concentrating factor variation. The first two allow the solar tracking by means of rotation in the horizontal plane to follow the sun in the azimuth direction and rotation in the vertical plane to follow the sun in the zenithal direction. Moreover, it is possible to vary the distance between primary optics, always placed perpendicularly to the sunrays, and receiver, considering the focal length as further degree of freedom in the experimental analysis. In particular, the experimental plant allows movement on a vertical axis the receiver in the case of the reflective optics and the Fresnel lens in the other case; hence, the incident solar radiation on the TJ cell can be varied varying the concentration factor.
In the experimental system many sensors have been used (Figure 2). A pyrheliometer (accuracy 2%) measures the Direct Normal Irradiance (DNI); PT100 thermo-resistances (accuracy ± 0.2 °C) measure the cells and outdoor temperatures. A variable electrical load is linked to each TJ cell and an acquisition data system is used to measure voltage, current, DNI, and temperatures. The optical concentration factor (Copt) has been experimentally evaluated as ratio between solar radiation concentrated on the TJ cell (Rc) and DNI that is the incident power flow on the optics. Therefore, Copt depends only on the system optical performance and is independent of the TJ cell electrical performance. Rc has been measured by a thermal power sensor (accuracy ± 3%) accurately selected. The thermal sensor presents bimetallic junctions (thermopile). The heat flow determines in the sensor a voltage proportional to the power absorbed. A calibration of the thermal power sensor has been realized to make comparable the measurements obtained by two sensors above mentioned. It is basic that solar radiation concentrated on TJ cell and power sensor are the same during the measurement of Copt (Figure 2).

3. Optical and Energy Performance

The main aim of this paper is to compare two different typologies of primary optics of the same diameter in a point-focus CPV system: spherical mirror and Fresnel lens. First, an optical analysis is necessary to know the energy performance that these optics can guarantee in a point-focus CPV system. In fact, the CPV system energy producibility depends on the amount of solar radiation concentrated on TJ cells; hence, the optical performance has a direct impact on the energy ones.
For this purpose, several experimental tests have been opportunely realized. The first step is focused on the optical performance analysis of the two above mentioned optics. The trends of optical concentration factor (Copt) and optical efficiency (ηopt) are experimentally studied as function of the distance between optics and receiver to define the optimal values. Moreover, the precision that each optical system requires for the CPV solar tracker, expressed in terms of acceptance angle and power losses due to a solar-tracking failure, is evaluated also in the presence of secondary optics.
The second step is focused on the electrical and thermal performance evaluation that each optics can guarantee in a point-focus CPV system. The experimental tests have been carried out at Fisciano (Italy) between January and February 2020; the sampling interval for the data acquisition has been 15 s.

3.1. Optical Analysis

The first parameter to consider is the geometrical concentration factor ( C geo ) which represents the maximum level of concentration theoretically achievable by a given optical system. It depends only on geometrical characteristics, and it is given by the ratio between the solar concentrator area ( A conc ) perpendicular to the sunrays and the TJ cell area ( A c ):
C geo = A conc A c
C geo is the same for both optics since the two concentrators present the same dimensions. However, because each optical system is characterized by power losses, not all the solar radiation incident on the optics is correctly conveyed on the TJ cell. Hence, a more accurate measurement of the concentration effectively obtainable by an optical system is given by Copt. C opt is defined as the ratio between Rc and DNI that represents the power flow incident on the optical system. A measurement of how effectively the power incident on the concentrator is conveyed to the receiver is given by η opt equal to:
η opt = C opt C geo
The distance between each optics and the receiver, said focal length, must be opportunely set to maximize the value of C opt and η opt . This has been made possible by the structure of the CPV plant which has allowed variation of the distances h M C and h L C of spherical mirror and Fresnel lens respectively from the TJ cell during the experimental analysis. Therefore, the trends of C opt as function of h M C and h L C can be analyzed for both the optical configurations with light-guide and without light-guide.
In the presence of the light-guide, it has been observed that for both the optics C opt increases with h L C and h M C respectively until it reaches its maximum value in correspondence of the proper focal length of each optics ( h L C , max and h M C , max ). This increase can be described by an exponential trend in the case of the Fresnel lens and by a parabolic trend as for the spherical mirror, respectively given by the following equations:
C opt = Ae Bh L C
C opt = Ch M C 2 + Dh M C + E
On the contrary, for values of h L C and h M C higher than their respective optimal values, C opt decreases in a parabolic way described by Equation (4) for the spherical mirror and by the following equation for the Fresnel lens:
C opt = Ch L C 2 + Dh L C + E
The coefficients of Equations (3)–(5) have been experimentally determined.
In absence of light-guide, the trends are similar to the previous case, thus being describable by Equations (3) and (4) respectively, but with different values of the coefficients. On the contrary, in the range of h L C and h M C higher than their respective optimal values, the secondary optics absence leads to a more rapid decay of C opt , which become exponential for both the optics. Such trends can be described by Equation (3) for the Fresnel lens and for the spherical mirror by the following equation:
C opt = Ae Bh M C
The trends of η opt and C opt are the same because they differ only by a multiplicative factor according to Equation (2). The percentual decrease of C opt as function of the percentual deviation of h L C and h M C respectively from their optimal value has been also determined. This analysis has been performed both with and without the secondary optics.
An accurate comparison between different optical systems must also consider the accuracy evaluation that each optics requires for the CPV solar tracker to avoid significant power losses. An important parameter used for this aim is the acceptance angle (θ), which represents the angle between sun direction and normal to the optical system of the concentrator, for which the incident radiation is reduced to 90% in comparison with its maximum value. Low values of this parameter indicate that a very accurate solar tracker is essential to not determine a rapid decline of the optical performance. Hence, the reduction of concentrated power as a function of the misalignment angle ( θ mis ) between sun direction and normal to each concentrator is studied. Moreover, the reduction over time in concentrated power due to a solar-tracking failure for each optics is evaluated. This analysis is performed for three different values of h L C and h M C that are the optimal ones and the two values, respectively higher and lower, for which C opt is halved with respect to the maximum value.

3.2. Energy Analysis

The optical characteristics, and above all C opt , have a direct impact on the CPV system energy performance. From a thermal point of view, the increase of the TJ cell temperature ( T c ) under concentration has been evaluated.
The optical analysis described in the previous paragraph has been a necessary step for the energy performance evaluation. Because the electrical efficiency of a TJ cell is affected by its temperature T c , first the T c increase under concentration has been evaluated. The T c values are fundamental to evaluate the possible cogeneration applications of the CPV systems when an active cooling system is adopted [25]. Hence, the increase of T c compared to the environmental temperature ( T env ) when R c varies has been evaluated for each optical system. Results have shown that the increase of T c with respect to the environmental temperature raises logarithmically with R c :
T c T env = α · log ( R c ) + β
where the parameters α and β have been experimentally determined for each optics.
The same analysis has been conducted for the TJ cell electrical power ( P el , c ). It has been found that P el , c increases linearly with R c , according to the following equation:
P el , c = γ · R c + δ
where γ and δ have been experimentally determined for each optics.
Finally, the deviation between the cumulative electric energy produced by the TJ cell in the case of correct and incorrect solar tracking has been also evaluated for each optical system, both with and without the secondary optics.

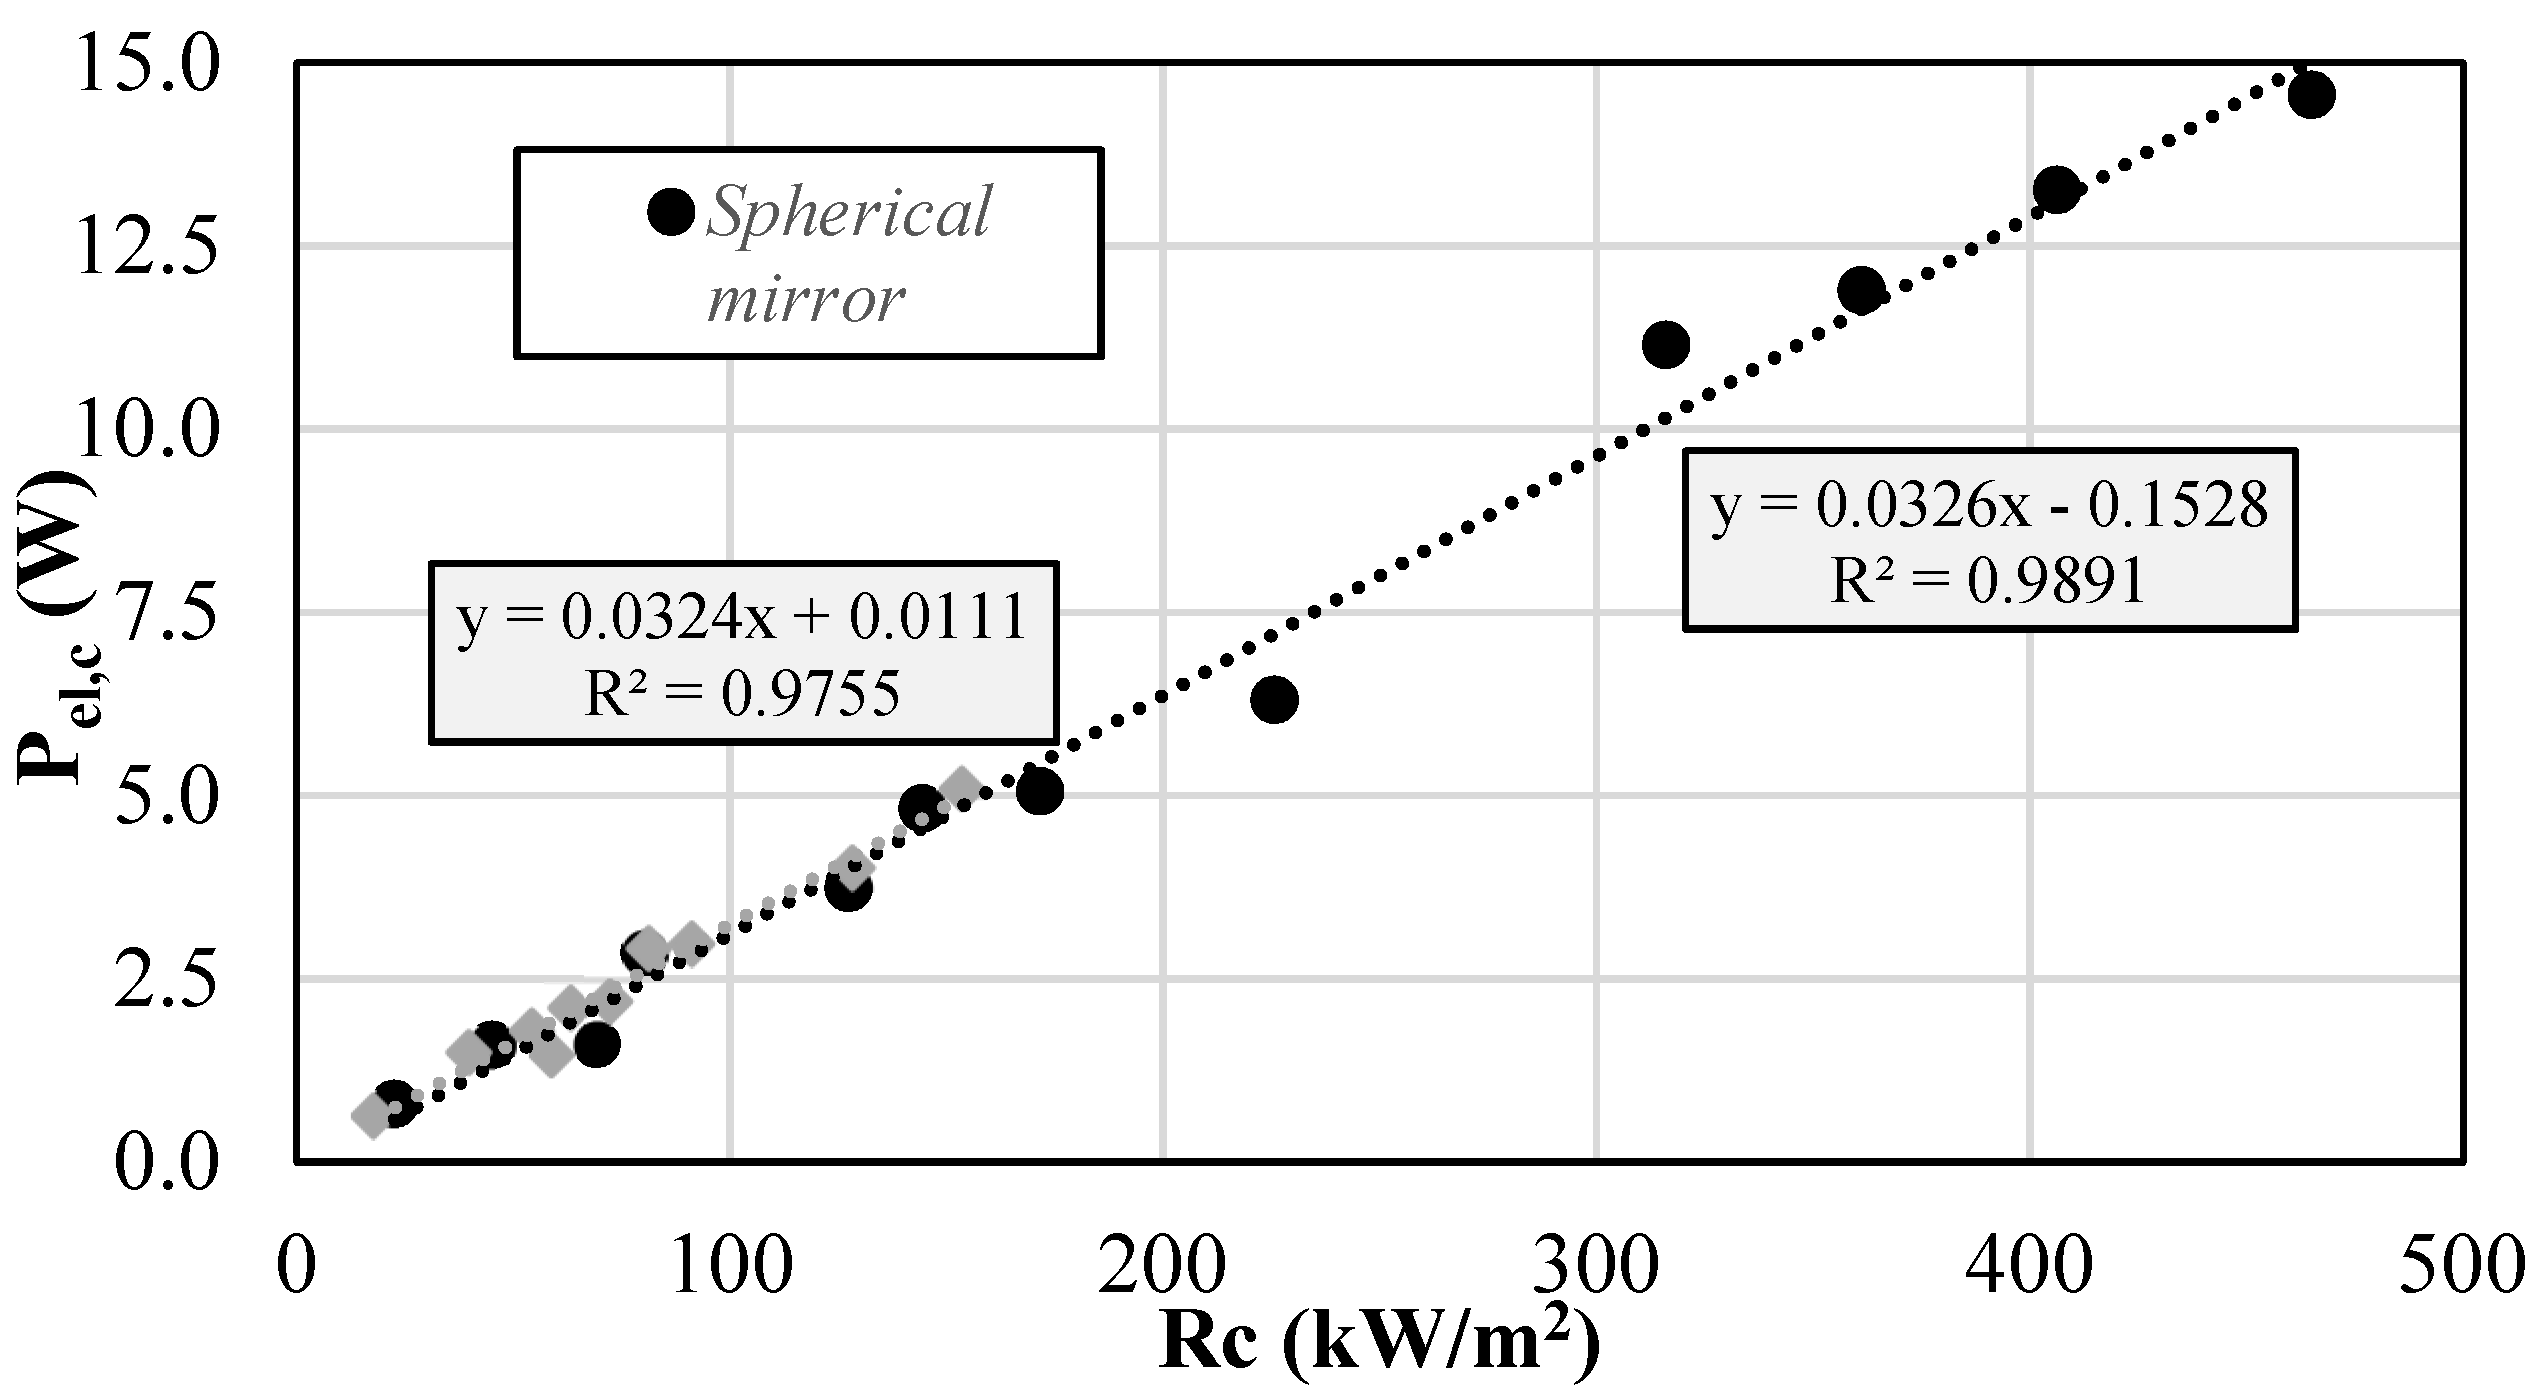
4. Results and Discussion

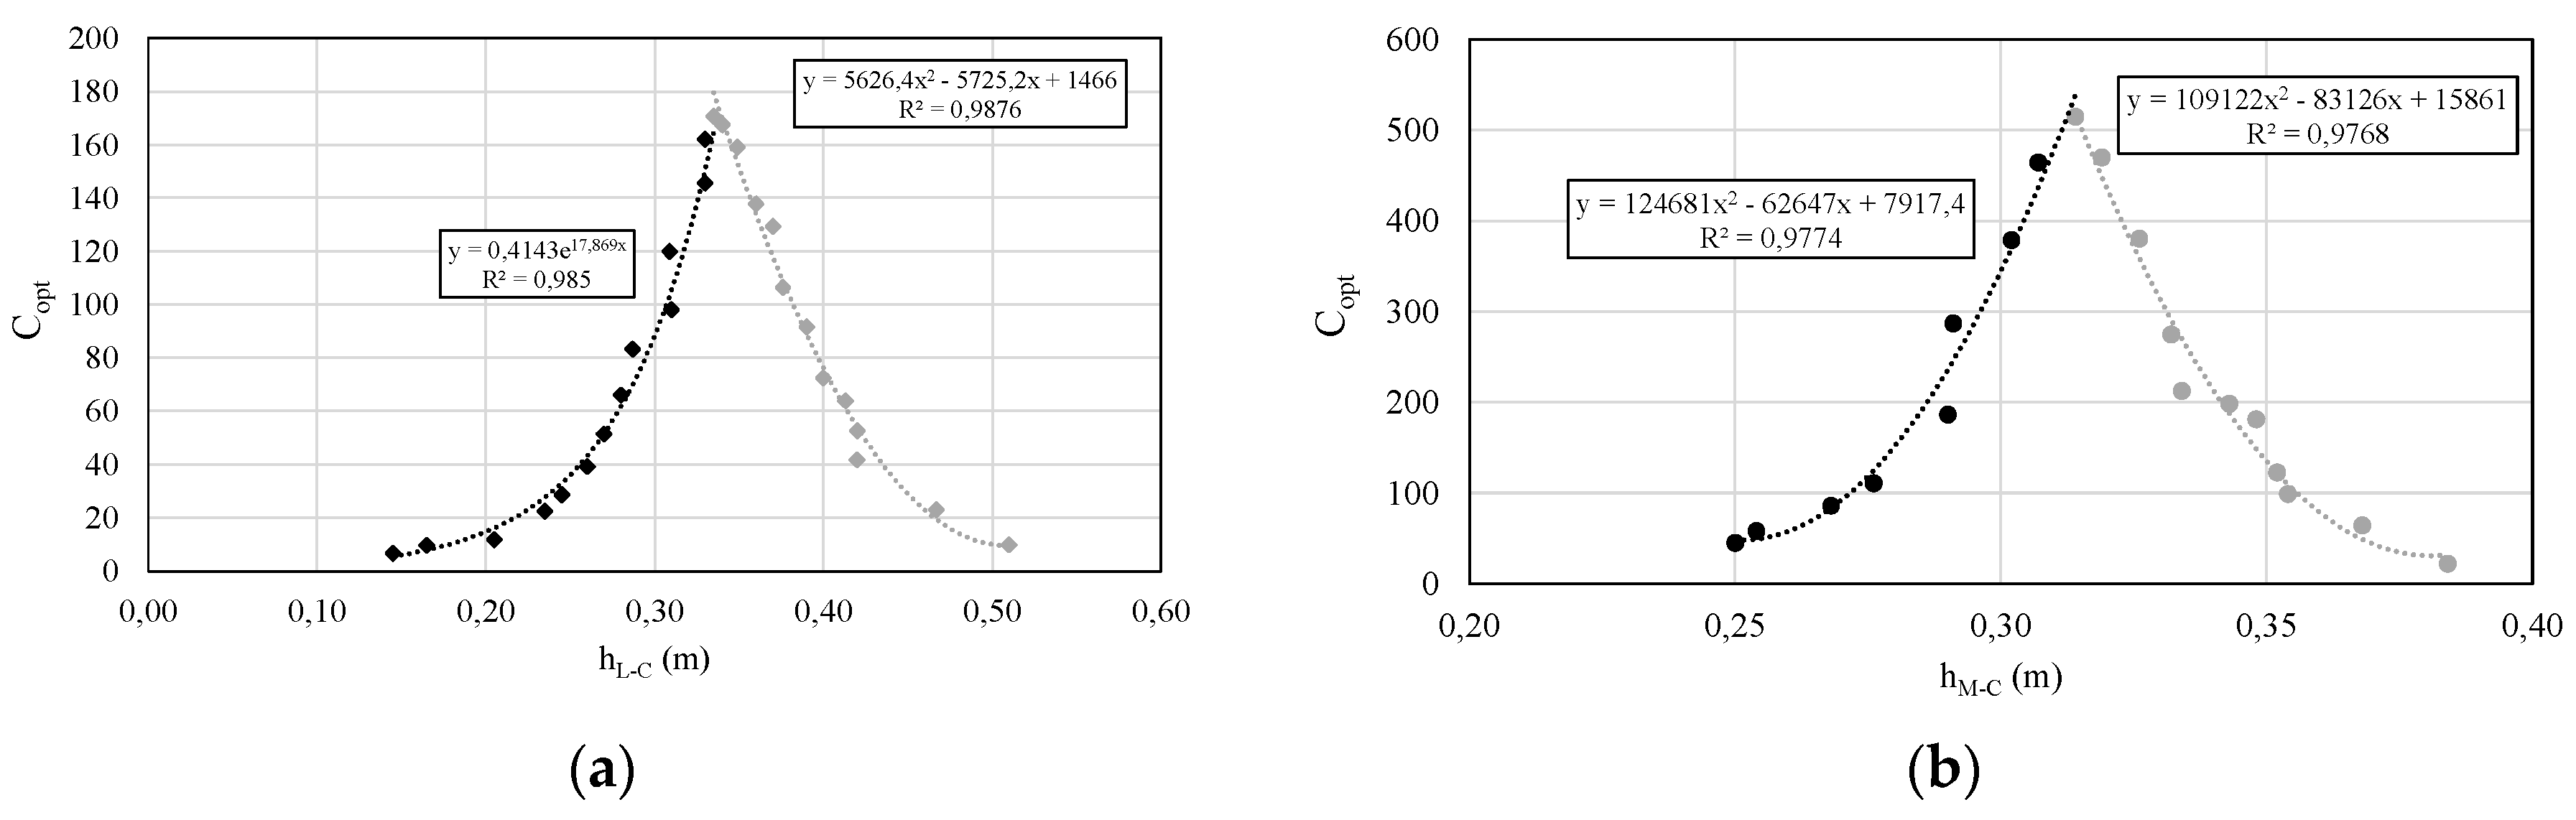
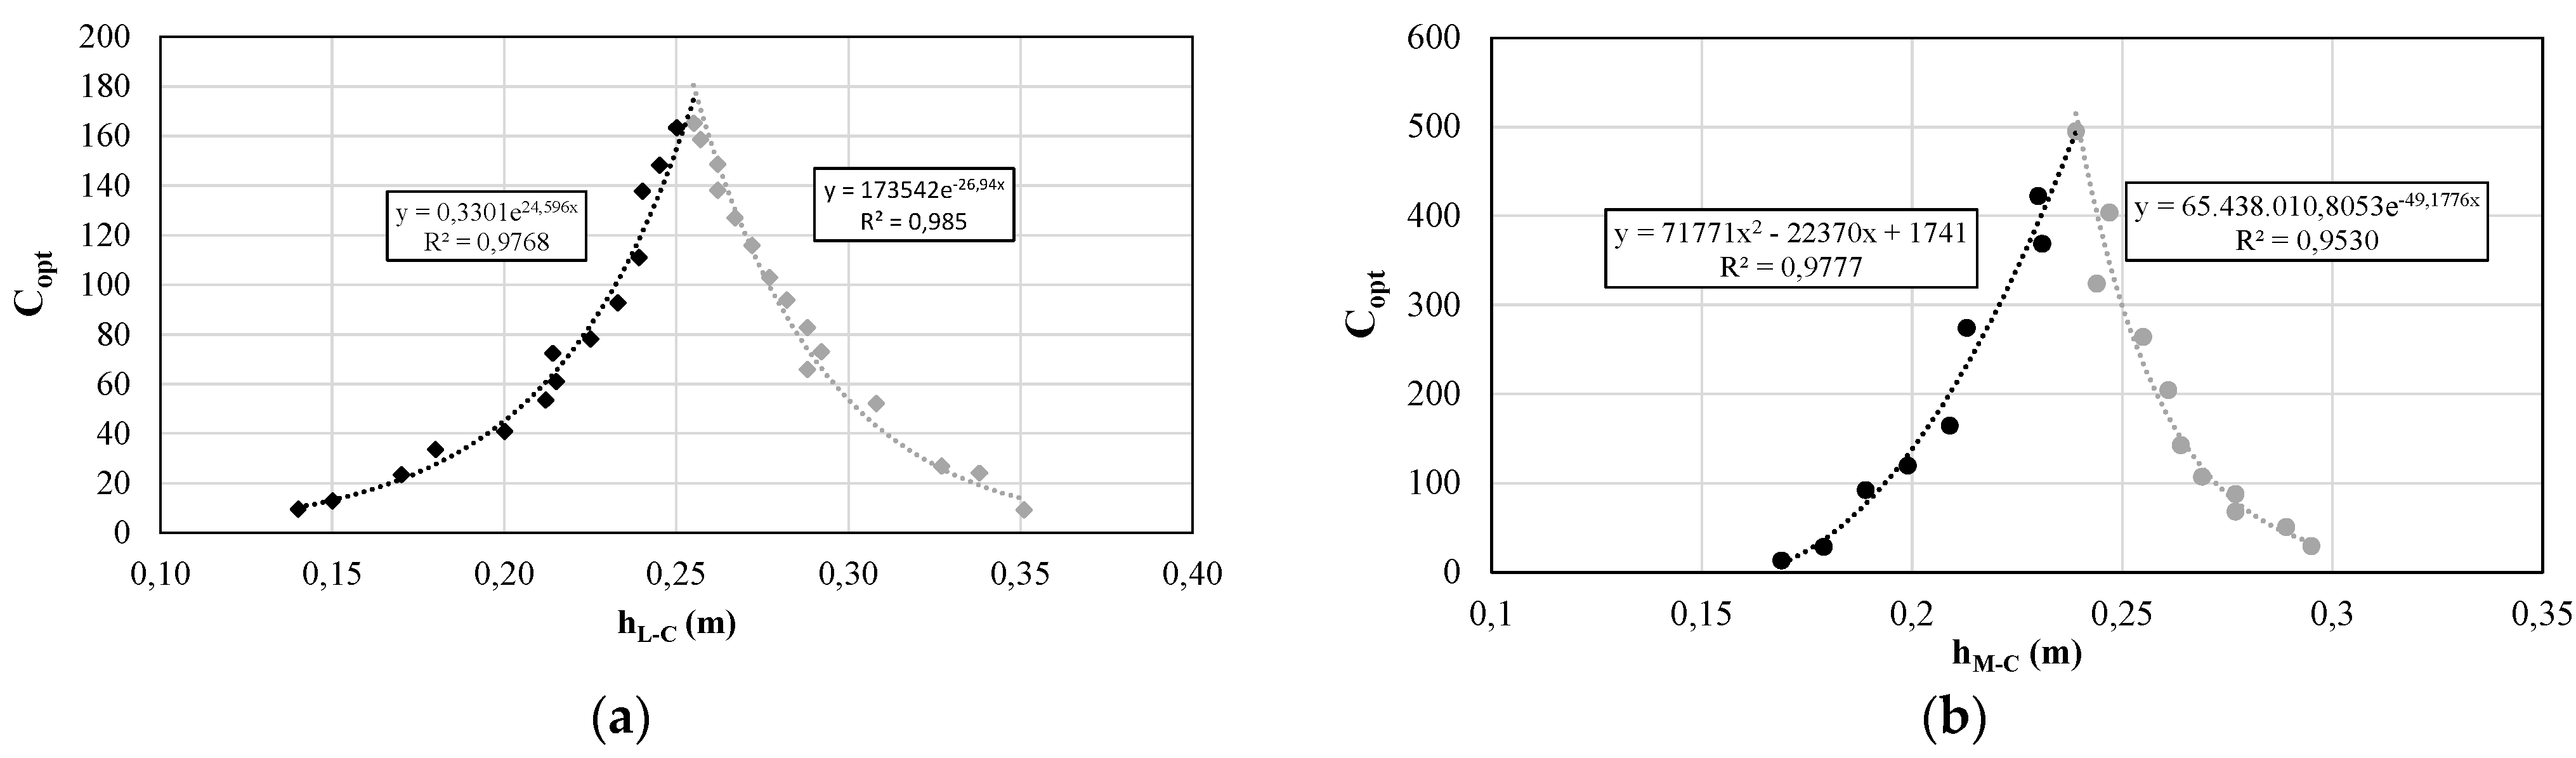
4.1. Optical Comparison

The two optical systems to be compared are both characterized by a diameter of 30 cm and convey the solar radiation on a 10 × 10 mm2 TJ cell. For this they present the same value of C geo equal to 707. Due to several losses, not all the solar radiation incident on the concentrator reaches the TJ solar cell. The optical concentration factor and optical efficiency values depend on the distance between primary optics and receiver and on the presence of a secondary optics.
In Figure 3, the trends of C opt as a function of h L C (a) and h M C (b) when a secondary optics is used are reported. It can be observed that in the first range of distance, C opt increases following an exponential trend in the case of the Fresnel lens and a parabolic trend as for the spherical mirror. However, the values of C opt reached with the Fresnel lens are much lower than the spherical mirror with maximum values equal respectively to 171 and 515. After reached its peak, C opt decreases with a parabolic trend in both cases.
The secondary optics absence does not significantly affect the trends of C opt in the first range of distance. In fact, they remain the same as the previous case, even if the values reached by C opt are slightly lower, with maximum values equal to 165 and 495 respectively. On the contrary, for values of distance higher than the proper focal length, the secondary optics absence leads to a more rapid decay in the optical performance which becomes exponential both for Fresnel lens and spherical mirror (Figure 4).
The coefficients values of the experimental equations describing the trends of C opt   are reported in Table 2 and Table 3 respectively for Fresnel lens and spherical mirror with and without secondary optics.
From Equation (2) it is clear that η opt and C opt present the same trends. In Figure 5 the maximum values of η opt for each optical system, also in the presence of secondary optics, are reported. It is possible to reach with the spherical mirror values of η opt of about 73% with a secondary optics, while the maximum value with the Fresnel lens is equal to about 24%.
The trends reported in Figure 3 and Figure 4 have shown that it is necessary to accurately set the distance between primary optics and receiver to maximize the optical performance. This aspect is clearer in Figure 6, where the percentual reduction of C opt as function of the percentual deviation of h L C and h M C respectively from their optimal value is shown both for Fresnel lens (a) and spherical mirror (b). These trends refer to the optical systems that present secondary optics. They have been plotted for values of h L C and h M C both higher and lower than their respective optimal value. As shown, the decay in the optical performance is much more marked for the spherical mirror (b), for which a deviation of h M C of 6.8% and 20% from h M C , max cause a decrease of C opt of about 50% and 90% respectively. On the other hand, in the case of the Fresnel lens (a), it is necessary a deviation of h L C of about 40% to reduce C opt of 90%.
It is also interesting to analyze the reduction over time of C opt in the case of solar-tracking failure. The results of this analysis, performed for Fresnel lens (a) and spherical mirror (b), are shown in Figure 7 and Figure 8 respectively for the cases with and without the secondary optics. This analysis has been performed for three different values of h L C and h M C : the optimal value and the two values, respectively higher and lower, for which C opt is halved with respect to the maximum value. As shown in Figure 7, the three trends are similar for the two optical systems, even if in the case of the mirror the time necessary for the C opt zeroing is slightly longer. It should be noted that for values of the distance lower than the optimal value, the spot of light incident on the receiver is larger than the other two cases; so, it is necessary more time for C opt to reach zero.
The presence of secondary optics is fundamental to homogenize the solar radiation incident on the receiver. Hence, its absence (Figure 8) leads to shorter times necessary for C opt to reach zero. In correspondence of the optimal value of distance, with the Fresnel lens this time is equal to 870 s with the secondary optics and to only 750 s in absence of a secondary optics. The same times are equal respectively to 1040 s and 600 s for the spherical mirror. Hence, the influence of the secondary optics is more evident for the spherical mirror since it leads to a much less rapid decay in concentration over time.
To make these trends more comparable, it should be useful to analyze the percentual reduction over time of C opt for the different values of h L C and h M C previously analyzed. This analysis, for Fresnel lens (a) and spherical mirror (b), is shown in Figure 9 and Figure 10 for the cases with and without secondary optics respectively.
An important parameter for the evaluation of the accuracy that each optics requires for the CPV solar tracker to avoid significant power losses is the acceptance angle (θ). The acceptance angle can be found studying the percentual reduction of C opt as function of the misalignment angle ( θ mis ) between the sun direction and the normal to each concentrator. The results of such analysis are shown in Figure 11 in the cases with (a) and without (b) secondary optics. From the trends shown it is easy to determine the acceptance angle which, with the secondary optics, is equal to 0.37° for the Fresnel lens and to 0.79° for the spherical mirror. These values decrease to 0.27° and 0.75° respectively in absence of secondary optics. In both the cases (a) and (b), the spherical mirror presents higher values of the acceptance angle; this means that it requires a lower accurate solar tracker with respect to the Fresnel lens. Moreover, it can be noted that for both the optics, in correspondence of a misalignment angle of about 3.4° in the case (a) and about 3.0° in the case (b), the solar radiation concentrated on the receiver would be reduced of more than 90%.
The comparative optical analysis between Fresnel lens and spherical mirror has been performed to evidence the different values of C opt achievable and the concentration levels reduction in the case of a solar-tracking failure, also in absence of a secondary optics. Moreover, the acceptance angle of each optical system has been determined to estimate the accuracy that each optics requires for the CPV solar tracker to avoid high power losses.

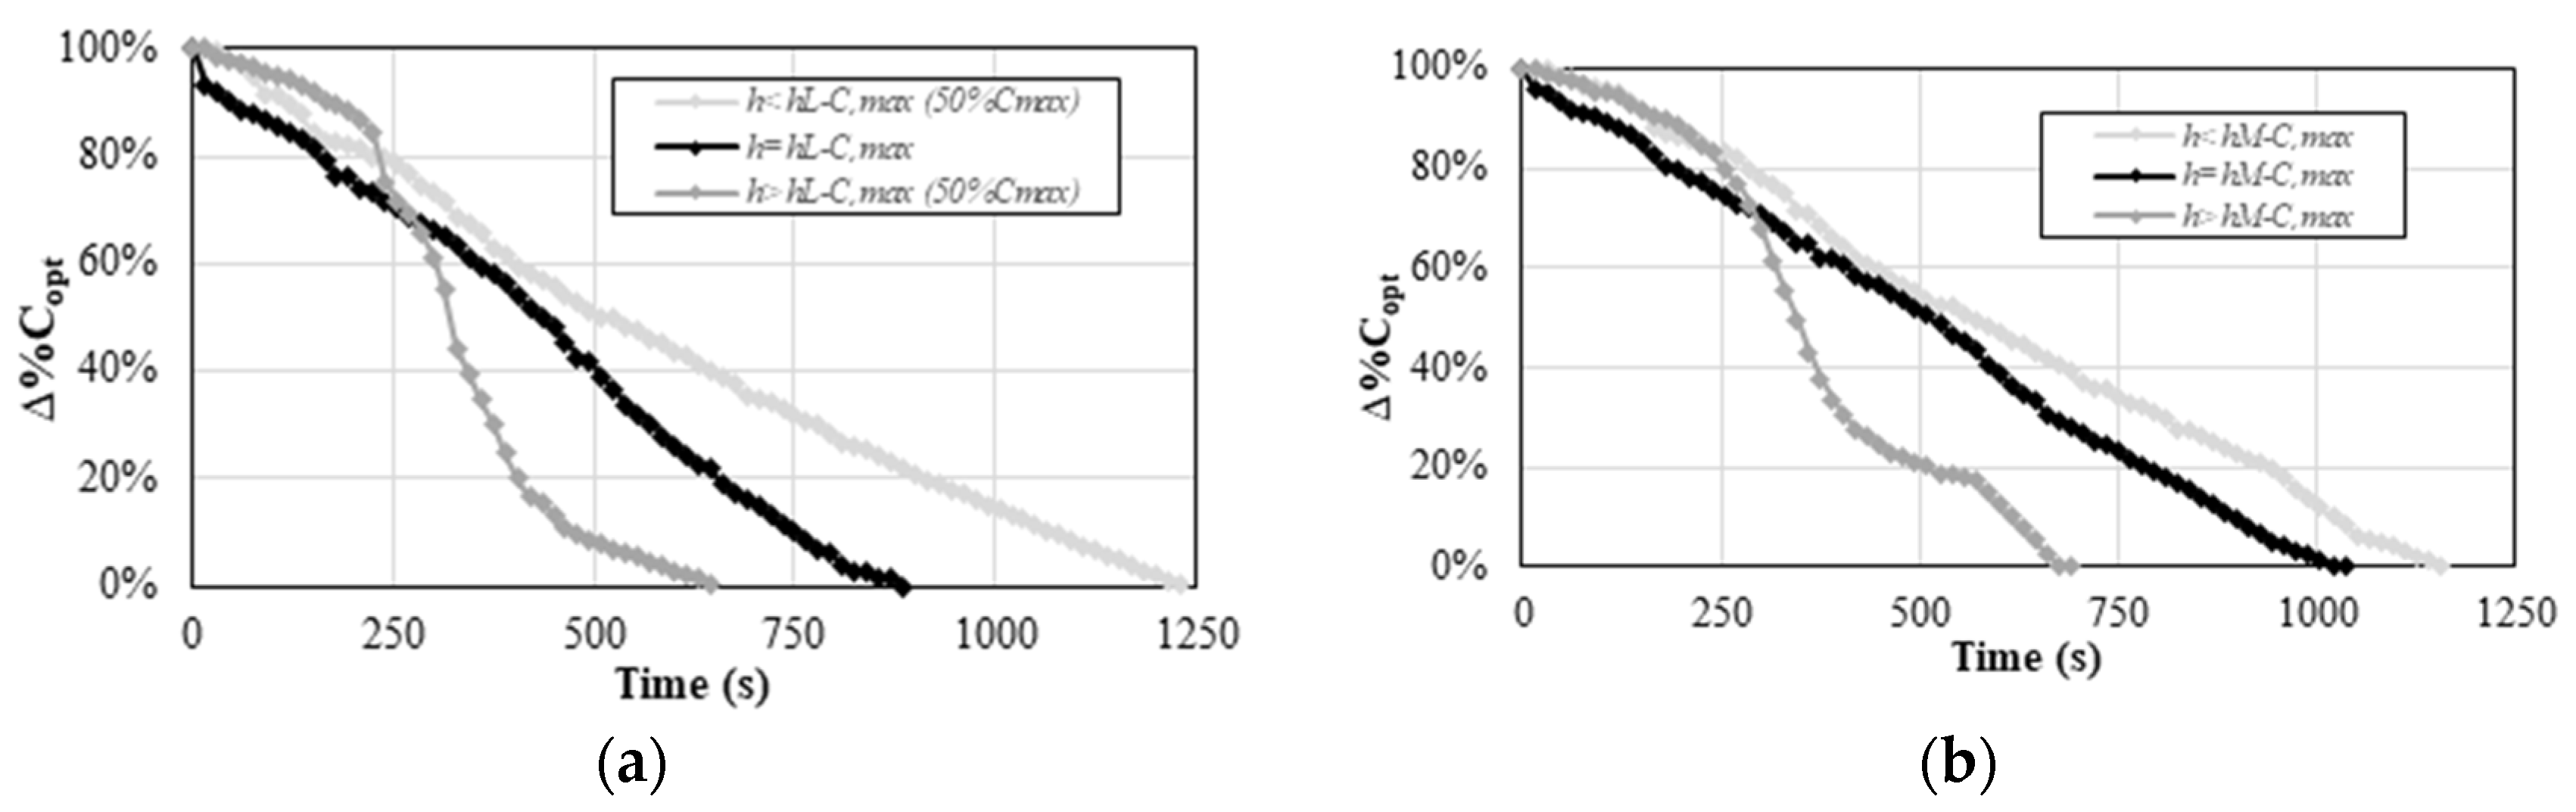
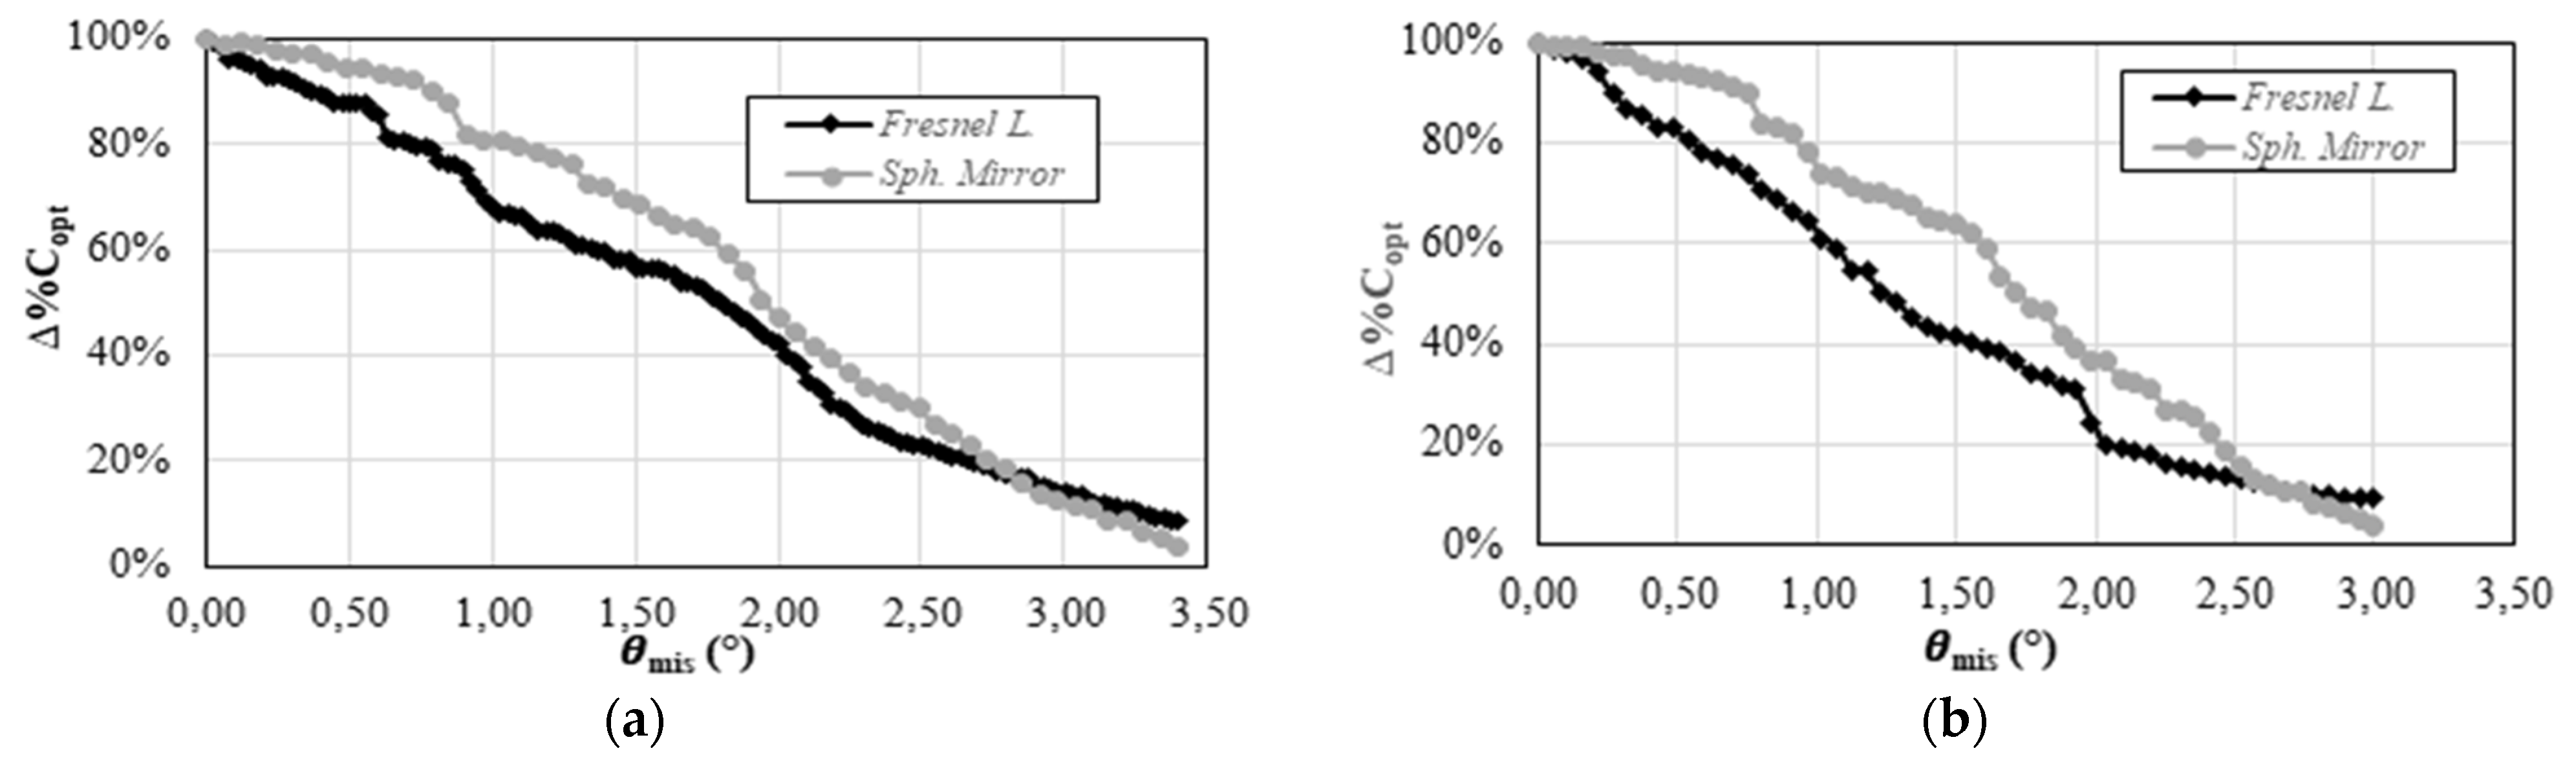
4.2. Energy Comparison

In this section, the two optical systems analyzed are compared from an energy point of view. As for the thermal aspects, the TJ cell temperature ( T c ) increase under concentration has been evaluated. In Figure 12, the increase of T c compared to the environmental temperature ( T env ), when the concentrated radiation ( R c ) incident on the TJ cell varies, is shown in correspondence of the two optical systems analyzed. It can be observed that this increase is logarithmical for both the optical systems. Up to a value of R c of about 160 kW/m2, which is the maximum achievable by means of the Fresnel lens, the two trends are very similar and T c can reach a value of about 40.0 °C higher than T env . The spherical mirror allows the reaching of higher values of concentration, and then Tc values up to 65.0 °C higher than T env for a R c equal to about 470 kW/m2.
These relationships are useful to evaluate the electrical and thermal performance of a CPV system. In fact, T c highly affects the TJ cell electrical efficiency and then the CPV system electrical producibility [26]. Moreover, if an active cooling system is adopted, it is possible to also evaluate the cogeneration opportunities of these systems (CPV/T system) that are strictly dependent on the temperature of the recovered thermal energy.
From an electrical point of view, the increase of the TJ cell electrical power ( P el , c ) with R c has been analyzed for both the optics. As shown in Figure 13, P el , c increases almost linearly with R c . In the range of R c common to the two optics, the trends of P el , c are almost coincident, with a maximum value of P el , c for the Fresnel lens equal to 5.1 W in correspondence of a concentrated radiation of about 160 kW/m2. On the contrary, the spherical mirror allows the reaching of a concentrated solar radiation of about 470 kW/m2 on the TJ cell, with a maximum electrical power of about 15 W. It can be noted that these data refer to thermal regime conditions, so the registered value of P el , c keeps into account the decrease of the electrical efficiency due to the temperature. The coefficients values of the experimental equations describing the trends of T c and P el , c are reported in Table 4 for Fresnel lens and spherical mirror.
Finally, the deviation between the cumulative electric energy produced by the TJ cell in the case of correct and incorrect solar tracking has been also evaluated in correspondence of each optical system. The results are shown in Figure 14, where the cumulative electric energy produced by the TJ cell in a time range of 1200 s, in correspondence of correct and incorrect solar tracking for both the optics and the configurations with (a) and without (b) secondary optics, is shown. In this analysis, the distance between each optical system and the TJ cell has been set to its optimal value with a DNI value equal to about 900 W/m2. As shown in Figure 14, there is a high discrepancy between the TJ cell electrical producibility in the two cases of correct and incorrect solar tracking, especially in absence of a secondary optics. As for the Fresnel lens, a solar-tracking failure leads to a decrease of the electrical producibility of 65.1% if a secondary optics is adopted (a) and of 75.4% in the opposite case (b). For the spherical mirror, the reduction is lower and equal to 58.6% in the case (a) and to 68.7% in the case (b).

5. Conclusions

The main aim of this paper has been to compare, from an optical and energy point of view, a spherical mirror and a commonly used Fresnel lens of the same diameter adopted as point-focus primary optics in a CPV system. From an optical point of view, the absolute and percentual variation trends of C opt and η opt as a function of the distance between each optical system and the receiver have been experimentally analyzed. Even if with different trends, C opt increases with the primary optics-receiver distance and, after reached its peak equal to 515 and 171 for the spherical mirror and the Fresnel lens respectively, decreases in parabolic way when a secondary optics is adopted and in an exponential way in the opposite case. The trend of η opt are the same of C opt , with maximum values of 73% and 24% for mirror and lens respectively. As for the spherical mirror, a deviation from the optimal distance of 20% can cause a reduction of C opt of 90%. The absolute and percentual reduction over time of C opt in the case of a solar-tracking failure has been also analyzed for different values of the primary optics-receiver distance. In the case of the mirror the time necessary for the C opt zeroing is slightly longer, especially in the presence of a secondary optics. The spherical mirror also presents the advantage of a higher acceptance angle (θ) with respect to the lens, equal to 0.79° and 0.37° respectively, in the presence of a secondary optics and to 0.27° and 0.75° respectively without it. Hence, it requires a lower accurate solar tracker with respect to the Fresnel lens. The energy comparison has been made from an electrical a thermal point of view, by analyzing the trends of TJ cell temperature and electrical power, logarithm, and linear respectively, as function of the concentrated radiation incident on it. The different values of R c achievable with each optical system, of about 470 kW/m2 and 160 kW/m2 with the mirror and the lens respectively, allow the reaching of values of P el , c of 15 W and 5.1 W and to increase T c up to 65.0 °C and 40.0 °C higher than T env , respectively. Finally, the deviation between the cumulative electric energy produced by the TJ cell in the case of correct and incorrect solar tracking has been also evaluated for both the optics in correspondence of the optimal distance between each optical system and TJ cell. Results have shown a high discrepancy between the TJ cell electrical producibility in the two cases of correct and incorrect solar tracking, especially in absence of secondary optics. As for the Fresnel lens, a solar-tracking failure leads to an electrical producibility decrease of 65.1%, if a secondary optics is used, and 75.4% in the opposite case. For the spherical optics, the reduction is slightly lower and equal to 58.6% and 68.7% respectively. The results can be used to design a point-focus CPV system which uses a spherical mirror or a Fresnel lens in similar operation conditions.

Funding

The research received no external funding.

Institutional Review Board Statement

Not applicable.

Informed Consent Statement

Not applicable.

Data Availability Statement

Not applicable.

Conflicts of Interest

The author declares no conflict of interest.

Abbreviation

Aarea (m2)
Cgeogeometrical concentration factor
Coptoptical concentration factor
CPVConcentrating Photovoltaic system
CPV/TConcentrating Photovoltaic and Thermal system
DNIDirect Normal Irradiance (W/m2)
hL-CFresnel lens-TJ cell distance (m)
hM-Cspherical mirror–TJ cell distance (m)
Pelectric power (W)
Rcconcentrated solar radiation (kW/m2)
Ttemperature (°C)
TJ Triple-Junction cell
η efficiency
θangle (°)
Subscripts
ccell
concconcentrator
elelectric
envenvironmental
mismisalignment
optoptical

References

  1. Kandilli, C. Performance analysis of a novel concentrating photovoltaic combined system. Energy Convers. Manag. 2013, 67, 186–196. [Google Scholar] [CrossRef]
  2. Chen, S.X.; Gooi, H.B.; Wang, M.Q. Solar radiation forecast based on fuzzy logic and neural networks. Renew. Energy 2013, 60, 195–201. [Google Scholar] [CrossRef]
  3. Renno, C. Theoretical and experimental evaluation of the working fluid temperature levels in a CPV/T system. Energies 2020, 166, 3077. [Google Scholar] [CrossRef]
  4. Bellos, E.; Tzivanidis, C.; Antonopoulos, K.A.; Gkinis, G. Thermal enhancement of solar parabolic trough collectors by using nanofluids and converging-diverging absorber tube. Renew. Energy 2016, 94, 213–222. [Google Scholar] [CrossRef]
  5. Rejeb, O.; Shittu, S.; Ghenai, C.; Li, G.; Zhao, X.; Bettayeb, M. Optimization and performance analysis of a solar concentrated photovoltaic-thermoelectric (CPV-TE) hybrid system. Renew. Energy 2020, 152, 1342–1353. [Google Scholar] [CrossRef]
  6. Garcia-Domingo, B.; Piliougine, M.; Elizondo, D.; Aguilera, J. CPV module electric characterisation by artificial neural networks. Renew. Energy 2015, 78, 173–181. [Google Scholar] [CrossRef]
  7. Theristis, M.; Fernández, E.F.; Almonacid, F.; Georghiou, G.E. Spectral correction of CPV modules equipped with GaInP/GaInAs/Ge solar cells and fresnel lenses. Appl. Sci. 2017, 7, 842. [Google Scholar] [CrossRef] [Green Version]
  8. Shanks, K.; Senthilarasu, S.; Tapas, K. Mallick. Optics for concentrating photovoltaics: Trends, limits and opportunities for materials and design. Renew. Sustain. Energy Rev. 2016, 60, 394–407. [Google Scholar] [CrossRef] [Green Version]
  9. Renno, C. Optimization of a concentrating photovoltaic thermal (CPV/T) system used for a domestic application. Appl. Therm. Eng. 2014, 67, 396–408. [Google Scholar] [CrossRef]
  10. Serrano-Aguilera, J.J.; Valenzuela, L.; Fernandez-Reche, J. Inverse Monte Carlo Ray-Tracing method (IMCRT) applied to line-focus reflectors. Sol. Energy 2016, 124, 84–197. [Google Scholar] [CrossRef]
  11. Tien, N.X.; Shin, S. A novel concentrator photovoltaic (CPV) system with the improvement of irradiance uniformity and the capturing of diffuse solar radiation. Appl. Sci. 2016, 6, 251. [Google Scholar] [CrossRef] [Green Version]
  12. Enteria, N.; Akbarzadeh, A. Solar Energy Sciences and Engineering Applications; CRC Press: Boca Raton, FL, USA, 2014; pp. 545–788. [Google Scholar] [CrossRef]
  13. Renno, C.; Landi, G.; Petito, F.; Neitzert, H.C. Influence of a degraded triple-junction solar cell on the CPV system performances. Energy Convers. Manag. 2018, 160, 326–340. [Google Scholar] [CrossRef]
  14. Renno, C.; Petito, F.; Landi, G.; Neitzert, H.C. Experimental characterization of a concentrating photovoltaic system varying the light concentration. Energy Convers. Manag. 2017, 138, 119–130. [Google Scholar] [CrossRef]
  15. Victoria, M.; Askins, S.; Herrero, R.; Antón, I.; Sala, G. Assessment of the optical efficiency of a primary lens to be used in a CPV system. Sol. Energy 2016, 134, 406–415. [Google Scholar] [CrossRef] [Green Version]
  16. Soni, M.S.; Gakkhar, N. Techno-economic parametric assessment of solar power in India: A survey. Renew Sustain. Energy Rev. 2014, 40, 326–334. [Google Scholar] [CrossRef]
  17. Burhan, M.; Shahzad, M.W.; Ng, K.C. Long-term performance potential of concentrated photovoltaic (CPV) systems. Energy Convers. Manag. 2017, 148, 90–99. [Google Scholar] [CrossRef]
  18. Kim, Y.; Jeong, H.J.; Kim, W.; Chun, W.; Han, H.J.; Lim, S.H. A comparative performance analysis on daylighting for two different types of solar concentrators: Dish vs. Fresnel lens. Energy 2017, 137, 449–456. [Google Scholar] [CrossRef]
  19. Pan, X.; Ju, X.; Xu, C.; Du, X.; Yang, Y. A novel rotational symmetry (RS) connection approach for dense-array concentrator photovoltaic (DA-CPV) modules. Energy Convers. Manag. 2019, 181, 359–371. [Google Scholar] [CrossRef]
  20. Lokeswaran, S.; Mallick, T.K.; Reddy, K.S. Design and analysis of dense array CPV receiver for square parabolic dish system with CPC array as secondary concentrator. Sol. Energy 2020, 199, 782–795. [Google Scholar] [CrossRef]
  21. Renno, C. Experimental and Theoretical Analysis of a Linear Focus CPV/T System for Cogeneration Purposes. Energies 2018, 11, 2960. [Google Scholar] [CrossRef] [Green Version]
  22. Widyolar, B.; Jiang, L.; Abdelhamid, M.; Winston, R. Design and modeling of a spectrum-splitting hybrid CSP-CPV parabolic trough using two-stage high concentration optics and dual junction InGaP/GaAs solar cells. Sol. Energy 2018, 165, 75–84. [Google Scholar] [CrossRef]
  23. Renno, C.; D’Agostino, D.; Minichiello, F.; Petito, F.; Balen, I. Performance analysis of a CPV/T-DC integrated system adopted for the energy requirements of a supermarket. Appl. Therm. Eng. 2019, 149, 231–248. [Google Scholar] [CrossRef]
  24. Hornung, T.; Steiner, M.; Nitz, P. Estimation of the influence of Fresnel lens temperature on energy generation of a concentrator photovoltaic system. Sol. Energy Mater. Sol. Cells 2012, 99, 333–338. [Google Scholar] [CrossRef]
  25. Aprea, C.; Renno, C. An air cooled tube-fin evaporator model for an expansion valve control law. Math. Comput. Model. 1999, 30, 135–146. [Google Scholar] [CrossRef]
  26. Renno, C.; Petito, F. Triple-junction cell temperature evaluation in a CPV system by means of a Random-Forest model. Energy Convers. Manag. 2018, 169, 124–136. [Google Scholar] [CrossRef]
Figure 1. Photo of the experimental CPV system: CPV system with Fresnel lens and spherical mirror (a), detail of the spherical mirror (b).
Energies 14 04603 g001
Figure 2. Plant scheme with measurement instruments: TJ cell (a) and thermal power sensor (b).
Energies 14 04603 g002
Figure 3. Trends of C opt as function of the distance between optics and receiver in the case of Fresnel lens (a) and spherical mirror (b) in the presence of secondary optics.
Energies 14 04603 g003
Figure 4. Trends of C opt as a function of the distance between optics and receiver in the case of Fresnel lens (a) and spherical mirror (b) in absence of secondary optics.
Energies 14 04603 g004
Figure 5. Maximum values of η opt with and without secondary optics for Fresnel lens and spherical mirror.
Energies 14 04603 g005
Figure 6. Percentual reduction of C opt as function of the percentual deviation of h L C and h M C respectively from their optimal value in the case of Fresnel lens (a) and spherical mirror (b) in the presence of secondary optics.
Energies 14 04603 g006
Figure 7. Reduction over time of C opt for different values of h L C and h M C respectively in the case of Fresnel lens (a) and spherical mirror (b) in the presence of secondary optics.
Energies 14 04603 g007
Figure 8. Reduction over time of C opt for different values of h L C and h M C respectively in the case of Fresnel lens (a) and spherical mirror (b) in absence of secondary optics.
Energies 14 04603 g008
Figure 9. Percentual reduction over time of C opt for different values of h L C and h M C respectively in the case of Fresnel lens (a) and spherical mirror (b) in the presence of secondary optics.
Energies 14 04603 g009
Figure 10. Percentual reduction over time of C opt for different values of h L C and h M C respectively in the case of Fresnel lens (a) and spherical mirror (b) in absence of secondary optics.
Energies 14 04603 g010
Figure 11. Percentual reduction of Copt as a function of the misalignment angle ( θ mis ) for Fresnel lens and spherical mirror in the cases with (a) and without (b) secondary optics.
Energies 14 04603 g011
Figure 12. Increase of the TJ cell temperature as a function of the concentrated solar radiation ( R c ) for the two optics.
Energies 14 04603 g012
Figure 13. Increase of the TJ cell electrical power as a function of the concentrated solar radiation ( R c ) for the two optics.
Energies 14 04603 g013
Figure 14. Cumulative electrical energy produced in the cases of correct and incorrect solar tracking for the two optics in the cases with (a) and without (b) secondary optics.
Energies 14 04603 g014
Table 1. Parameters of the Triple-Junction cell.
ParameterValue
materialInGaP/InGaAs/Ge
size0.01 m × 0.01 m
open circuit voltage (at 25 °C, 50 W/cm2)2.94 V
short circuit current (at 25 °C, 50 W/cm2)4.49 A
η r (at 25 °C, 50 W/cm2)39.0%
temperature coefficient ( σ t )−0.04%/K
Table 2. Values of the coefficients of the experimental equations describing the trends of Copt for the Fresnel lens.
CaseSecondary Optics A B C D E
h L C < h L C , max yes0.41430.1787//////0.9794
h L C < h L C , max no0.33010.2460//////0.9871
h L C > h L C , max yes////0.5626−57.2514660.9876
h L C > h L C , max no 1.735   · 10 5 −0.2690//////0.9694
Table 3. Values of the coefficients of the experimental equations describing the trends of Copt for the spherical mirror.
Casecondary Optics A B C D E
h M C < h M C , max yes////12.47−626.579170.9774
h M C < h M C , max no////7.902−253.620430.9842
h M C > h M C , max yes////12.22−920.7 1.738 · 10 4 0.9704
h M C > h M C , max no 5.079 · 10 7 −0.4830//////0.9777
Table 4. Values of the coefficients of the experimental equations describing the trends of T c and P el , c for the two optics.
Equation α β γ δ
(7) Fresnel L.14.75−35.05////0.9716
(7) Spherical M.19.05−53.94////0.9606
(8) Fresnel L.////0.03240.03260.9755
(8) Spherical M.////0.0111−0.15280.9891
Publisher’s Note: MDPI stays neutral with regard to jurisdictional claims in published maps and institutional affiliations.

