Abstract
This article presents a proposal for a wireless diagnostic system for checking the air tightness of the ventilation network. The solution is designed to increase crew safety in underground mining plants and increase the energy efficiency of the ventube ventilation system. The system is based on sensors measuring the pressure inside the ventilation duct in relation to the barometric pressure in the immediate vicinity of the duct. The flow of diagnostic data is based on a cascade transfer. The data from the first sensor are transferred successively to the last one. Based on the prior calibration of alarm thresholds in each device, the leakage or factor influencing the increase of air flow resistance is located. The article presents the genesis of the creation and discusses the principle and purpose of the system. In the following chapters, the progress of work related to testing the system in laboratory, industrial, and underground conditions at the Velenje Premogovnik mine (Slovenia) is presented. The authors analyze the test results and indicate the directions of possible further work on improving the system. The proposed leak detection system is based on a network of pressure sensors that communicate with each other to clearly pinpoint the leak location. The system has been designed for operation in underground mining plants with limited space.
1. Introduction
Within the years 2017–2020, KOMAG (Institute of Mining Technology) realized the project under the Coal and Steel Research Fund (RFCS) with the acronym INESI—Increase Efficiency and Safety Improvement—in underground mining transportation routes [1]. The main assumption of the project was to improve material logistics and increase safety by developing an effective system for locating the mining equipment and crew and extending the effective working time of miners by reducing the time of crew transport to significantly distant workings.
As part of the project, threats related to the increased speed of the auxiliary diesel mining transport were identified. Apart from the natural hazards [2], the expected increased emission of harmful gases, resulting from the greater load to the engine driving the suspension monorail was one of other identified threats [3]. The increase in gaseous pollutants negatively affects the quality of the air inhaled by employees, as well as the energy consumption of the entire ventilation system designed for specific working conditions in conditions of dust and/or methane explosion hazard. Ventilation in mines is designed for specific conditions for a given mining area [4]. In the event of increasing the speed of suspended monorails (Figure 1) and thus increasing the emission of harmful substances to the environment, the INESI project objective was to adapt the ventilation system of transport routes to the increased load and to equip it with a wireless leak detection system. The main assumption of the new solution was to increase the efficiency of the system while reducing the energy consumption of the process [5].
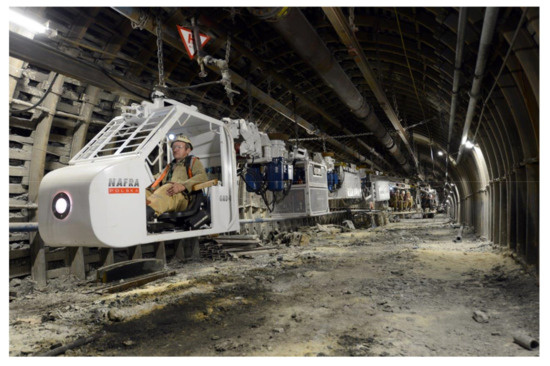
Figure 1.
Suspended monorail transport system for mining [6].
Detailed requirements for ventilation with the use of ducts (ventubes), auxiliary ventilation devices, or by diffusion are specified in the Regulation of the Minister of Energy of 23 November 2016 on detailed requirements for the operation in underground mining plants (Journal of Laws 2017.118) [7]. The auxiliary ventilation system is designed to force the air flow in mine workings [8,9]. The basic system includes a duct fan and duct tube, which is constructed from the sections [10]. The regulation specifies the required minimum speed of the air flowing in the working ventilated with the use of a ventube:
- 0.15 m/s—in non-methane fields or in methane fields of I category of the methane explosion hazard,
- 0.30 m/s—in methane fields II–IV of the methane explosion hazard category.
Figure 2 presents a diagram showing the cooperation of the fan with the duct in the auxiliary ventilation network [11,12]. In the case of a properly selected and operated auxiliary ventilation system [13,14], the curve of the ventilation network resistance (black dotted line) crosses the curve of pressure build-up generated by the fan (red solid line) at the point whose intersection corresponds to the highest efficiency of the device (solid blue line). This point is called the fan’s optimal operating point (green star). Operation close to this point allows for the most effective use of electricity, which directly affects the operating costs of the system.
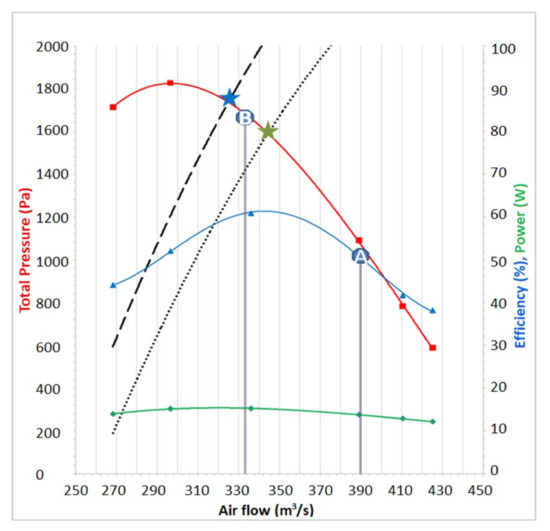
Figure 2.
Cooperation of the fan with the duct in the auxiliary ventilation network.
If the operation of the auxiliary ventilation system is not proper, the network resistance curve (black dashed line) crosses the fan pressure build-up curve (solid red line) at a point (blue star) that is outside the recommended fan performance characteristics (area between points AB). The operation of the fan outside the A–B work area is not recommended due to low energy efficiency [15]. In addition, an operation on the left side of the fan curve (before point B in the diagram) may cause unstable fan operation (stall). A stall is undesirable due to air streams breaking off from the surface of the fan impeller blade, causing strong vibrations of the assembly and increasing the intensity of the generated noise. In extreme cases, the stall can lead to a destruction of the fan. The main factors that may affect the incorrect cooperation of the fan with the duct are the following [16]:
- Incorrectly selected fan to the resistance curve of the planned auxiliary ventilation installation,
- Incorrectly calculated resistance curve of the planned auxiliary ventilation system,
- Incorrectly implemented auxiliary ventilation installation,
- Leakage along the duct.
For the first three factors, the problem lies in the design and commissioning phase of the auxiliary ventilation system [17,18]. In the day-to-day operation of the system, maintenance is limited to routine checks to determine the overall efficiency of the system [19]. With the subsequent months of operation of the ventilation system along the duct, leaks that are difficult to identify may appear, which are caused by unsealing of the system e.g., by tearing off the material or by the system unsealing of at the connection point of the duct sections [20].
As it can be seen in the diagram, the pressure demand of the network increases with appearance of leaks, while the volume of flowing air decreases. The point of co-operation of the duct with the fan, which is marked with a green star, shifted to the left side of the characteristic to a new point (blue star), exceeding the lower limit of the recommended fan operation point (point B) and leading to the stall operation of the device.
Currently, in the case of underground mining workings, longer and longer auxiliary ventilation systems are used, with the length of up to 7000 m [21]. Three types of ventilation systems can be distinguished, depending on the type of pressure inside the duct, where the following apply:
- Fresh air (overpressure) is forced through the duct to the face of the working,
- Used air (negative pressure) is sucked from the face of the workings through the air duct, and the negative pressure in the working causes the effect of drawing fresh air through the entire cross-section of the working toward its face,
- At the same time, fresh and used air are pumped and sucked by two separate ducts.
Leaks, caused by prolonged or improper use of the ventilation system, are often the reason for the decrease in its efficiency. Various monitoring systems have been implemented; however, they focus mainly on monitoring the effectiveness of ventilation. The authors in [22] tried to identify research problems related to ventilation systems, focusing on air flow monitoring, simulation, and control of the ventilation network using IoT, but monitoring the air tightness was not mentioned. Leak detection itself is discussed in the literature [23,24]. Despite the fact that these solutions relate strictly to water and gases, the interesting solutions using neural networks are presented.
Control of the air separation process in mines according to energy-efficiency criteria is an important aspect in the ventilation systems [25,26]. The authors discuss examples of the implementation of automatic control systems for coal mining in Russia and around the world, with an overview of the main strategies of the ventilation management. The minimization of energy consumption is achieved thanks to the most effective selection of the fan rotational speed and the speed of opening the ventilation doors, as well as by controlling the air distribution and introducing partial air recirculation systems. The tightness of the duct and thus the lack of air and electricity losses is the basis for the proper operation of this type of control systems.
The solution, proposed in the INESI project, is to monitor the air pressure inside the duct and inform about the possible leak and its location using the light messages. The solution eliminates the need to use the oversized power of the auxiliary ventilation system and has a positive effect on the energy consumption of the ventilation system.
Due to the significant ventilation duct lengths, it was decided to use wireless sensors. The downside of this type of sensor is the limited battery life and the high cost of battery replacement. A solution to this problem may be to collect the energy available in a given environment and convert it into electricity. Self-powered sensors are becoming increasingly popular in systems for monitoring technical parameters. Depending on the generator design, self-powered sensors can be powered by light, heat, gas flow, rotational motion, electromagnetic field, mechanical vibrations, etc. [27,28]. The solution presented in this paper is based on the use of a wind generator, converting the energy of a flowing air stream into electrical energy. Similar solutions have already been presented in the literature [29,30], where the authors designed and tested an autonomous self-powered sensor, drawing energy from the flowing air. In mining, energy recovery is a difficult issue due to ATEX directive restrictions [31]. There are solutions of self-powered sensors dedicated to mining, but they mainly use a small amount of energy, coming from vibrations, by means of piezoelectric transducers [32,33]. In the hardware model of the solder leakage sensor, proprietary protections have been applied, allowing to meet the requirements of the ATEX directive.
2. Materials and Methods
The developed leak detection system is based on a measuring cascade (Figure 3) consisting of pressure sensors (measuring static pressure, total pressure, and the resulting dynamic pressure in relation to the barometric pressure in the working) communicating wirelessly with each other. The distance between sensors (L) should be selected optimally, taking into account several factors, such as the resolution of measuring sections (leak location accuracy), the cost of implementing the monitoring system, and the wireless communication range.
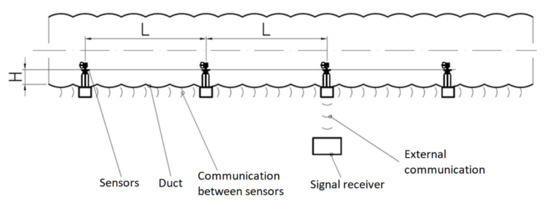
Figure 3.
The concept of a ventilation leak detection system.
Based on the knowledge of the pressures measured with the Prandtl probe (Figure 4, point 6), total and static pressure, it is possible to determine the dynamic pressure, which is the difference between the total and static pressure.
where
Pc = Ps + Pd (Pa)
Pd = Pc − Ps (Pa)
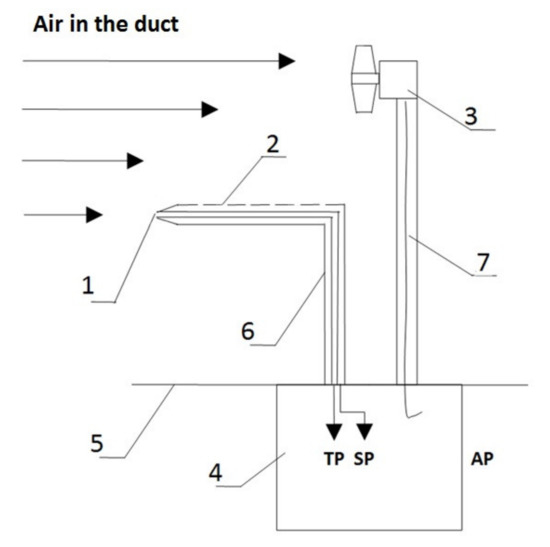
Figure 4.
Simplified diagram of the measuring module: 1—inner channel of the Prandtl tube, 2—the opening of the outer Prandtl tube, 3—turbine with a power generator, 4—measuring transducer with a trans receiver module, 5—cable wall, 6—Prandtl measuring tube, 7—electric wire, TP—total pressure, SP—static pressure, AP—atmospheric pressure.
- Ps —static air pressure in the duct,
- Pc—total air pressure in the duct,
- Pd —dynamic air pressure in the duct.
The fluid in the duct is characterized by static pressure and dynamic pressure related to the flow velocity. According to the literature, due to the flow resistance, along the air transportation duct, there is a constant, linear pressure drop in the duct, and in the case of non-linear elements of the duct, such as e.g., bends, there is also a local pressure drop (local flow resistance). Such pressure variability characterizes the proper operation of the duct and the transport of fluid inside it. Any deviation from this characteristic, consisting in a sudden drop in pressure, may indicate leakage. Additionally, the loss of the fluid flow will cause a decrease in the mass flow, and thus also the flow velocity in further sections of the duct.
Based on theoretical calculations, knowing the basic data such as the diameter of the duct, the distance between the sensors, obstacles along the duct, unit resistance of the duct, and using some simplifications assuming the same air density and the same depth of probe anchorage inside the duct, it is possible to estimate the expected pressure drop ∆p inside the straight section of the duct.
where
- λ—dimensionless, empirical coefficient of friction,
- L—cable length (m),
- D—wire diameter (m),
- w—average flow velocity (m/s),
- ρ—air density (kg/m3).
Knowing the pressure drop between successive sensors theoretically allows determining the threshold, the exceeding of which is an indication of leakage from the duct or increase of local resistance to air flow e.g., by accidental bending of the duct. For practical reasons, each module has a programmable alarm threshold, which is determined individually during the device calibration.
The internal structure of the measuring system is presented in Figure 5. The sensors are powered by the electricity generator (Figure 4, point 3), which converts a part of the mechanical energy of the flux flowing in the duct into electricity, and by an energy storage component, which can supply power when a turbine of the generator fails. Electricity parameters are monitored by a microcontroller using the voltage and current converters. Pressure in the accumulating tubes is measured by two pressure transducers, from which the information is sent to the microcontroller, and then via the wireless communication module to the other sensors and the external system of visualization and archiving the measurement data. The prototype of the device is shown in Figure 6.
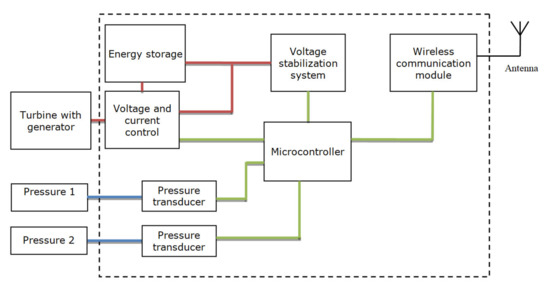
Figure 5.
Block diagram of the measuring system.
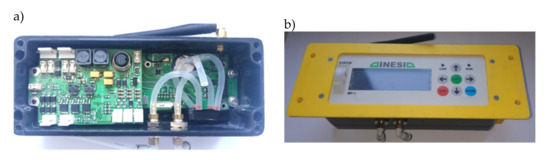
Figure 6.
Measuring device prototype: (a) inside view, (b) front view.
The electronic circuits were designed in compliance with the intrinsically safe principles [34,35]. Due to the limitations related to this, the battery charging circuit of the measuring device uses a charger in the form of an integrated circuit, which enables the Li-Ion battery to be charged with a current of up to 400 mA and at 4.2 V. The measuring device uses batteries Li-Ion with a capacity of 3450 mAh. In normal, continuous operation (without alarm states), the measuring module draws the current of 315–420 mA (depending on the battery charge (3.3–4.2 V). At these parameters, the battery can work for up to 11 h. The use of a turbine enables continuous recharging of the battery.
3. Tests
As a part of the project, the system was tested to verify its correct operation in various conditions: laboratory, industrial, and mining. The tests, carried out at the beginning of the project, show that the used brushless motor, equipped with a printed propeller, is able to supply electricity of power depending on the air flow rate, i.e.,
- 1 W at 13 m/s,
- 2 W at 15 m/s,
- 2.8 W at 17 m/s,
- 3.6 W at 20 m/s.
After positive tests regarding battery charging and communication range, the entire system was tested on a test stand under industrial conditions. The stand was built of 5 m and 10 m sections of reinforced flexible ventilation ducts connected to the WLE 1013B axial fan with the power of 37 kW. Measurement modules were installed along the duct. The first measuring module was installed in the connector (Figure 7), 10 m behind the fan (after stabilize the air stream). Successive measurement modules (2–5) were mounted at equal distances—20 m from the previous module. Unsealing points (I–IV) were located in the remaining connectors at equal distances between the measuring modules. The duct outlet was located 5 m after the last measuring module (Figure 8).
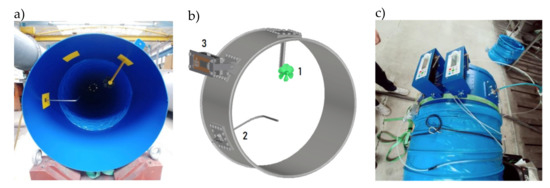
Figure 7.
Measuring device installed in the connector: (a) view of the test model, (b) 3D model view (1—supplying module, 2—Prandtl probe, 3—measuring module), (c) view of measuring devices.
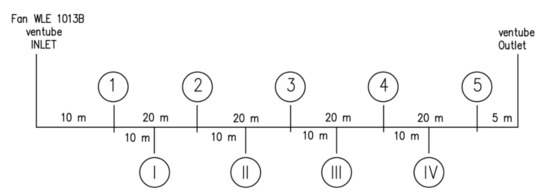
Figure 8.
Arrangement of connectors on the station—stage 2.
The tests were carried out according to two programs. The first one consisted of the periodic unsealing and sealing of subsequent connectors along the entire length of the duct. During the other testing program, successive connectors were unsealed on the duct (simulating increasing leaks), and then, subsequent connectors were sealed in the reverse order. The proposed testing programs were intended to illustrate the impact of unsealing the duct on the indications of each measurement module. During the tests, the data were recorded on an ongoing basis, with the preview of pressure diagrams in a specially prepared recording application.
The underground lignite mine (Valenje Pregomovnik—Slovenia) was the last place of tests. Figure 9 shows a fragment of the mining map covering the test stand. The tests were designed to verify the operation correctness of the air leak detection system in real conditions. On the section of about 500 m of the duct D = 600 mm (marked in blue in the figure), six connectors were installed, four of which were intended for the installation of measuring devices and two were blinded ones enabling a leakage simulation by opening the inspection windows.
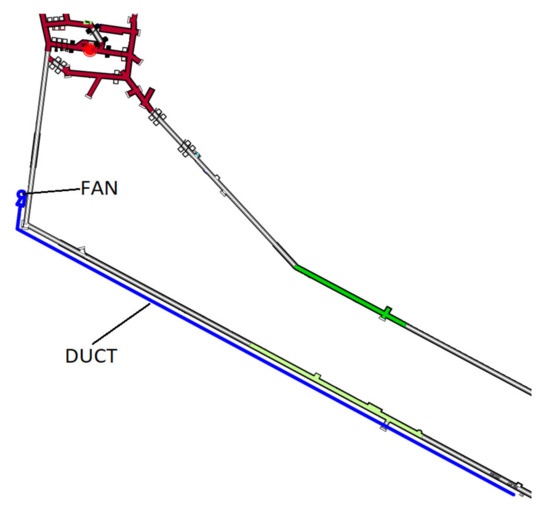
Figure 9.
An overview drawing of the test stand at Premogovnik Velenje (coalmine).
Initially, the connectors were installed at 20 m intervals. Due to the long communication range between the modules, which was verified during the first day of testing, the location of the section connectors was changed prior to the measurement tests so that a distance of 150 m was achieved between the first and last connector. The configuration of the connectors was as follows:
- First connector—point “0”,
- Second connector—10 m,
- Third connector—20 m,
- Fourth connector—70 m,
- Fifth connector—150 m.
Measuring devices were installed in the switches 1, 4, and 5, and the fan was started to check the correctness of pressure sensors indications and alarm threshold settings. After arranging the devices, the tests of the leak monitoring system were started, introducing cyclic unsealing and sealing of the duct between the selected sections. The second connector (10 m behind the “0” point) was unsealed. As expected, when the leak was simulated, the pressure inside the duct dropped. However, it was noticed that the pressure also dropped on the first measuring device, which was manifested by a slight change in the pressure difference between the measuring modules. Accordingly, the location of the leak point was changed to the third connector, which was located closer to the second measuring device. As expected, the impact of unsealing on the pressure indications on the first measuring device decreased.
In the next steps, the threshold of minimum pressure difference between the modules was set. When it is exceeded, the leakage of the duct was signaled. Then, a series of tests were carried out, during which the ventilation duct was repaired and resealed, checking the system response.
4. Results
Figure 10 presents the waveforms of static pressure from five measuring devices, which were recorded during the tests carried out in industrial conditions. The diagram shows two test series that were carried out in one fan operation cycle. Program I started after approximately 400 s of testing. Successive points between the measuring modules were unsealed and then sealed. The measurement according to program I was completed within about 1200 s of the test. The next measurement (according to program II) was taken from 1300 to 2200 s of the test. During the tests, the sequence of unsealing was changed, starting the process from the point between the 4th and 5th measuring device. Sealing also took place from the end point toward the beginning of the duct.
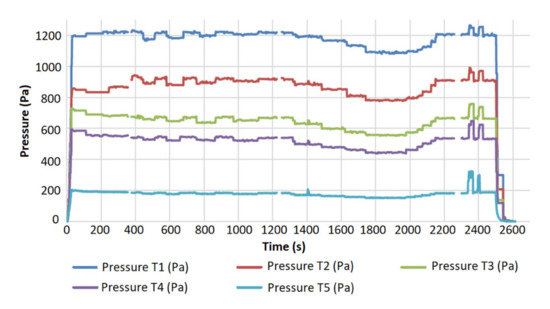
Figure 10.
Measured static pressures during the first and second tests.
Figure 11 shows the dynamic pressure waveforms from all the five measuring devices.
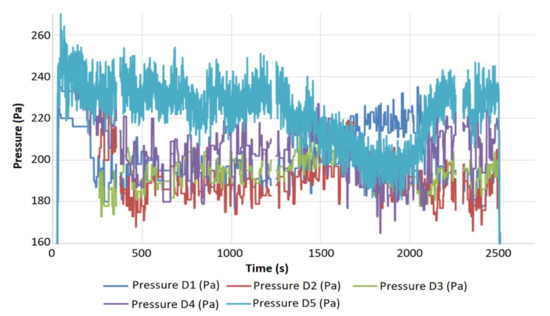
Figure 11.
Measured dynamic pressures during the first and second tests.
Table 1 shows data collected by the measuring devices during the tests. The data are divided into columns depending on the leak location. The markers (according to connector numbering in Figure 8 from T1 to T5 (static pressures) mark successive measuring devices and the results of pressure measurements before and after unsealing.

Table 1.
Static pressure and static pressure differences noted during unsealing and sealing of the system (I test).
The points with the greatest pressure difference (DELTA T) are marked in green. Shades of green indicate and graduate the size of the leak (the smallest leak is white; the largest leak is dark green). The greatest pressure drops coincide with the places where the duct was unsealed. In the case of sealing the duct, the highest pressure increase was also noted in the places where it was sealed. In the case of leakage between points T4 and T5, the results are disturbed. It is caused by the outlet opening at the distance of 5 m from point T5. An increase in the outlet distance from the T5 measuring point should positively affect the pressure reading at the last two measuring points T4 and T5.
The second part of the tests consisted in unsealing all the sections one by one, so that at a critical moment, all the sections were unsealed and then sealed. Unsealing of the system was started between points T4 and T5 and before progressing to between T3 and T4. It was unsealed at two points with an interval of several seconds; then, in 1405 s, the glands between points T3 and T4 were sealed, which after a few seconds were unsealed again. In the next steps, the ducts between the points T3 and T2 and T2 and T1 were unsealed. Figure 12 and Figure 13 shows the pressure distribution along the duct with successive unsealing and sealing. The numbers above the graphs are the pressure values at which significant changes occurred, which was the basis for identifying possible leaks.
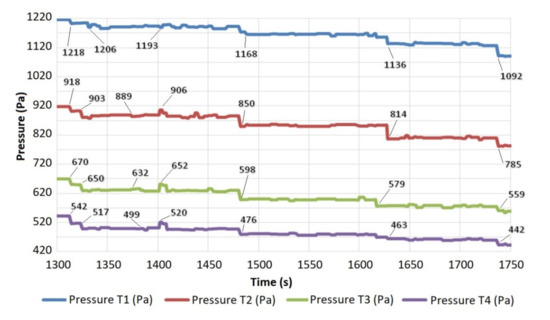
Figure 12.
Gradual unsealing of the ventube.
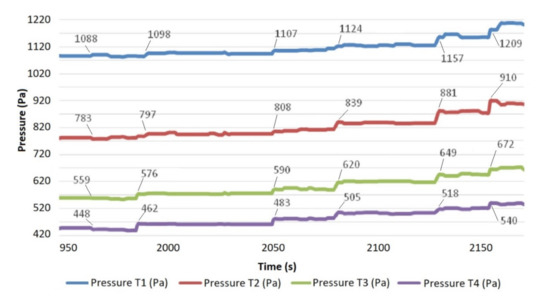
Figure 13.
Gradual sealing of the ventube.
Table 2 shows the results of the measurements of characteristic pressures for various measuring points T1–T4.
Table 2.
Static pressure and static pressure differences noted during unsealing and sealing of the system (II test).
Points I–VI (II test—unsealing) show characteristic points over the time period (the table omits a few seconds of sealing and unsealing around 1405 s: I—duct before unsealing, II—first leakage between T5 and T4, III—second leakage between T5 and T4, IV—third leakage between T4 and T3, V—fourth unsealing between T3 and T2, VI—fifth leakage between T2 and T1. Points I–VI (II test—sealing), similarly to the description above, present individual stages of sealing the duct. Points I–II to V–VI show the pressure difference between the characteristic points. The distribution of the pressure difference from the smallest to the greatest was visualized with green tones (the smallest leak is white; the largest leak is dark green).
During the tests in the mine (Velenje Premogovnik-Slovenia), the pressure was recorded at three points of the duct. The chart, presented in Figure 14, shows the waveform of the recorded trials. The waveform of the pressure from the first sensor, located about 10 m downstream of the fan, is marked in red.
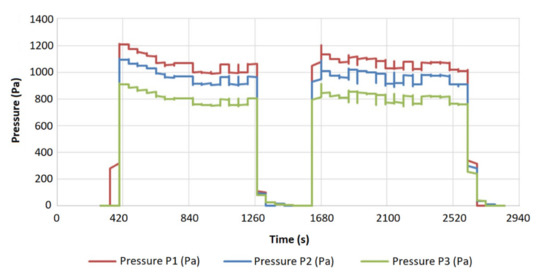
Figure 14.
Pressure waveform recorded during underground tests.
The pressure recorded by the sensor No. 2, which was installed about 40 m after the first sensor, is shown in blue. The last sensor, the values of which are marked in green, was placed 80 m behind the second sensor. The graphs clearly show the pressure drop, with an increase in the distance from the fan caused by the unit aerodynamic resistance (quality of the material smoothing surface) and the mass transfer coefficient (duct leak tightness).
At the initial stage, there is a sudden increase in pressure to over 1200 Pa, which is related to the fan starting. Then, the pressure gradually drops to about 1050 Pa, which is related to the operating characteristics of the used duct. The tests were carried out on a flexible duct lying freely of the floor. After filling the duct with air, the pressure stabilized. Then, the duct was unsealed and sealed, and the pressure changes were checked. During a short break, the settings of the measuring devices were changed, and exceedances of the set pressure thresholds were signaled.
An additional communication test was performed at the bend of the roadway. Tests showed that the range of radio communication on the 90° bend is much shorter than that on the straight section of the roadway. Therefore, it should be assumed that in the target application of the measuring devices, in the event of bends, one sensor should be placed in front of the bend, and one sensor should be placed behind the bend. The distances should be selected experimentally, because they depend on the angle of the bend of the roadway. Unfortunately, it was not possible to test the range on curves of different degrees.
5. Discussion and Conclusions
The tests showed much higher efficiency and range of communication between each measuring module than initially assumed. This was only verifiable under in situ conditions, where the mine roadway creates an environment conducive to the propagation of radio waves. However, it should be taken into account that in the roadway and the testing site, there was no other equipment except for the ventilation duct. A communication test between the modules was carried out into a straight section of a roadway. The greatest distance at which correct communication between the modules was carried out was 160 m, with a radio transmitter amplification of 12 dB. With standard transmitter settings 0 dB, communication was active over a distance of 100 m. The power of the radio transmitter has a direct impact on the discharge rate of the battery, so it should be selected depending on the power supply conditions. An additional communication test was carried out at the roadway bend. Tests showed that the range of radio communication on the 90° bend is much smaller than that on a straight section of the roadway. Therefore, it should be assumed that in the final use of measuring devices, in the case of bends, one sensor should be placed in front the bend, and the other sensor should be placed behind the bend. The distances should be selected experimentally as they depend on the angle of a bend.
Due to the turbulent airflow along the duct, the dynamic pressure indication was illegible, and it was difficult to draw meaningful conclusions from it. The recorded static pressure was stable and made it possible to determine the simulated places of unsealing the duct. During the tests, the impact of the leakage on the pressure readings in the sensors behind and before the leak location was found. The work focused solely on developing a leak detection method, and in the future, the team intends to develop a method that will also allow the leakage severity to be determined.
One of the most important technical aspects is the possibility for the sensors to be self-powered during operation. If the air flow velocity in the duct exceeds 15 m/s, the charger inside the measuring modules will operate at 100% efficiency. Assuming that the battery is charged at the beginning of its operation (at 4.2 V), all electricity from the generator will be fed into the electronic system. At air velocities above 15 m/s, the measuring device demand for electric energy is fully covered. At lower air flow velocities in the duct (less than 15 m/s) or when working with a discharged battery, it is possible to change the operation mode of the device to a periodic operation. The devices turn on at a given time, take measurements, send data, and then go to the sleep mode. Such a mode of operation is sufficient to detect a leak in the ventilation duct.
The measurements showed that the duct leakage monitoring system can function properly, provided that it is properly configured on the target duct. It is important to calibrate the devices properly, recording the pressures at the sealed duct. The last measuring point could also be kept at an appropriate distance from the outlet. The calibration should take into account natural pressure drops in the duct depending on its design and length. The assumptions for the tests included the measurement of the dynamic pressure difference inside the duct. During the tests, it turned out that due to the turbulent air flow through the flexible armored duct, it negatively affects the stability of the measurements. There was also an increase in dynamic pressure at the point preceding the leakage. Due to the lack of stable readings, it was decided to monitor static pressures along the duct. The static pressure is characterized by greater pressure stability in the case of a tight, properly assembled duct. In the case of a leak, the measuring devices record clear pressure drops in the vicinity of the leak at a distance of ±40 m. Too high a sensor density will negatively affect the system’s response, as they will also register pressure drops caused by leaks located near other sensors. The maximum distances between sensors are limited by the wireless communication range and are approximately 100 m. Therefore, it is recommended to use distances between sensors in the range of 50–100 m, depending on the expected precision of the leak location.
Properly calibrated measuring modules inform about the place of leakage by displaying a red alarm diode (Figure 15) in the device before the leak, or in two devices between which the leak appeared. After sealing the leak, the device automatically enters the measuring mode, turning off the red alarm LED (returning to standby mode - flashing green LED—Figure 16). Changing the configuration of the duct (e.g., changing its length) requires recalibration of the monitoring system.
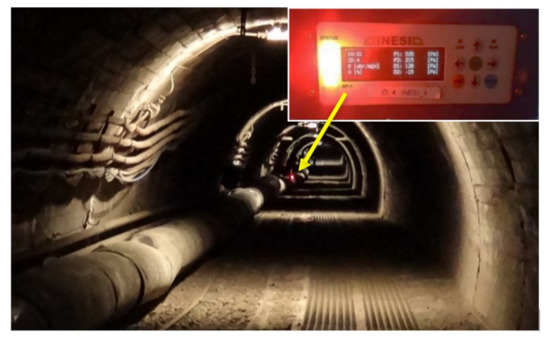
Figure 15.
Response of the measuring module for the connector unsealing (red light).
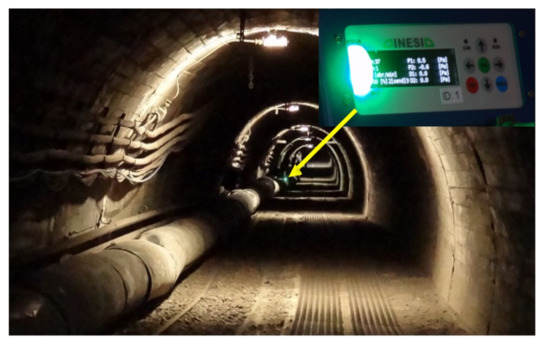
Figure 16.
Response of the measuring module for the connector sealing (green, flashing light).
Positive tests with the leak detection system in different environmental conditions provided a lot of important information that could improve the system operation. Initial assumptions provided observations of the place of the leakage in the ventilation duct by comparing the dynamic pressures. In the place where the difference in dynamic pressure exceeds the allowable value (selected individually depending on local conditions), the system informs about leaks by lighting the red diode. These tests in the Velenje Premogovnik mine confirmed a correct operation of the system in the case of large unsealing and maintaining the required distance between pressure recording points. It was found that static pressure measurement can be a more reliable source of information than dynamic pressure measurement, which can ultimately simplify the measuring devices by eliminating the Prandtl probe.
The described leak detection system was designed for operation in underground mining plants with limited space. On the basis of many years of the authors’ experience, it can be concluded that theoretical calculations related to flow resistance (in an environment as dynamic as the underground mine roadway) do not reflect the actual phenomena occurring in the pipeline. Flow resistance is influenced by many variables (change of the duct cross-section, turns, dips, and heights), which in turn influence the measured values. Therefore, there is the possibility of setting the alarm threshold on each sensor based on the individual scheme of the duct line and, more importantly, on the basis of the working crew’s experience. The suggested diagnostic system, after introducing minor modifications, can also be used in other industries where there are mechanical ventilation installations, e.g., in shopping centers or in industrial halls. In the event that the ventilation system is constant (it is not undergoing constant reconstruction, as is the case of mines), and outsiders do not have access to it, theoretical calculations enabling the system to be fully automated are recommended. An automation system based on machine learning using a neural network is an interesting direction of system development. Such a system would be able to recognize a change in the efficiency of the ventilation network itself and correct alarm thresholds based on the built-in algorithm.
Ventilation is one of the main factors that affects a company’s costs to the greatest extent [36]. With the current lengths of bored workings, monitoring and preventing leakages can significantly reduce the cost of electricity [37]. Based on the tests carried out by Józef Knechtel [38], who analyzed a duct with a diameter of 0.8 m, it was noted that with a decrease in sealing (over a distance of 1000 m, the daily demand for electricity increases by over 20% (from 338,472 kWh to 411,720 kWh). Therefore, as noted by the author in [39,40], it is advisable to introduce a criterion related to the cost of supplying a unit amount of air in relation to a unit distance, and on this basis to assess the duct [41,42,43]. The diagnostic system proposed by us is ideally suited to this task.
6. Patents
Sposób monitorowania szczelności przewodu i układ do pomiaru ciśnienia płynu w przewodzie [zgłoszenie P.432698]—Method of monitoring duct leak-tightness and system for the fluid measurement in the duct.
Author Contributions
Conceptualization, M.W. and J.J.; methodology, M.W. and M.S; software, J.J.; validation, M.S.; formal analysis, M.S.; investigation, M.S., J.J. and M.W; writing—original draft preparation, M.W. and M.S.; supervision, P.K. All authors have read and agreed to the published version of the manuscript.
Funding
The article was prepared within the realisation framework of the European project INESI “Increase efficiency and safety improvement in underground mining transportation routes”. (Contract number 754169), financed by the Research Fund for Coal and Steel.
Institutional Review Board Statement
Not applicable.
Informed Consent Statement
Not applicable.
Data Availability Statement
The data presented in this study are available on request from the corresponding author.
Conflicts of Interest
The authors declare no conflict of interest.
References
- INESI Project Site. Available online: http://inesi.komag.eu/ (accessed on 27 April 2021).
- Tutak, M.; Brodny, J.; Szurgacz, D.; Sobik, L.; Zhironkin, S. The Impact of the Ventilation System on the Methane Release Hazard and Spontaneous Combustion of Coal in the Area of Exploitation—A Case Study. Energies 2020, 13, 4891. [Google Scholar] [CrossRef]
- Saha, S.C.; Rannie, M.; Sauret, E.; Gu, Y.T. Numerical modelling for improved underground-mine ventilation systems. In Proceedings of the 8th Australasian Congress on Applied Mechanics, ACAM 2014, Melbourne, Australia, 23–26 November 2014; pp. 747–754. [Google Scholar]
- Artica, I.; Quispe, G.; Raymundo-Ibañeez, C. Ventilation System Simulation Model at a Mine (2019) IOP Conference Series: Materials Science and Engineering, 689 (1), art. no. 012017.
- Drwiȩga, A.; Szelka, M.; Turewicz, A. Improvement of auxiliary ventilation efficiency in underground workings. IOP Conf. Ser. Earth Environ. Sci. 2019, 261, 012007. [Google Scholar] [CrossRef]
- Pieczora, E.; Polnik, B. New solutions of electric drives for mining transportation machines. Cuprum 2015, 3, 199–210. [Google Scholar]
- Rozporządzenie Ministra Energii z Dnia 23 Listopada 2016 r. w Sprawie Szczegółowych Wymagań Dotyczących Prowadzenia Ruchu Podziemnych Zakładów Górniczych. Available online: http://isap.sejm.gov.pl/isap.nsf/download.xsp/WDU20170001118/O/D20171118.pdf (accessed on 20 April 2021).
- Olejnik, M. Testing the equipment used in ventilation of mine workings. Min. Mach. 2020, 2, 26–37. [Google Scholar] [CrossRef]
- Barnes, R.J. A partial solution to optimal mine ventilation network design. In Proceedings of the 4th U.S. Mine Ventilation Symposium, Berkeley, CA, USA, 5–7 June 1989; pp. 395–404. [Google Scholar]
- Hardcastle, S.G. 3D-canvent: An interactive mine ventilation simulator. In Proceedings of the 7th U.S. Mine Ventilation Symposium, Lexington, KY, USA, 5–7 June 1995; pp. 467–472. [Google Scholar]
- Logachev, I.; Logachev, K.; Averkova, O. Local Exhaust Ventilation: Aerodynamic Processes and Calculations of Dust Emissions; CRC Press: Boca Raton, FL, USA, 2015; pp. 1–540. [Google Scholar]
- Kursunoǧlu, N.; Onder, M. Auxiliary ventilation design for an underground coal mine. In Proceedings of the 26th International Mining Congress and Exhibition, Belek, Turkey, 16–19 April 2019; pp. 1106–1115. [Google Scholar]
- Lowndes, I.S.; Tuck, M.A. Review of mine ventilation system optimization. Trans. Inst. Min. Metall. Sect. A 1996, 105, A114–A126. [Google Scholar]
- Wang, Y.J. Minimizing air power in a ventilation network using regulators in nonfixed branches. J. Mine Vent. Soc. 1999, 52, 39–43. [Google Scholar]
- Kumar, G.V.; Sastry, V.R.; Krishna Rao, G.V. Minimizing power consumption in multiple fan networks by optimum fan selection. In Proceedings of the 7th U.S. Mine Ventilation Symposium, Lexington, KY, USA, 5–7 June 1995; pp. 491–497. [Google Scholar]
- Knechtel, J. Jednostkowy opór aerodynamiczny lutniociągów zbudowanych z lutni elastycznych [Unitary aerodynamic resistance of brazing lines made of flexible ventilation ducts]. Mech. Autom. Górnictwa 2011, 2, 18–27. [Google Scholar]
- Calizaya, F.; McPherson, M.J.; Mousset-Jones, P. An algorithm for selecting the optimum combination of main and booster fans in underground mines. In Proceedings of the 3rd U.S. Mine Ventilation Symposium, University Park, PA, USA, 12–14 October 1987; pp. 408–417. [Google Scholar]
- Cross, H. Analysis of flow in networks of conduits or conductors. Univ. Ill. Bull. 1936, 286, 1–32. [Google Scholar]
- Świderski, A.; Wronkowski, C. Szczelność powietrzna instalacji wentylacyjnych [Air tightness of ventilation systems]. Cyrkulacje 2015, 29, 42–46. [Google Scholar]
- Flourentzou, F.; Pantet, S. Theoretical and real ventilation heatlosses and energy performance in low energy buildings. In Proceedings of the 36th AIVC Conference “Effective Ventilation in High Performance Buildings”, Madrid, Spain, 23–24 September 2015. [Google Scholar]
- Lu, X.; Yin, H. The intelligent theory and technology of mine ventilation. J. China Coal Soc. 2020, 45, 2236–2247. [Google Scholar]
- Shriwas, M.; Pritchard, C. Ventilation Monitoring and Control in Mines. Min. Metall. Explor. 2020, 37, 1015–1021. [Google Scholar] [CrossRef]
- Ferino, D.C.; Jose, R.P.; Ochoa, J.R.M.; Villamiel, V.V.; Meynard Arana, E.J.P. Development of Leak Detection System for PVC Pipeline Through Vibro-Acoustic Emission. IEEE Annu. Int. Conf. 2019, 2557–2560. [Google Scholar] [CrossRef]
- Ribeiro, A.M.; Grossi, C.D.; Santos, B.F.; Santos, R.B.; Fileti, A.M.F. Leak Detection Modeling of a Pipeline Using Echo State Neural Networks. Comput. Aided Chem. Eng. 2018, 43, 1231–1236. [Google Scholar]
- Semin, M.A.; Grishin, E.L.; Levin, L.; Yu Zaitsev, A.V. Automated ventilation control in mines. Challenges, state of the art, areas for improvement. J. Min. Inst. 2021, 246, 623–632. [Google Scholar] [CrossRef]
- Sjöström, S.; Klintenäs, E.; Johansson, P.; Nyqvist, J. Optimized model-based control of main mine ventilation air flows with minimized energy consumption. Int. J. Min. Sci. Technol. 2020, 30, 533–539. [Google Scholar] [CrossRef]
- Gilbert, J.M.; Balouchi, F. Comparison of Energy Harvesting Systems for Wireless Sensor Networks International. J. Autom. Comput. 2008, 5, 334–347. [Google Scholar] [CrossRef] [Green Version]
- Jasiulek, D. The use of lost energy for supplying the dispersed network of sensors. Maint. Probl. 2015, 97, 51–59. [Google Scholar]
- Sardini, E.; Serpelloni, M. Self-Powered Wireless Sensor for Air Temperature and Velocity Measurements with Energy Harvesting Capability. IEEE Trans. Instrum. Meas. 2011, 60, 5. [Google Scholar] [CrossRef]
- Sardini, E.; Serpelloni, M. Passive and Self-Powered Autonomous Sensors for Remote Measurements. Sensors 2009, 9, 943–960. [Google Scholar] [CrossRef]
- Jasiulek, D.; Stankiewicz, K.; Jagoda, J. Możliwości zastosowania czujników samozasilających się przeznaczonych do pracy w podziemiach kopalń. [Application possibilities of self-powered sensors for underground mining]. Mech. Autom. Górnictwa 2013, 8, 73–80. [Google Scholar]
- He, X.-F.; Qi, R.; Cheng, Y.-Q.; Zhang, C.; Shang, Z.-G.; Yang, X.-K. A wireless air flow sensor powered by a wind-induced vibration energy harvester. J. Vib. Eng. 2017, 30, 290–296. [Google Scholar]
- Jasiulek, D. Testing the piezoelectric energy Harvester’s deflection on the amount of generated energy. Adv. Intell. Syst. Comput. 2016, 414, 95–112. [Google Scholar]
- Figiel, A. Wymagania dotyczące zapewnienia iskrobezpieczeństwa systemów sterowania [Requirements to ensure intrinsic safety of control systems]. Masz. Górnicze 2016, 3, 38–44. [Google Scholar]
- Chmielarz, S.; Molenda, T.; Korski, W.; Oset, K. Formal aspects of designing intrinsically safe explosion-proof apparatus. Prz. Elektrotechn. 2018, 10, 221–225. [Google Scholar]
- Gendler, S.G.; Gridina, E.B.; Egorova, N.A.; Kozyrev, S.A.; Sogrin, B.B. Methodical fundamentals of air consumption calculation for mine working ventilation at the operation of machines and mechanisms with internal combustion engines. Bezop. Tr. Promyshlennosti 2020, 4, 45–51. [Google Scholar] [CrossRef]
- Abdel-Hadi, A.; Salem, A.R.; Abbas, A.I.; Qandil, M.; Amano, R.S. Study of Energy Saving Analysis for Different Industries. J. Energy Resour. Technol. 2020, 143, 052101. [Google Scholar] [CrossRef]
- Knechtel, J. Selection of air duct ventilation system as a means to reduce ventilation costs of the driven workings [Dobór instalacji lutniowej jako środek do zmniejszenia kosztów przewietrzania drążonych wyrobisk górniczych]. Przegląd Górniczy, 2015, t.71, 5, 44-53. Available online: http://yadda.icm.edu.pl/baztech/element/bwmeta1.element.baztech-80833871-4ec1-40fe-9e30-7052c3788931/c/Knechtel.pdf (accessed on 27 April 2021).
- Bystroń, H. Metody obliczania nierozgałęzionych lutniociągów kopalnianych [Methods of calculating unbranched mine ventilation ducts]. Arch. Górnictwa 1990, 34, 3. [Google Scholar]
- Bystroń, H. Kryteria jakości aerodynamicznej nie rozgałęzionych lutniociągów kopalnianych [Aerodynamic quality criteria of unbranched mine ventilation ducts.]. Wiadomości Górnicze 1990, 41, 1. [Google Scholar]
- Auld, G. An estimation of fan performance for leaky ventilation ducts. Tunn. Undergr. Space Technol. 2004, 19, 539–549. [Google Scholar] [CrossRef]
- Desouza, E. Auxiliary ventilation operation practices. In Proceedings of the 10th US/North American Mine Ventilation Symposium, London, UK, 16–19 May 2004; p. 341. [Google Scholar]
- Millar, D.; Levesque, M.; Hardcastle, S. Leakage and air flow resistance in mine auxiliary ventilation ducts: Effects on system performance and cost. Min. Technol. 2017, 126, 10–21. [Google Scholar] [CrossRef]
Publisher’s Note: MDPI stays neutral with regard to jurisdictional claims in published maps and institutional affiliations. |
© 2021 by the authors. Licensee MDPI, Basel, Switzerland. This article is an open access article distributed under the terms and conditions of the Creative Commons Attribution (CC BY) license (https://creativecommons.org/licenses/by/4.0/).