Abstract
Degradation of electrode microstructure is one of the key factors affecting long term performance of Solid Oxide Fuel Cell systems. Evolution of a multiphase system can be described quantitatively by the change in its interfacial energy. In this paper, we discuss free energy of a microstructure to showcase the anisotropy of its evolution during a long-term performance experiment involving an SOFC stack. Ginzburg Landau type functional is used to compute the free energy, using diffuse phase distributions based on Focused Ion Beam Scanning Electron Microscopy images of samples taken from nine different sites within the stack. It is shown that the rate of microstructure evolution differs depending on the position within the stack, similar to phase anisotropy. However, the computed spatial relation does not correlate with the observed distribution of temperature.
1. Introduction
Solid Oxide Fuel Cells (SOFCs) are energy conversion devices, which provide electrical power by converting the chemical energy of fuels such as hydrogen, carbon monoxide, or carbohydrates (if internal or external reforming is used). Despite their numerous advantages—high efficiency, wide variety of available fuels, and low pollution—the wider market application of SOFCs is still hindered by several issues, not the least of which the microstructure degradation affects the reliability of the ceramic porous electrodes.
A ceramic electrode is composed of several phases, and each phase has a specific transport function. An oxide phase, e.g., YSZ (Yttrium-Stabilized Zirconia) conducts ionic current, metallic phase (e.g., Nickel), and gas reagents diffuse through the open pores. The reaction of oxidation occurs at the Triple Phase Boundary (TPB). As a result, even relatively small changes to the distribution of material in the electrode cause significant changes to the electrochemical performance.
Understanding the SOFC microstructure evolution is aided by empirical studies involving long-term stack performance experiments, combined with the analysis of microstructure changes which occurred over during the experiments. Monaco et al. [1] conducted X-ray holotomography-based microstructure analyses for Solid Oxide Cells operating for periods ranging from 1000 h to 15,000 h. Brus et al. performed two independent long performance tests in which an enhancement, rather than deterioration of performance was observed [2,3,4,5].
One way to quantify the evolution of multiphase systems is by analyzing the change of its free energy. This is the basis of Phase Field Models. In PFMs, the phase distribution is diffuse, rather than discrete—they are modeled using a set of continuous functions. The interface of any two phases has a finite, non-zero thickness within which the phase volume fractions take noninteger values. Free Energy of a microstructure may be computed using a Ginzburg-Landau type free energy functional [6]. The rate of phase transition may be determined using Allen-Cahn [7] equation for nonconserved order parameters, and Cahn-Hilliard [8] equation for conserved order parameters. Depending on the scale and the physical input data, Phase Field Modeling may be considered to be either a numerical tool or a first principles’ approach [9,10]. PFMs have been used in a broad range of problems, ranging from microstructure evolution and solidification [11] to multiphase flows [12].
Since porous electrode degradation due to coarsening of microstructure can be modeled as an effect of a monotonous decay of microstructural free energy, PFMs have also been applied to SOFC related problems by several research teams. Chen et al. [13] compared TPB density and tortuosity changes in an SOFC anode, as predicted by two variants of a PFM model. Cahn-Hilliard equation is generally used for the distribution of phases, and Allen-Cahn equation is employed for grain-related order parameters, as was the case in studies by Lei et al. [14] or Jiao and Shikazono [15] among others.
Jiao et al. [16] combined a PFM model with a microscale transport phenomena model to interpret data from a long-term performance study. Shimura et al. [17] performed a similar analysis for the cathode. Recently, Wang et al. [18] used distribution of phases derived from PFM of anode evolution as input into a 3D microscale model to compute the electrode polarization.
In this paper, we use Ginzburg-Landau type free energy functional to quantify the degradation observed during a previous long-term performance stack experiment. One of the purposes of our analysis is to investigate the factors affecting the degradation rates, as well as its relationship with microstructure anisotropy. While it is a common practice to solve the transient PFM employing Allen-Cahn and Cahn-Hilliard equations, we believe that the necessary conclusions can be drawn from a simpler model, since the free energy is a monotonously declining state function. While a transient model allows prognosticating the quality of postdegradation microstructures, in our case they have already been determined by experiment. Relating these results to the framework of PFM modeling will allow for a quantitative description of the observed microstructure evolution.
2. Experimental Analysis
The analysis presented in this paper is concerned with the results of a long-term performance experiment during which a stack of 6 cells was operated within a modular stack test bench (MSTB). Both the SOFC stack and the MSTB were produced by SOLIDPower S.p.A. of Italy. The stack consisted of six anode-supported cells connected in series. The total of 10 microstructural samples were recovered from the stack, including 1 sample from a reference cell, corresponding to brand new microstructure, and 9 samples from the stack which was disassembled after a 3800 h degradation experiment. Nine samples were taken from the inlet-sides, the centers, and the outlet-sides of three cells: the top cell, the central cell, and the bottom cell. The schematic visualization of the site naming scheme is illustrated in Figure 1b. The experiment has shown that the temperature distribution within the stack, while mostly constant over the course of the study, was not uniform. The temperature readings are displayed on the experimental setup diagram in Figure 1a. The samples were imaged using FIB-SEM setup, and the resulting stacks of images were digitized into three-dimensional data sets using AVIZO (Thermo Fisher Scientific). The methodology of FIB-SEM, is presented in Figure 1c, and the sample cross-sections obtained before and after the long-term performance test are presented in Figure 2. The long-term performance experiment has been previously described in another paper [2]. Three-dimensional visualizations of the samples are presented in Figure 3. Interfacial areas of phases in the samples were computed using Marching Cubes Method [19], as implemented in AVIZO. Additionally, in the paper by Brus et al. [4] we have estimated the anisotropy of the samples. The anisotropy, understood as the measure of differences in parameters along different directions, was quantified using the sum of anisotropy factors for each phase (Nickel, YSZ, Pore) such that:
where is the tortuosity factor, defined as the ratio of the diffusion coefficient in a free space to the diffusion coefficient in a real sample in a porous electrode. is the sample average tortuosity factor of phase i in the direction i ( being the standard directions), and is the averaged tortuosity factor of phase i for any direction. The tortuosity factors were estimated using Random Walk Simulation. when the tortuosity factor of the sample is perfectly uniform. The anisotropy calculation methodology was previously presented in the cited open access paper by Brus et al. [4].
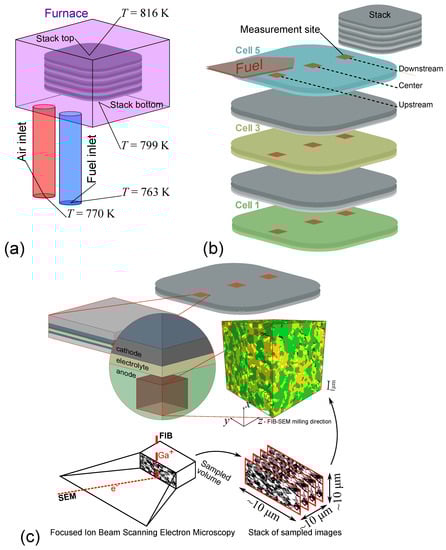
Figure 1.
Sample recovery from the disassembled stack (a) SOFC stack, (b) Sample locations, (c) FIB-SEM methodology.
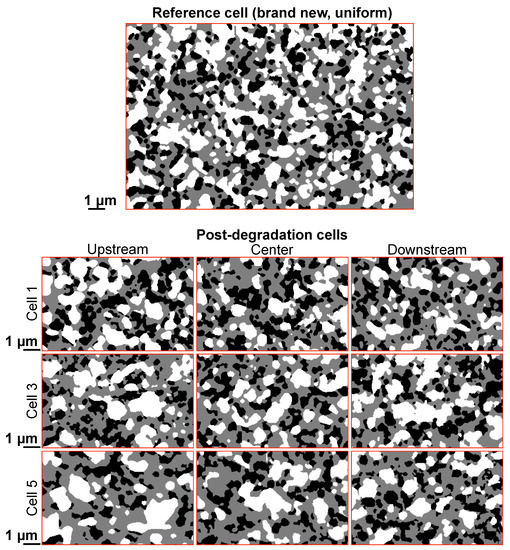
Figure 2.
Selected cross sections from the Focused Ion Beam Scanning Electron Microscopy.
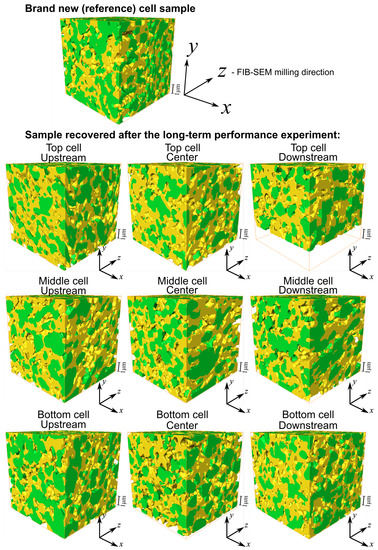
Figure 3.
Three-dimensional reconstructions of the samples recovered from the stack before, and after the degradation study.
3. Mathematical Model
The Ginzburg-Landau type free energy functional for a two-component system can be described using the following equation [6].
The value , and are local phase volume fractions corresponding to a given set of two phases (see Figure 4), such that . Since the phase distributions are continuous, a single point in the computational domain may have noninteger values. is the gradient energy coefficient of phase i. is the representative volume of the microstructure, is the bulk free energy of the system. The bulk free energy of an interface shared by phase i and another phase j can be computed using a double-well potential equation, which is commonly ([6]):
for a given pair of two phases such that . is the energy barrier between minima in the double well potential equation for a diffuse phase interface between phase i and the other phase j. When considering any two-phase interface ( corresponding to Ni-YSZ, Ni-Pore, and YSZ-Pore pairs), its specific interfacial energy per unit area may be obtained by finding the interfacial phase volume fraction profile at a Double Phase Boundary, for which the interfacial energy is locally minimal. The analytical solution for the profile may take the following form [20]:
where is the distance in the direction normal to the interface, and , the phase interface thickness equals to:
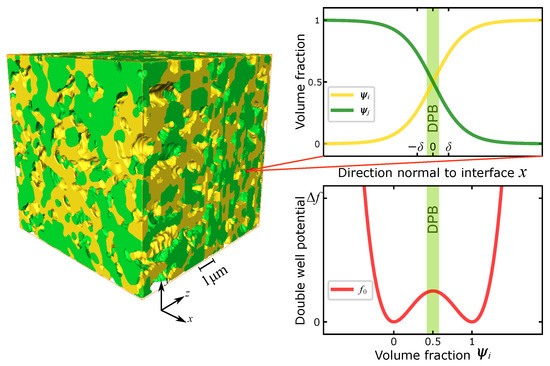
Figure 4.
Diffuse interface (Double Phase Boundary—DPB) in a Phase Field Model.
The analytical solution may be used if the diffuse interface between a pair of two phases is one-dimensional. This assumption appears to be acceptable if a very small section of the sample is selected, and a thin interface is considered. For the profile in Equation (4) may then be computed using the integral (2), yielding the following relationship [6]:
The two-phase diffuse interface is visualized in Figure 4 In all of the analyzed cases, the interface gradient was assumed to be constant and perpendicular to the discrete interfaces in the digitization of the microstructure, for interfaces located far from a triple phase boundaries (TPBs). The phenomenological parameters and in Equations (2), (3), (5) and (6) can be estimated empirically. Using Transmission Electron Microscopy (TEM) Nahor et al. [21] measured Ni-YSZ interfacial energy at depending on configuration. SEM measurements of SOFC atomistic structure suggest interface thickness of [22]. Similarly, Chen et al. [13], use interfacial energy ratio of :: = 2.2:1.9:1.4 and these are the values which we employ in our study. The values are used as input to Equations (5) and (6), a set of which is solved for the phenomenological parameters and , yielding:
From the relationships (7), one can obtain , and . Using these values to solve Allen-Cahn or Cahn-Hilliard equations for the entire microstructure would be impractical due to high computational cost, since a sub-angstrom scale mesh would be required to accurately represent the diffuse interface. In this work, the problem is bypassed by, first—considering only two specific points in time (pre-degradation, and post-degradation cell samples), and second—identifying several repeating spatial configurations in the computational domain, for which the local solutions are computed independently. The local area in a microstructure reconstruction discrete volume which shares an interface with a different phase is multiplied by the interfacial free energy density corresponding to the given pair of phases (). While local profiles for the interfaces located far from a triple phase junction may be viewed as essentially one-dimensional for a first-principles based interface thickness, more consideration needs to be given for a near-TPB location. An analytical solution would be difficult or impossible to obtain in proximity to a junction [6]. In their “Study on three-component Cahn-Hilliard flow model”, Boyer and Lapuerta [23] propose the following generalization of Equation (2) for three-phase systems:
which we use in our current work. In this case, , , and such that are local phase volume fractions corresponding to a given set of three phases (Ni, Pore, YSZ in the case of the discussed SOFC anode). Boyer and Lapuerta [23] propose the following function for a three-component system. Let . Then:
is the spreading coefficient of phase i. In a system containing phases , can be computed from the specific interfacial energies per unit area of each of the component pairs in the system:
The set of —which is used in Equation (9) to compute the specific interfacial energy for locations in the vicinity of a TPB— is obtained by minimizing . To do so, a transient phase evolution equation is solved with an arbitrarily high value of time t, at which F approaches a minimum. Since phase concentrations are treated as conserved-order parameters, Cahn-Hilliard equation is used for that purpose. The multiphase implementation of Cahn-Hilliard differential equation set, based on the work of Boyer and Lapuerta [23], can be written as follows:
where is the chemical potential of phase i, is reference phase mobility set arbitrarily to . can be set arbitrarily, since the purpose of the equation is to locally minimize F at a given point in time, rather than to prognosticate further evolution of the microstructure. The dimensionless coefficient , is given by Equation (12).
where the indices signify Ni, Pore, and YSZ phases, respectively. Since , a set of two partial differential equations is sufficient. A near-triple phase boundary area is chosen to compute a specific microstructural free energy associated with the presence of a phase junction. The Triple Phase Boundary (TPB) junction is modeled as follows: a circle is divided into three equal parts corresponding to Ni, pore and YSZ phases. Periodic boundary conditions are implemented. Then the energy minimization simulation based on the coupled set of Cahn-Hilliard equations (see Equation (11)) is run for an arbitrarily long time, until little to no change is observed. The resulting diffuse interfaces near a triple phase junction (which, in the demonstrated two-dimensional case, is a point on a plane) are presented in Figure 5. The near-TPB free energy integral is computed using Equation (9). The integration limits are restricted to ensure focus on the junction and to keep the lengths of two-phase boundaries within equal to each other. The energy in a near-TPB voxel in a real, discrete reconstruction of a microstructure is computed by adding the required interfacial energies given by Equations (8) and (11).
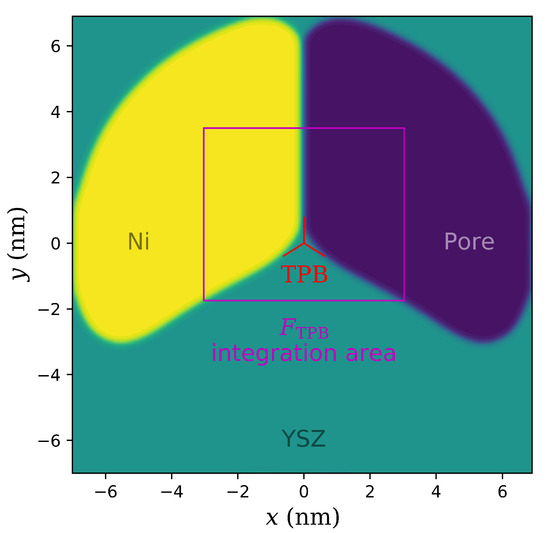
Figure 5.
Diffuse phase distribution near a modeled triple phase junction.
Since three-dimensional samples are considered, it is possible to discuss the spatial distribution of the free energy within the computational domain. To do so, the local values for a given depth z of the sample (depth being the FIB-SEM milling direction) are computed by integrating the Equation (8) for a sub-volume of the computational domain corresponding to a single FIB-SEM slice:
where is the depth coordinate, and is equal to the voxel edge length.
4. Results and Discussion
Figure 6 shows the sample-average specific free energy densities (interfacial energies) computed for microstructure samples obtained at different sites within the stack. As expected, it can be seen that the free energy decreased during the long-term performance experiment. The decay of free energy—that is, the difference between the interfacial free energy in the brand new cell (reference) sample, and in the post-degradation samples—can be used as an estimate of the degradation rate. The free energy decrease is largely related to the drop of the specific surface area. As seen in Figure 6, the most significant decrease was observed for the middle cell samples. On the other hand, the post-degradation values of free energy density for the top cell and the bottom cells decreased to a lesser extent. The middle cell, and the top cell appear to have little variation of F among the sampling sites. On the other hand, the downstream side of the bottom cell seems to have experienced a higher degree of decay, compared to its upstream side, and its center.
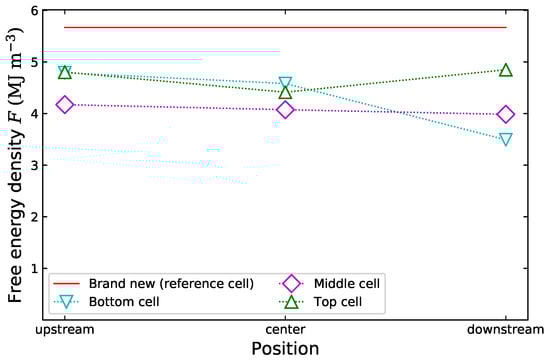
Figure 6.
Comparison of the total average free energy density in samples from cells after degradation to the total free energy in samples from a brand new (reference) cell.
It is interesting to compare these results to the increase of anisotropy, another process linked to the microstructure evolution. The quantitative anisotropy factor was discussed in Section 2. The results of anisotropy studies, which were previously published by Brus et al. [4], showed that the middle cell experienced the greatest increase of the anisotropy factor. Similarly, the current analysis shows that F decreased the most for the middle cell. Furthermore, the downstream side of the bottom cell was shown to become more anisotropic than its center and upstream sampling sites [4]. This is analogous to the higher decrease of the free energy density in the bottom cell’s downstream sample reported in the current study.
The relationship between the phase distribution of the postdegradation microstructures and their electrochemical performance was discussed in our previous paper [5] for a similar planar SOFC stack. In that case, the reduction of the cell’s overpotential was observed due to the decrease of pore tortuosity—a development predicted by several PFM-based analyses reported on in the literature. However, in our study [5], it was shown that the middle cell experienced less enhancement than the extreme cells.
Distributions of the interfacial free energy F in different cross sections of the microstructure samples are displayed in Figure 7. Locations Upstream (near the inlet), at the Center, and Downstream (near the outlet) of each cell (post-degradation) are considered. Additionally, data series refers to the local values of the interfacial free energy in the samples from the brand new, reference cell. It can be seen that the distribution of local free energy within the sample (computed as the integral of the free energy Functional (9) over a single “slice”, see Equation (13)) is more evenly distributed in most of the samples recovered after the long term performance experiment. The depth of the sample refers to the coordinate in the direction of FIB-SEM milling. In general, the local values in post-degradation samples do not exceed the local values in pre-degradation samples for a given z-axis position within the sample. While the sample sizes vary, the size of each representative volume used in the study is ∼ which is considered a sufficient size for the purpose of microstructural analysis. The interfacial energy distribution in the middle cell samples appears to be more evenly distributed along the depth direction than in the top, bottom, and the reference cells. By contrast, the reference sample appears to have its free energy distribution skewed towards the greater depths of the sample. The pre- and post-degradation energy density comparison is supplemented by the decomposition of the free energy into its contributors: the interfacial energy of the Ni-YSZ interface, the interfacial energy of the Ni-Pore interface, and the interfacial energy of the YSZ-Pore interface. The results are shown in Figure 8. It can be seen that the relative contribution of the Ni-YSZ and especially the Ni-Pore interfaces decreases for the post-degradation cells. This is an expected result, since the nickel coarsening and agglomeration is the main mechanism for the microstructural free energy reduction. However, at the same time, the YSZ-Pore interfacial energy increases—as the nickel particles move and change shape, more YSZ surface is uncovered. This process is particularly apparent for the near-inlet sample of the top cell, where the increase of the YSZ-Pore interfacial energy nearly compensates for the loss of the total free energy. More decay of F is observed in the near-TPB elements, as a result of the Triple Phase boundary deterioration (previously discussed by Brus et al. [2]).The decline of interfacial energy was most pronounced in the top cell samples, and least pronounced in the bottom cell, suggesting some relation to the temperature distribution.
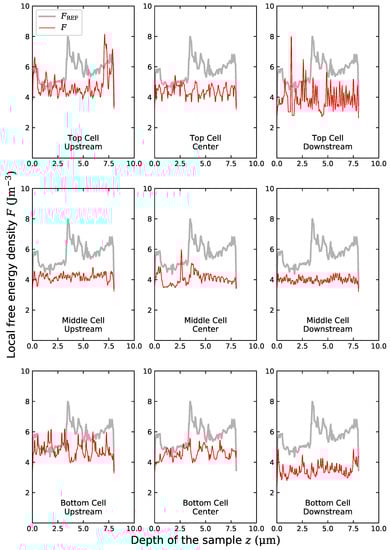
Figure 7.
Local free energy density distribution in the reference cell (), and in the samples recovered after the long term performance experiment (F).
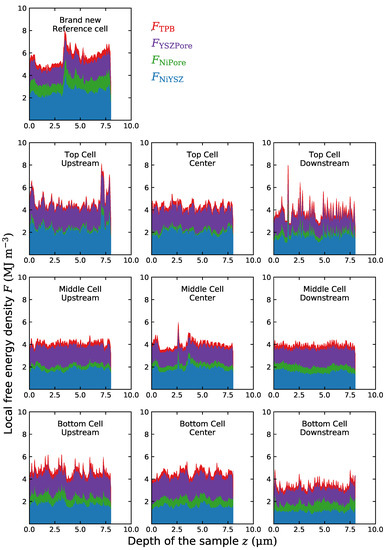
Figure 8.
Local free energy F composition in the reference cell, and in the samples recovered after the long term performance experiment—contributions of Ni-YSZ, Ni-Pore and YSZ-Pore interface elements, and the Triple Phase Boundary (TPB) elements.
5. Conclusions
In this paper, the microstructure data from a stack recovered after a long-term performance experiment was analyzed by comparing the microstructural free energy functional values for microstructures investigated before, and after the durability study. Interestingly, the degradation rate does not seem to be connected to the local temperature. The middle cell, rather than the top cell, experienced the most total free energy decay, despite Nickel-Pore surfacial energy component deteriorating more for the hotter cells. Additionally, location in proximity to either inlet, or outlet appear to have some influence, as the downstream location in the bottom cell experienced more decay of the free energy. It is possible that the irreversibilities related to channel concentrations of hydrogen and steam contributed to the observed tendencies. Yet, the samples from the middle cell, the cell with the most free energy decay—did not exhibit greater deterioration for the downstream location. The greatest rate of degradation was observed for the cell which was previously shown to exhibit the highest degree of anisotropy.
Author Contributions
Conceptualization, T.A.P.; methodology, T.A.P.; software, T.A.P.; validation, T.A.P., G.B., J.S.S.; formal analysis, G.B. (experimental), T.A.P. (numerical); investigation, G.B. (experimental), T.A.P. (numerical); resources, G.B.; data curation, G.B., T.A.P.; writing—original draft preparation, T.A.P.; writing—review and editing, T.A.P., G.B., J.S.S.; visualization, G.B., T.A.P.; supervision, J.S.S.; project administration, G.B.; funding acquisition, G.B. All authors have read and agreed to the published version of the manuscript.
Funding
This research were supported by National Research Center of Poland, program SONATA-10, Grant No. UMO-2015/19/D/ST8/00839. The authors acknowledge the support of the Initiative for Excellence—Research University Project at AGH University of Science and Technology and AGH Grant No. 16.16.210.476.
Institutional Review Board Statement
Not applicable.
Informed Consent Statement
Not applicable.
Data Availability Statement
All data available on request.
Acknowledgments
Matplotlib Python library was used for data visualization [24]. AVIZO (Thermo Fisher Scientific) software was used for image processing. MATLAB (Mathworks) was used for some computations.
Conflicts of Interest
The authors declare no conflict of interest. The funders had no role in the design of the study; in the collection, analyses, or interpretation of data; in the writing of the manuscript, or in the decision to publish the results.
Sample Availability
Samples are available on reasonable from the authors.
Abbreviations
The following abbreviations are used in this manuscript:
| DPB | Double Phase Boundary |
| FIB-SEM | Focused Ion Beam Scanning Electron Microscopy |
| MSTB | Modular Stack Testing Bench |
| PFM | Phase Field Model |
| SOFC | Solid Oxide Fuel Cell |
| TEM | Transmission Electron Microscopy |
| TPB | Triple Phase Boundary |
References
- Monaco, F.; Hubert, M.; Vulliet, J.; Montinaro, D.; Ouweltjes, J.P.; Cloetens, P.; Piccardo, P.; Lefebvre-Joud, F.; Laurencin, J. Impact of Microstructure and Polarization on the Degradation of Ni-YSZ Electrode: An Experimental and Modeling Approach. ECS Trans. 2019, 91, 653–664. [Google Scholar] [CrossRef]
- Brus, G.; Iwai, H.; Sciazko, A.; Saito, M.; Yoshida, H.; Szmyd, J.S. Local evolution of anode microstructure morphology in a solid oxide fuel cell after long-term stack operation. J. Power Sources 2015, 288, 199–205. [Google Scholar] [CrossRef]
- Brus, G.; Iwai, H.; Otani, Y.; Saito, M.; Yoshida, H.; Szmyd, J.S. Local Evolution of Triple Phase Boundary in Solid Oxide Fuel Cell Stack after Long-term Operation. Fuel Cells 2015, 15, 545–548. [Google Scholar] [CrossRef]
- Brus, G.; Iwai, H.; Szmyd, J.S. An Anisotropic Microstructure Evolution in a Solid Oxide Fuel Cell Anode. Nanoscale Res. Lett. 2020, 15, 3. [Google Scholar] [CrossRef] [PubMed]
- Prokop, T.A.; Berent, K.; Mozdzierz, M.; Szmyd, J.S.; Brus, G. A Three-Dimensional Microstructure-Scale Simulation of a Solid Oxide Fuel Cell Anode—The Analysis of Stack Performance Enhancement After a Long-Term Operation. Energies 2019, 12, 4784. [Google Scholar] [CrossRef]
- Chen, L.Q. Phase-Field Models for Microstructure Evolution. Annu. Rev. Mater. Res. 2002, 32, 113–140. [Google Scholar] [CrossRef]
- Allen, S.; Cahn, J. Ground state structures in ordered binary alloys with second neighbor interactions. Acta Metall. 1972, 20, 423–433. [Google Scholar] [CrossRef]
- Cahn, J.W.; Hilliard, J.E. Free Energy of a Nonuniform System. I. Interfacial Free Energy. J. Chem. Phys. 1958, 28, 258–267. [Google Scholar] [CrossRef]
- Bishop, C.M.; Craig Carter, W. Relating atomistic grain boundary simulation results to the phase-field model. Comput. Mater. Sci. 2002, 25, 378–386. [Google Scholar] [CrossRef]
- Bhattacharyya, S.; Sahara, R.; Ohno, K. A first-principles phase field method for quantitatively predicting multi-composition phase separation without thermodynamic empirical parameter. Nat. Commun. 2019, 10, 3451. [Google Scholar] [CrossRef] [PubMed]
- Wang, S.; Guo, Z.; Kang, J.; Zou, M.; Li, X.; Zhang, A.; Du, W.; Zhang, W.; Lee, T.L.; Xiong, S.; et al. 3D Phase Field Modeling of Multi-Dendrites Evolution in Solidification and Validation by Synchrotron X-ray Tomography. Materials 2021, 14, 520. [Google Scholar] [CrossRef] [PubMed]
- Guo, Y.; Zhang, L.; Zhu, G.; Yao, J.; Sun, H.; Song, W.; Yang, Y.; Zhao, J. A Pore-Scale Investigation of Residual Oil Distributions and Enhanced Oil Recovery Methods. Energies 2019, 12, 3732. [Google Scholar] [CrossRef]
- Chen, H.Y.; Yu, H.C.; Scott Cronin, J.; Wilson, J.R.; Barnett, S.A.; Thornton, K. Simulation of coarsening in three-phase solid oxide fuel cell anodes. J. Power Sources 2011, 196, 1333–1337. [Google Scholar] [CrossRef]
- Lei, Y.; Cheng, T.L.; Wen, Y.H. Phase field modeling of microstructure evolution and concomitant effective conductivity change in solid oxide fuel cell electrodes. J. Power Sources 2017, 345, 275–289. [Google Scholar] [CrossRef]
- Jiao, Z.; Shikazono, N. Study on the effects of polarization on local morphological change of nickel at active three-phase-boundary using patterned nickel-film electrode in solid oxide fuel cell anode. Acta Mater. 2017, 135, 124–131. [Google Scholar] [CrossRef]
- Jiao, Z.; Shimura, T.; Shikazono, N. Numerical Assessment of SOFC Anode Polarization with Microstructure Evolution. ECS Trans. 2015, 68, 1281–1289. [Google Scholar] [CrossRef]
- Shimura, T.; He, A.; Shikazono, N. Evaluation of La0.57Sr0.38Co0.2Fe0.8O3-δ Electrode Performance Degradation Based on Three-Dimensional Microstructure Reconstruction and Electrochemical Simulation. J. Electrochem. Soc. 2019, 166, F821–F830. [Google Scholar] [CrossRef]
- Wang, Y.; Wu, C.; Du, Q.; Ni, M.; Jiao, K.; Zu, B. Morphology and performance evolution of anode microstructure in solid oxide fuel cell: A model-based quantitative analysis. Appl. Energy Combust. Sci. 2021, 5, 100016. [Google Scholar] [CrossRef]
- Lorensen, W.E.; Cline, H.E. Marching Cubes: A High Resolution 3D Surface Construction Algorithm. SIGGRAPH Comput. Graph. 1987, 21, 163–169. [Google Scholar] [CrossRef]
- Boettinger, W.J.; Warren, J.A.; Beckermann, C.; Karma, A. Phase-Field Simulation of Solidification. Annu. Rev. Mater. Res. 2002, 32, 163–194. [Google Scholar] [CrossRef]
- Nahor, H.; Meltzman, H.; Kaplan, W.D. Ni–YSZ(111) solid–solid interfacial energy. J. Mater. Sci. 2014, 49, 3943–3950. [Google Scholar] [CrossRef]
- Liu, S.S.; Saha, L.C.; Iskandarov, A.; Ishimoto, T.; Yamamoto, T.; Umeno, Y.; Matsumura, S.; Koyama, M. Atomic structure observations and reaction dynamics simulations on triple phase boundaries in solid-oxide fuel cells. Commun. Chem. 2019, 2, 48. [Google Scholar] [CrossRef]
- Boyer, F.; Lapuerta, C. Study of a three component Cahn-Hilliard flow model. ESAIM M2AN 2006, 40, 653–687. [Google Scholar] [CrossRef]
- Hunter, J.D. Matplotlib: A 2D graphics environment. Comput. Sci. Eng. 2007, 9, 90–95. [Google Scholar] [CrossRef]
Publisher’s Note: MDPI stays neutral with regard to jurisdictional claims in published maps and institutional affiliations. |
© 2021 by the authors. Licensee MDPI, Basel, Switzerland. This article is an open access article distributed under the terms and conditions of the Creative Commons Attribution (CC BY) license (https://creativecommons.org/licenses/by/4.0/).