Article

Economic Assessment of a PV Hybridized Linear Fresnel Collector Supplying Air Conditioning and Electricity for Buildings

by
Alaric Christian Montenon
* and
Costas Papanicolas
Energy, Environment and Water Research Center, The Cyprus Institute, 20 Konstantinou Kavafi Street, Aglantzia, Nicosia 2121, Cyprus
*
Author to whom correspondence should be addressed.
Energies 2021, 14(1), 131; https://doi.org/10.3390/en14010131
Submission received: 1 November 2020 / Revised: 23 December 2020 / Accepted: 24 December 2020 / Published: 29 December 2020
(This article belongs to the Special Issue Solar Hybrid Power Systems)

Abstract

:
The present study evaluates the potential upgrade of a Linear Fresnel Reflector (LFR) collector at the Cyprus Institute (CyI) with photovoltaics via the calculation of the Levelized Cost Of Heat (LCOH). For over 4 years the collector has been supplying heating and cooling to the Novel Technologies Laboratory (NTL) of the Cyprus Institute (CyI). Extensive measurements have been carried out both on the LFR and NTL to render real numbers in the computations. This hybridization would be undertaken with the installation of PV arrays under mirrors, so that the collector is able to either reflect direct radiation to the receiver to process heat or to produce electricity directly in the built environment. The main objective is the decrease of the LCOH of Linear Fresnel collectors, which hinders their wider deployment, while air conditioning demand is globally booming. The results show that the LCOH for a small LFR to supply air conditioning is high, c€25.2–30.1 per kWh, while the innovative PV hybridization proposed here decreases it. The value of the study resides in the real data collected in terms of thermal efficiency, operation, and maintenance.

1. Introduction

Air conditioning demand is already exploding worldwide and by 2050, according to the International Energy Agency (IEA), energy demand for space cooling could more than triple [1], accounting for more than 12% of the world’s CO2 emissions. There is therefore a need to enhance energy efficiency, especially with the use of renewable sources. This is particularly true of solar energy, which is abundantly available in places where cooling demand is growing, such as Cyprus. Although this study focuses primarily on solar thermal technology with embedded storage to supply heat to an absorption chiller, solar PVs can also supply heating and cooling with the use of electric heat-pumps, with batteries in between (electricity to thermal energy) and this aspect will be discussed. In Cyprus, in 2009, the Cyprus University of Technology (CUT) pioneered research on solar-assisted air conditioning involving evacuated tubes with Li-Br absorption chillers to produce cooling [2]. A system was built on their campus: A pilot for hotels where the payback time was estimated from 3 to 7 years [3]. As a single effect absorption chiller operates at temperatures lower than 95 °C, evacuated tubes were sufficient and did not require any concentration. For an absorption chiller with a higher Coefficient of Performance (COP), stationary concentration may be added, such as a Compound Parabolic Concentrator (CPC) as studied in 2017 by Xu and Wang [4] on TRNSYS [5] for a variable effect absorption chiller with TRNSYS. Solar air conditioning can also be achieved with Parabolic Trough Collectors (PTC) as is the case in Jordan [6,7], where the 85 kW (peak thermal power) collector co-generates electricity with a steam-turbine. In environmental conditions similar to those of Cyprus, Chahine et al. [8] studied the integration of a PTC in Beirut, Lebanon. Solar air-conditioning with Linear Fresnel Reflector (LFR) combined with a double effect absorption chiller was studied by Montero-Izquierdo et al. [9] in 2011, and the efficiency of the thermal process was estimated to be 50%. In 2020, Alahmer and Ajib [10] identified a range of options for cooling with solar thermal energy. Cooling may theoretically be possible with flat plate collectors with the operational temperature ranging between 70–120 °C, in association with single effect absorption chillers. However their COP is low (<0.7). Double effect absorption chillers with higher COP (>1) can be associated with evacuated tubes as their operational temperatures vary between 100 and 150 °C. However, CPCs, PTCs, and LFRs can operate at temperatures of 250–300 °C, enabling the use of a triple effect absorption chiller with a promising COP (>1.6) and efficient thermal storage in between. Cooling with LFRs has been the scope of a couple of prototypes around the world, listed in Table 1. Few projects so far around the world rely on LFR technology for air conditioning and reportedly, no project has been commissioned within the last 3 years, due especially to the high capital costs. But this might evolve worldwide following the COP21 held in Paris in 2015 where participating countries agreed to limit the increase in global average temperature to be well below 2 °C, known also as the Paris Agreement [11]. This could lead to the intensification of the use of renewable sources such as solar energy, exacerbated by the global growing demand for cooling due to climate change. At the Cyprus regional level, the MENA (Middle East and North Africa) will be heavily impacted as predicted by Lelieveld et al. [12] in 2016, with an even higher temperature increase than in the rest of the world by the end of the 21st century. However, on the other hand, the solar resource is prominent in the MENA region. This means that regionally, the issue of thermal comfort will be tackled by solar technology where concentration technologies such as LFRs will stand in the front line as close as possible to the end user in the built environment. In order to evaluate the economic performance of such solar-assisted systems, LCOH (Levelized Cost of Heat) [13] is a relevant tool.
However, regarding small facilities (<1 MWth of power capacity) such as those used for heat processing or air conditioning, there is very little available information on LCOH in the literature, especially as a result of operational data. Dedicated studies are usually conducted within feasibility assessments, and are therefore based on projected numbers, somehow idealized, that will differ in the running platform. Yet data are more abundant on the Levelized Cost of Electricity or Energy (LCOE), which applies for larger CSP (Concentrated Solar Power) facilities (>50 MWe of capacity). In the case of tower technology for instance, Zhuang et al. [16] in 2019, estimated the LCOE of a 100 MWe power capacity plant to be around c€30–76 per kWhe (sic 2.33–6.0 RMB) in five different locations in China, depending on the local annual Direct Normal Irradiance (DNI) available. Regarding linear receiver technologies, in 2020, Vaderobli et al. [17] evaluated the cost of electricity generated by a PTC with a capacity of 100 MWe in five different locations in the United States. Based on stochastic optimization, results ranged around c€8.5–20 per kWhe (sic $0.10–0.24) depending once more on the local solar conditions. Outcomes were still not based on actual operational data, but instead on projections for large power plants. Regarding small facilities for heat processing, Wahed et al. [18] led an analysis on solar heat processing with temperatures varying between 60 °C and 80 °C in tropical areas such as Malaysia, Singapore, Indonesia, and Thailand using TRNSYS software [5]. The final LOCH varied roughly between c€4.2–7.6 per kWhth (sic $0.05–0.08). As such levels of temperatures do not involve concentration, costs are supposed to be lower than if concentrations were involved. In 2013, Gabbrielli et al. [19] established the LCOH for small LFRs of 500 m2 of a reflective area. Data for that study were shared by facility managers (i.e., third parties). The study projected the LCOH by modeling the collectors and thermal efficiency for working temperatures of 140 °C and 200 °C. LCOH ranged between c€3–5 per kWhth. In 2017, Lillo et al. [20] evaluated that the LCOE for CPC technology varies between c€2.5–16.9, for LFR between c€4.6–7.7, and for PTC between c€6.4–15.4. Although, final energies are not the same, electric or purely thermal, there is a gap between all the examples of electric facilities and the heat processing ones, as large facilities are expected to be more economically advantageous due to scaling factors. Furthermore, data are scattered.
In the continuation of the projections established by [
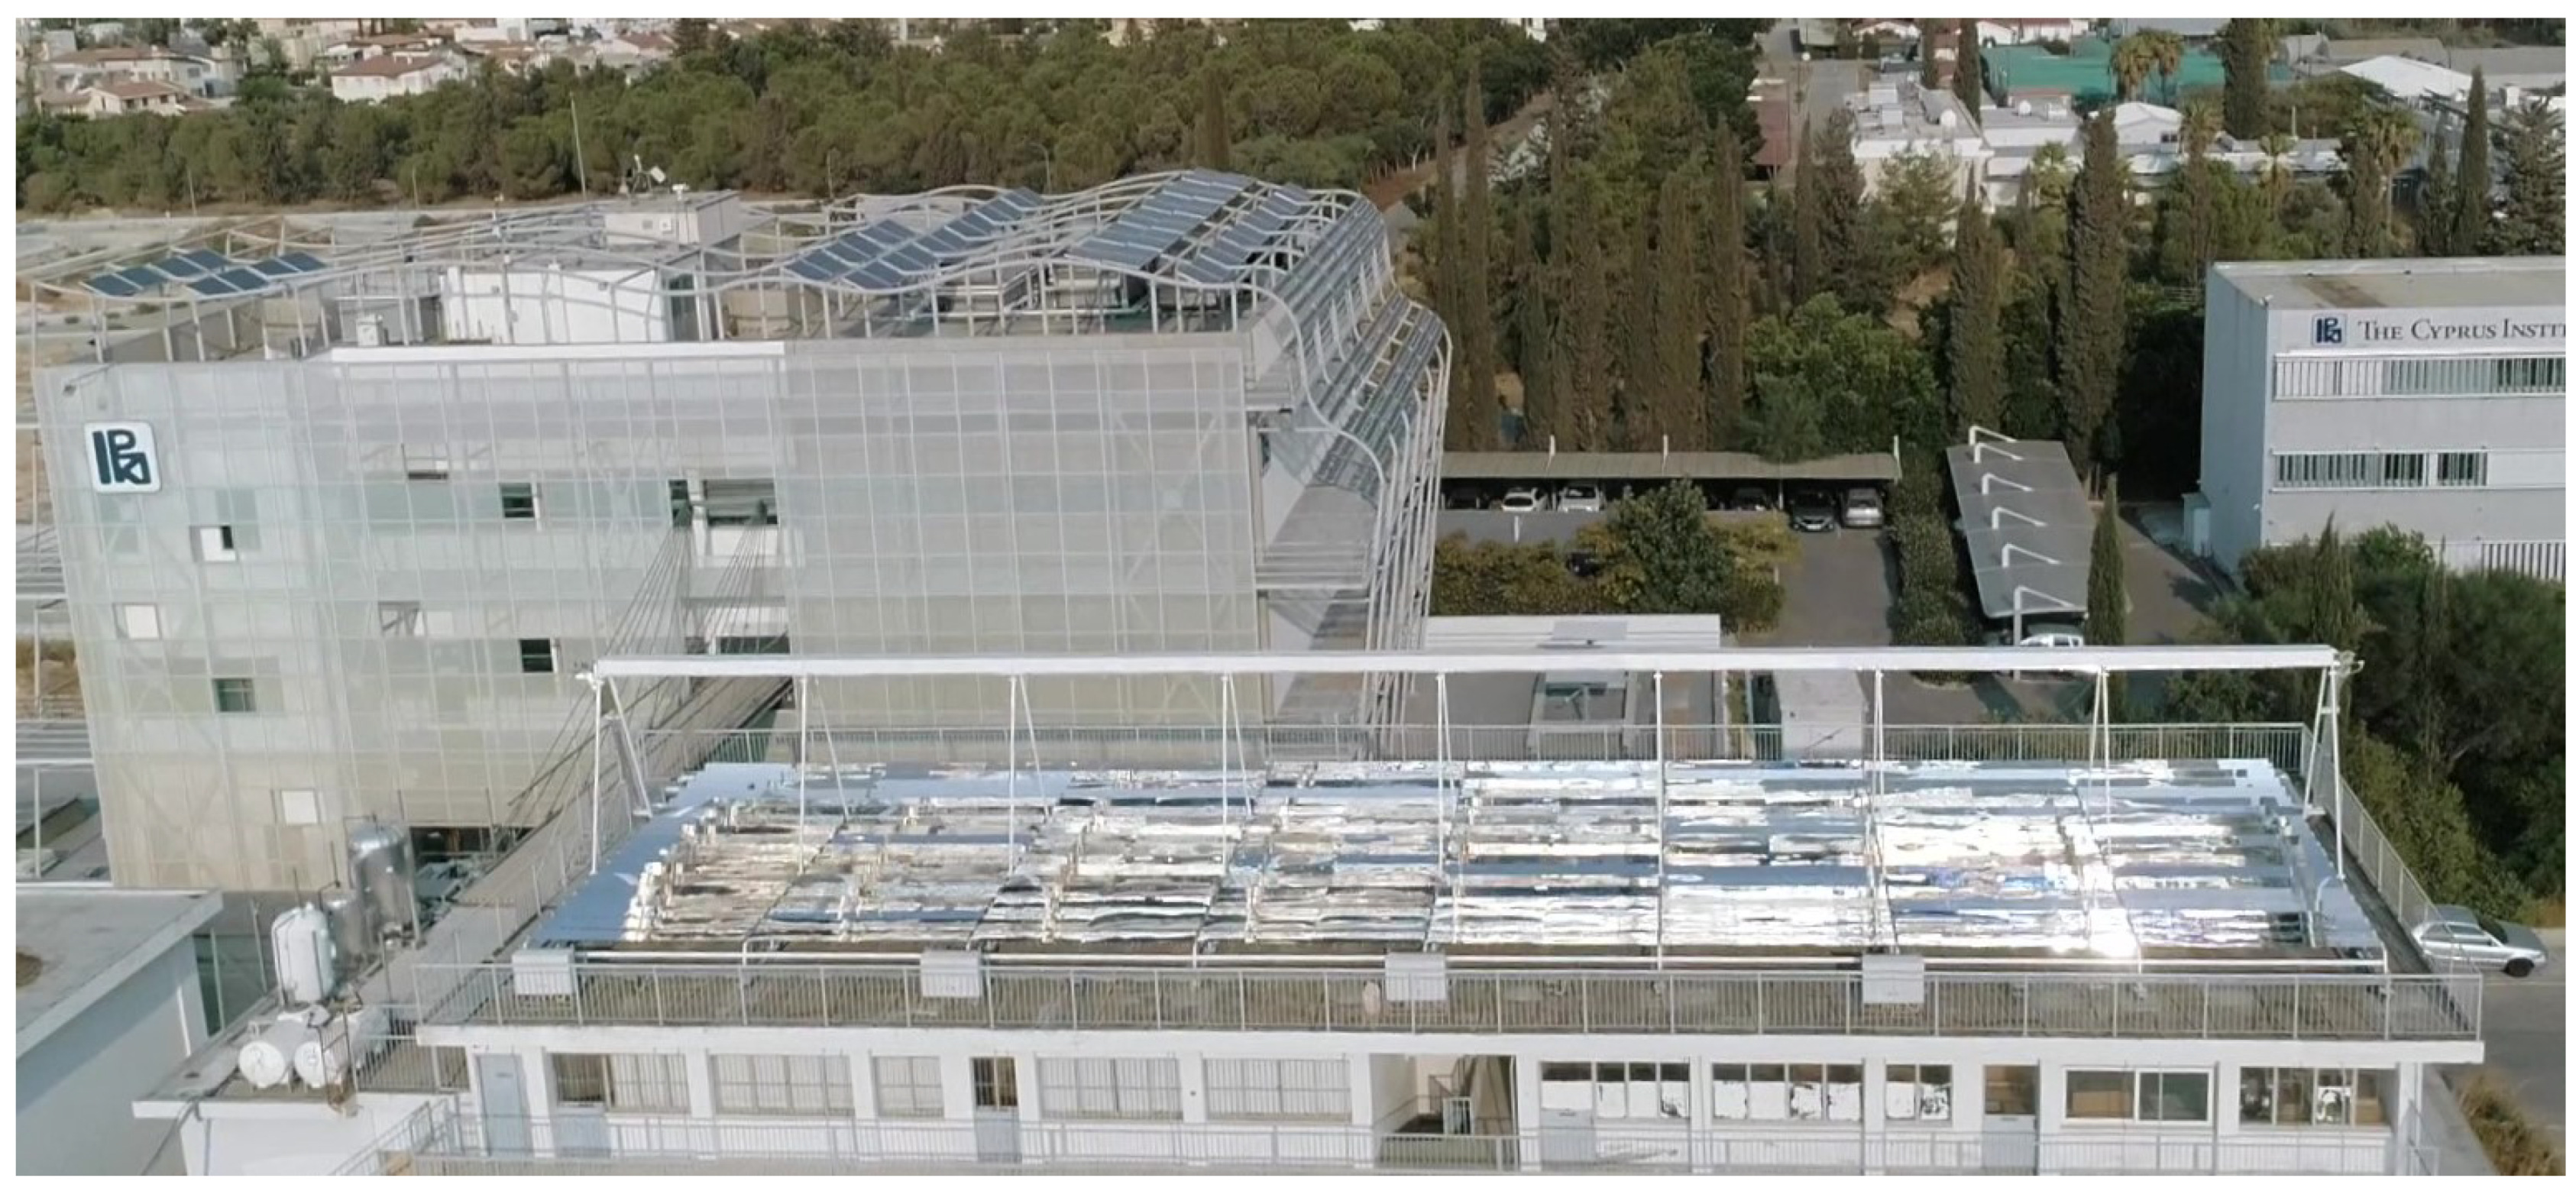
19] for working temperature below 200 °C, the Cyprus Institute (CyI) led 4 years of experimentation in order to extract an LCOH as close as possible to reality. Presently, the CyI LFR has been supplying heating and cooling to the adjacent Novel Technologies Laboratory (NTL) building since July 2016 [21].
Figure 1 displays the collector in the foreground with the NTL in the background, on the left. In Mediterranean climates such as the one in Cyprus, limiting the use of the LFR concentrator for the sole purpose of air conditioning leads to long periods of standby, such as in spring or autumn, when the ambient temperature is neither hot nor cold. Worse, a collector that is tethered to an office-type building only operates during weekly working days (thus excluding at least 28.5% of the calendar year). In the case of NTL, the non-occupancy periods reach a third of the calendar year. This skyrockets the cost per kWh as the collector although available remains on standby. This point had also been raised in 2013 in the CUT study [3]: The solar cooling system is at a low power in summer, due to low occupancy, while the available solar resources are at their maximum. The aforementioned PTC in Jordan [
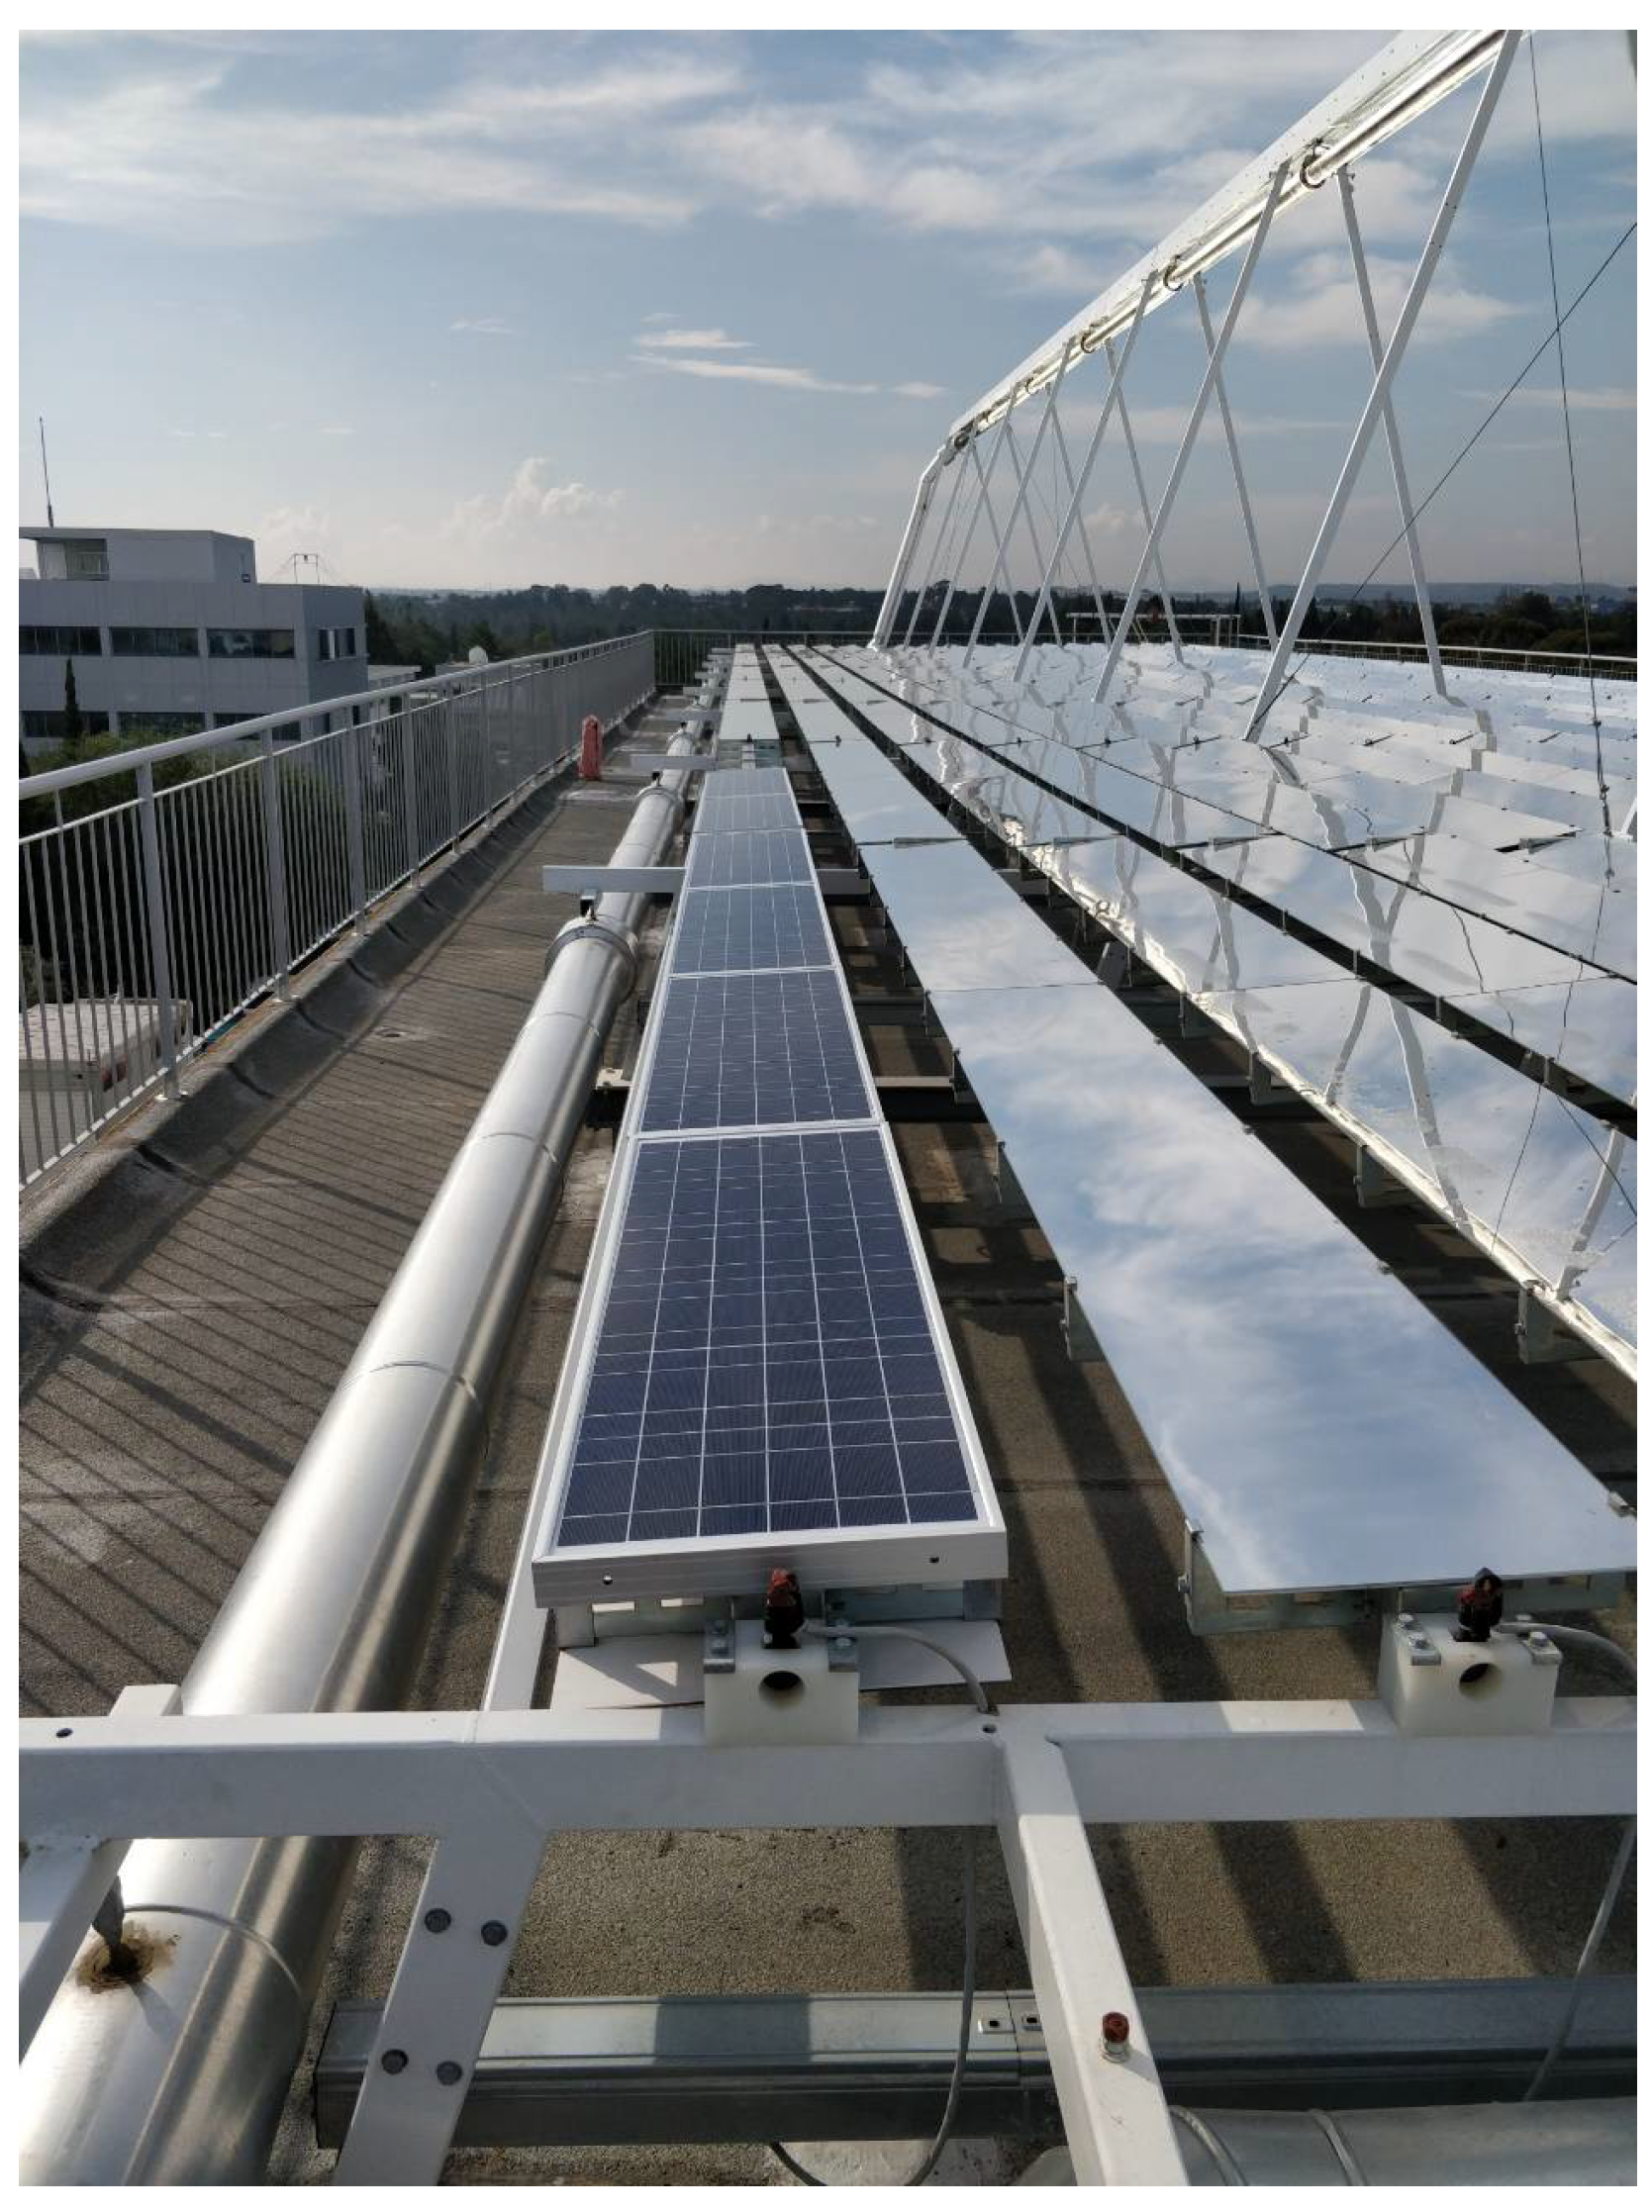
6] was also designed to co-generate electricity when air conditioning was not envisaged due to low demand. Since the tracker is available for long periods but unused, the present study analyses the relevance of hybridizing the current collector with photovoltaic panels fixed to the back of the primary mirrors, as exemplified for part for a single row in Figure 2.
Often the PVs and Concentration Solar Technologies (CSTs) are financially compared purely as if they were exclusively competing technologies. In 2017, Pérez-Aparicio et al. [22] led a comprehensive comparative study between PV and concentration technologies (LFR, PTC, and CPC) for the production of heat. In 2019, Roni et al. [23] demonstrated that electricity from CSP (PTCs and towers) was twice more expensive than from PVs (c€6 for PV vs c€12–13 per kWhe for CSP). As mutualization of both thermal and electric processes, Photovoltaic Thermal (PVT) collectors, are quite common especially at a low temperature operation. In the case of CPVT collectors, concentration is added, requiring the monitoring of the solar cells temperature. This presents also an opportunity to reuse the heat from the coolant fluid if any, allowing co-generation. In 2015 and in 2017, the authors in references [24,25,26] carried out thorough reviews of such hybrid systems. For cooling applications via absorption, as done presently in this study, temperatures at the outlet of the collector shall be higher than 90 °C. CPC technology is a clear competitor of LFR and PTC technologies for heat-processing as temperature levels can be reached by three types while operation and maintenance costs are in favor of CPCs, especially for non-tracking types [22]. Jiang et al. [27] in 2020 carried out a comprehensive review of CPCs, including potential PV hybrid types. Tripathi et al. [28] led the thermal modeling of a partially covered CPC collector with photovoltaic cells [28,29].The outlet temperature of the fluid reached up to 190 °C in summer, which makes it able to supply heat to an absorption chiller while in winter, thermal output can be directly supplied for space heating. In 2020, another lab test had been carried out by Carlini et al. [30] where PV cells were associated to a CPC with the cells reaching around 80 °C. In addition, in 2013, Ulavi et al. [31] proposed a non-tracking CPC with selective materials that concentrates part of the solar spectrum (infrared wavelengths) to the absorber tube and is transparent to other wavelengths (visible light). In 2016, Abdelhamid et al. [32] suggested mounting PV on a non-imaging secondary reflector for PTC application. This could be applied to CPC or LFR too. Non-imaging CPCs are also an important component of LFRs as secondary optics. Several authors in [33,34] have presented the concept of a roof integrated and glazed micro LFR, able to produce electricity and to transfer heat to a working fluid up to 220 °C, suitable for a cooling applications. In 2020, Codd et al. [35] developed a promising dish collector that is able to co-generate electricity with PV cells withstanding 110 °C of an operating temperature while the outlet fluid temperature reached 248 °C. Applying this in series would also allow the use of high performance absorption chillers for cooling. Like the aforementioned PVT examples, the hybrid Fresnel presented in Figure 2 will cogenerate electricity with the benefit of tracking on a single axis, instead of having fixed solar PV panels on a roof, as usually done or as proposed in reference [31]. This new collector at CyI will first supply air conditioning, if needed, with the use of the DNI when available and as per user demand from the NTL. At other times, it will produce electricity using global radiation for the NTL electric consumption. Notwithstanding, even when the collector operates in thermal mode, the collector can still produce a small amount of electricity with diffuse radiation. In the present study, the hybridization concerns an LFR. Despite there being higher costs than CPCs, LFRs have a better optical efficiency due to the tracking option. It has to be noted nonetheless that some tracking CPCs have been proposed as by Wang et al. [36] while efforts of cost optimization in optics have been carried out as published by Osório et al. [
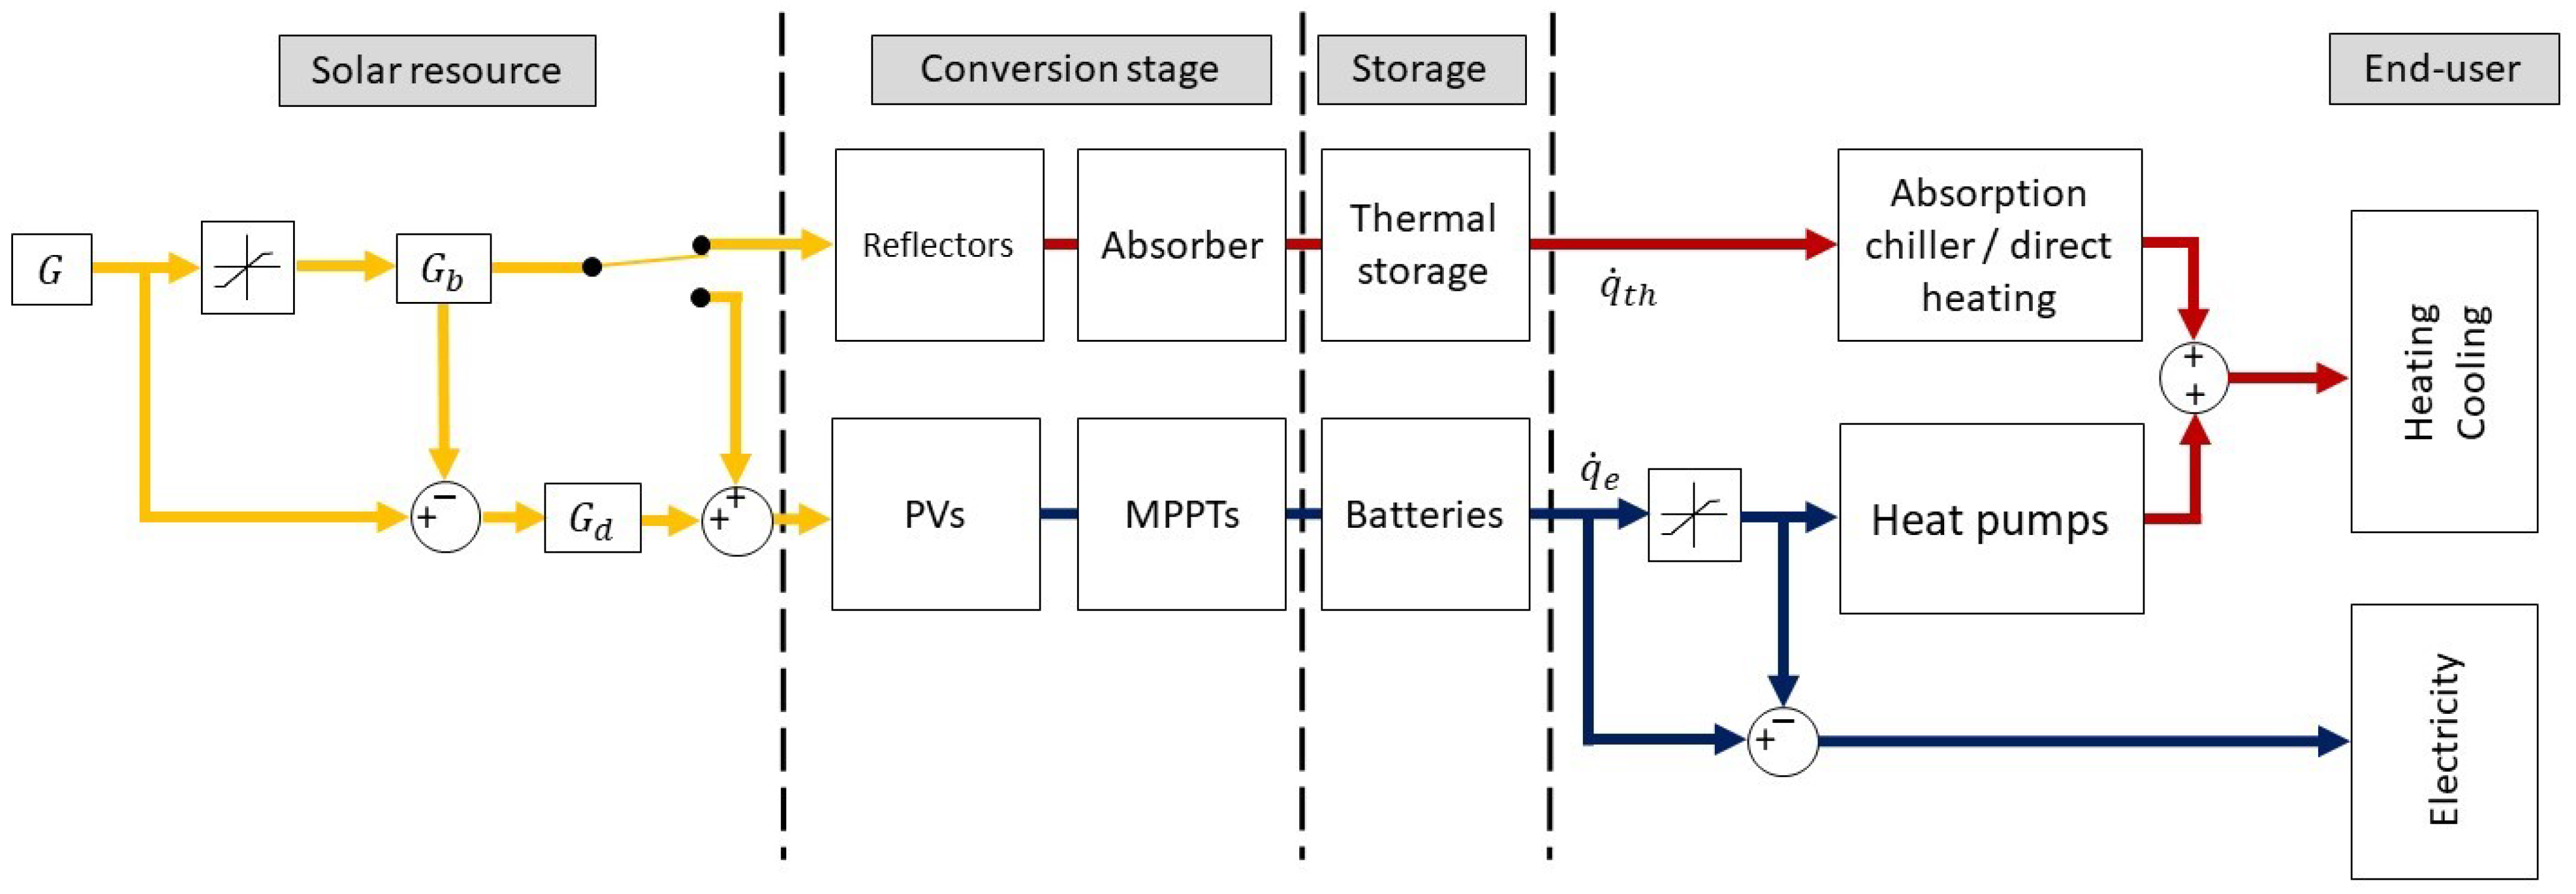
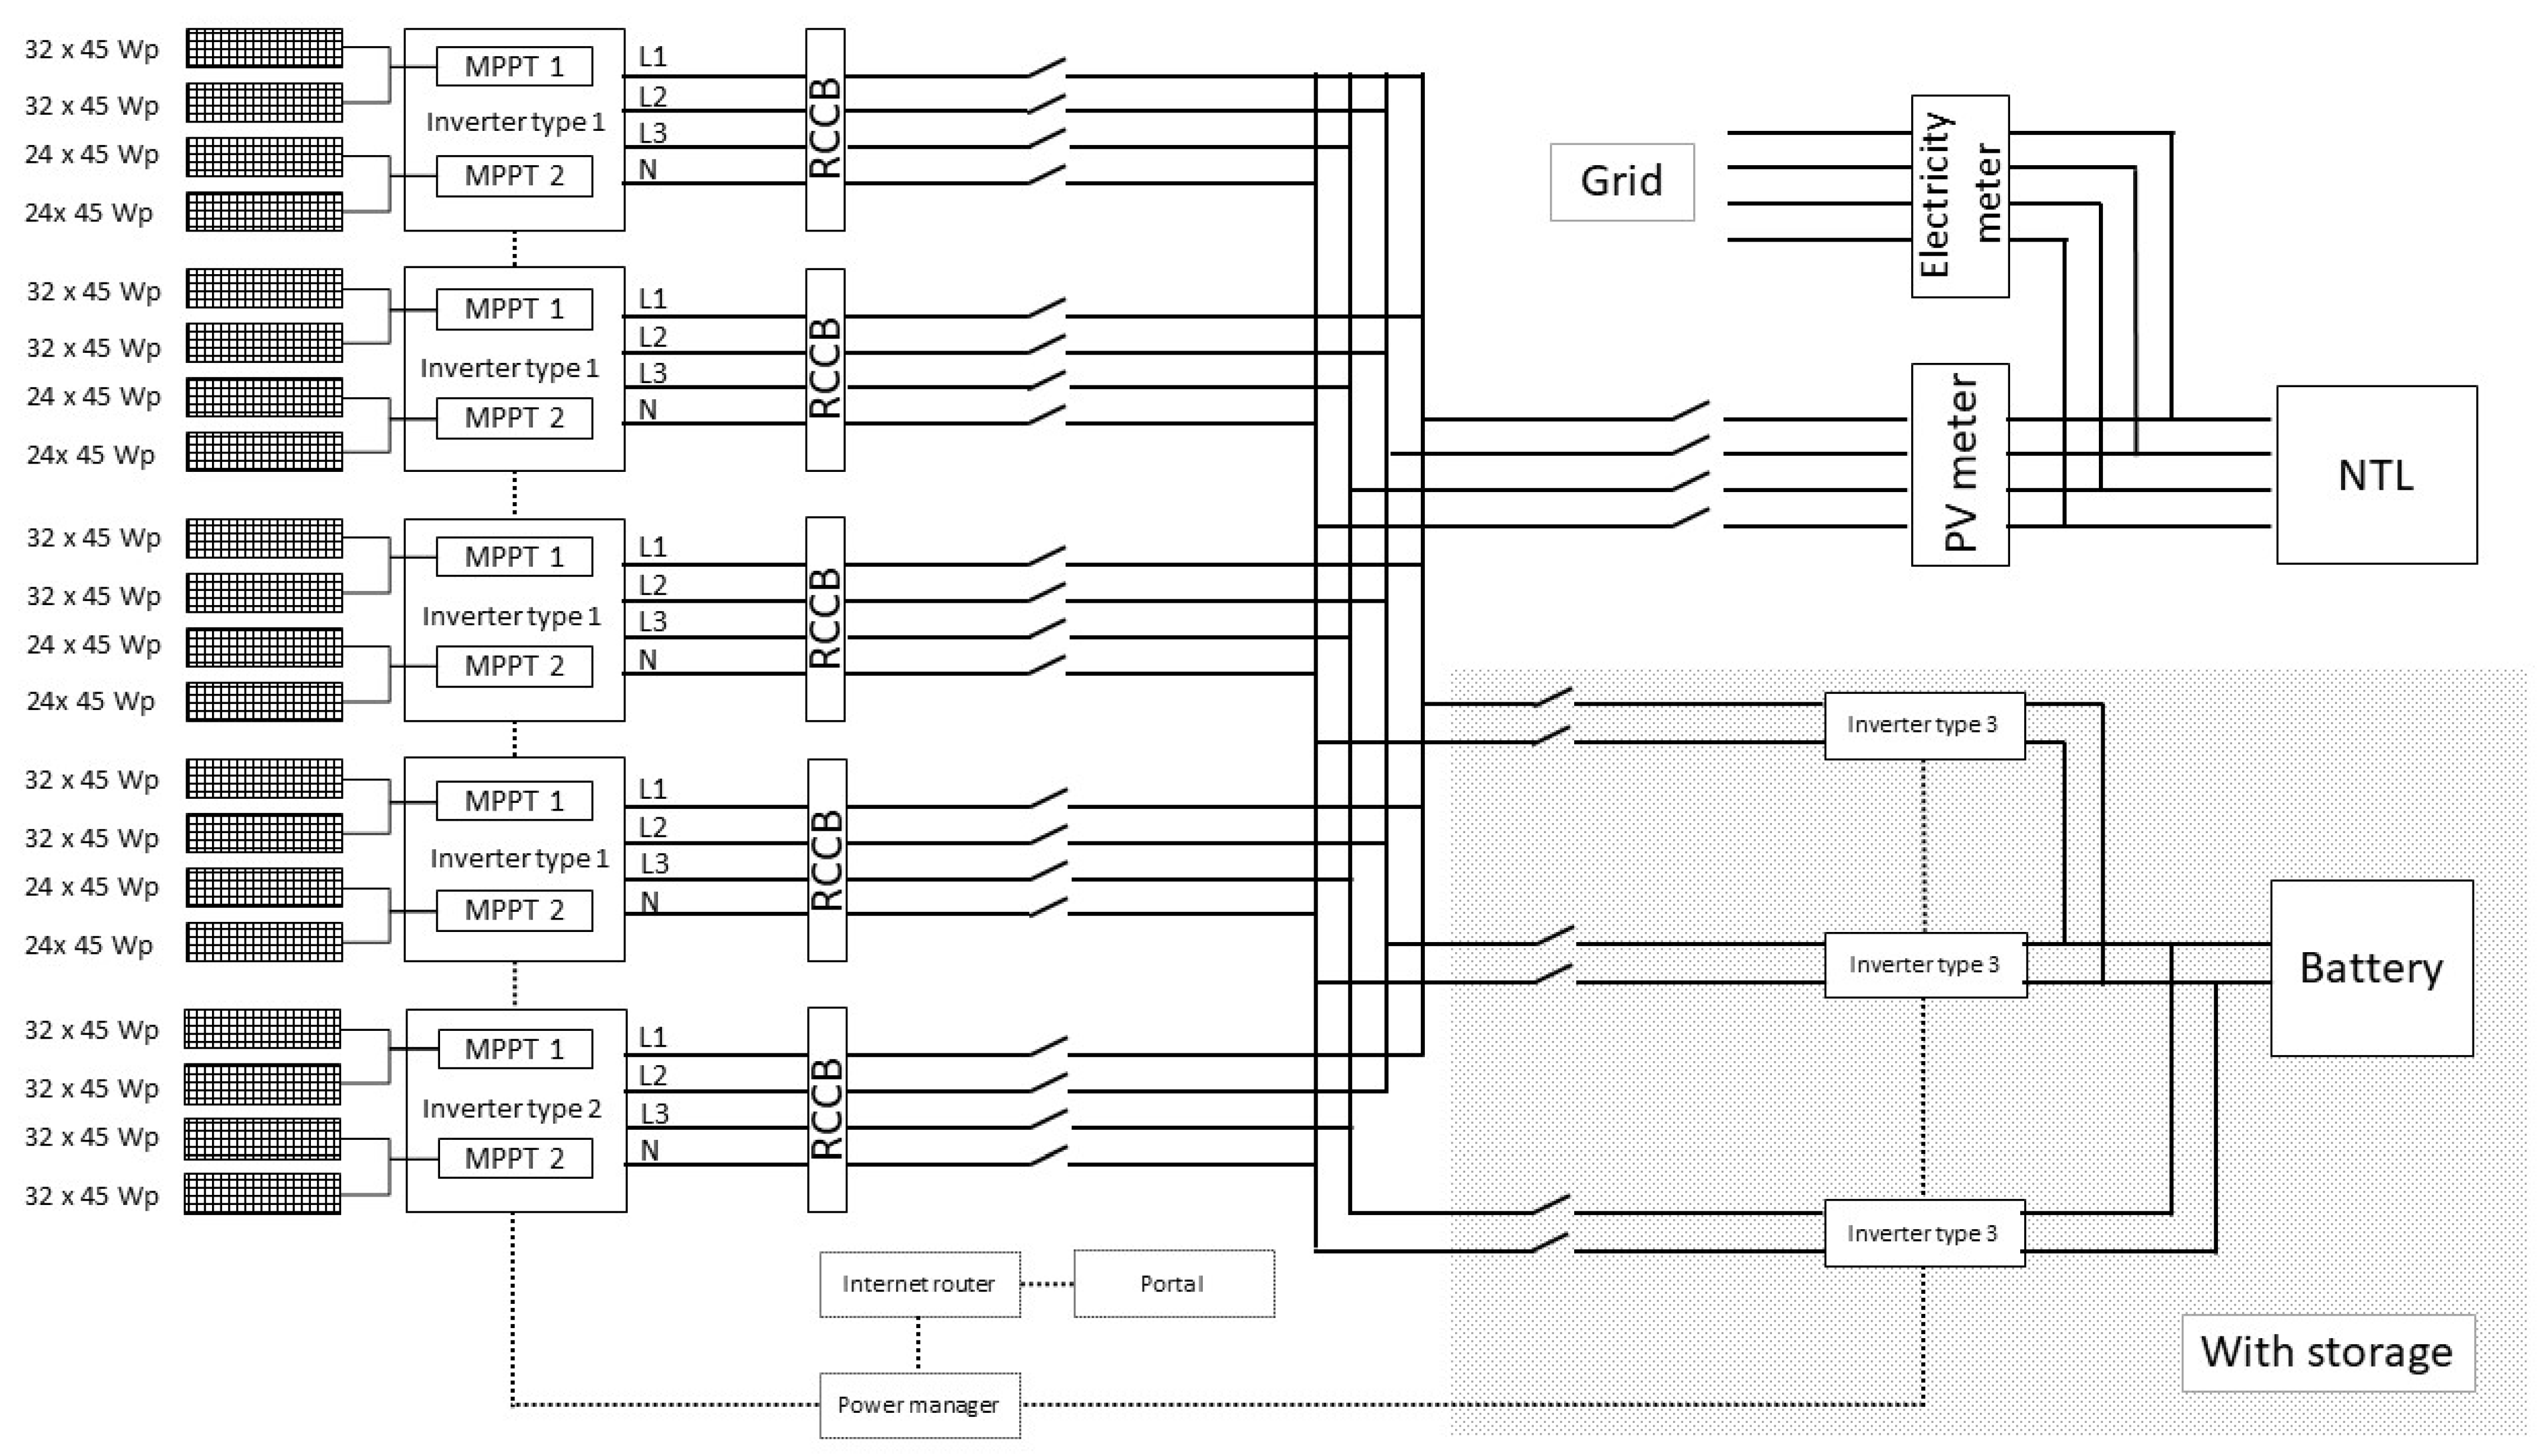
37]. The PV panels are not located at the focal point of the mirrors, but rather on the supporting structure, so the electric and heating processes are independent and do not interfere with each other. Thus when DNI is low or if space cooling is not required, the collector does not stop operating, it produces electricity instead. The collector can either produce electricity or heat depending on the end user demand or the solar resource quality. In CPVT systems, if the heat produced by the cells is not to be reused, this implies extra costs to handle the cooling process. The type of hybridizations presented above operate perfectly as long as both thermal and electric processes are to be needed or stored. In addition, the PV panels directly reuse global radiation, not solely the DNI as when they are associated to a secondary reflector. Moreover partial defocusing with a share of mirrors and PVs tracking the sun is possible. In the present case the electricity produced may either supply air conditioning with the heat-pump plus chillers or directly supply electric power to the building, as described in Figure 3.
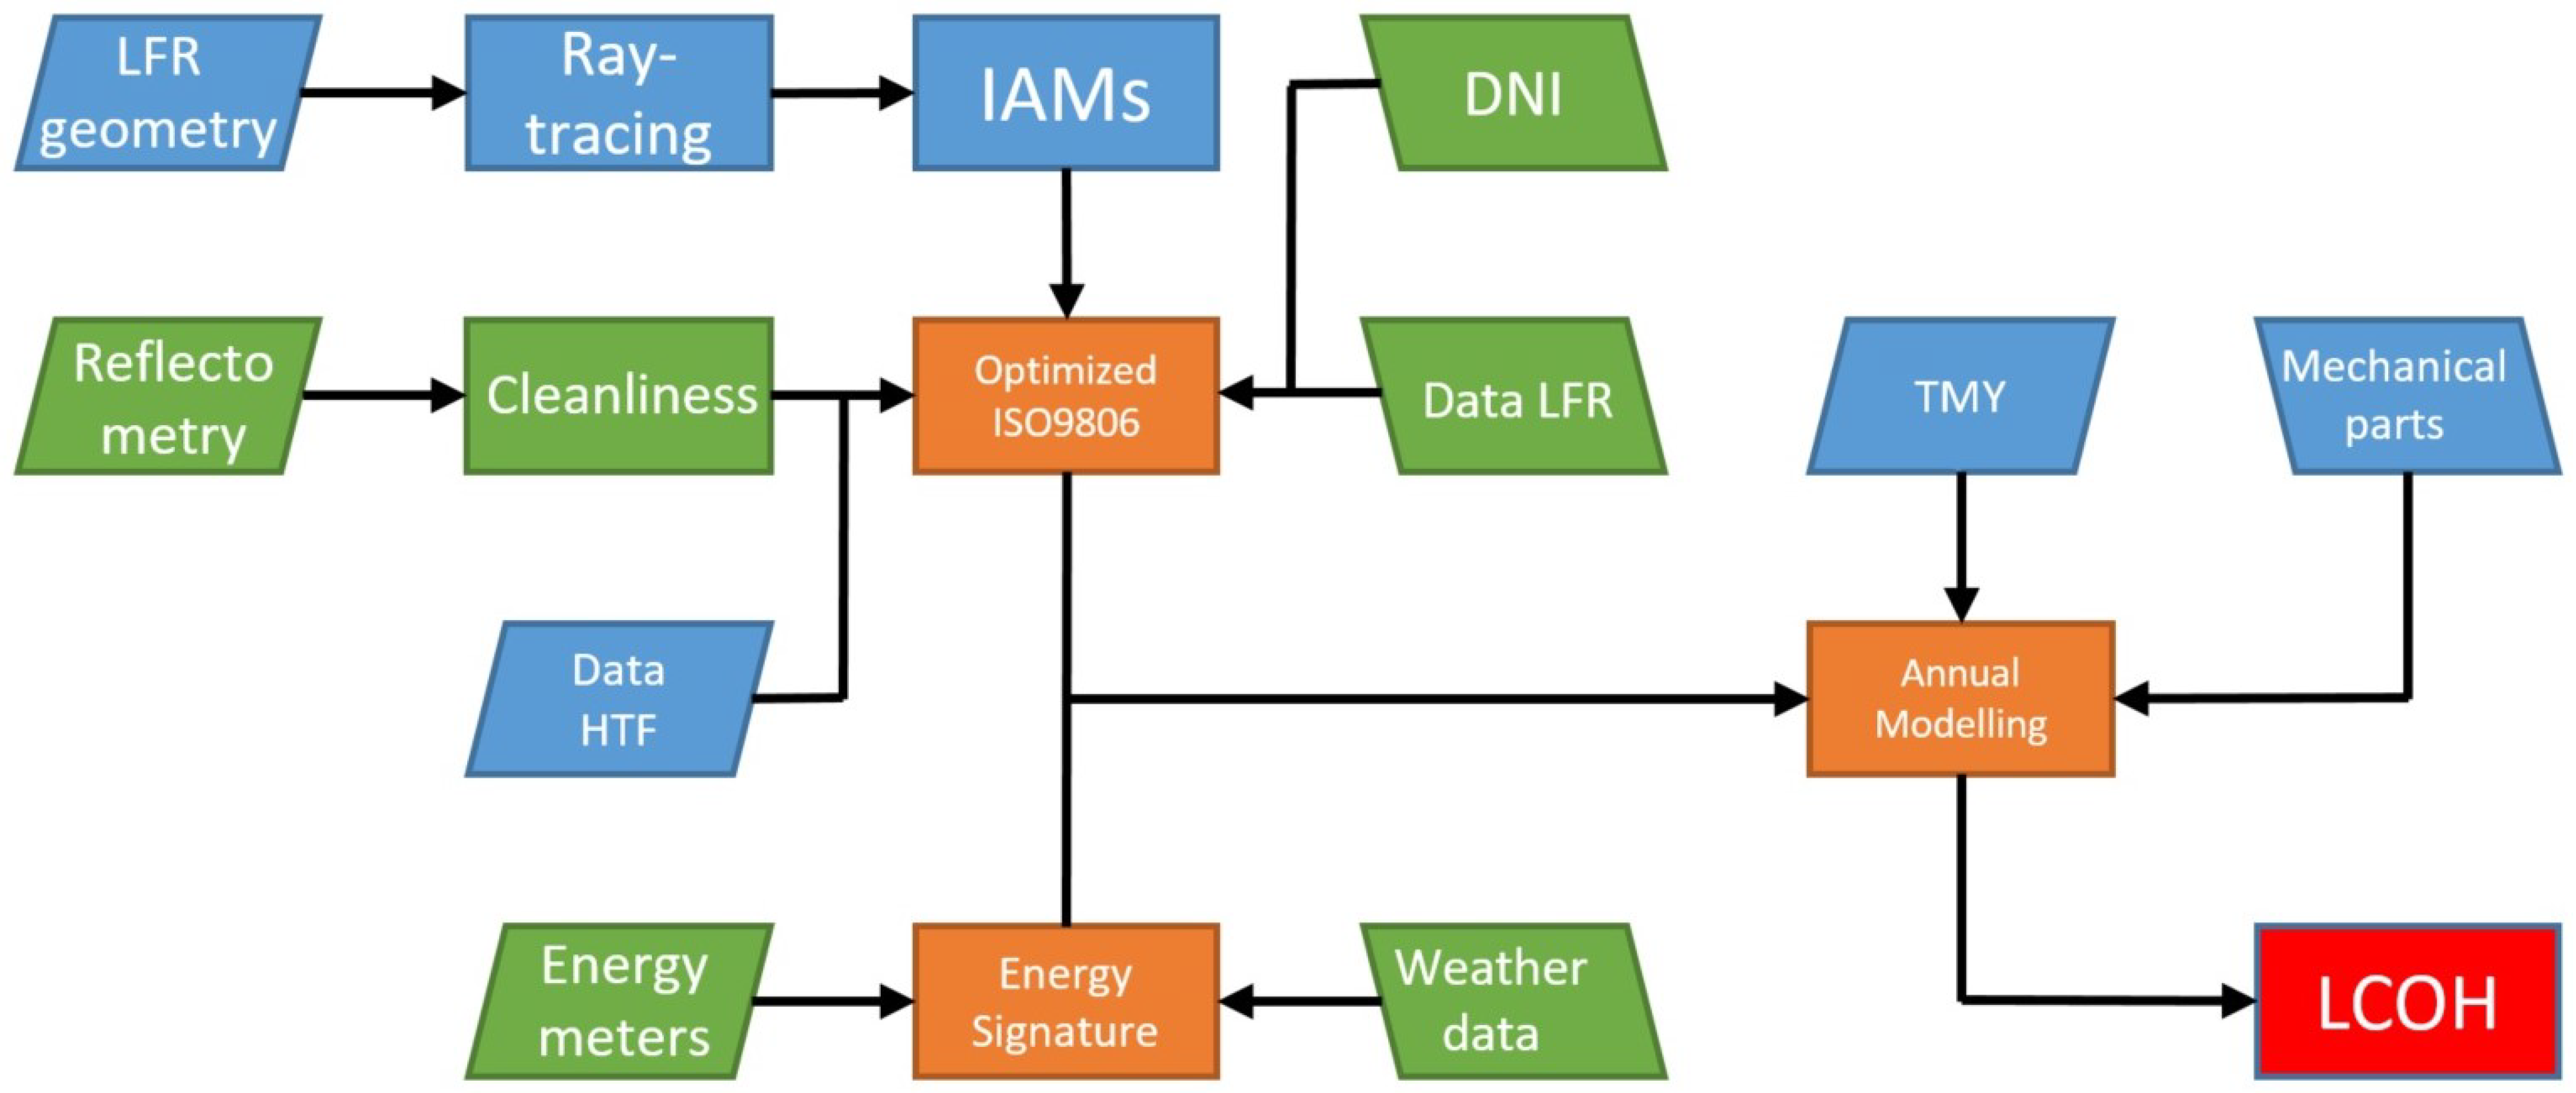
Thus the work summarized here focuses on the case study of the two pre-existing facilities in Cyprus: LFR and NTL. It relies on the data collected on the LFR itself during the 4 previous years of operation and on the consumption data of the NTL building since 2014. Both sets of data led to the definition of a model for both facilities, in order to accurately evaluate the energy balances. The hybridized collector allows for the installation of 576 polycrystalline panels that have been already manufactured but not installed yet. Meanwhile, the economic evaluation of their integration was based on a financial offer from a private provider. The flowchart in Figure 4 presents the general methodology followed in this study. The approach relies on the modeling of the NTL and LFR based on real-time collected data (in green boxes). The data helped to determine a quasi-dynamic model of the LFR (ISO9806 modified [38], in orange). As the present study focuses on the innovative solar collector hybridization, thermal modeling of the building has not been undertaken component by component but as a holistic system defined by its energy signature instead (in orange). With the modeling of both the solar collector and end user building, the LCOH is computed based on an annual simulation. This paper is organized in the following order: Section 2 describes the dynamic modeling of the sub-systems based on the collected operational data: The hybridized Fresnel collector i.e., supplier, and the NTL, i.e., consumer. This is followed, in the same section, by the presentation of the main techno-economic parameters. In Section 3, the results are presented and discussed, followed by the conclusions and acknowledgments.

2. Material and Methods

2.1. Sub-Systems: From Data Collection to Dynamic Modeling

2.1.1. The Thermal Consumer: The Air Conditioning Needs of the Building

In order to undertake the techno-economic study, this paragraph focuses on the definition of consumer behavior upon collected data for air conditioning. The NTL building has been occupied since the end of 2013. It is composed of 1 basement, 1 ground floor, and 2 additional floors as presented in more detail in [39]. The shape of the building is rectangular with a north-south orientation, without almost any openings on the southern facade. Heating is supplied with the help of one heat-pump which also supplies cooling in the summer. Two extra chillers supply cooling in summer. These 3 units, referred as “Heat-pumps” in Figure 3, work in association with 6 air handling units and 31 fan coiled units. The electric consumption of some equipment has been registered since 2014 every 15 min with sensors and a data acquisition system, with some rare exceptions, such as the three previously mentioned units. Their electric consumption has been fully registered for years 2014 and 2015, but long disruptions occurred in the following years. The LFR contributes to heating and cooling, lowering the use of these 3 units, thus their consumption of electricity. On the other hand, a weather station records the outdoor ambient temperature and outdoor relative humidity (Davis Vantage Pro 2) every minute. As considered in ASHRAE 55 [40], the relative humidity is also a weighing factor for thermal comfort. Thus, electric consumption for air conditioning the NTL has been measured altogether with both meteorological parameters, respectively with 8053 for the heating needs and with 7071 points for the cooling needs representing 3781 h of records. The nameplate electric cooling COP of the heat pump and chillers is 2.78 while the COP for heating is 3.15. The cooling and heating supplied were then estimated by multiplying the COP with their correlated electric consumption. Hence, with the electric consumption on one hand and weather data on the other hand, the energy signature of the NTL building was established as shown in Figure 5. This resulted in the definition of a look-up table with steps of 0.5 °C in temperature and 2% in relative humidity. Such a table was specially generated to be reused within TRNSYS [5] to interpolate the thermal needs for a given pair of temperature and humidity. The model generated is compared to the actual measurements in Figure 6. The coefficient of determination averages 0.8.
Due to the large number of HVAC (Heating, Ventilation, and Air conditioning) units, the building has not been strictly modeled via equipment by equipment (circulators, air handling units, fan coiled units, heat recovery units, piping, insulation, etc.). However NTL contains a workshop in the basement, labs, meeting rooms, and one large conference room, so the use cannot be easily defined following a standard pattern, as outlined in Figure 6, while the main focus of the study is mainly on the solar collector side. Such analytic thermal behavior modeling must be subsequently confronted with actual measurements over a certain period of time. This has been achieved with TRNSYS on an annual basis, modeling both the LFR and NTL. The hours considered for the thermal needs stick to the gross office occupation periods (08:00 a.m. to 06:00 p.m.) thus offsetting weekends, public holidays, closure days, and non-occupancy hours. The year 2018, which started on a Monday, stands as the reference calendar year for the study. Occupation days were used as a pattern, excluding bank holidays in Cyprus in 2018. As a result, the amount of unoccupied days rose to 122 days or 33.4% of the year. During this unoccupied period, the collector is supposed to supply electricity to NTL, i.e., electric user, via the photovoltaic generator. The consumption of the building was then assessed based on a Typical Meteorological Year (TMY) as embedded in TRNSYS, starting from the energy signature modeling as shown in Figure 5. The electric consumption of the NTL for 2014 and 2015 for cooling and heating is presented in Table 2, as well as the corresponding thermal needs based on the COP values.
The annual cooling needs were 58.9 MWh while the heating needs reached 58.6 MWh. It appears that the modeling results based on TMY are lower than these consumption averages but in the same range: 51.2 MWh for the cooling demand and 50.6 MWh for the heating demand. In addition, despite of the variability between the years 2014 and 2015, results show that the modeling stays in the range of the NTL’s energy demands. A notable discrepancy appears regarding heating demand in both years, 25.2 MWh in 2014 and 92.1 MWh in 2015. Although weather conditions weigh the use of air conditioning equipment, the user behavior strongly impacts the needs. Indeed as pointed out earlier, the NTL includes a conference room hosting large events with more than 150 participants, sometimes on consecutive days, while personnel numbers oscillate between 20 and 30. Furthermore, the needs depend on the activities in the labs and workshop, which are not evenly distributed over time. Therefore to pursue the modeling of the integration of the LFR onto NTL, TRNSYS is used with the energy signature defined in Figure 5 applying TMY.

2.1.2. The Thermal Supplier: Fresnel-CS

The LFR in thermal mode, F r e s n e l C S , at the CyI has been the scope of an extensive campaign of measurements in real environment. The experimental data recorded include the reflectometry at 660 nm of wavelength [41]. Temperatures are measured at the inlet and outlet of the absorber receiver. The volumetric flow is recorded too. The mass flow is calculated based on the properties of the Heat Transfer Fluid (HTF) Duratherm 450, thermal oil in the present case. The weather station registers the ambient temperature and wind characteristics. The data acquisition system relies on Labview® and TIA Software® via Modbus protocol. A pyrheliometer records the DNI at the highest point of the area, the roof top of NTL (model LP pyrhe 16AC). The Incident Angle Modifiers (IAMs) have been computed on Tonatiuh software [42] based on the built system. A campaign of more than 50 days aimed towards defining an analytic model of the thermal mode according to ISO9806:2017 [43] but adapted to the reality of the soiling and tracking roles with a Root Mean Square, RMS, of 0.99 °C (on the comparison between the measured outlet temperature and modeled one) [38]. The distribution of relative error ϵ t h on the thermal power, including transients, for more than 105 samples is shown in Figure 7 and is defined as follows:
ϵ t h = q ˙ t h , s i m q ˙ t h , m e a s q ˙ t h , m e a s
where q ˙ t h , s i m (W) is the simulated power based on modeling and q ˙ t h , m e a s is the power obtained from measurements. The distribution has been fitted with a stable distribution using MATLAB 2020b®. Its parameters are referenced in Figure 7. A total of 80% of the absolute relative error | ϵ t h | are within 8.2%, while 95% are within 20.4%.

2.1.3. The Electric Supplier: Fresnel-PV

Solar photovoltaic panels have been designed to fit onto the opposite side of the mirrors of the tracking system as in Figure 2 [44]. This turns the Fresnel collector to an electric generator F r e s n e l P V . The 576 polycrystalline panels of 45 W each (peak power) will cover the same area as the mirrors (184.32 m2). A techno-economic feasibility study was conducted for their integration into the electric network of the NTL building, based on commercially available products. The electric integration is presented in Figure 8. It includes 10 MPPTs (Maximum Power Point Trackers) embedded within 5 inverters that connect bundles of 24 or 32 panels in a series. With a storage capacity, 3 more inverters and a battery unit are required. The whole system is managed by a portal that communicates with each element by internet. The integration includes also the RCCBs, circuits breakers, contactors, isolators, and electric wiring. The strategy for F r e s n e l P V does not consider the option of delivering the electricity back to the electricity grid as for net billing or net metering systems [45], but it still complies with the national Cypriot law for its integration in the built environment for self-consumption. Due to the novel approach of such a system, no scheme is yet legally foreseen to sell electricity to the grid. Whenever F r e s n e l C S is not engaged, corresponding to periods of non-occupancy of the building or periods when no heating nor cooling are required, F r e s n e l P V is activated. Due to its specific configuration, the primary reflector can be divided in 4 adjacent bundles in series on the north-south direction. Depending of the height of the sun in the south pane, the northern bundle may reflect the DNI in the virtual extension of the receiver, thus resulting in a loss in end-effect, which is inefficient in regards to the thermal process. As the sun’s height is lower longitudinally, such end-effect losses grow. The F r e s n e l P V can also then be partially activated, at each bundle level, to which corresponds a minimum angle where the radiation is totally lost for the end-effect. Whenever this occurs, it produces electricity by partial flipping to PV tracking. The remaining bundles further produce heat.

2.1.4. Integration Modeling in TRNSYS

In Section 2.1.1, the energy signature of the building has been characterized by the energy signature from registered data. In Section 2.1.2, the ISO9806 model of the Fresnel collector in a real environment has been refined, again based on experimental results. In Section 2.1.3, the PV generator has been presented based on manufacturing data. The present section details their assembly within TRNSYS18 [5] as shown in Figure 9.
The mechanical integration has been presented in 2017 by [21]. The layout in Figure 9 has been optimized for the purpose of the paper by hiding the control components, equations, and output components to promote visibility. The whole piping is included in the modeling that links components to each other such as pumps, valves, tanks, etc. representing 20 units of pipes. The piping is characterized by its metric dimensions and the heat losses coefficient based on the material and average thickness of the surrounding insulation. The piping is exposed to the outdoor temperature component to include thus thermal losses to the environment (green links). The same applies to the 3 tanks installed outside, so their respective heat losses are computed according to their thermal insulation properties. The pumps are all modeled following their respective datasheet, in terms of flow and electric consumption. The consumption of the 19 CPUs controlling the LFR are also included in the modeling.
First the oil loop (in brown on top) encloses the pump, the LFR collector, a buffer of oil, and a heat-exchanger. The collector is modeled as per the results of Section 2.1.2, using the TESS library but modified accordingly for the purpose of including soiling and tracking errors. The soiling pattern follows the average cleanliness decrease measured on the actual collector with the reflectometer. Within the HTF loop, a buffer containing 425 L of oil is partially wrapped with an electric heater. The role of the tank is dual. It permits the oil to expand when in operation while it is maintained under light pressure with Nitrogen (<2 bar). The wrapped around electric heaters preheat the oil if necessary before operation as a minimum of 40 °C is required in the oil loop for the mirrors to reflect the solar rays safely towards the absorber. This tank is a buffer rather than a proper storage unit, as its role is to provide a smooth operation and maintain the oil temperature overnight for an immediate restart in the morning, if necessary. The set temperature for the electric heaters is 70 °C.
The heat of the oil loop is then transferred to the thermal storage loop of pressurized water (in red). A tank of approximately 2000 L stores water up to 146 °C, nominally providing 2 h of storage for heating operation in winter and 4 h in winter for heating. The Nitrogen is also used to pressurize the water with the help of an expansion tank. This loop also encloses two pumps: One for the heat transfer with the oil and another pump is used to transfer the heat to the loop, firing the absorption chiller (in orange). This loops also contains an 800 L tank to buffer the water’s heat for the stable operation of the absorption chiller in summer. The single effect absorption chiller used is very sensitive to the inlet temperature of heat medium between 70 °C and 95 °C, but the lower the temperature the lower its efficiency. The tank is equipped with heating tapes too, but in practice these are not used. In summer, the heat is sent to the absorption chiller loop (in blue). The single effect absorption chiller with 35 kW of cooling capacity is modeled altogether with the associated evaporative cooling tower and the pump of chilled water coming from the building. The electric heat-pumps and chillers have been designed to operate so that the chilled water fed to the building is at 7 °C and exists at 12 °C. The same settings apply to the absorption chiller. The chilled water is distributed into the NTL, while cooling is transferred in the offices via fan coiled units and with air handling units in larger spaces. If a temperature of 7 °C can not be reached, the heat-pump and chillers compensate. In winter, the heat is sent directly to the heating water of the building via a heat-exchanger (heat recovery loop in red at the bottom in Figure 9). The heating system supplies heat via hot water to the building at 55 °C and returns at 45 °C. If the solar-assisted system cannot reach 55 °C, the heat-pump backs up. F r e s n e l C S is activated whenever the thermal storage is low in temperature, i.e., 70 °C in winter and 100 °C in summer, to a trigger and rapid response to heating and cooling needs. The absorption chiller in summer operates with a nominal feed of 88 °C, while the temperature required for heating in winter is 55 °C. The absorption has been modeled as per its performance characteristics towards dynamic conditions (chilled water, cooling water, hot water properties, and ambient temperature) as communicated on its datasheet. The F r e s n e l C S is activated whenever the DNI is higher than 100 W·m−2. If these conditions are not fulfilled, the collector shifts to an electric supplier, as shown in purple square on top of Figure 9. The modeling includes the shading between PVs and the temperature dependence of their efficiency. Modules have been distributed in 8 groups to allow partial defocusing due to the end-effect. The modeling includes the shading between PVs and the temperature dependence of their efficiency. Modules have been distributed in 8 groups to allow partial defocusing due to the end-effect. The modeling was conducted based on a one-year period sampled at 30 s time intervals and with TMY data of Nicosia, Cyprus. Figure 10 represents the thermal power output from the LFR. The density of production is higher in summer as expected while power is 0 kW during weekends and closure days. Figure 11 represents the temperatures of the oil’s buffer, the tank of pressurized water (thermal storage), and the heat medium storage feeding the absorption chiller. All 3 tanks have a lower average temperature in winter as the heating needs are at a temperature level of only 55 °C. In summer, the minimum temperature for the absorption chiller is 88 °C, so the temperature of the 3 tanks increases. Figure 12 represents the thermal needs and supplies for the NTL throughout the year. Figure 13 represents the electricity produced by the F r e s n e l P V in blue. In red is the electricity produced by a PV generator with the same surface on the roof, but fixed. As shown, the power of the latter is often higher and this will be discussed in Section 3.2.

2.2. Economic Modeling

2.2.1. Main Parameters

Following the technical definition of the subsystems, the economic inputs may be added. The study relies on the LCOH (expressed in c€.kWh−1) developed by the the Solar Heating and Cooling Programme (SHC) of the International Energy Agency [13], as follows:
L C O H = I 0 S 0 + t = 1 T C t ( 1 T R ) D E P t . T R ( 1 + r ) t R V ( 1 + r ) t t = 1 T E t ( 1 + r ) t
where C t (€) are the annual operation and maintenance costs at year t and E t (kWh−1) is the final produced power (either heat or air conditioning energy). These are calculated in the next sections. The other parameters and their respective value are hereafter detailed to assess such LCOH, presented in Table 3.
The system is supposed to operate for 25 years. The cost of the dismantlement is considered to be equal to the refund from the raw materials sold, so the residual value R V is €0, although in some cases it has been considered positive in other concentrated solar applications (12% of the CAPEX for instance, [46]). The approach is more conservative here. During the 4 years of production, operations and maintenance costs have been duly recorded, so the study is representative of the costs of a real facility in operation. On the one hand they serve as a baseline at year t, for the operational and maintenance costs C t related to the currently operational F r e s n e l C S . Any purchase linked to the collector or its integration to NTL has been duly recorded and summed up for the 4 years of operation. In this respect, the C t do not rely solely on assumption but on actual expenses (detailed afterwards in Section 2.2.3). For 5 years and beyond, these values have been completed by the standard replacement costs of subcomponents as defined by ASHRAE 55 [47], for the life expectancy of equipment. The cost of electricity is averaged considering the actual electricity bills for the 2 previous years (€0.182 per kWhe). The electric consumption of each subcomponent, mainly pumps and electric heaters, are calculated for the LFR and the rest of the plant. The study includes the cost of cleaning (including labor), water consumption, and consumables as per the usual cleaning pattern on the facility. The decrease in thermal power takes into account the mean reflectometry pattern as measured daily on field on 32 mirrors. Cleaning the reflectors takes place every 2 weeks with a daily reflectivity decrease of 0.8% as measured on average in the absence of rain. Inflation was considered to be a constant but at different levels during the 25 years of study from 0% to 2.5%. The discount rate was set to 8.5% as recommended by Capros et al. [48] in the EU Reference Scenario 2016 for companies in competitive energy supply markets [48]. The corporate tax T R in Cyprus is 12.5% [49]. The depreciation costs are 10% annually as recommended in [50]. The F r e s n e l P V was assumed to have an annual constant decrease in power of 0.59% as averaged by Jordan and Kurtz [51].

2.2.2. Scenarios and Configurations

The analysis and results are organized in 3 different scenarios: Only collector, To Building, and To HP First. Each scenario is divided into 3 configurations: As Built, Hybrid, and Hybrid + Batteries. The 3 scenarios are summarized in Table 4.
First, in Scenario 1 (Only Collector), the study only evaluates the levelized cost of the heat produced by the Fresnel collector. In other words, it only considers the HTF loop.
In Scenario 2 (To Building), the final kWh considered is not strictly heat but instead useful heating and cooling kWh supplied to the building according to its energy signature (as in Figure 5). If hybridized, the electricity produced is either directly used by the building or stored in the battery cluster of a 9.6 kWhe capacity (see Figure 3). The electric self-consumption of the LFR is fed first. Afterwards, the NTL building is considered to be an infinite sink and reuses the whole electricity produced either directly or after being stored in batteries; the complete electric charging/discharging cycle is assumed to be 90% efficient.
In Scenario 3 (To HP First), the study compares LCOH between the as-built system and the as built with the integration of solar PV panels as in scenario 2, but if hybridized, the electricity is primarily delivered to the heat-pump or chillers. So the LCOH considers the heating or cooling power supplied to the building either via the F r e s n e l C S or via the F r e s n e l P V associated to the heat-pump or chillers. Even after that, electricity is overproduced and the surplus is used by the building either directly or via the battery storage, which is thus more likely to avoid any curtailment as in Scenario 2.
Moreover, each scenario considers 3 different configurations. The first one, Configuration a, is the As Built one that considers the system as installed. The second one, configuration b (Hybrid) considers the As Built system plus the integration of solar panels without batteries, while electricity is considered as a saving for the building. The third one, Configuration c (Hybrid + Batteries) adds the batteries to the second one. The different configurations are presented in Table 5.
The 3 configurations correspond to the level of hybridization (none, with solar panels, and with solar panels and batteries). The initial investment I 0 for each scenario and configuration is detailed in Table 6. Scenarios and configurations are exposed next.

2.2.3. Operation and Maintenance Costs

The operation and maintenance costs C t are split in two categories: Annual recurrent costs C a , t and replacement costs C r , t . The first costs C a , t are exposed in Table 7 for the three configurations altogether with their share. C r , t are presented in Table 8. The total C a , t for the actually integrated collector is €5284.60 while with PV it would reach €8185.70. The difference is due to the cost of cleaning, which is almost double, as a separate cleaning operation is required for the PV side. The decrease of reflectivity between two cleanings follows the average behavior measured in the field. As the collector tracks for the PV operation as well, more electric consumption is added, but obviously the electricity generated will surpass it. The cleaning operation is the main cost in C a , t followed by the electricity consumption. The other expenses, related to the mechanical parts, are due to the maintenance of the equipment such as the HTF pump, the absorption chiller, the cooling tower, absorber tubes, etc. Expenses linked to safety are also contributing to expenditure, such as external health and safety checks, protective equipment, or fire extinguishers. Tools and sensors represent a small cost such as the calibration tools and servicing (e.g., for the pyrheliometer). The rest of the consumables not listed above represent less than 4% of the expenditure (e.g., cleaning consumables).
The operation and maintenance costs C t in Equation (2) also include replacement costs C r , t . As the facility has been operating for 4 years, some of the elements cannot be listed in the actual C t recorded on the installed collector. From 5 years onward, the modeling of C r , t considers the ASHRAE’s standards. More particularly, the values correspond to the replacement of the control computer (5 years), electronics like MPPT controllers, 9.6 KWe batteries (10 years), the power management system and miscellaneous electronics (15 years), the 72 tracking motors (18 years) and the pumps (20 years), as well as the absorption chiller (23 years). Figure 14 illustrates the replacements cost for the S c e n a r i o 1, for the three configurations.
The A s B u i l t figures correspond to the actual configuration, with the projected replacements costs. Figure 15 illustrates the replacement costs for S c e n a r i o s 2 and 3 for the three configurations. Hybridization increases the replacement costs and batteries even more as expected.
As the system in S c e n a r i o 1 considers only the collector without its mechanical integration, many components in S c e n a r i o s 2 and 3 do not appear, such as the absorption chiller, water pumps, etc. On the electric side, the elements that connect the collector to the building grid also disappear as well as the power management system. The photovoltaic collector F r e s n e l P V , with or without batteries accordingly to the configuration, operates as a classic net metering system.

3. Results and Discussion

3.1. Results of the Economic Modeling

The LCOH is represented for the 3 scenarios in Figure 16 and refers to the unit per kWh (more precisely kWhth). As explained before, the results are represented for inflation values between 0% and 2.5%.
In the first scenario, the costs of the collector in its boundaries are considered, solely supplying raw heat and electricity. For the A s B u i l t configuration (a), the LOCH varies between c€25.2–30.1. This reflects the actual value for LCOH for an integrated LFR in the built-environment in 2016. Adding the PV generator decreases the LCOH down to c€21.7–27.0 but it increases to c€25.9–32.2 with batteries.
In the second scenario ( T o B u i l d i n g ), as well as in the third scenario ( T o H P F i r s t ), the useful energy stands as the final heating and cooling supplied to NTL (as in Table 5). In S c e n a r i o 2, the results assume that the electricity is used by the collector itself and the building, thus saving electricity from the grid, based on the averaged cost of electric kWh, i.e., €0.182 per kWhe. The cooling supplied is 52% of the annual needs and the heating supplied is 51% of the annual NTL needs (as summarized in Table 9). The levelized cost of energy varies between c€46.8–55.0. The LCOH for with PV decreases to c€43.0–51.6, while adding the batteries increases the LCOH slightly to c€47.6–57.2.
In S c e n a r i o 3, the results consider that the electricity is used in priority by the heat-pump or chillers. The related heating and cooling delivered is taken also into account as part of the global air conditioning supplied for the LCOH calculation. Consequently, the heating supplied by the whole collector is increased by 16% with the help of the heat-pump. The cooling supplied is increased by 29%. Eventually the whole hybridized collector can provide 81% of the cooling needs and 68% of the heating needs (as per Table 9).
As a reference, the levelized cost of energy (heating and cooling supplied to the building) varies between c€46.8–55.0. This is the same for S c e n a r i o 2. The LCOH with PV varies between c€32.0–38.0, meaning that the photovoltaic generator further reduces the cost than in S c e n a r i o 2. A decrease of lower magnitude is achieved for the LCOH with the integration of batteries: c€35.2–41.9. In both S c e n a r i o 2 and 3, the hybrid system without batteries is the cheapest solution and cheaper than the A s B u i l t in each case. However the batteries increase the final LCOH, which is higher than the A s B u i l t when the electricity is indifferently used by the building.
In all cases, the hybridization with solar panels decreases the LCOH, but to a lesser degree if the batteries are included. Table 10 summarizes the results of the different calculated LCOHs. With a collector integrated in the building, the best solution is S c e n a r i o 2 where, for the case studied, the hybrid collector is without batteries and feeds first the electric heat-pump or chillers. The decrease in LCOH reaches more than 31% while the configuration covers 75% of the air conditioning demand instead of 51%. With a raw collector ( S c e n a r i o 1), the PVs without batteries decrease the LCOH by 11% to 14%.

3.2. Discussion

Work on the levelized cost of heating and cooling is scarce in the literature. Nonetheless in 2018, the authors in [52] led a similar comparative exercise with different technologies for district heating and cooling in Matosinhos, Portugal. The expected levelized cost based on natural gas for heating and vapor compression chiller for cooling at horizon 2030, is c€10.5. Replacing the gas heating solution by heat-pumps leads to a levelized cost of c€11.4. This solution relies on the electrical network. Adding PVs further reduces the levelized cost down to c€9.9, where PVs are able to produce the whole electricity required for heating and cooling. The most relevant solution from the study in the paper leads to a levelized cost of roughly c€32–38, thus more than 3 times the results from [52]. First, a comparison between different LCOE or LCOH in different locations with different economic parameters are complicated [53], especially as the case developed at CyI integrates more operational components with their characteristics into the modeling. Cyprus also imports fossil fuels to supply costly electricity to its network, which is not connected to the rest of Europe unlike Portugal. Even with the same technology, such as a hybrid parabolic dish, the results vary widely depending on the location Riggs et al. [54]. For instance, in Cyprus which has very little industry, almost all components have to be imported, which strongly impacts the costs. Energy mixes based on fossil fuels is more competitive economically but they contribute to climate change that will engender more cooling needs. Electricity is certainly a privileged energy vehicle and is promising in Portugal as the share of renewables in 2019 was 51% according to the Redes Energéticas Nacionais, in Portugal [55], unlike Cyprus (around 10%). However, annually balancing the PV production with the HVAC-related electricity consumption, neglects the discrepancy between real-time demand and production. This raises the debate on electric storage and its components. Electricity-based air conditioning, conditional of efficient chillers and heat-pumps, is worthwhile in countries where the electricity mix is fueled by renewables in order stem global warming. The share of cooling in CO2 emissions from buildings has already doubled between 1990 and 2016 according to IEA [1].
The levelized cost of heat at the level of the collector only varies between c€21.7–27.0. As mentioned in the introduction, Lillo et al. [20] estimated the LCOE for CPC technology between c€2.5–16.9, for LFR between c€4.6–7.7, and for PTC between c€6.4–15.4. Values in the present study are higher. However, after 4 years of operation some optimizations in the design have been identified to cut the cost of the collector independently from the integration of the PV panels. Furthermore, values from the present study are based on operational data for a collector built 4 years before the analysis.
Replacement costs had to rely partially on standards for the equipment that needed to be replaced after 5 years of operation. Nonetheless, the present study focuses on actual operation at least for the 4 first years and offers the state of the art for a specific and operational compact Fresnel collector installed on a building. This makes the current model more reliable especially in terms operation and maintenance costs, which are more accurate than estimates in a feasibility study for example.
Some major upgrades or modifications could be done in order to decrease the costs. For instance, the technology for double effect absorption chillers at a lower capacity (<100 kW of cooling capacity) has matured when, compared to the products available at the inception in 2014, with a wider range of heating media. They are more efficient as the coefficient of performance is higher than 1, while the absorption chiller at the Cyprus Institute offers a nominal COP of 0.7. Montero-Izquierdo et al. [9] estimated that the thermal efficiency between the LFR and a double effect absorption chiller was 50% while it stands roughly at 32% with a single effect. LFRs may work at 250 °C in order to work with double or triple effect absorption chiller with a higher temperature thermal storage in between. The interval for an operation temperature of single effect absorption chillers is narrow in order to respect the nominal conditions (roughly 70 °C to 95 °C) and far from the operation temperature of the collector around 160–180 °C. Double effect absorption chillers on the other hand permit operation at a temperature level closer to the outlet temperature of the Fresnel collector, minimizing the thermal losses in the storage units. The heat-pump and chillers installed to supply the air conditioning to the NTL have a relatively low COP. With a more efficient equipment, the LCOH would be even lower.
In addition, the PV panels have been specifically designed for the present collector. An alternative is the iterative optimization between the size of the mirrors and off-the-shelf solar panels, avoiding custom designed ones, which are more expensive. It is also appropriate to enhance the albedo of the roof by applying a specially reflective paint layer in order for the panels to produce more electricity even when in F r e s n e l C S mode. In addition, an optimization could be implemented in order to evaluate the minimum DNI value for the activation of F r e s n e l C S . The use of batteries critically minimizes the advantages offered by the solar panels. So far in many countries, including Cyprus, a net metering system is in force which trades off the produced photovoltaic electricity and consumption. However, this disregards the moment when electricity was produced or consumed. Such a hiatus can be criticized, as the sole objective for an electricity authority is to deliver accordingly to demand, to avoid instantaneous blackouts, rather than focusing on an annual balance, as charged to the consumer-producer hosting photovoltaics on their roof. The batteries in terms of quality of restitution permit better response to the building’s demand and alleviate the consumption stress from the grid. The technology used is polycrystalline. However, their efficiency, which peaks at 23.3%, in regards to the module temperature (especially in Cyprus) is low compared to other technologies such as the monocrystalline one, which peaks at 26.1%, as well as other technologies that are the scope of an ongoing comparison by NREL [56]. The technology selected was a trade off between the cost and local availability on the island.
Currently, the collector uses evacuated tubes that may not be appropriate given the temperature levels. Indeed the benefit of vacuum is canceled out by the difficulty of cleaning the glass due to the tricky access and fragility of the coatings that must not be removed when cleaning. Encapsulated tubes with air are a promising solution for the collectors supplying air conditioning (as studied by [57]). Furthermore, the combination with non-imaging optics can radically improve the absorber thermal performance [58].
The present study does not consider the pros and cons of an LFR collector on a roof in terms of radiation. In summer it helps to minimize heating by direct radiation. However, in winter it also hinders the radiation that would naturally warm the building. However as the sun is higher in summer and for longer periods, with more probability of clearer skies, the summer blocking largely surpasses the loss of solar heating benefit in the winter.
The study does not consider the expansion of thermal storage in order to store heat even during weekends for instance. The heat could be then released during week days. The actual system is able to store for 2 h of operation in summer and 4 h in winter with 2 m3 of pressurized water. Storing during two days of 8 h, as an example, would require 16 m3. This could be a solution but it adds to thermal losses and requires space while the present upgrade targets buildings in urban environments where space is generally limited. In addition, increasing the thermal storage certainly increases the capacity factor of the facility but does not serve during the long period of standby in spring or autumn. In the best case scenario, perfect storage during weekends will supply 66% of the air conditioning demand instead of 52% (see Table 9).
The solar panels have produced 37.19 MWh while fixed panels with optimized tilt on the roof would produce 47.9 MWh (+28.8%, see Figure 13). For the purposes of this discussion, let us assume that two identical roofs to the one hosting the LFR had been available. In the first case, one roof would host a photovoltaic generator and the other roof, a non-hybridized Fresnel collector. In the second case, both roofs host one hybrid Fresnel collector as presented in the study. In the second case, the facilities would produce double the thermal energy when compared to the first case and +55.3% of electric power. Thus where space is a limiting factor, hybridizing is an asset in terms of energy production, increasing the overall capacity factor.
The discount rate r corresponds to the Weighted Average Cost of Capital (WACC). As it is difficult to estimate, the study follows on the recommendations for a competitive energy sector [48], i.e., 8.5%. It could be more in our case as the risk could be higher. However the study targets a mature technology, where the gap is not so large as PVs are a reliable technology, and the hybridization does not involve new technology. The risk is more on the LFR side, where technology is still trying to find a place in the energy market. Figure 17, shows the effect of varying discount rate on the final LCOH for the two best solutions from Section 3.1. This concerns first the Fresnel collector only with PV. Second it deals with the LCOH of the integrated Fresnel on the building with PV. Both solutions are without batteries as the results with batteries were poorer in economic terms. As can be observed, a mild variation on the discount rate leads to important variations into the final LCOH.

4. Conclusions

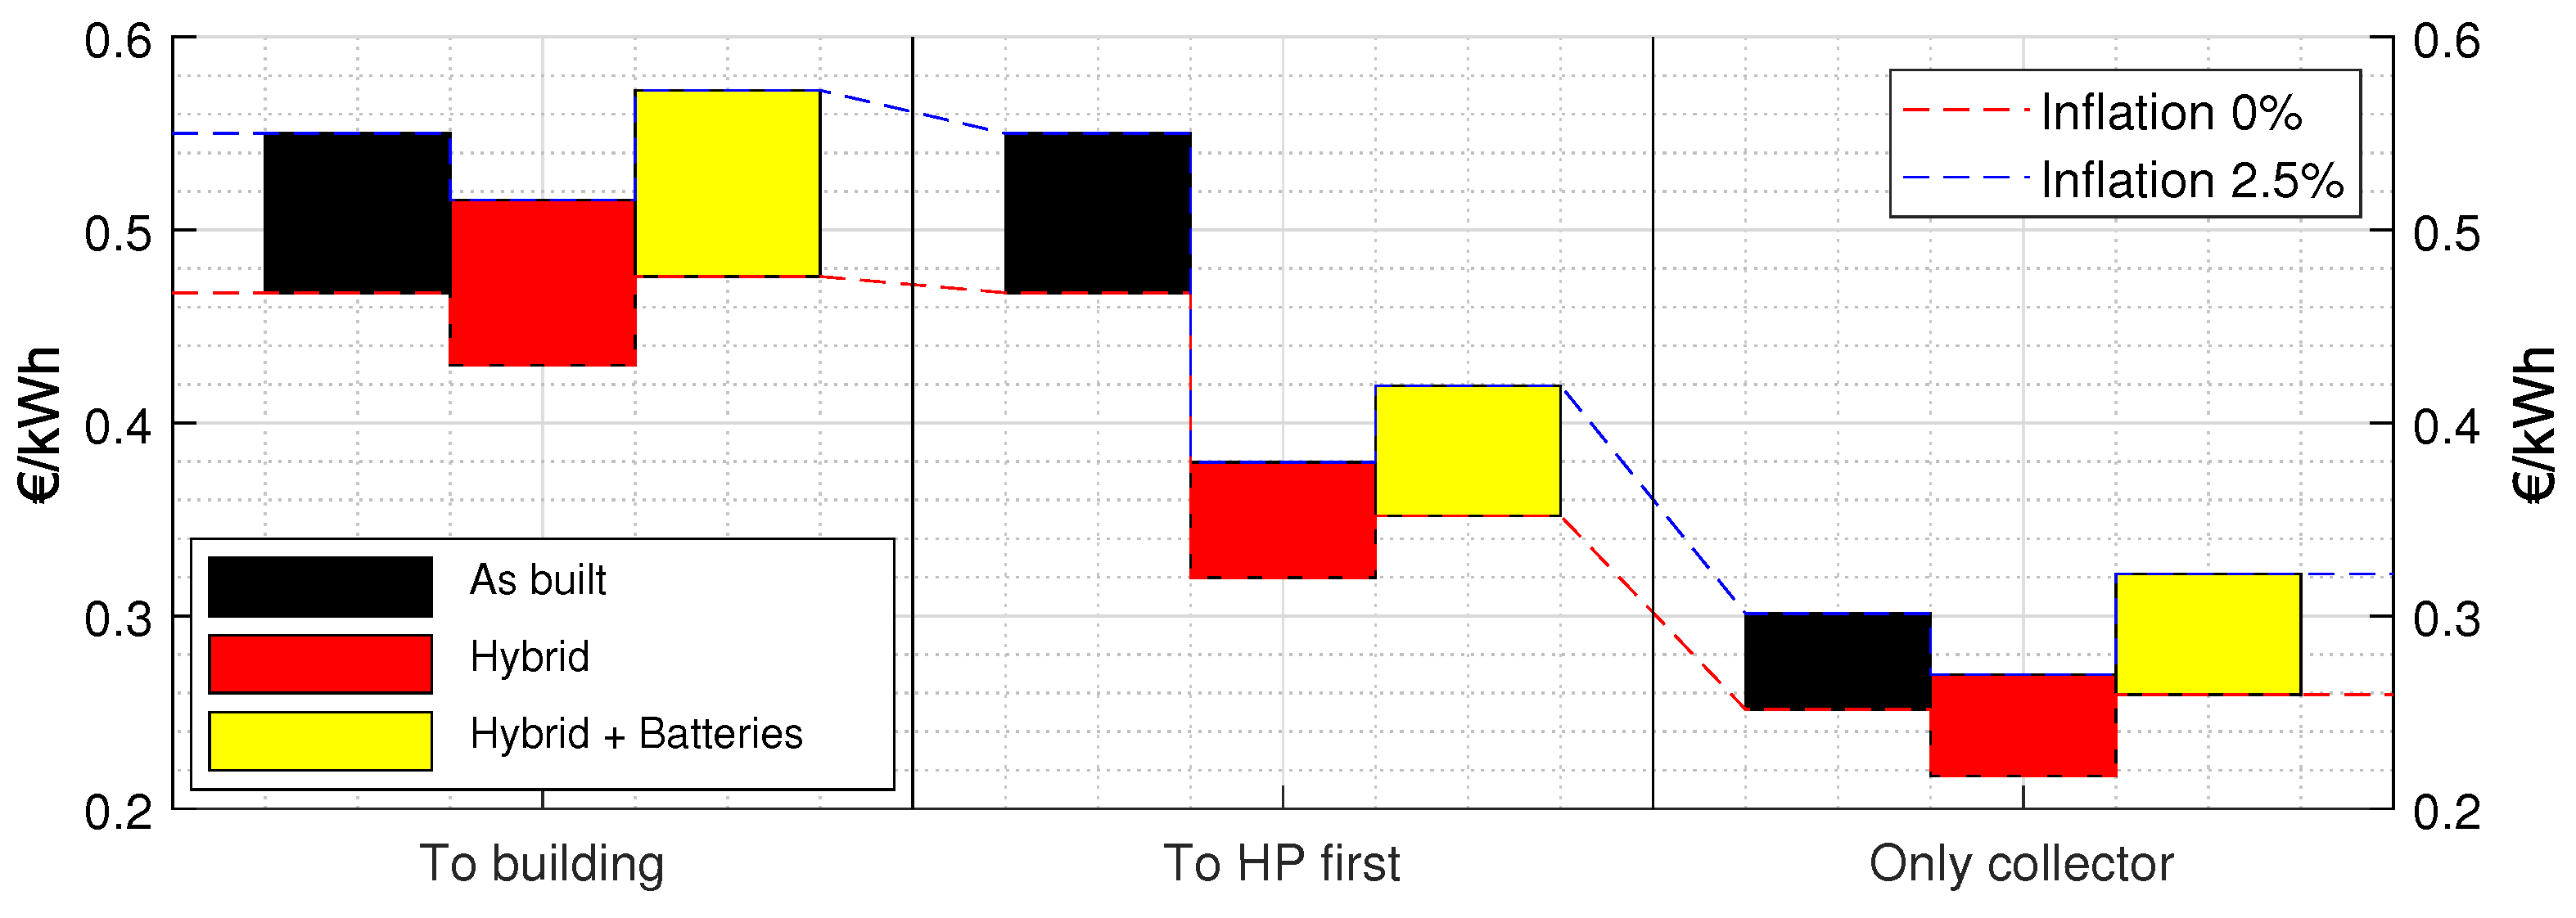
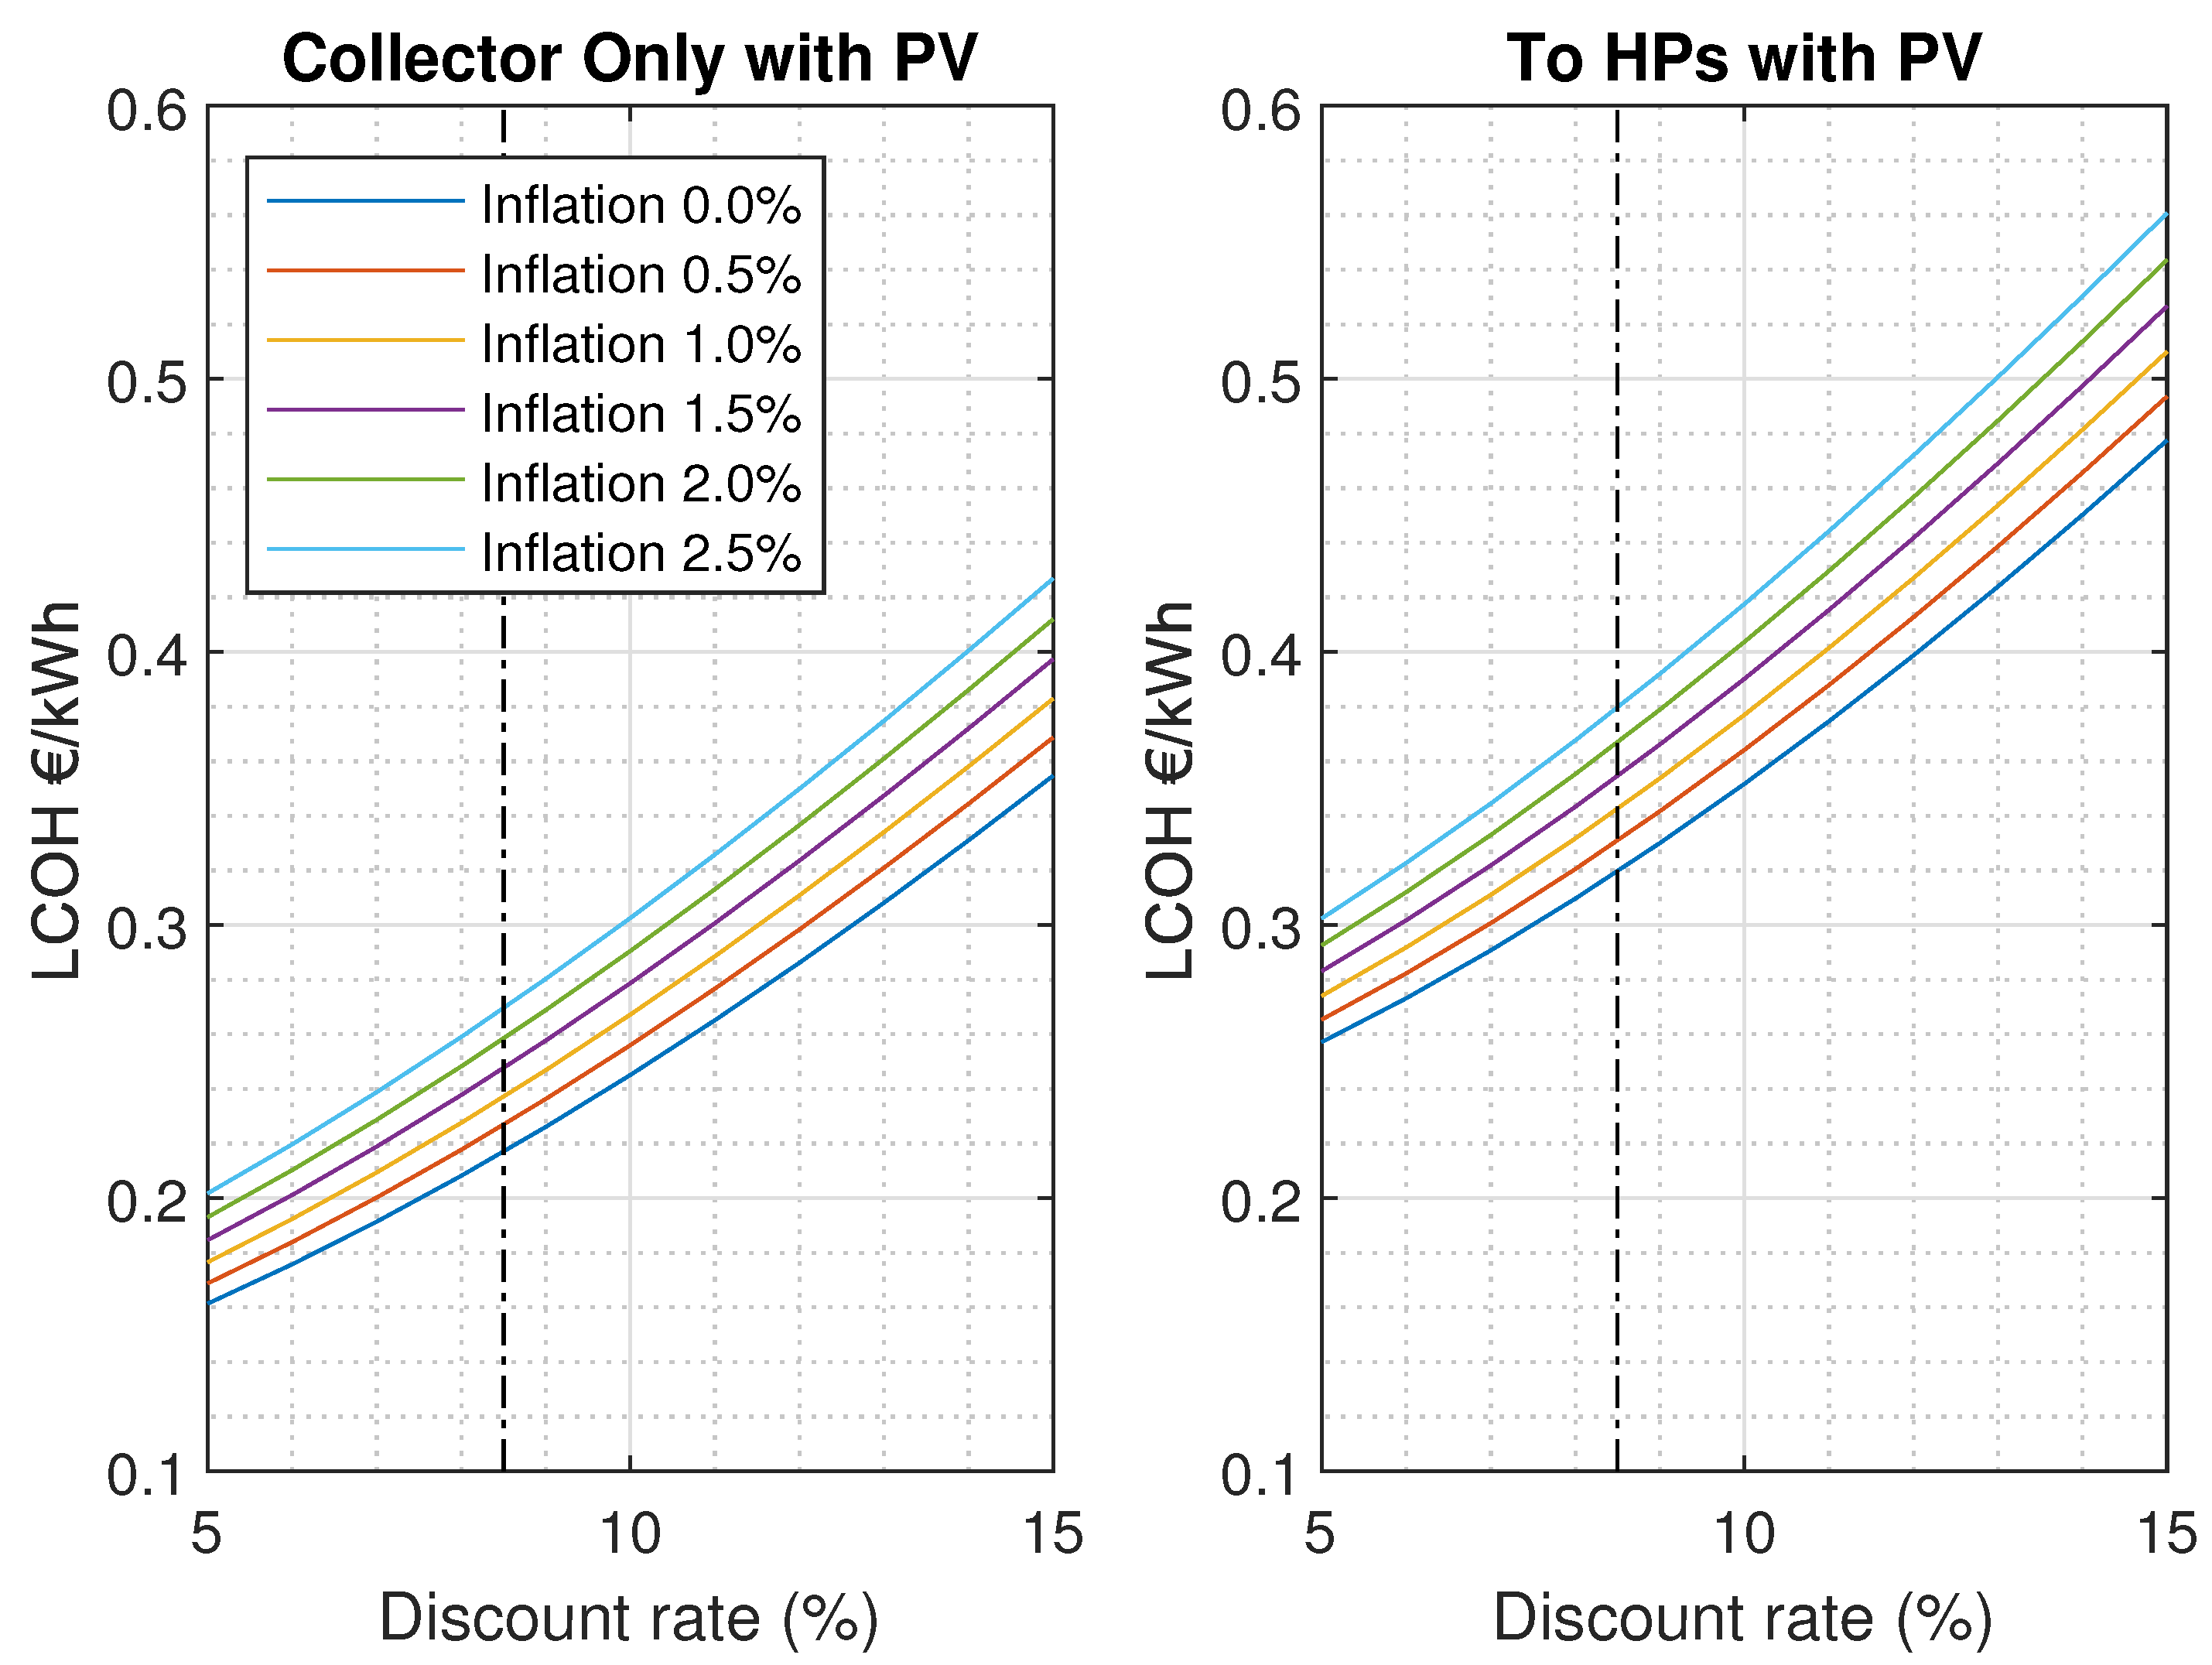
The hybridized system considers the building not only as a thermal user nor as an electric user, but as both and is able to comply with both needs by increasing its capacity factor. The study demonstrated that the inclusion of PVs decreased the LCOH between 10.5% and 13.7% reaching c€21.7–27.0, for the collector system.
Regarding the final LCOH on the heating and cooling produced the addition of PV, which decreased the cost by 31–32%. The final LCOH reached was c€32.0–38.0. The solution to first feed the heat-pumps increased the share of solar-assisted air conditioning from 51% to 75%, thus lowering the demand from fossil fuel-based electricity, and consequently lowering the equivalent CO2 emissions.
Nonetheless the analysis demonstrated that the addition of batteries in places where the price of electricity remains quasi constant as in Cyprus independently from the hour of the day, did not help to reduce the cost dramatically. In a context where electricity supplied by the grid fluctuates accordingly to demand, such an electric storage addition would make more sense.
The next generation collector shall apply to higher temperatures in order to enhance efficiency with more efficient thermal storage and absorption chillers. Ultimately, the study shall be completed with a life cycle assessment established by Margni et al. [59] and as exemplified by Perez-Gallardo et al. [60] for PV powered heliostats, in order to quantify the benefits of the system within an extended vision of environmental sustainability (resources, global warming, emissions, etc.). However it may also be complemented with a social life cycle assessment, as suggested by Andrews et al. [61], to quantify the benefits of solar air conditioning on a larger country scale (in comparison to grid-connected). Indeed, renewable energies may create more local and sustainable jobs than imported energy, especially as Cyprus has very little industry and energy is mainly imported via fossil fuels.

Author Contributions

Conceptualization, A.C.M.; methodology, A.C.M.; software, A.C.M.; validation, A.C.M.; formal analysis, A.C.M.; investigation, A.C.M.; resources, A.C.M.; data curation, A.C.M.; writing—original draft preparation, A.C.M.; writing—review and editing, A.C.M.; visualization, A.C.M.; supervision, C.P.; project administration, C.P.; funding acquisition, C.P. All authors have read and agreed to the published version of the manuscript.

Funding

This work is supported by the European Union’s Horizon 2020 research and innovation program within the context of the CySTEM ERA Chair project, under grant agreement No 731287 and the INSHIP project, under grant agreement No 731287.

Data Availability Statement

The data presented in this study are available on request from the corresponding author. The data are not publicly available due to privacy restrictions.

Acknowledgments

The authors would like to acknowledge the technical support of Harris Chrysanthou and Nicolas Jarraud.

Conflicts of Interest

The authors declare no conflict of interest. The funders had no role in the design of the study; in the collection, analyses, or interpretation of data; in the writing of the manuscript, or in the decision to publish the results.

Abbreviations

The following abbreviations are used in this manuscript:
CPCCompound Parabolic Collector
CPVTConcentrated Photovoltaic Thermal
CSPConcentrated solar power
CSTConcentration solar technology
CyIThe Cyprus Institute
HVACHeating, Ventilation, and Air Conditioning
IEAInternational Energy Agency
LCOELevelized Cost of Energy
LCOHLevelized Cost of Heat
LFRLinear Fresnel Reflector
MENAMiddle East and North Africa
MPPTMaximum power point tracker
NTLNovel Technologies Laboratory
PTCParabolic Trough Collector
PVPhotovoltaic
PVTPhotovoltaic Thermal
TMYTypical Meteorological Year

References

  1. IEA. The Future of Cooling. 2018. Available online: https://www.iea.org/reports/the-future-of-cooling (accessed on 17 November 2020).
  2. Florides, G.A.; Kalogirou, S.A. A solar cooling and heating system for a laboratory building. In Proceedings of the Heat Power Cycles Conference, Berlin, Germany, 7–9 September 2009. [Google Scholar]
  3. Kalogirou, S.A.; Francou, F.; Florides, G.A. Evaluation of the solar cooling and heating system of the CUT mechanical engineering laboratories. In Proceedings of the 2nd Conference on Power Options for the Eastern Mediterranean Region, Nicosia, Cyprus, 7–8 October 2013. [Google Scholar]
  4. Xu, Z.; Wang, R. Comparison of CPC driven solar absorption cooling systems with single, double and variable effect absorption chillers. Sol. Energy 2017, 158, 511–519. [Google Scholar] [CrossRef]
  5. Klein, S.A.; Beckman, W.A.; Mitchell, J.W.; Duffie, J.A.; Duffie, N.A.; Freeman, T.L.; Mitchell, J.C.; Braun, J.E.; Evans, B.L.; Kummer, J.P.; et al. TRNSYS 18: A Transient System Simulation Program. 2017. Available online: http://sel.me.wisc.edu/trnsys (accessed on 24 June 2020).
  6. Kiwan, S.; Damseh, R.; Venezia, L.; Montagnino, F.M.; Paredes, F. Techno-Economic Performance Analysis of a Concentrated Solar Polygeneration Plant in Jordan. In Proceedings of the GCReeder Exhibition & Conference 2016, Amman, Jordan, 4 April 2016. [Google Scholar]
  7. Montenon, A.; Montagnino, F.M.; Paredes, F.; Fylaktos, N.; Giaconia, A.; Bono, S. Solar Multi-Generation in the Mediterranean Area, the Experience of the Sts-Med Project. In Proceedings of the 11th ISES EuroSun Conference, La Palma de Mallorca, Spain, 13 October 2016. [Google Scholar] [CrossRef]
  8. Chahine, K.; Murr, R.; Ramadan, M.; Hage, H.E.; Khaled, M. Use of parabolic troughs in HVAC applications—Design calculations and analysis. Case Stud. Therm. Eng. 2018, 12, 285–291. [Google Scholar] [CrossRef]
  9. Montero-Izquierdo, A.; Hirsch, T.; Schenk, H.; Bruno, J.C.; Coronas, A. Performance Analysis of Absorption Cooling Systems Using Linear Fresnel Solar Collectors. In Proceedings of the Third International Conference on Applied Energy, Perugia, Italy, 17 May 2011. [Google Scholar]
  10. Alahmer, A.; Ajib, S. Solar cooling technologies: State of art and perspectives. Energy Convers. Manag. 2020, 214, 112896. [Google Scholar] [CrossRef]
  11. United Nations Climate Change. Paris Agreement. 2016. Available online: https://unfccc.int/process/conferences/pastconferences/paris-climate-change-conference-november-2015/paris-agreement (accessed on 23 December 2020).
  12. Lelieveld, J.; Proestos, Y.; Hadjinicolaou, P.; Tanarhte, M.; Tyrlis, E.; Zittis, G. Strongly increasing heat extremes in the Middle East and North Africa (MENA) in the 21st century. Clim. Chang. 2016, 137. [Google Scholar] [CrossRef] [Green Version]
  13. Louvet, Y.; Fischer, S.; Furbo, S.; Giovanetti, F.; Mauthner, F.; Mugnier, D.; Philippen, D.; Veynandt, F. Guideline for Levelized Cost of Heat (LCoH) Calculations for Solar Thermal Applications. 2019. Available online: https://task54.iea-shc.org/Data/Sites/1/publications/A01-Info-Sheet–LCOH-for-Solar-Thermal-Applications.pdf (accessed on 19 November 2020).
  14. PSE-AG. Database for Applications of Solar Heat Integration in Industrial Processes. Available online: http://ship-plants.info/ (accessed on 12 December 2020).
  15. CSP-F. CSP-F Solar Products. Available online: http://www.cspfsolar.com/products/ (accessed on 12 December 2020).
  16. Zhuang, X.; Xu, X.; Liu, W.; Xu, W. LCOE Analysis of Tower Concentrating Solar Power Plants Using Different Molten-Salts for Thermal Energy Storage in China. Energies 2019, 12, 1394. [Google Scholar] [CrossRef] [Green Version]
  17. Vaderobli, A.; Parikh, D.; Diwekar, U. Optimization under Uncertainty to Reduce the Cost of Energy for Parabolic Trough Solar Power Plants for Different Weather Conditions. Energies 2020, 13, 3131. [Google Scholar] [CrossRef]
  18. Wahed, A.; Bieri, M.; Kui, T.K.; Reindl, T. Levelized Cost of Solar Thermal System for Process Heating Applications in the Tropics. In Transition towards 100% Renewable Energy: Selected Papers from the World Renewable Energy Congress WREC 2017; Springer International Publishing: Cham, Switzerland, 2018; pp. 441–450. [Google Scholar] [CrossRef]
  19. Gabbrielli, R.; Castrataro, P.; Del Medico, F.; Di Palo, M.; Lenzo, B. Levelized Cost of Heat for Linear Fresnel Concentrated Solar Systems. Energy Procedia 2014, 49, 1340–1349. [Google Scholar] [CrossRef]
  20. Lillo, I.; Pérez, E.; Moreno, S.; Silva, M. Process Heat Generation Potential from Solar Concentration Technologies in Latin America: The Case of Argentina. Energies 2017, 10, 383. [Google Scholar] [CrossRef] [Green Version]
  21. Montenon, A.C.; Fylaktos, N.; Montagnino, F.; Paredes, F.; Papanicolas, C.N. Concentrated solar power in the built environment. AIP Conf. Proc. 2017, 1850, 040006. [Google Scholar] [CrossRef] [Green Version]
  22. Pérez-Aparicio, E.; Lillo-Bravo, I.; Moreno-Tejera, S.; Silva-Pérez, M. Economical and environmental analysis of thermal and photovoltaic solar energy as source of heat for industrial processes. AIP Conf. Proc. 2017, 1850, 180005. [Google Scholar] [CrossRef]
  23. Roni, M.; Hoque, U.; Ahmed, T. Comparative Study of Levelized Cost of Electricity (LCOE) for Concentrating Solar Power (CSP) and Photovoltaic (PV) Plant in the Southeastern Region of Bangladesh. In Proceedings of the 2019 International Conference on Electrical, Computer and Communication Engineering (ECCE), Cox’s Bazar, Bangladesh, 7 February 2019. [Google Scholar] [CrossRef]
  24. Sharaf, O.Z.; Orhan, M.F. Concentrated photovoltaic thermal (CPVT) solar collector systems: Part I—Fundamentals, design considerations and current technologies. Renew. Sustain. Energy Rev. 2015, 50, 1500–1565. [Google Scholar] [CrossRef]
  25. Sharaf, O.Z.; Orhan, M.F. Concentrated photovoltaic thermal (CPVT) solar collector systems: Part II—Implemented systems, performance assessment, and future directions. Renew. Sustain. Energy Rev. 2015, 50, 1566–1633. [Google Scholar] [CrossRef]
  26. Ju, X.; Xu, C.; Liao, Z.; Du, X.; Wei, G.; Wang, Z.; Yang, Y. A review of concentrated photovoltaic-thermal (CPVT) hybrid solar systems with waste heat recovery (WHR). Sci. Bull. 2017, 62. [Google Scholar] [CrossRef] [Green Version]
  27. Jiang, C.; Yu, L.; Yang, S.; Li, K.; Wang, J.; Lund, P.D.; Zhang, Y. A Review of the Compound Parabolic Concentrator (CPC) with a Tubular Absorber. Energies 2020, 13, 695. [Google Scholar] [CrossRef] [Green Version]
  28. Tripathi, R.; Tiwari, G.; Al-Helal, I. Thermal modelling of N partially covered photovoltaic thermal (PVT)—Compound parabolic concentrator (CPC) collectors connected in series. Sol. Energy 2016, 123, 174–184. [Google Scholar] [CrossRef]
  29. Tripathi, R.; Tiwari, S.; Tiwari, G.N. Energy analysis of partially covered number (N) of photovoltaic thermal-compound parabolic concentrator collectors connected in series at constant collection temperature mode. In Proceedings of the 2016 International Conference on Emerging Trends in Electrical Electronics Sustainable Energy Systems (ICETEESES), Sultanpur, India, 11 March 2016; pp. 12–17. [Google Scholar] [CrossRef]
  30. Carlini, M.; McCormack, S.J.; Castellucci, S.; Ortega, A.; Rotondo, M.; Mennuni, A. Modelling and Numerical Simulation for an Innovative Compound Solar Concentrator: Thermal Analysis by FEM Approach. Energies 2020, 13, 548. [Google Scholar] [CrossRef] [Green Version]
  31. Ulavi, T.U.; Davidson, J.H.; Hebrink, T. Analysis of a Hybrid PV/T Concept Based on Wavelength Selective Films. In Proceedings of the ASME 2013 7th International Conference on Energy Sustainability Collocated with the ASME 2013 Heat Transfer Summer Conference and the ASME 2013 11th International Conference on Fuel Cell Science, Engineering and Technology, Minneapolis, MN, USA, 14 July 2013; Volume 136. [Google Scholar] [CrossRef]
  32. Abdelhamid, M.; Widyolar, B.K.; Jiang, L.; Winston, R.; Yablonovitch, E.; Scranton, G.; Cygan, D.; Abbasi, H.; Kozlov, A. Novel double-stage high-concentrated solar hybrid photovoltaic/thermal (PV/T) collector with nonimaging optics and GaAs solar cells reflector. Appl. Energy 2016, 182, 68–79. [Google Scholar] [CrossRef] [Green Version]
  33. Vivar, M.; Everett, V.; Fuentes, M.; Blakers, A.; Tanner, A.; Le Lievre, P.; Greaves, M. Initial field performance of a hybrid CPV-T microconcentrator system. Prog. Photovoltaics Res. Appl. 2013, 21, 1659–1671. [Google Scholar] [CrossRef]
  34. Sultana, T.; Morrison, G.; Taylor, R.A.; Rosengarten, G. Numerical and experimental study of a solar micro concentrating collector. Solar Energy 2015, 112, 20–29. [Google Scholar] [CrossRef]
  35. Codd, D.; Escarra, M.; Riggs, B.; Islam, K.; Ji, Y.; Robertson, J.; Spitler, C.; Platz, J.; Gupta, N.; Miller, F. Solar Cogeneration of Electricity with High-Temperature Process Heat. Cell Rep. Phys. Sci. 2020, 1, 100135. [Google Scholar] [CrossRef]
  36. Wang, Y.; Zhu, Y.; Chen, H.; Zhang, X.; Yang, L.; Liao, C. Performance analysis of a novel sun-tracking CPC heat pipe evacuated tubular collector. Appl. Therm. Eng. 2015, 87, 381–388. [Google Scholar] [CrossRef]
  37. Osório, T.; Horta, P.; Collares-Perreira, M. Method for customized design of a quasi-stationary CPC-type solar collector to minimize the energy cost. Renew. Energy 2018, 133. [Google Scholar] [CrossRef]
  38. Schöttl, P.; Montenon, A.; Papanicolas, C.; Perry, S.; Heimsath, A. Comparison of Advanced Parameter Identification Methods for Linear Fresnel Collectors. In Proceedings of the SolarPaces 2020, Albuquerque, NM, USA, 30 September 2020. [Google Scholar]
  39. Papanicolas, C.; Lange, M.A.; Fylaktos, N.; Montenon, A.; Kalouris, G.; Fintikakis, N.; Fintikaki, M.; Kolokotsa, D.; Tsirbas, K.; Pavlou, C.; et al. Design, construction and monitoring of a near-zero energy laboratory building in Cyprus. Adv. Build. Energy Res. 2015, 9, 140–150. [Google Scholar] [CrossRef]
  40. Hoyt, T.; Schiavon, S.; Tartarini, F.; Cheung, T.; Steinfeld, K.; Piccioli, A.; Moon, D. CBE Thermal Comfort Tool. Center for the Built Environment, University of California Berkeley. Available online: https://comfort.cbe.berkeley.edu/ (accessed on 16 June 2020).
  41. Bonanos, A.; Montenon, A.; Blanco, M. Estimation of mean field reflectance in CST applications. Sol. Energy 2020, 208, 1031–1038. [Google Scholar] [CrossRef]
  42. Montenon, A.C.; Tsekouras, P.; Tzivanidis, C.; Bibron, M.; Papanicolas, C. Thermo-optical modelling of the linear Fresnel collector at the Cyprus institute. AIP Conf. Proc. 2019, 2126, 100004. [Google Scholar] [CrossRef]
  43. Secretary, I.C. Solar Energy—Solar Thermal Collectors—Test Methods; International Organization for Standardization: Geneva, Switzerland, 2017. [Google Scholar]
  44. Montenon, A.; Papanicolas, C. Theoretical study of a hybrid Fresnel collector to supply electricity and air-conditioning for buildings. In Proceedings of the 6th International Conference on Renewable Energy Sources & Energy Efficiency, Nicosia, Cyprus, 1 November 2018; pp. 42–51. [Google Scholar]
  45. Couture, T.D.; Jacobs, D.; Rickerson, W.; Healey, V. The Next Generation of Renewable Electricity Policy. How Rapid Change Is Breaking Down Conventional Policy Categories, Clean Energy Solutions Centre. 2015. Available online: https://www.nrel.gov/docs/fy15osti/63149.pdf (accessed on 28 December 2020).
  46. Musi, R.; Grange, B.; Sgouridis, S.; Guedez, R.; Armstrong, P.; Slocum, A.; Calvet, N. Techno-economic analysis of concentrated solar power plants in terms of levelized cost of electricity. AIP Conf. Proc. 2017, 1850, 160018. [Google Scholar] [CrossRef] [Green Version]
  47. ASHRAE. ASHRAE: HVAC Service Life Database. Available online: http://weblegacy.ashrae.org/publicdatabase/service_life.asp (accessed on 16 June 2020).
  48. Capros, P.; Vita, A.D.; Tasios, N.; Siskos, P.; Kannavou, M.; Petropoulos, A.; Evangelopoulou, S.; Zampara, M.; Papadopoulos, D.; Nakos, C.; et al. EU Reference Scenario 2016 Energy, Transport and GHG Emissions Trends to 2050. 2016. Available online: http://pure.iiasa.ac.at/id/eprint/13656/ (accessed on 21 November 2020).
  49. Secretary, I.C. Company Tax in the EU—Cyprus. Available online: https://europa.eu/youreurope/business/taxation/business-tax/company-tax-eu/cyprus/index_en.htm (accessed on 16 June 2020).
  50. Deloitte. Cyprus Tax Facts 2019. Available online: https://www2.deloitte.com/content/dam/Deloitte/cy/Documents/tax/CY_Tax-Facts-2019EN_Noexp.pdf (accessed on 16 June 2020).
  51. Jordan, D.C.; Kurtz, S.R. Photovoltaic Degradation Rates—An Analytical Review. Prog. Photovoltaics Res. Appl. 2013, 21, 12–29. [Google Scholar] [CrossRef] [Green Version]
  52. Popovski, E.; Fleiter, T.; Santos, H.; Leal, V.; Fernandes, E.O. Technical and economic feasibility of sustainable heating and cooling supply options in southern European municipalities—A case study for Matosinhos, Portugal. Energy 2018, 153, 311–323. [Google Scholar] [CrossRef]
  53. Hansen, K. Decision-making based on energy costs: Comparing levelized cost of energy and energy system costs. Energy Strategy Rev. 2019, 24, 68–82. [Google Scholar] [CrossRef]
  54. Riggs, B.C.; Biedenharn, R.; Dougher, C.; Ji, Y.V.; Xu, Q.; Romanin, V.; Codd, D.S.; Zahler, J.M.; Escarra, M.D. Techno-economic analysis of hybrid PV/T systems for process heat using electricity to subsidize the cost of heat. Appl. Energy 2017, 208, 1370–1378. [Google Scholar] [CrossRef]
  55. Portugal, R. Reports & Accounts 2019. Available online: https://www.ren.pt/en-GB/investidores/relatorio_anual (accessed on 17 November 2020).
  56. NREL. Best Research-Cell Efficiencies. 2020. Available online: https://www.nrel.gov/pv/assets/pdfs/best-research-cell-efficiencies.20200925.pdf (accessed on 23 November 2020).
  57. Cagnoli, M.; Mazzei, D.; Procopio, M.; Russo, V.; Savoldi, L.; Zanino, R. Analysis of the performance of linear Fresnel collectors: Encapsulated vs. evacuated tubes. Sol. Energy 2018, 164, 119–138. [Google Scholar] [CrossRef]
  58. Collares-Pereira, M.; Canavarro, D.; Chaves, J. 3—Improved design for linear Fresnel reflector systems. In Advances in Concentrating Solar Thermal Research and Technology; Woodhead Publishing Series in Energy; Blanco, M.J., Santigosa, L.R., Eds.; Woodhead Publishing: Cambridge, UK, 2017; pp. 45–55. [Google Scholar] [CrossRef]
  59. Margni, M.; Charles, R.; Humbert, S.; Payet, J.; Rebitzer, G.; Rosenbaum, R.; Jolliet, O. IMPACT 2002+: A new life cycle impact assessment methodology. Int. J. Life Cycle Assess 2003, 8, 324. [Google Scholar]
  60. Perez-Gallardo, J.; Montenon, A.; Maussion, P.; Azzaro-Pantel, C.; Astier, S. Comparative Life Cycle Assessment of autonomous and classical heliostats for heliothermodynamic power plants for concentrated solar power. In Proceedings of the 2012 1st International Conference on Renewable Energies and Vehicular Technology, REVET 2012, Hammamet, Tunisia, 27 March 2012. [Google Scholar] [CrossRef]
  61. Andrews, E.S.; Barthel, L.P.; Beck, T.; Benoit, C.; Ciroth, A.; Cucuzzella, C.; Gensch, C.O.; Hubert, J.; Lesage, P.; Manhart, A.; et al. Guidelines for Social Life Cycle Assessment of Products. 2009. Available online: http://www.unep.fr/shared/publications/pdf/DTIx1164xPA-guidelines_sLCA.pdf (accessed on 21 November 2020).
Figure 1. LFR collector at the Cyprus Institute and Novel Technologies Laboratory (NTL) building in the background on the left.
Energies 14 00131 g001
Figure 2. PV arrays on one row.
Energies 14 00131 g002
Figure 3. Hybrid collector configuration.
Energies 14 00131 g003
Figure 4. Flowchart for the calculation of Levelized Cost Of Heat (LCOH), including sensors, software, and methodologies.
Energies 14 00131 g004
Figure 5. Energy signature of the building as a function of outdoor ambient temperature and outdoor relative humidity.
Energies 14 00131 g005
Figure 6. Fitting of the data with the model in heating (left) and cooling (right).
Energies 14 00131 g006
Figure 7. Distribution of the relative error between modeling and the measured thermal powers (fitted by a stable distribution).
Energies 14 00131 g007
Figure 8. Electric integration of the F r e s n e l P V .
Energies 14 00131 g008
Figure 9. Simulation Studio template, with hidden control and output layers.
Energies 14 00131 g009
Figure 10. Thermal power of the LFR.
Energies 14 00131 g010
Figure 11. Average temperatures of the tank.
Energies 14 00131 g011
Figure 12. Thermal power of the collector.
Energies 14 00131 g012
Figure 13. Electricity generated by the Fresnel-PV.
Energies 14 00131 g013
Figure 14. Replacement costs per scenario without integration, Scenario 1.
Energies 14 00131 g014
Figure 15. Replacement costs per scenario with integration, Scenarios 2 and 3.
Energies 14 00131 g015
Figure 16. LCOH summary per scenario and configuration.
Energies 14 00131 g016
Figure 17. Effect of the discount rate on the final LCOH of the hybrid collector only with PV (left) and of the integrated hybrid collector feeding first the heat-pump and chillers (right). The vertical dotted line corresponds to 8.5%.
Energies 14 00131 g017
Table 1. List of operational and past facilities supplying cooling with the assistance of Linear Fresnel Reflector (LFR) technology [7,14,15].
YearLocationThermal Power (kWth)HTFAperture Area (m2)Operational Temperature (°C)
2006Bergamo, Italy74Water132195
2008Seville, Spain198Water352165
2008Grombalia, Tunisia49.5Water88160
2009Masdar, United Arab Emirates74Water132n/a
2010Doha, Qatar790Water1408180
2012Umkirch, Germany49Water88200
2013Achem, Germany272Water484200
2014Johannesburg, South Africa272Water484180
2014Gorla Maggiore, Italy450n/a772250
2016Palermo, Italy190Oil484280
2016Markaz Belbes, Egypt115Oil300140
2016Nicosia, Cyprus70Oil184180
2017Amman, Jordan705Steam1254225
Table 2. Annual energy modeling in TRNSYS18 compared to measurements.
Electric Consumption (MWh)Thermal Need (MWh)Average of the 2 Years (MWh)Modeling Results (MWh)
Cooling 201419.654.558.951.2
Cooling 201520.163.4
Heating 20149.125.258.650.6
Heating 201529.292.1
Table 3. Parameters for the levelized cost of heat.
Parameters for ComputationSymbolValue
Subsidies and incentives S 0 €0.00
Corporate tax rateTR12.5%
Residual ValueRV€0.00
Asset depreciation D E P t 10%
Discount rater8.5%
Period of analysisT25 years
Table 4. Scenarios for LCOH calculation.
ScenariosScenario 1Scenario 2Scenario 3
Only CollectorTo BuildingTo HP First
System boundariesOnly HTF loopWhole collectorWhole collector
Electricity producedExclusively absorbed by the buildingExclusively absorbed by the buildingTransmitted first to the HPs
Heat for the LCOH valueHeat produced by the LFRHeating and cooling supplied to the buildingHeating and cooling supplied to the building
Table 5. Configurations for the LCOH calculation.
ConfigurationsConfiguration aConfiguration bConfiguration c
Labels A s B u i l t H y b r i d H y b r i d + B a t t e r i e s
HybridizationNoneOnly PVsPVs and batteries
Table 6. Initial investment per scenario.
Scenario 1Scenarios 2&3
Configuration a€185,675.66€289,066.89
Configuration b€205,027.71€308,418.94
Configuration c€244,607.93€347,999.16
Table 7. Annually recurrent operation and maintenance costs C a , t of the integrated collector.
Configuration aConfiguration b&c
Mechanical parts€694.63(13%)€694.63(8%)
Safety€638.14(12%)€638.14(8%)
Tools and sensors€311.93(6%)€311.93(4%)
Cleaning€2153.00(41%)€4240.00(52%)
Electricity consumption€1264.10(24%)€2078.20(25%)
Other consumables€222.81(4%)€222.81(3%)
Total€5284.60 €8185.70
Table 8. Occurrence of the replacement costs C r , t .
YearItemCost
5Control PC€1075.00
1010 MPPT controllers€19,817.55
Battery inverter€6214.29
15Power system management€776.97
HTF€7735.00
19 PLCs€13,167.00
Flowmeter€357.87
Control absorption chiller€1310.92
36 Drivers€1306.89
72 Drivers€1306.89
Encoders€1331.09
1872 DC motors€16,941.18
Actuator HX€480.00
2011 Pumps€8409.03
Battery€12,498.60
Cooling tower€12,941.18
23Absorption chiller€26,134.45
Table 9. Cooling and heating supplied by the collector.
Cooling SuppliedHeating Supplied
Configuration a52%51%
Configurations b & c (PV assisted)81% (29%)68% (16%)
Table 10. Summary of the LCOHs with the different inflation levels (0% on top, 2.5% below).
ConfigurationsScenario 1Scenario 2Scenario 3
(Only Collector)(To Building)(To HP First)
Configuration ac€25.2c€46.8c€46.8
(As Built)c€30.1c€55.0c€55.0
Configuration bc€21.7 (−14%)c€47.6 (+2%)c€32.0 (−32%)
( H y b r i d )c€27.0 (−11%)c€57.2 (+4%)c€38.0 (−31%)
Configuration cc€25.9 (+3%)c€43.0 (−8%)c€35.2 (−25%)
( H y b r i d + B a t t . )c€32.2 (+7%)c€51.6 (−6%)c€41.9 (−24%)
Publisher’s Note: MDPI stays neutral with regard to jurisdictional claims in published maps and institutional affiliations.

