What Does Cost Structure Have to Say about Thermal Plant Energy Efficiency? The Case from Angola

Abstract

1. Introduction
2. Background on Angolan Thermal Power Plants
3. Literature Review on Thermal Power Plant Efficiency
4. The Proposed Super-Efficiency DEA Model with Undesirable Outputs
5. Data and Bootstrapped Regression Trees
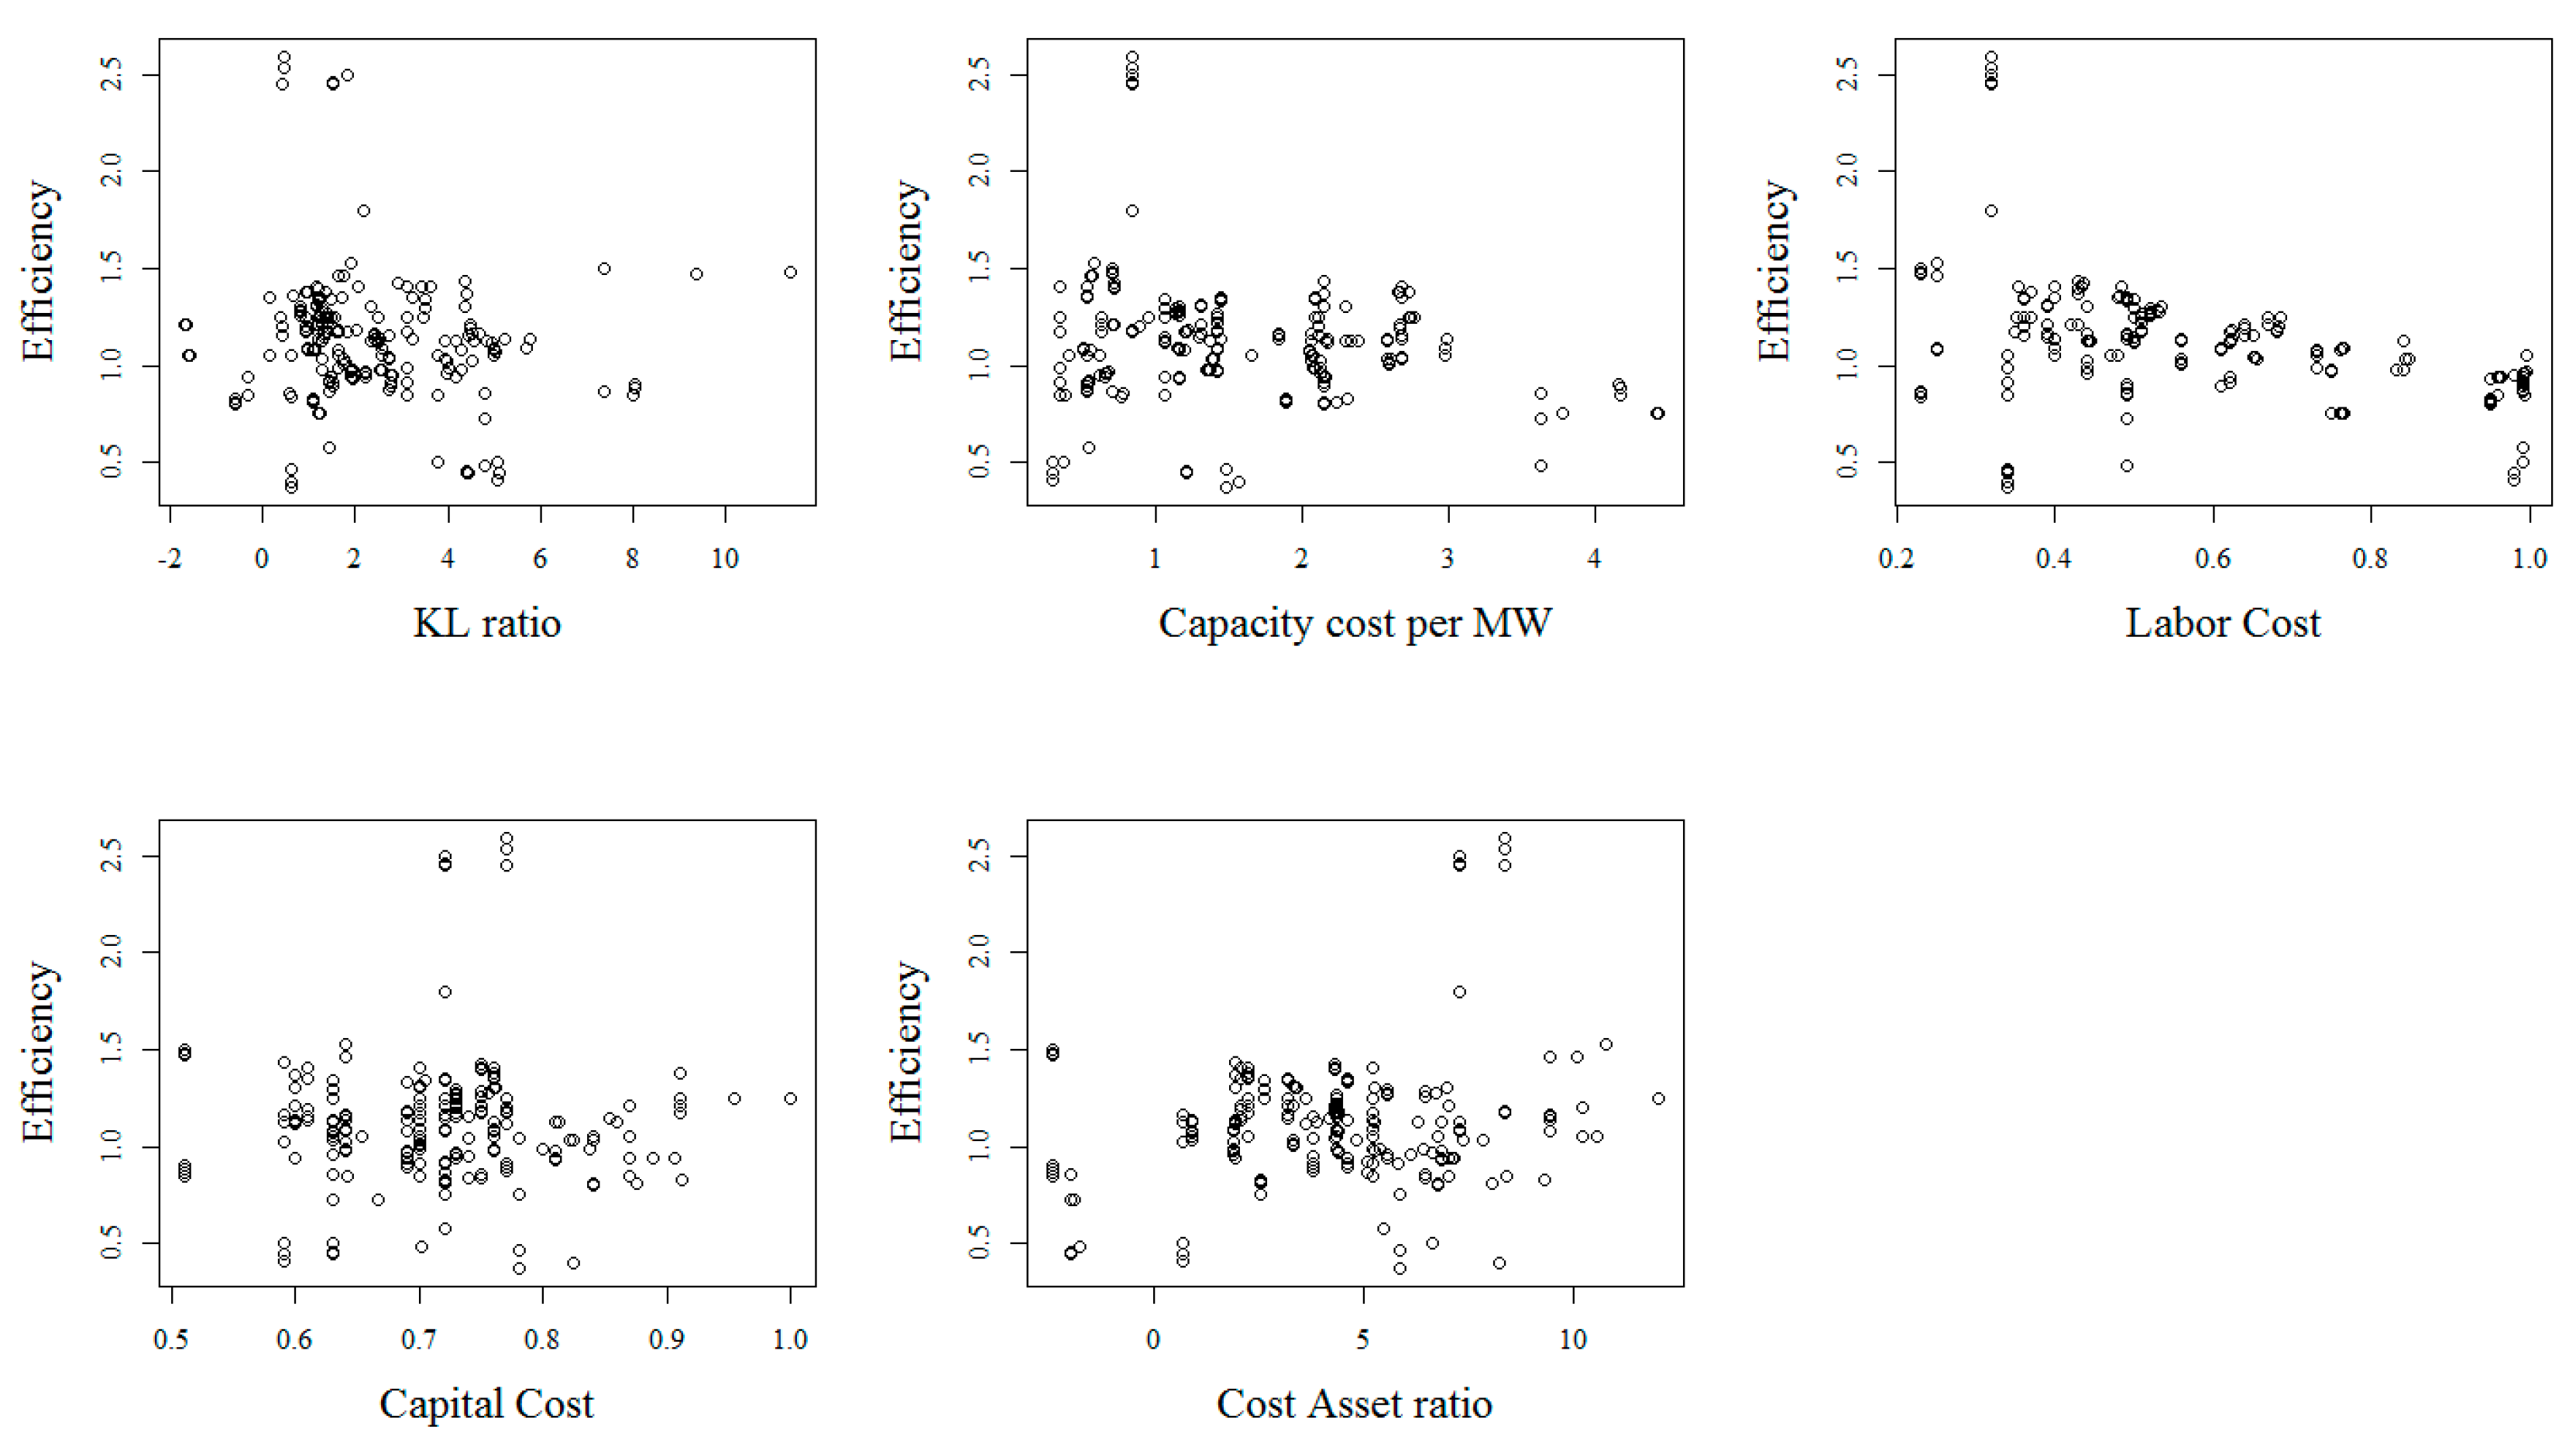
5.1. Data
5.2. Bootstrapped Regression Trees
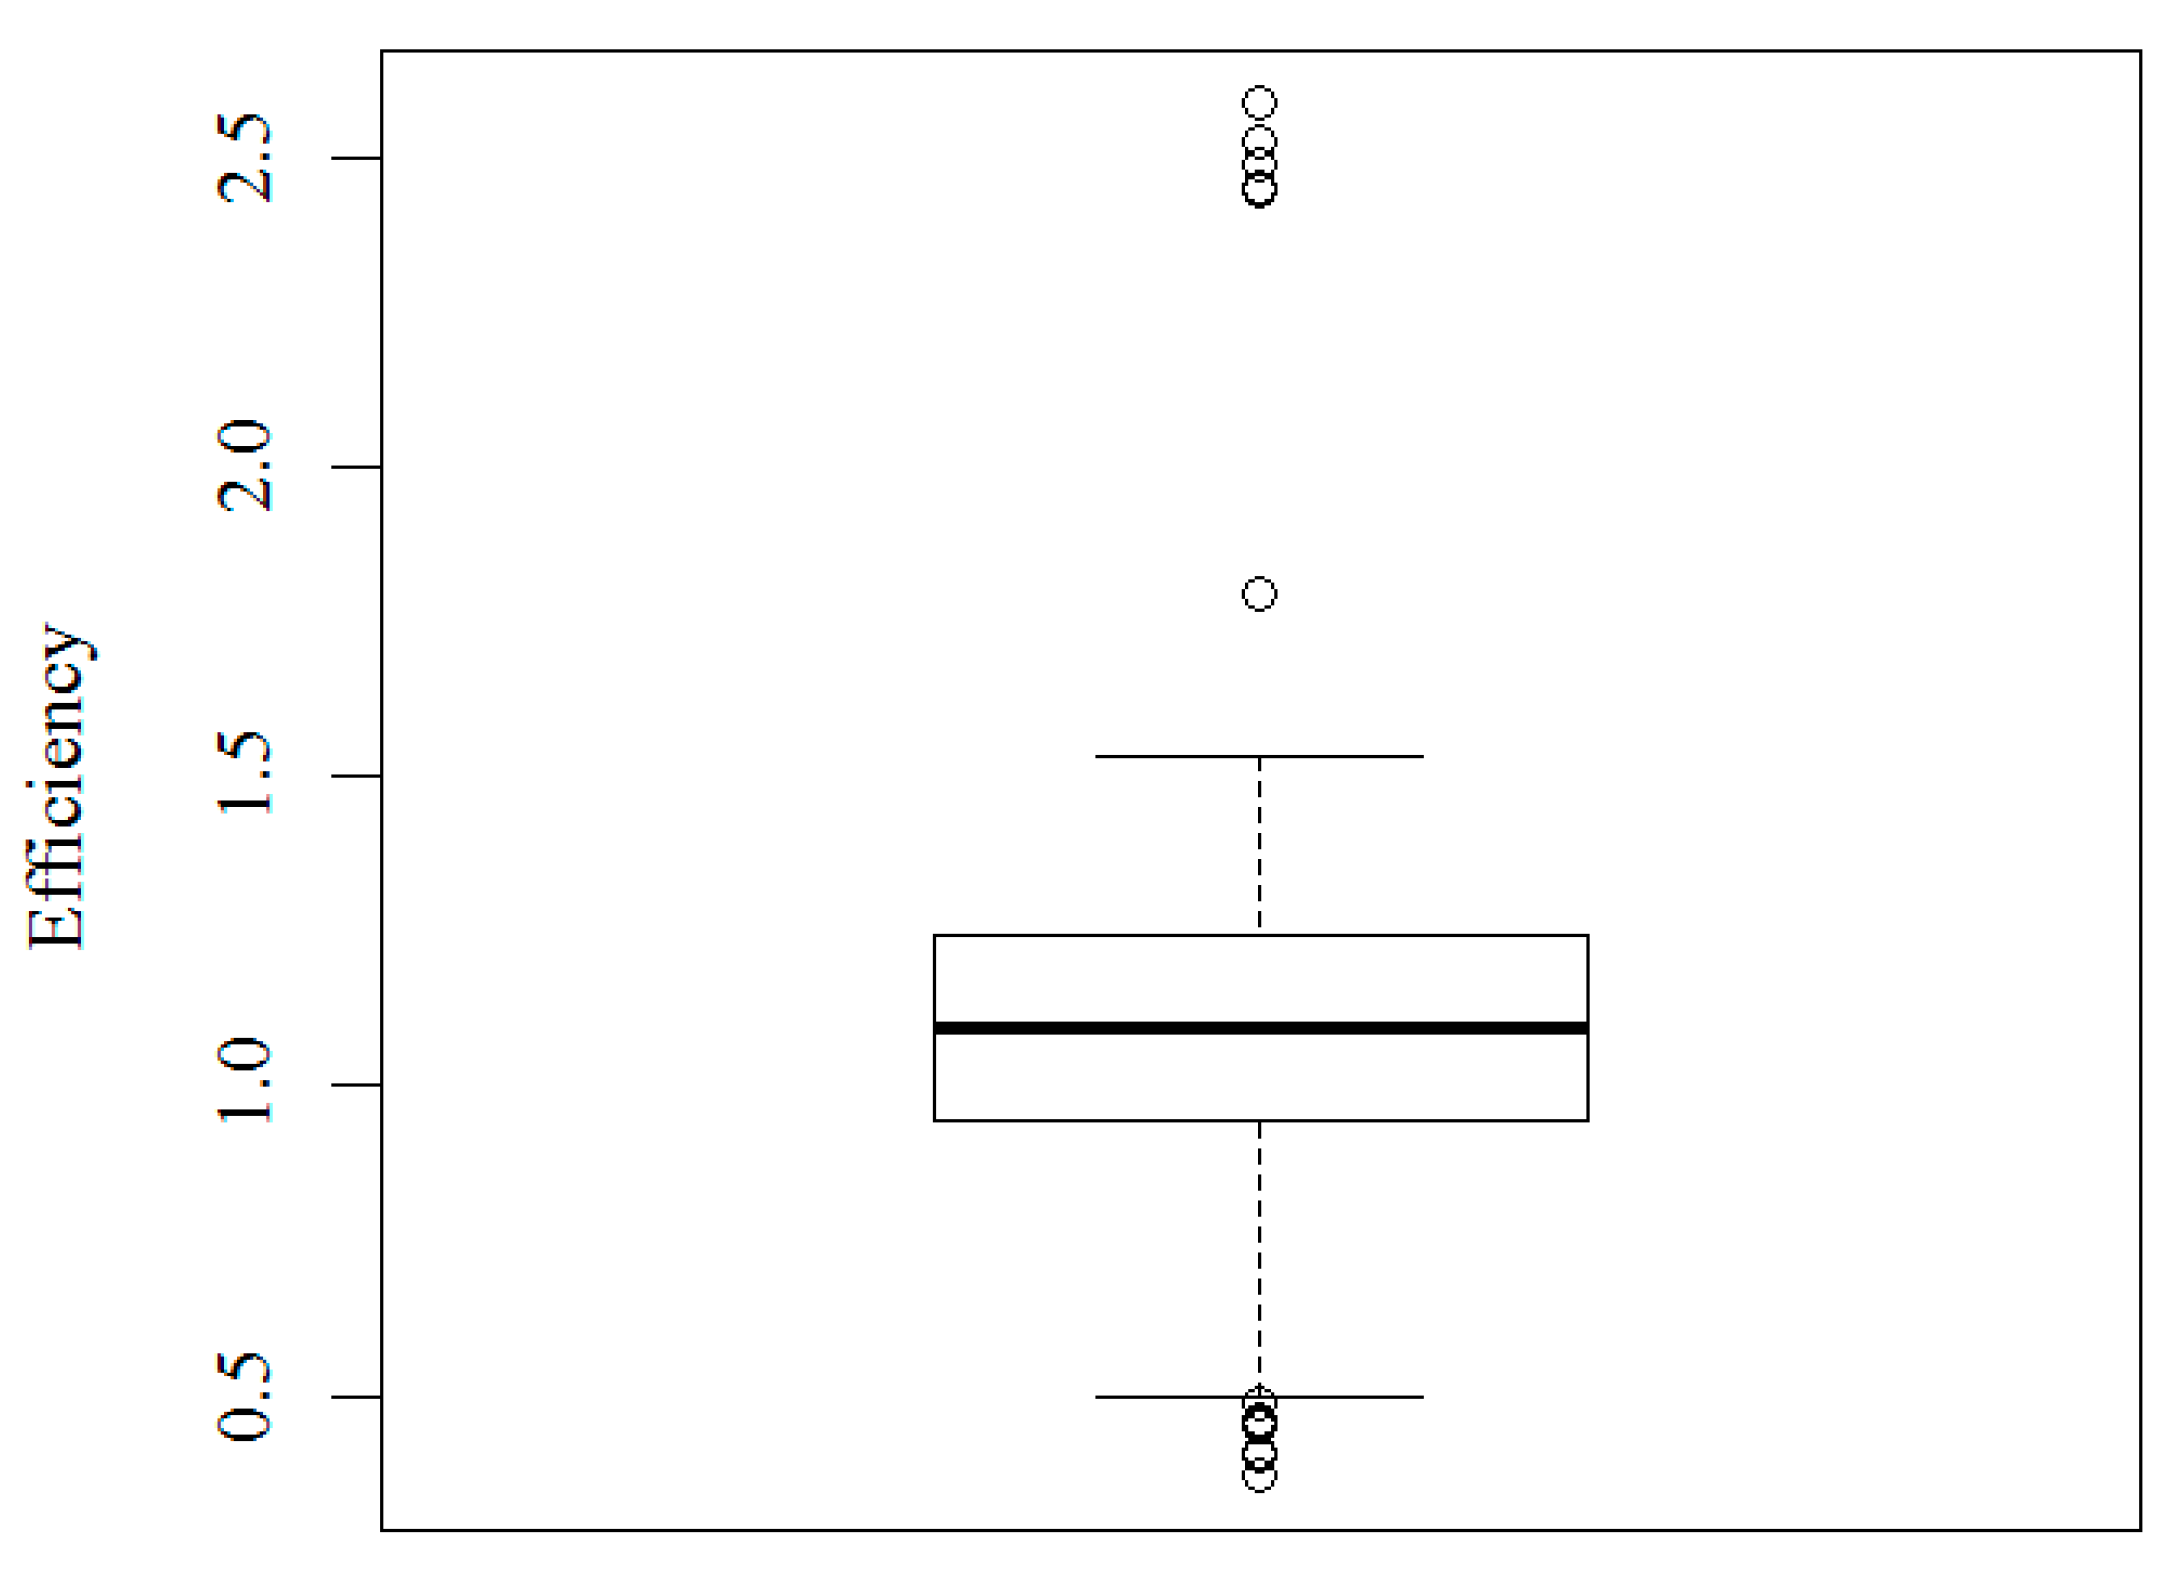
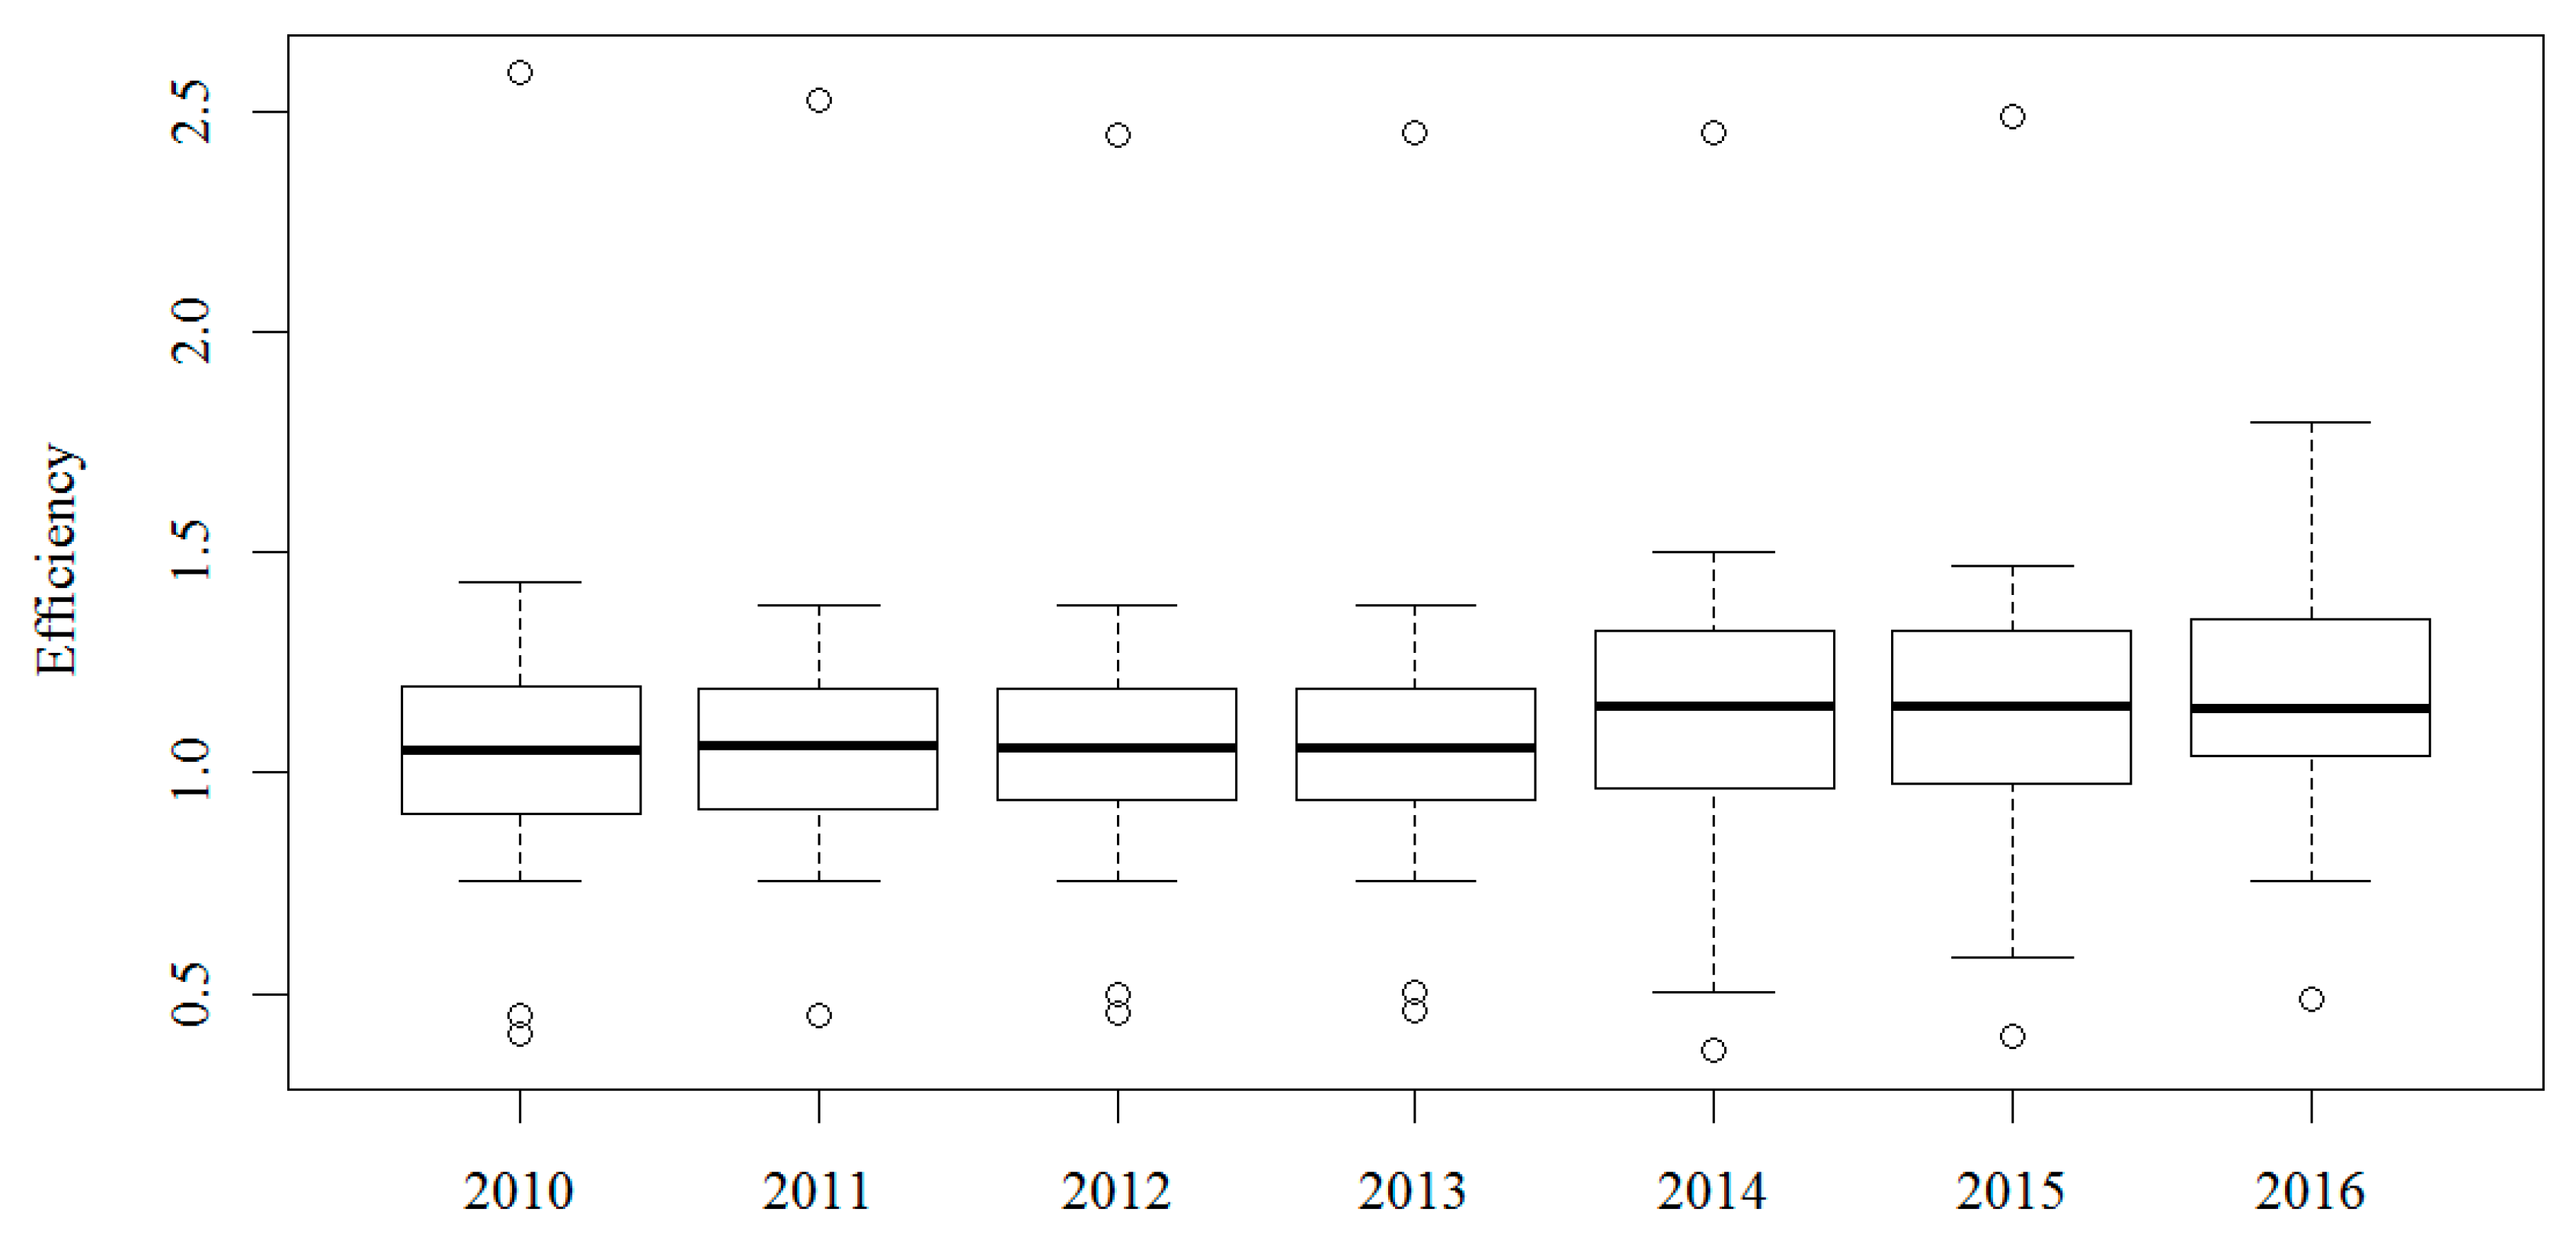
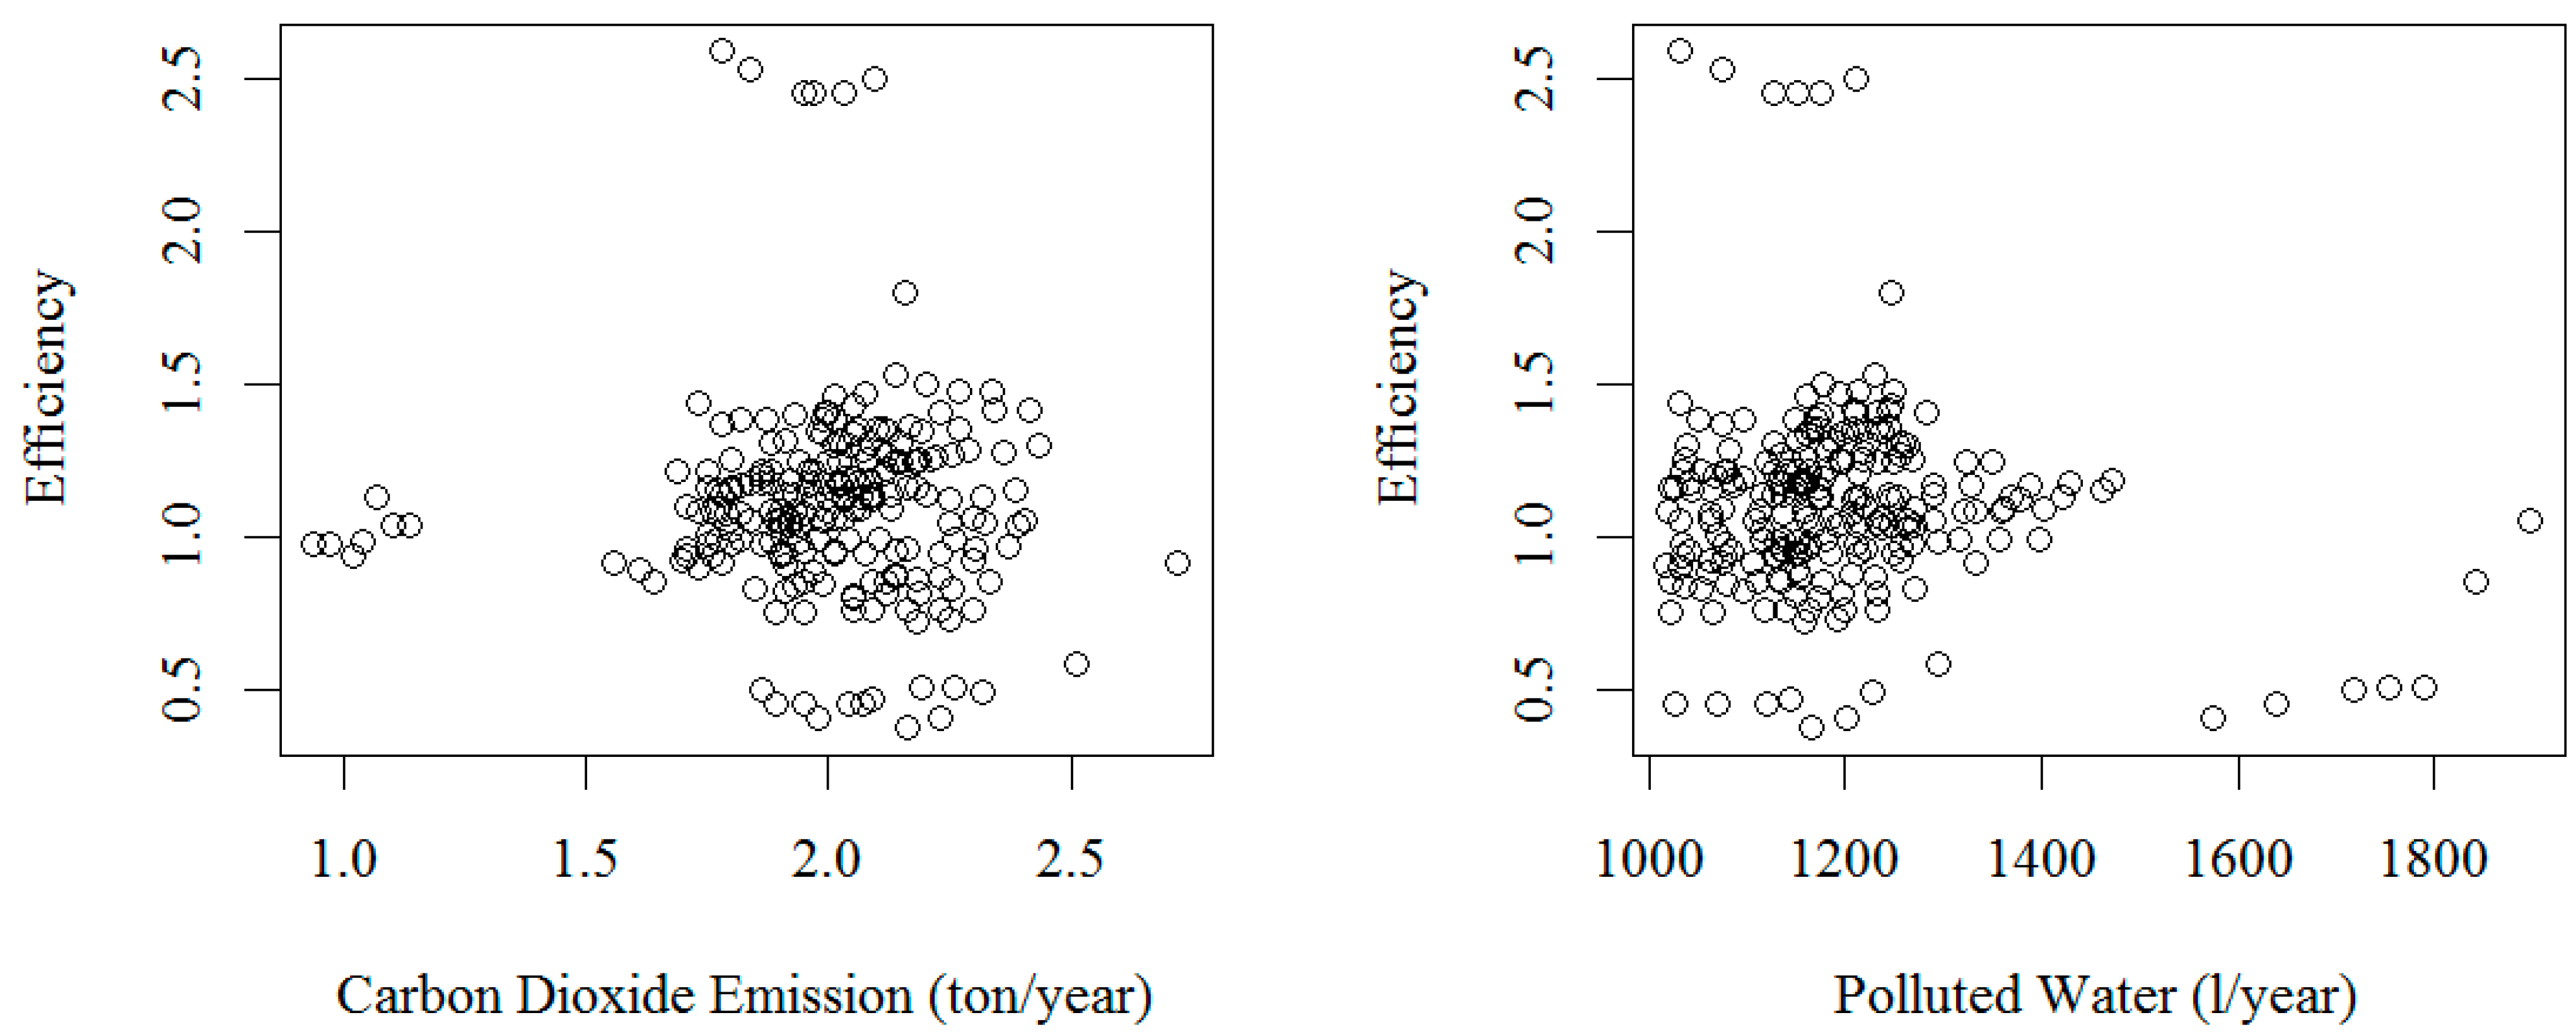
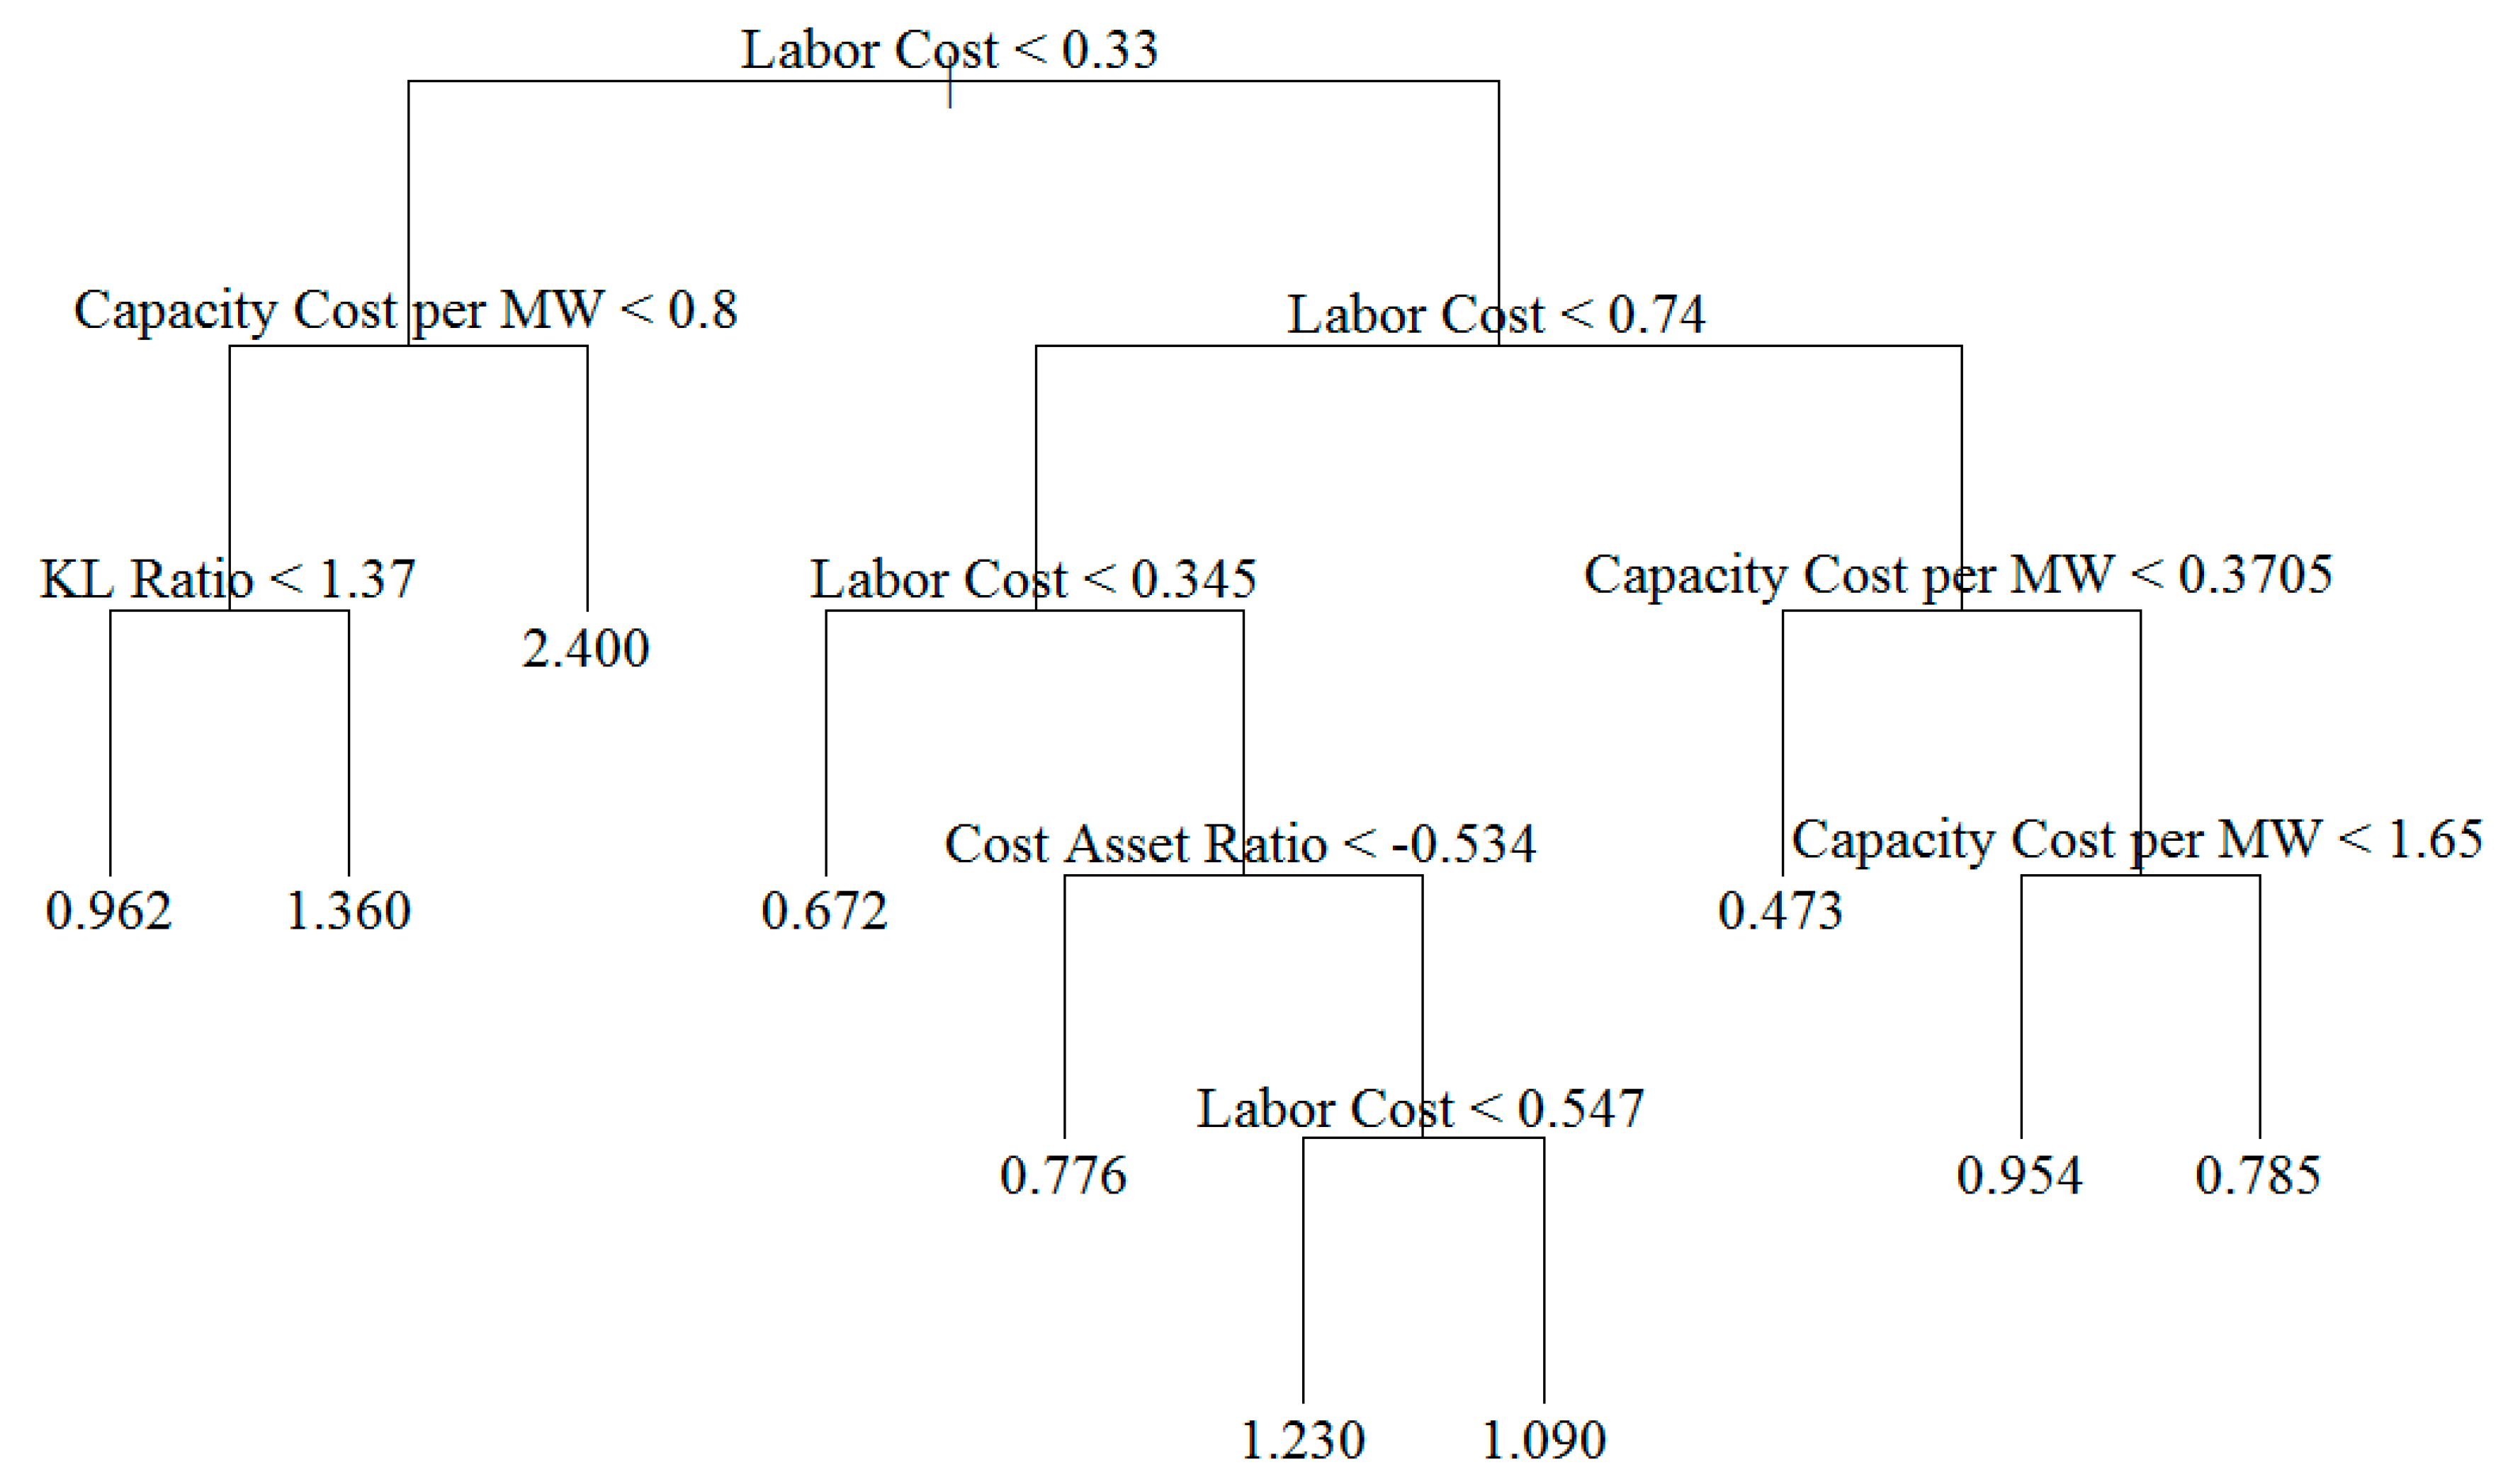
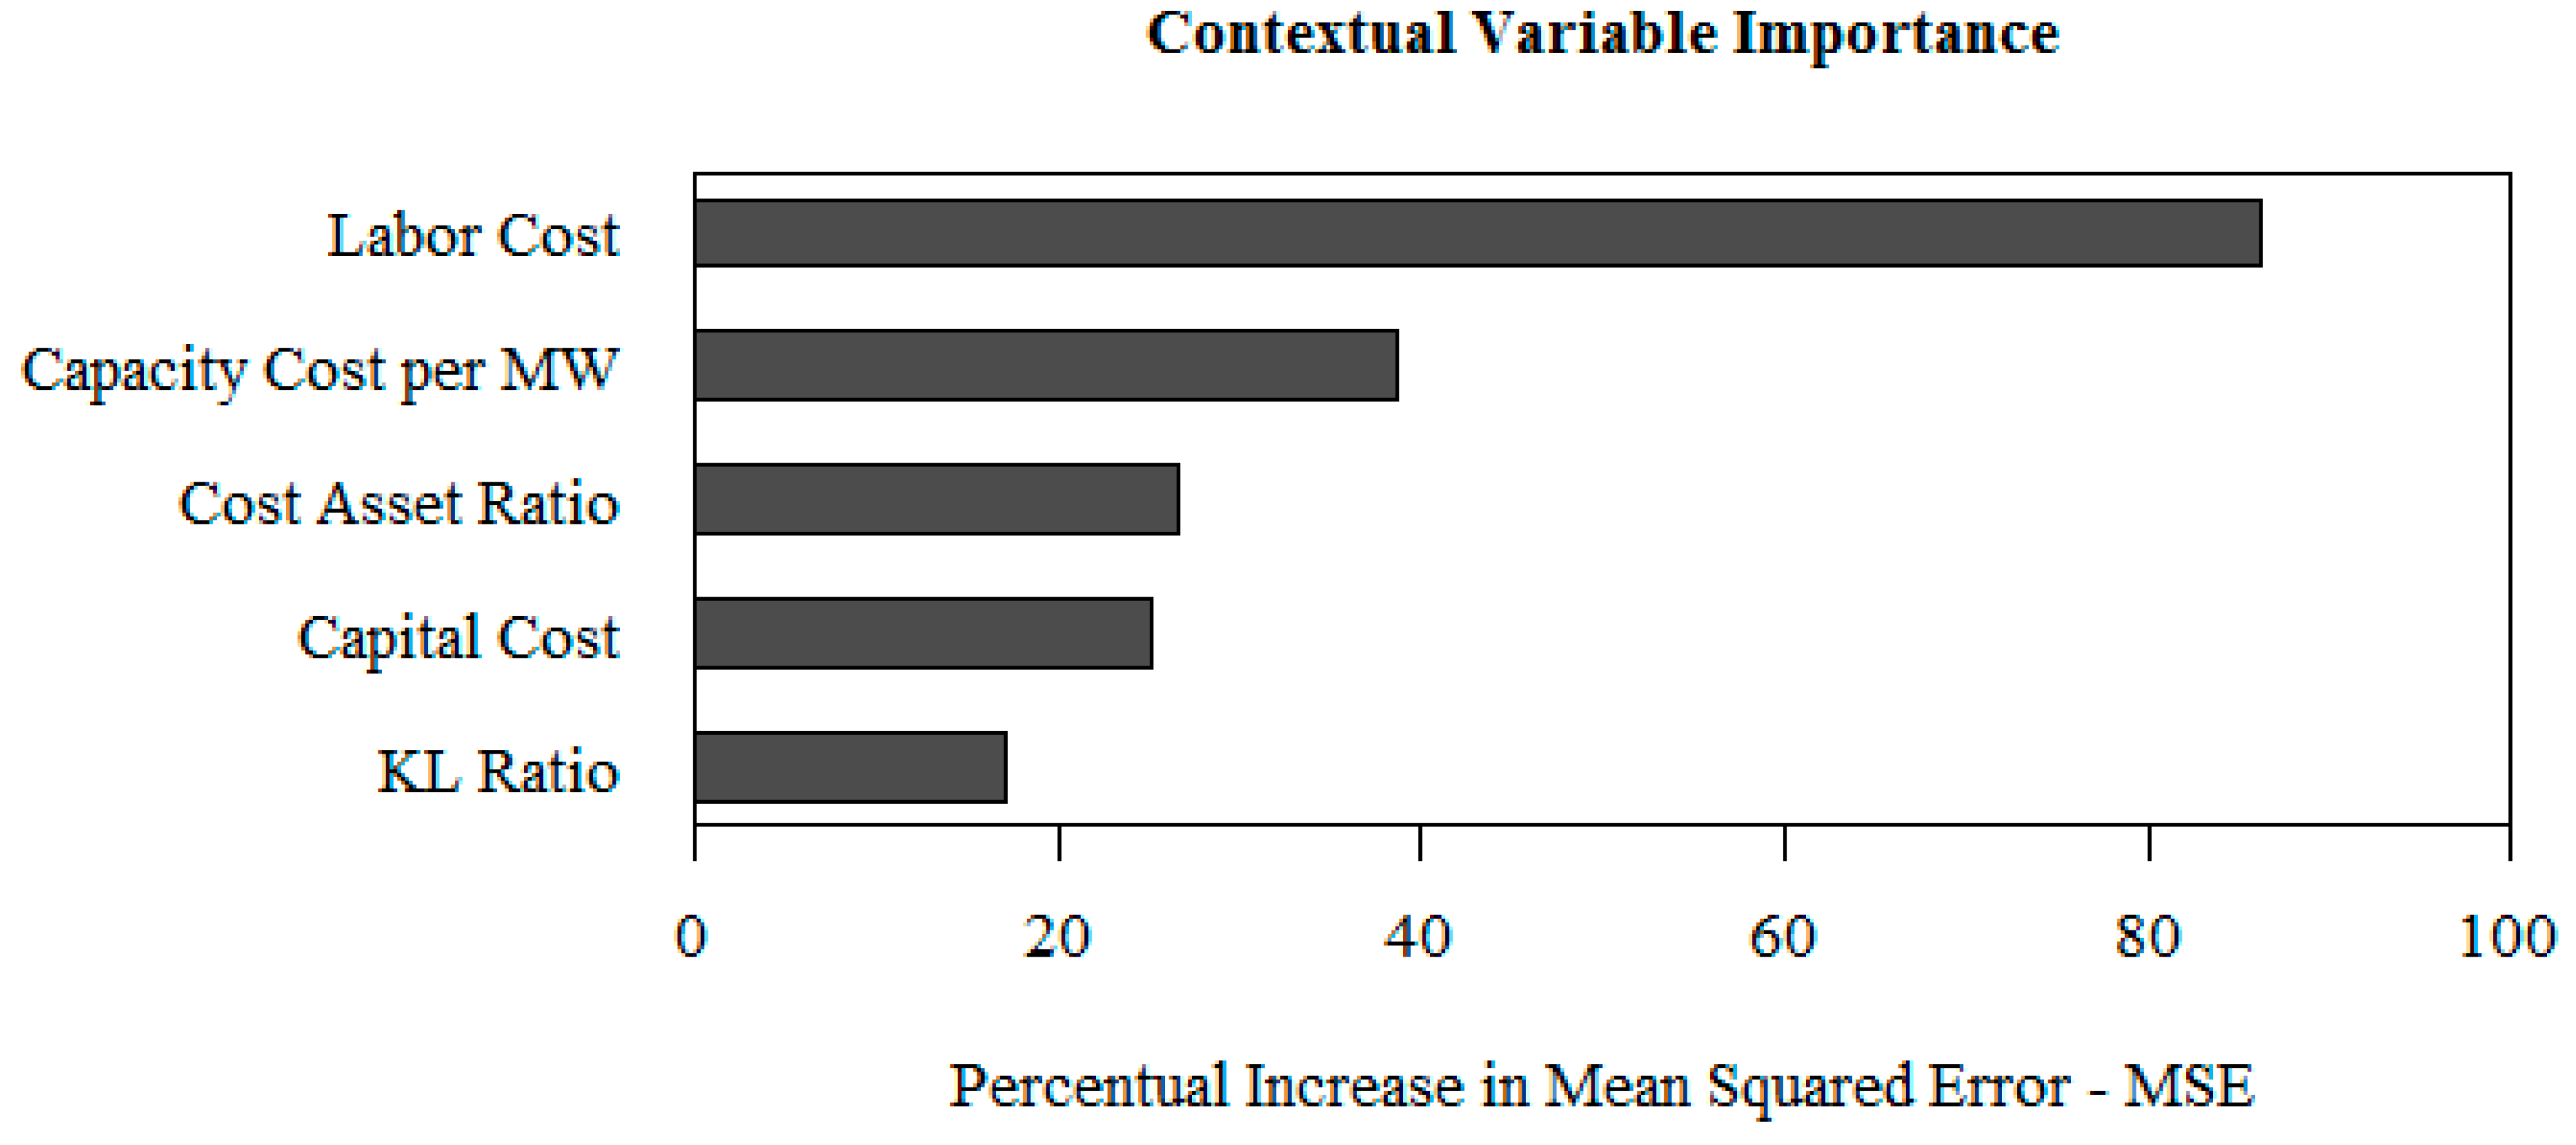
6. Results and Discussion
7. Conclusions
Author Contributions
Funding
Acknowledgments
Conflicts of Interest
Appendix A. Angolan Thermal Plants Dataset
| DMU | Year | Energy Production (MWh) | CO2 Emission (Tons Per Year) | Polluted Water (Liters Per Year) | Capacity (MW) | Number of Employees | Employee Cost Per Year (Log) | Fuel Cost Per Year (Log) | Investment Cost (Log) | KL Ratio (Log) | Capacity Cost per MW (Log) | Labor Cost Per Year (Log) | Capital Cost Per Year (Log) | Cost–Asset Ratio (Log) | Fuel_Type |
| Central Termica de Xitoto Novo | 2016 | 106.000 | 2.000 | 1232.614 | 70.000 | 45.000 | 2.768 | 9.714 | 16.660 | 3.100 | 0.340 | 0.354 | 0.700 | 5.230 | Diesel |
| Central Termica de Xitoto Antigo | 2016 | 10.000 | 2.412 | 1245.006 | 8.000 | 40.000 | 2.773 | 7.901 | 13.030 | 3.630 | 2.670 | 0.400 | 0.610 | 2.070 | Diesel |
| Central Termica do Aeroporto | 2016 | 10.000 | 2.392 | 1270.162 | 8.000 | 23.000 | 2.714 | 10.156 | 17.597 | 2.730 | 2.676 | 0.656 | 0.822 | 4.838 | Diesel |
| Central Termica de Arimba | 2016 | 40.600 | 2.372 | 1257.516 | 35.000 | 15.000 | 2.704 | 9.962 | 17.221 | 2.200 | 0.674 | 0.996 | 0.730 | 6.664 | Diesel |
| Central Termica de Anexo SE | 2016 | 30.000 | 2.432 | 1254.758 | 20.000 | 30.000 | 2.774 | 10.241 | 17.709 | 0.790 | 1.162 | 0.534 | 0.762 | 6.982 | Diesel |
| Central Termica de Kileva | 2016 | 45.600 | 2.338 | 1250.716 | 30.000 | 69.000 | 2.764 | 6.737 | 10.710 | 11.408 | 0.700 | 0.230 | 0.510 | −2.420 | Diesel |
| Central Termical do Lobito | 2016 | 20.000 | 2.318 | 1228.670 | 5.000 | 31.000 | 2.721 | 7.713 | 12.706 | 4.810 | 3.620 | 0.490 | 0.702 | −1.748 | Diesel |
| Central Termica de Biopio | 2016 | 117.000 | 2.296 | 1238.282 | 15.000 | 46.000 | 2.750 | 12.128 | 21.506 | 0.630 | 1.648 | 0.340 | 0.870 | 10.592 | Diesel |
| Central Termica do Cunene | 2016 | 15.000 | 2.296 | 1234.144 | 5.000 | 20.000 | 2.729 | 8.151 | 13.572 | 1.180 | 3.770 | 0.766 | 0.720 | 2.540 | Diesel |
| Central Termica Do Kuando Kubango | 2016 | 30.000 | 2.256 | 1270.162 | 10.000 | 16.000 | 2.721 | 11.894 | 21.067 | −0.590 | 2.310 | 0.950 | 0.912 | 9.340 | Diesel |
| Central Termica do Benfica | 2016 | 50.400 | 2.232 | 1282.926 | 35.000 | 34.000 | 2.801 | 8.449 | 14.098 | 1.154 | 0.530 | 0.484 | 0.760 | 2.250 | Diesel |
| Central Termica do Cuito | 2016 | 10.000 | 2.212 | 1268.818 | 7.000 | 42.000 | 2.743 | 11.039 | 19.334 | 1.566 | 2.762 | 0.370 | 1.000 | 2.250 | Diesel |
| Central Termica do Moxico | 2016 | 40.000 | 2.176 | 1250.726 | 30.000 | 23.000 | 2.759 | 12.352 | 21.945 | 0.920 | 0.950 | 0.686 | 0.770 | 12.058 | Diesel |
| Central Termica de Cazenga | 2016 | 40.000 | 2.156 | 1246.388 | 30.000 | 50.000 | 2.773 | 41.401 | 17.928 | 2.160 | 0.830 | 0.320 | 0.720 | 7.280 | Combined Cycle Gas |
| Central Termica do Caminho de Ferro de Luanda | 2016 | 96.800 | 2.136 | 1231.272 | 50.000 | 65.000 | 2.788 | 10.674 | 18.560 | 1.902 | 0.580 | 0.250 | 0.640 | 10.784 | Diesel |
| Central Termica do Morro Bento | 2016 | 30.000 | 2.112 | 1232.224 | 15.000 | 32.000 | 2.752 | 9.152 | 15.552 | 1.210 | 1.440 | 0.490 | 0.720 | 4.630 | Diesel |
| Central Termica do Morro da Luz | 2016 | 34.800 | 2.092 | 1245.008 | 10.000 | 25.000 | 2.747 | 7.872 | 12.996 | 5.770 | 2.166 | 0.624 | 0.600 | 1.940 | Diesel |
| Central Termica KM9 | 2016 | 15.000 | 2.092 | 1246.398 | 10.000 | 35.000 | 2.748 | 11.582 | 20.416 | 2.330 | 2.374 | 0.446 | 0.860 | 7.300 | Diesel |
| Central Termica Benfica | 2016 | 20.000 | 1.136 | 1247.778 | 17.000 | 18.000 | 2.723 | 11.272 | 19.821 | 1.270 | 1.388 | 0.846 | 0.840 | 7.850 | Diesel |
| Central Termica Praia do Bispo | 2016 | 35.000 | 2.074 | 1249.168 | 20.000 | 15.000 | 2.671 | 10.939 | 19.207 | −0.330 | 1.060 | 0.964 | 0.906 | 7.162 | Diesel |
| Central Termica dos Quarteis | 2016 | 30.000 | 2.052 | 1246.548 | 30.000 | 37.000 | 2.781 | 9.445 | 16.110 | 2.936 | 0.716 | 0.436 | 0.750 | 4.340 | Diesel |
| Central Termica Boavista I | 2016 | 32.000 | 2.252 | 1255.880 | 15.000 | 30.000 | 2.728 | 9.084 | 15.440 | 1.380 | 1.410 | 0.510 | 0.730 | 4.356 | Diesel |
| Central Termica Boavista II | 2016 | 20.000 | 2.192 | 1237.996 | 10.000 | 45.000 | 2.785 | 8.881 | 14.976 | 1.704 | 2.080 | 0.360 | 0.720 | 3.180 | Diesel |
| Central Termica Boavista III | 2016 | 22.600 | 2.148 | 1259.340 | 16.000 | 42.000 | 2.796 | 8.700 | 14.605 | 1.160 | 1.304 | 0.390 | 0.700 | 3.404 | Diesel |
| Central Termica Kassaki | 2016 | 10.000 | 2.128 | 1290.828 | 8.000 | 28.000 | 2.752 | 7.878 | 13.003 | 5.214 | 2.580 | 0.560 | 0.630 | 0.930 | Diesel |
| Central Termica CEEF | 2016 | 15.000 | 2.106 | 1396.924 | 10.000 | 20.000 | 2.681 | 10.064 | 17.447 | 1.640 | 2.082 | 0.730 | 0.838 | 6.434 | Diesel |
| Central Termica do Bengo | 2016 | 32.200 | 2.086 | 1472.140 | 18.000 | 25.000 | 2.747 | 8.937 | 15.128 | 2.008 | 1.218 | 0.624 | 0.690 | 4.418 | Diesel |
| Central Termica do Uige | 2016 | 20.000 | 2.128 | 1402.332 | 15.000 | 20.000 | 2.727 | 8.179 | 13.632 | 5.710 | 1.420 | 0.764 | 0.640 | 1.890 | Diesel |
| Central Termica Banza Congo | 2016 | 20.000 | 2.086 | 1368.170 | 10.000 | 35.000 | 2.734 | 7.444 | 12.154 | 4.820 | 2.060 | 0.440 | 0.590 | 0.680 | Diesel |
| Central Termica Soyo | 2016 | 110.600 | 2.402 | 1898.212 | 70.000 | 15.000 | 2.704 | 42.215 | 18.404 | 3.760 | 0.402 | 0.996 | 0.654 | 10.232 | Combined Cycle Gas |
| Central Termica Landana | 2016 | 30.200 | 2.386 | 1462.912 | 20.000 | 30.000 | 2.708 | 10.406 | 18.105 | 2.490 | 1.060 | 0.500 | 0.854 | 4.204 | Diesel |
| Central Termica Malongo | 2016 | 45.000 | 2.720 | 1333.350 | 40.000 | 15.000 | 2.698 | 9.183 | 15.667 | 1.420 | 0.544 | 0.990 | 0.720 | 5.854 | Diesel |
| Central Termica de Xitoto Novo | 2015 | 93.000 | 1.940 | 1197.222 | 70.000 | 45.000 | 2.763 | 9.711 | 16.660 | 3.100 | 0.340 | 0.352 | 0.700 | 5.230 | Diesel |
| Central Termica de Xitoto Antigo | 2015 | 10.000 | 2.341 | 1209.258 | 8.000 | 40.000 | 2.773 | 7.901 | 13.030 | 3.430 | 2.670 | 0.400 | 0.610 | 2.070 | Diesel |
| Central Termica do Aeroporto | 2015 | 10.000 | 2.321 | 1233.691 | 8.000 | 23.000 | 2.709 | 9.705 | 16.701 | 2.730 | 2.673 | 0.653 | 0.781 | 4.319 | Diesel |
| Central Termica de Arimba | 2015 | 40.300 | 2.301 | 1221.408 | 35.000 | 15.000 | 2.701 | 9.808 | 16.914 | 2.200 | 0.662 | 0.993 | 0.730 | 6.127 | Diesel |
| Central Termica de Anexo SE | 2015 | 30.000 | 2.361 | 1218.729 | 20.000 | 30.000 | 2.770 | 10.124 | 17.479 | 0.790 | 1.156 | 0.532 | 0.756 | 6.721 | Diesel |
| Central Termica de Kileva | 2015 | 42.800 | 2.269 | 1214.803 | 30.000 | 69.000 | 2.764 | 6.737 | 10.710 | 9.384 | 0.700 | 0.230 | 0.510 | -2.420 | Diesel |
| Central Termical do Lobito | 2015 | 20.000 | 2.249 | 1193.390 | 5.000 | 31.000 | 2.721 | 7.388 | 12.055 | 4.810 | 3.620 | 0.490 | 0.666 | -1.874 | Diesel |
| Central Termica de Biopio | 2015 | 103.500 | 2.228 | 1202.726 | 15.000 | 46.000 | 2.750 | 11.052 | 19.354 | 0.630 | 1.564 | 0.340 | 0.825 | 8.231 | Diesel |
| Central Termica do Cunene | 2015 | 15.000 | 2.228 | 1198.707 | 5.000 | 20.000 | 2.725 | 8.149 | 13.572 | 1.180 | 3.770 | 0.763 | 0.720 | 2.540 | Diesel |
| Central Termica Do Kuando Kubango | 2015 | 30.000 | 2.188 | 1233.691 | 10.000 | 16.000 | 2.721 | 11.128 | 19.535 | -0.590 | 2.230 | 0.950 | 0.876 | 8.065 | Diesel |
| Central Termica do Benfica | 2015 | 45.200 | 2.166 | 1246.088 | 35.000 | 34.000 | 2.797 | 8.447 | 14.098 | 0.642 | 0.530 | 0.482 | 0.760 | 2.250 | Diesel |
| Central Termica do Cuito | 2015 | 10.000 | 2.146 | 1232.384 | 7.000 | 42.000 | 2.743 | 10.534 | 18.324 | 1.453 | 2.741 | 0.370 | 0.955 | 2.250 | Diesel |
| Central Termica do Moxico | 2015 | 40.000 | 2.113 | 1214.813 | 30.000 | 23.000 | 2.754 | 11.657 | 20.559 | 0.920 | 0.890 | 0.683 | 0.770 | 10.219 | Diesel |
| Central Termica de Cazenga | 2015 | 40.000 | 2.093 | 1210.599 | 30.000 | 50.000 | 2.773 | 41.401 | 17.928 | 1.840 | 0.830 | 0.320 | 0.720 | 7.280 | Combined Cycle Gas |
| Central Termica do Caminho de Ferro de Luanda | 2015 | 88.400 | 2.073 | 1195.916 | 50.000 | 65.000 | 2.788 | 10.434 | 18.080 | 1.756 | 0.565 | 0.250 | 0.640 | 10.127 | Diesel |
| Central Termica do Morro Bento | 2015 | 30.000 | 2.051 | 1196.842 | 15.000 | 32.000 | 2.752 | 8.990 | 15.228 | 1.210 | 1.440 | 0.490 | 0.705 | 4.630 | Diesel |
| Central Termica do Morro da Luz | 2015 | 32.400 | 2.031 | 1209.259 | 10.000 | 25.000 | 2.744 | 7.861 | 12.978 | 4.970 | 2.163 | 0.622 | 0.600 | 1.940 | Diesel |
| Central Termica KPM9 | 2015 | 15.000 | 2.031 | 1210.609 | 10.000 | 35.000 | 2.741 | 10.815 | 18.889 | 2.330 | 2.332 | 0.443 | 0.810 | 6.295 | Diesel |
| Central Termica Benfica | 2015 | 20.000 | 1.103 | 1211.949 | 17.000 | 18.000 | 2.720 | 11.030 | 19.340 | 1.270 | 1.379 | 0.843 | 0.825 | 7.370 | Diesel |
| Central Termica Praia do Bispo | 2015 | 35.000 | 2.012 | 1213.299 | 20.000 | 15.000 | 2.669 | 10.747 | 18.826 | -0.330 | 1.060 | 0.962 | 0.888 | 7.111 | Diesel |
| Central Termica dos Quarteis | 2015 | 30.000 | 1.991 | 1210.754 | 30.000 | 37.000 | 2.774 | 9.408 | 16.043 | 2.073 | 0.713 | 0.433 | 0.750 | 4.340 | Diesel |
| Central Termica Boavista I | 2015 | 31.000 | 2.186 | 1219.820 | 15.000 | 30.000 | 2.728 | 9.084 | 15.440 | 1.380 | 1.410 | 0.510 | 0.730 | 4.353 | Diesel |
| Central Termica Boavista II | 2015 | 20.000 | 2.126 | 1202.448 | 10.000 | 45.000 | 2.785 | 8.881 | 14.976 | 1.462 | 2.080 | 0.360 | 0.720 | 3.180 | Diesel |
| Central Termica Boavista III | 2015 | 21.300 | 2.084 | 1223.180 | 16.000 | 42.000 | 2.796 | 8.689 | 14.582 | 1.160 | 1.302 | 0.390 | 0.700 | 3.362 | Diesel |
| Central Termica Kassaki | 2015 | 10.000 | 2.064 | 1253.764 | 8.000 | 28.000 | 2.752 | 7.878 | 13.003 | 4.567 | 2.580 | 0.560 | 0.630 | 0.930 | Diesel |
| Central Termica CEEF | 2015 | 15.000 | 2.043 | 1356.812 | 10.000 | 20.000 | 2.681 | 9.634 | 16.587 | 1.640 | 2.076 | 0.730 | 0.799 | 5.402 | Diesel |
| Central Termica do Bengo | 2015 | 31.100 | 2.023 | 1429.870 | 18.000 | 25.000 | 2.744 | 8.849 | 14.954 | 1.814 | 1.204 | 0.622 | 0.690 | 4.409 | Diesel |
| Central Termica do Uige | 2015 | 20.000 | 2.064 | 1362.066 | 15.000 | 20.000 | 2.724 | 8.178 | 13.632 | 5.000 | 1.420 | 0.762 | 0.640 | 1.890 | Diesel |
| Central Termica Banza Congo | 2015 | 20.000 | 2.023 | 1328.885 | 10.000 | 35.000 | 2.734 | 7.444 | 12.154 | 4.665 | 2.060 | 0.440 | 0.590 | 0.680 | Diesel |
| Central Termica Soyo | 2015 | 100.300 | 2.331 | 1843.706 | 70.000 | 15.000 | 2.701 | 39.646 | 17.122 | 3.760 | 0.381 | 0.993 | 0.642 | 8.441 | Combined Cycle Gas |
| Central Termica Landana | 2015 | 30.100 | 2.318 | 1420.906 | 20.000 | 30.000 | 2.708 | 9.961 | 17.214 | 2.490 | 1.060 | 0.500 | 0.812 | 3.907 | Diesel |
| Central Termica Malongo | 2015 | 45.000 | 2.510 | 1295.065 | 40.000 | 15.000 | 2.698 | 9.154 | 15.610 | 1.420 | 0.542 | 0.990 | 0.720 | 5.467 | Diesel |
| Central Termica de Xitoto Novo | 2014 | 80.000 | 1.880 | 1161.830 | 70.000 | 45.000 | 2.757 | 9.708 | 16.660 | 3.100 | 0.340 | 0.350 | 0.700 | 5.230 | Diesel |
| Central Termica de Xitoto Antigo | 2014 | 10.000 | 2.270 | 1173.510 | 8.000 | 40.000 | 2.773 | 7.901 | 13.030 | 3.230 | 2.670 | 0.400 | 0.610 | 2.070 | Diesel |
| Central Termica do Aeroporto | 2014 | 10.000 | 2.250 | 1197.220 | 8.000 | 23.000 | 2.705 | 9.256 | 15.806 | 2.730 | 2.670 | 0.650 | 0.740 | 3.800 | Diesel |
| Central Termica de Arimba | 2014 | 40.000 | 2.230 | 1185.300 | 35.000 | 15.000 | 2.698 | 9.653 | 16.608 | 2.200 | 0.650 | 0.990 | 0.730 | 5.590 | Diesel |
| Central Termica de Anexo SE | 2014 | 30.000 | 2.290 | 1182.700 | 20.000 | 30.000 | 2.766 | 10.008 | 17.250 | 0.790 | 1.150 | 0.530 | 0.750 | 6.460 | Diesel |
| Central Termica de Kileva | 2014 | 40.000 | 2.200 | 1178.890 | 30.000 | 69.000 | 2.764 | 6.737 | 10.710 | 7.360 | 0.700 | 0.230 | 0.510 | -2.420 | Diesel |
| Central Termical do Lobito | 2014 | 20.000 | 2.180 | 1158.110 | 5.000 | 31.000 | 2.721 | 7.062 | 11.403 | 4.810 | 3.620 | 0.490 | 0.630 | -2.000 | Diesel |
| Central Termica de Biopio | 2014 | 90.000 | 2.160 | 1167.170 | 15.000 | 46.000 | 2.750 | 10.033 | 17.316 | 0.630 | 1.480 | 0.340 | 0.780 | 5.870 | Diesel |
| Central Termica do Cunene | 2014 | 15.000 | 2.160 | 1163.270 | 5.000 | 20.000 | 2.721 | 8.147 | 13.572 | 1.180 | 3.770 | 0.760 | 0.720 | 2.540 | Diesel |
| Central Termica Do Kuando Kubango | 2014 | 30.000 | 2.120 | 1197.220 | 10.000 | 16.000 | 2.721 | 10.391 | 18.060 | -0.590 | 2.150 | 0.950 | 0.840 | 6.790 | Diesel |
| Central Termica do Benfica | 2014 | 40.000 | 2.100 | 109.250 | 35.000 | 34.000 | 2.792 | 8.445 | 14.098 | 0.130 | 0.530 | 0.480 | 0.760 | 2.250 | Diesel |
| Central Termica do Cuito | 2014 | 10.000 | 2.080 | 195.950 | 7.000 | 42.000 | 2.743 | 10.035 | 17.326 | 1.340 | 2.720 | 0.370 | 0.910 | 2.250 | Diesel |
| Central Termica do Moxico | 2014 | 40.000 | 2.050 | 1178.900 | 30.000 | 23.000 | 2.750 | 10.961 | 19.173 | 0.920 | 0.830 | 0.680 | 0.770 | 8.380 | Diesel |
| Central Termica de Cazenga | 2014 | 40.000 | 2.030 | 1174.810 | 30.000 | 50.000 | 2.773 | 41.401 | 17.928 | 1.520 | 0.830 | 0.320 | 0.720 | 7.280 | Combined Cycle Gas |
| Central Termica do Caminho de Ferro de Luanda | 2014 | 80.000 | 2.010 | 1160.560 | 50.000 | 65.000 | 2.788 | 10.194 | 17.600 | 1.610 | 0.550 | 0.250 | 0.640 | 9.470 | Diesel |
| Central Termica do Morro Bento | 2014 | 30.000 | 1.990 | 1161.460 | 15.000 | 32.000 | 2.752 | 8.828 | 14.904 | 1.210 | 1.440 | 0.490 | 0.690 | 4.630 | Diesel |
| Central Termica do Morro da Luz | 2014 | 30.000 | 1.970 | 1173.510 | 10.000 | 25.000 | 2.741 | 7.850 | 12.960 | 4.170 | 2.160 | 0.620 | 0.600 | 1.940 | Diesel |
| Central Termica KM9 | 2014 | 15.000 | 1.970 | 1174.820 | 10.000 | 35.000 | 2.734 | 10.069 | 17.404 | 2.330 | 2.290 | 0.440 | 0.760 | 5.290 | Diesel |
| Central Termica Benfica | 2014 | 20.000 | 1.070 | 1176.120 | 17.000 | 18.000 | 2.716 | 10.790 | 18.865 | 1.270 | 1.370 | 0.840 | 0.810 | 6.890 | Diesel |
| Central Termica Praia do Bispo | 2014 | 35.000 | 1.950 | 1177.430 | 20.000 | 15.000 | 2.667 | 10.556 | 18.444 | -0.330 | 1.060 | 0.960 | 0.870 | 7.060 | Diesel |
| Central Termica dos Quarteis | 2014 | 30.000 | 1.930 | 1174.960 | 30.000 | 37.000 | 2.767 | 9.371 | 15.975 | 1.210 | 0.710 | 0.430 | 0.750 | 4.340 | Diesel |
| Central Termica Boavista I | 2014 | 30.000 | 2.120 | 1183.760 | 15.000 | 30.000 | 2.728 | 9.084 | 15.440 | 1.380 | 1.410 | 0.510 | 0.730 | 4.350 | Diesel |
| Central Termica Boavista II | 2014 | 20.000 | 2.060 | 1166.900 | 10.000 | 45.000 | 2.785 | 8.881 | 14.976 | 1.220 | 2.080 | 0.360 | 0.720 | 3.180 | Diesel |
| Central Termica Boavista III | 2014 | 20.000 | 2.020 | 1187.020 | 16.000 | 42.000 | 2.796 | 8.678 | 14.560 | 1.160 | 1.300 | 0.390 | 0.700 | 3.320 | Diesel |
| Central Termica Kassaki | 2014 | 10.000 | 2.000 | 1216.700 | 8.000 | 28.000 | 2.752 | 7.878 | 13.003 | 3.920 | 2.580 | 0.560 | 0.630 | 0.930 | Diesel |
| Central Termica CEEF | 2014 | 15.000 | 1.980 | 1316.700 | 10.000 | 20.000 | 2.681 | 9.207 | 15.732 | 1.640 | 2.070 | 0.730 | 0.760 | 4.370 | Diesel |
| Central Termica do Bengo | 2014 | 30.000 | 1.960 | 1387.600 | 18.000 | 25.000 | 2.741 | 8.760 | 14.780 | 1.620 | 1.190 | 0.620 | 0.690 | 4.400 | Diesel |
| Central Termica do Uige | 2014 | 20.000 | 2.000 | 1321.800 | 15.000 | 20.000 | 2.721 | 8.177 | 13.632 | 4.290 | 1.420 | 0.760 | 0.640 | 1.890 | Diesel |
| Central Termica Banza Congo | 2014 | 20.000 | 1.960 | 1289.600 | 10.000 | 35.000 | 2.734 | 7.444 | 12.154 | 4.510 | 2.060 | 0.440 | 0.590 | 0.680 | Diesel |
| Central Termica Soyo | 2014 | 90.000 | 2.260 | 1789.200 | 70.000 | 15.000 | 2.698 | 37.148 | 15.876 | 3.760 | 0.360 | 0.990 | 0.630 | 6.650 | Combined Cycle Gas |
| Central Termica Landana | 2014 | 30.000 | 2.250 | 1378.900 | 20.000 | 30.000 | 2.708 | 9.516 | 16.324 | 2.490 | 1.060 | 0.500 | 0.770 | 3.610 | Diesel |
| Central Termica Malongo | 2014 | 45.000 | 2.300 | 1256.780 | 40.000 | 15.000 | 2.698 | 9.125 | 15.552 | 1.420 | 0.540 | 0.990 | 0.720 | 5.080 | Diesel |
| Central Termica de Xitoto Novo | 2013 | 81.000 | 1.820 | 1138.600 | 70.000 | 45.000 | 2.728 | 9.694 | 16.660 | 3.100 | 0.340 | 0.340 | 0.700 | 5.230 | Diesel |
| Central Termica de Xitoto Antigo | 2013 | 11.000 | 2.200 | 1150.040 | 8.000 | 40.000 | 2.773 | 7.901 | 13.030 | 3.230 | 2.670 | 0.400 | 0.610 | 2.070 | Diesel |
| Central Termica do Aeroporto | 2013 | 11.000 | 2.180 | 1173.270 | 8.000 | 23.000 | 2.705 | 9.256 | 15.806 | 2.730 | 2.670 | 0.650 | 0.740 | 3.800 | Diesel |
| Central Termica de Arimba | 2013 | 41.000 | 2.160 | 1161.600 | 35.000 | 15.000 | 2.698 | 9.653 | 16.608 | 2.200 | 0.650 | 0.990 | 0.730 | 5.590 | Diesel |
| Central Termica de Anexo SE | 2013 | 31.000 | 2.220 | 1159.050 | 20.000 | 30.000 | 2.747 | 9.999 | 17.250 | 0.790 | 1.150 | 0.520 | 0.750 | 6.460 | Diesel |
| Central Termica de Kileva | 2013 | 40.000 | 2.140 | 1155.310 | 30.000 | 69.000 | 2.764 | 6.737 | 10.710 | 7.360 | 0.700 | 0.230 | 0.510 | -2.420 | Diesel |
| Central Termical do Lobito | 2013 | 21.000 | 2.120 | 1134.950 | 5.000 | 31.000 | 2.721 | 7.062 | 11.403 | 4.810 | 3.620 | 0.490 | 0.630 | -2.000 | Diesel |
| Central Termica de Biopio | 2013 | 91.000 | 2.090 | 1143.820 | 15.000 | 46.000 | 2.750 | 10.033 | 17.316 | 0.630 | 1.480 | 0.340 | 0.780 | 5.870 | Diesel |
| Central Termica do Cunene | 2013 | 16.000 | 2.090 | 1140.000 | 5.000 | 20.000 | 2.721 | 8.147 | 13.572 | 1.180 | 3.770 | 0.760 | 0.720 | 2.540 | Diesel |
| Central Termica Do Kuando Kubango | 2013 | 31.000 | 2.050 | 1173.270 | 10.000 | 16.000 | 2.721 | 10.349 | 17.976 | -0.590 | 2.140 | 0.950 | 0.840 | 6.790 | Diesel |
| Central Termica do Benfica | 2013 | 41.000 | 2.030 | 1185.060 | 35.000 | 34.000 | 2.792 | 8.445 | 14.098 | 0.130 | 0.530 | 0.480 | 0.760 | 2.250 | Diesel |
| Central Termica do Cuito | 2013 | 11.000 | 2.010 | 1172.030 | 7.000 | 42.000 | 2.743 | 10.035 | 17.326 | 1.340 | 2.720 | 0.370 | 0.910 | 2.250 | Diesel |
| Central Termica do Moxico | 2013 | 41.000 | 1.990 | 1155.320 | 30.000 | 23.000 | 2.750 | 10.961 | 19.173 | 0.920 | 0.830 | 0.680 | 0.770 | 8.380 | Diesel |
| Central Termica de Cazenga | 2013 | 41.000 | 1.970 | 1151.320 | 30.000 | 50.000 | 2.773 | 41.401 | 17.928 | 1.520 | 0.830 | 0.320 | 0.720 | 7.280 | Combined Cycle Gas |
| Central Termica do Caminho de Ferro de Luanda | 2013 | 81.000 | 1.950 | 1137.350 | 50.000 | 65.000 | 2.788 | 10.194 | 17.600 | 1.610 | 0.550 | 0.250 | 0.640 | 9.470 | Diesel |
| Central Termica do Morro Bento | 2013 | 31.000 | 1.930 | 1138.230 | 15.000 | 32.000 | 2.752 | 8.828 | 14.904 | 1.210 | 1.440 | 0.490 | 0.690 | 4.630 | Diesel |
| Central Termica do Morro da Luz | 2013 | 31.000 | 1.910 | 1150.040 | 10.000 | 25.000 | 2.741 | 7.850 | 12.960 | 4.170 | 2.160 | 0.620 | 0.600 | 1.940 | Diesel |
| Central Termica KPM9 | 2013 | 15.000 | 1.910 | 1151.320 | 10.000 | 35.000 | 2.734 | 10.069 | 17.404 | 2.330 | 2.290 | 0.440 | 0.760 | 5.290 | Diesel |
| Central Termica Benfica | 2013 | 21.000 | 1.040 | 1152.600 | 17.000 | 18.000 | 2.716 | 10.790 | 18.865 | 1.270 | 1.370 | 0.840 | 0.810 | 6.890 | Diesel |
| Central Termica Praia do Bispo | 2013 | 35.000 | 1.900 | 1153.880 | 20.000 | 15.000 | 2.667 | 10.556 | 18.444 | -0.330 | 1.060 | 0.960 | 0.870 | 7.060 | Diesel |
| Central Termica dos Quarteis | 2013 | 31.000 | 1.880 | 1151.460 | 30.000 | 37.000 | 2.767 | 9.371 | 15.975 | 1.210 | 0.710 | 0.430 | 0.750 | 4.340 | Diesel |
| Central Termica Boavista I | 2013 | 31.000 | 2.060 | 1160.090 | 15.000 | 30.000 | 2.728 | 9.084 | 15.440 | 1.380 | 1.410 | 0.510 | 0.730 | 4.350 | Diesel |
| Central Termica Boavista II | 2013 | 21.000 | 2.000 | 1143.560 | 10.000 | 45.000 | 2.785 | 8.881 | 14.976 | 1.220 | 2.080 | 0.360 | 0.720 | 3.180 | Diesel |
| Central Termica Boavista III | 2013 | 21.000 | 1.960 | 1163.280 | 16.000 | 42.000 | 2.796 | 8.678 | 14.560 | 1.160 | 1.300 | 0.390 | 0.700 | 3.320 | Diesel |
| Central Termica Kassaki | 2013 | 11.000 | 1.940 | 1192.370 | 8.000 | 28.000 | 2.752 | 7.853 | 12.953 | 3.920 | 2.570 | 0.560 | 0.630 | 0.930 | Diesel |
| Central Termica CEEF | 2013 | 16.000 | 1.920 | 1290.370 | 10.000 | 20.000 | 2.681 | 9.207 | 15.732 | 1.640 | 2.070 | 0.730 | 0.760 | 4.370 | Diesel |
| Central Termica do Bengo | 2013 | 31.000 | 1.900 | 1359.850 | 18.000 | 25.000 | 2.725 | 8.752 | 14.780 | 1.620 | 1.190 | 0.610 | 0.690 | 4.400 | Diesel |
| Central Termica do Uige | 2013 | 21.000 | 1.940 | 1295.360 | 15.000 | 20.000 | 2.708 | 8.170 | 13.632 | 4.290 | 1.420 | 0.750 | 0.640 | 1.890 | Diesel |
| Central Termica Banza Congo | 2013 | 21.000 | 1.900 | 1263.810 | 10.000 | 35.000 | 2.734 | 7.444 | 12.154 | 4.510 | 2.060 | 0.440 | 0.590 | 0.680 | Diesel |
| Central Termica Soyo | 2013 | 91.000 | 2.190 | 1753.420 | 70.000 | 15.000 | 2.698 | 37.148 | 15.876 | 3.760 | 0.360 | 0.990 | 0.630 | 6.650 | Combined Cycle Gas |
| Central Termica Landana | 2013 | 31.000 | 2.180 | 1351.320 | 20.000 | 30.000 | 2.708 | 9.516 | 16.324 | 2.490 | 1.060 | 0.500 | 0.770 | 3.610 | Diesel |
| Central Termica Malongo | 2013 | 46.000 | 2.230 | 1231.640 | 40.000 | 15.000 | 2.698 | 8.981 | 15.264 | 1.420 | 0.530 | 0.990 | 0.720 | 5.080 | Diesel |
| Central Termica de Xitoto Novo | 2012 | 81.000 | 2.260 | 1115.830 | 70.000 | 45.000 | 2.728 | 9.694 | 16.660 | 3.100 | 0.340 | 0.340 | 0.700 | 5.240 | Diesel |
| Central Termica de Xitoto Antigo | 2012 | 11.000 | 1.780 | 1127.040 | 8.000 | 40.000 | 2.773 | 9.730 | 16.688 | 2.540 | 2.980 | 0.400 | 0.700 | 5.230 | Diesel |
| Central Termica do Aeroporto | 2012 | 11.000 | 2.160 | 1149.810 | 8.000 | 23.000 | 2.689 | 7.859 | 13.030 | 4.460 | 2.670 | 0.640 | 0.610 | 2.070 | Diesel |
| Central Termica de Arimba | 2012 | 41.000 | 2.140 | 1138.370 | 35.000 | 15.000 | 2.688 | 9.243 | 15.799 | 2.780 | 0.610 | 0.980 | 0.740 | 3.800 | Diesel |
| Central Termica de Anexo SE | 2012 | 31.000 | 2.120 | 1135.870 | 20.000 | 30.000 | 2.747 | 9.623 | 16.498 | 1.250 | 1.130 | 0.520 | 0.730 | 5.590 | Diesel |
| Central Termica de Kileva | 2012 | 40.000 | 2.180 | 1132.200 | 30.000 | 69.000 | 2.764 | 10.045 | 17.325 | 0.590 | 0.770 | 0.230 | 0.750 | 6.460 | Diesel |
| Central Termical do Lobito | 2012 | 21.000 | 2.090 | 1112.250 | 5.000 | 31.000 | 2.721 | 6.677 | 10.634 | 8.020 | 4.170 | 0.490 | 0.510 | -2.420 | Diesel |
| Central Termica de Biopio | 2012 | 91.000 | 2.070 | 1120.950 | 15.000 | 46.000 | 2.750 | 7.045 | 11.340 | 4.400 | 1.200 | 0.340 | 0.630 | -2.000 | Diesel |
| Central Termica do Cunene | 2012 | 16.000 | 2.050 | 1117.200 | 5.000 | 20.000 | 2.721 | 9.999 | 17.277 | 1.190 | 4.430 | 0.760 | 0.780 | 5.870 | Diesel |
| Central Termica Do Kuando Kubango | 2012 | 31.000 | 2.050 | 1149.810 | 10.000 | 16.000 | 2.721 | 8.129 | 13.536 | 1.070 | 1.880 | 0.950 | 0.720 | 2.540 | Diesel |
| Central Termica do Benfica | 2012 | 41.000 | 2.010 | 1161.360 | 35.000 | 34.000 | 2.792 | 10.363 | 17.934 | -1.600 | 0.610 | 0.480 | 0.840 | 6.790 | Diesel |
| Central Termica do Cuito | 2012 | 11.000 | 1.990 | 1148.590 | 7.000 | 42.000 | 2.743 | 8.447 | 14.151 | 0.940 | 2.660 | 0.370 | 0.760 | 2.250 | Diesel |
| Central Termica do Moxico | 2012 | 41.000 | 1.970 | 1132.220 | 30.000 | 23.000 | 2.750 | 9.974 | 17.199 | 1.180 | 0.630 | 0.680 | 0.910 | 2.250 | Diesel |
| Central Termica de Cazenga | 2012 | 41.000 | 1.950 | 1128.290 | 30.000 | 50.000 | 2.773 | 43.891 | 19.173 | 0.430 | 0.830 | 0.320 | 0.770 | 8.380 | Combined Cycle Gas |
| Central Termica do Caminho de Ferro de Luanda | 2012 | 81.000 | 1.930 | 1114.600 | 50.000 | 65.000 | 2.788 | 10.394 | 18.000 | 1.100 | 0.500 | 0.250 | 0.720 | 7.280 | Diesel |
| Central Termica do Morro Bento | 2012 | 31.000 | 1.910 | 1115.470 | 15.000 | 32.000 | 2.752 | 10.208 | 17.664 | 2.400 | 1.840 | 0.490 | 0.640 | 9.470 | Diesel |
| Central Termica do Morro da Luz | 2012 | 31.000 | 1.900 | 1127.040 | 10.000 | 25.000 | 2.741 | 8.788 | 14.835 | 1.480 | 2.150 | 0.620 | 0.690 | 4.630 | Diesel |
| Central Termica KPM9 | 2012 | 15.000 | 1.880 | 1128.290 | 10.000 | 35.000 | 2.734 | 7.817 | 12.900 | 4.360 | 2.150 | 0.440 | 0.600 | 1.940 | Diesel |
| Central Termica Benfica | 2012 | 21.000 | 1.880 | 1129.550 | 17.000 | 18.000 | 2.716 | 10.079 | 17.442 | 2.540 | 1.350 | 0.840 | 0.760 | 5.290 | Diesel |
| Central Termica Praia do Bispo | 2012 | 35.000 | 1.020 | 1130.800 | 20.000 | 15.000 | 2.667 | 10.730 | 18.792 | 1.910 | 1.160 | 0.960 | 0.810 | 6.890 | Diesel |
| Central Termica dos Quarteis | 2012 | 31.000 | 1.860 | 1128.430 | 30.000 | 37.000 | 2.767 | 10.518 | 18.270 | -1.700 | 0.700 | 0.430 | 0.870 | 7.060 | Diesel |
| Central Termica Boavista I | 2012 | 31.000 | 1.840 | 1136.890 | 15.000 | 30.000 | 2.728 | 9.351 | 15.975 | 1.590 | 1.420 | 0.510 | 0.750 | 4.340 | Diesel |
| Central Termica Boavista II | 2012 | 21.000 | 2.020 | 1120.690 | 10.000 | 45.000 | 2.785 | 9.094 | 15.403 | 0.390 | 2.110 | 0.360 | 0.730 | 4.350 | Diesel |
| Central Termica Boavista III | 2012 | 21.000 | 1.960 | 1140.020 | 16.000 | 42.000 | 2.796 | 8.886 | 14.976 | 1.290 | 1.300 | 0.390 | 0.720 | 3.180 | Diesel |
| Central Termica Kassaki | 2012 | 11.000 | 1.920 | 1168.520 | 8.000 | 28.000 | 2.752 | 8.656 | 14.560 | 1.730 | 2.600 | 0.560 | 0.700 | 3.320 | Diesel |
| Central Termica CEEF | 2012 | 16.000 | 1.900 | 1264.560 | 10.000 | 20.000 | 2.681 | 7.830 | 12.978 | 4.990 | 2.060 | 0.730 | 0.630 | 0.930 | Diesel |
| Central Termica do Bengo | 2012 | 31.000 | 1.880 | 1332.650 | 18.000 | 25.000 | 2.725 | 9.228 | 15.732 | 0.950 | 1.150 | 0.610 | 0.760 | 4.370 | Diesel |
| Central Termica do Uige | 2012 | 21.000 | 1.860 | 1269.460 | 15.000 | 20.000 | 2.708 | 8.703 | 14.697 | 1.900 | 1.420 | 0.750 | 0.690 | 4.400 | Diesel |
| Central Termica Banza Congo | 2012 | 21.000 | 1.900 | 1238.530 | 10.000 | 35.000 | 2.734 | 8.151 | 13.568 | 3.970 | 2.120 | 0.440 | 0.640 | 1.890 | Diesel |
| Central Termica Soyo | 2012 | 91.000 | 1.860 | 1718.350 | 70.000 | 15.000 | 2.698 | 29.350 | 11.977 | 5.060 | 0.290 | 0.990 | 0.590 | 0.680 | Combined Cycle Gas |
| Central Termica Landana | 2012 | 31.000 | 2.140 | 1324.300 | 20.000 | 30.000 | 2.708 | 8.032 | 13.356 | 3.480 | 1.060 | 0.500 | 0.630 | 2.620 | Diesel |
| Central Termica Malongo | 2012 | 46.000 | 2.140 | 1207.010 | 40.000 | 15.000 | 2.698 | 9.511 | 16.324 | 2.730 | 0.530 | 0.990 | 0.770 | 3.790 | Diesel |
| Central Termica de Xitoto Novo | 2011 | 85.000 | 1.700 | 1064.500 | 70.000 | 45.000 | 2.728 | 9.694 | 16.660 | 3.130 | 0.340 | 0.340 | 0.700 | 5.240 | Diesel |
| Central Termica de Xitoto Antigo | 2011 | 13.000 | 2.050 | 1075.200 | 8.000 | 40.000 | 2.773 | 9.702 | 16.632 | 2.570 | 2.970 | 0.400 | 0.700 | 5.230 | Diesel |
| Central Termica do Aeroporto | 2011 | 13.000 | 2.030 | 1096.920 | 8.000 | 23.000 | 2.689 | 7.835 | 12.981 | 4.490 | 2.660 | 0.640 | 0.610 | 2.070 | Diesel |
| Central Termica de Arimba | 2011 | 46.000 | 2.010 | 1086.000 | 35.000 | 15.000 | 2.688 | 9.243 | 15.799 | 2.810 | 0.610 | 0.980 | 0.740 | 3.800 | Diesel |
| Central Termica de Anexo SE | 2011 | 36.000 | 2.070 | 1083.620 | 20.000 | 30.000 | 2.747 | 9.623 | 16.498 | 1.280 | 1.130 | 0.520 | 0.730 | 5.590 | Diesel |
| Central Termica de Kileva | 2011 | 44.000 | 1.990 | 1080.120 | 30.000 | 69.000 | 2.764 | 9.932 | 17.100 | 0.620 | 0.760 | 0.230 | 0.750 | 6.460 | Diesel |
| Central Termical do Lobito | 2011 | 24.000 | 1.970 | 1061.090 | 5.000 | 31.000 | 2.721 | 6.677 | 10.634 | 8.050 | 4.170 | 0.490 | 0.510 | -2.420 | Diesel |
| Central Termica de Biopio | 2011 | 100.000 | 1.950 | 1069.380 | 15.000 | 46.000 | 2.750 | 7.045 | 11.340 | 4.430 | 1.200 | 0.340 | 0.630 | -2.000 | Diesel |
| Central Termica do Cunene | 2011 | 18.000 | 1.950 | 1065.810 | 5.000 | 20.000 | 2.708 | 9.993 | 17.277 | 1.220 | 4.430 | 0.750 | 0.780 | 5.870 | Diesel |
| Central Termica Do Kuando Kubango | 2011 | 34.000 | 1.910 | 1096.920 | 10.000 | 16.000 | 2.721 | 8.129 | 13.536 | 1.100 | 1.880 | 0.950 | 0.720 | 2.540 | Diesel |
| Central Termica do Benfica | 2011 | 45.000 | 1.890 | 1107.940 | 35.000 | 34.000 | 2.792 | 10.363 | 17.934 | -1.570 | 0.610 | 0.480 | 0.840 | 6.790 | Diesel |
| Central Termica do Cuito | 2011 | 12.000 | 1.870 | 1095.750 | 7.000 | 42.000 | 2.743 | 8.421 | 14.098 | 0.970 | 2.650 | 0.370 | 0.760 | 2.250 | Diesel |
| Central Termica do Moxico | 2011 | 45.000 | 1.860 | 1080.130 | 30.000 | 23.000 | 2.735 | 9.967 | 17.199 | 1.210 | 0.630 | 0.670 | 0.910 | 2.250 | Diesel |
| Central Termica de Cazenga | 2011 | 45.000 | 1.840 | 1076.390 | 30.000 | 50.000 | 2.773 | 43.891 | 19.173 | 0.460 | 0.830 | 0.320 | 0.770 | 8.380 | Combined Cycle Gas |
| Central Termica do Caminho de Ferro de Luanda | 2011 | 89.000 | 1.820 | 1063.330 | 50.000 | 65.000 | 2.788 | 10.394 | 18.000 | 1.130 | 0.500 | 0.250 | 0.720 | 7.280 | Diesel |
| Central Termica do Morro Bento | 2011 | 34.000 | 1.800 | 1064.150 | 15.000 | 32.000 | 2.752 | 10.208 | 17.664 | 2.430 | 1.840 | 0.490 | 0.640 | 9.470 | Diesel |
| Central Termica do Morro da Luz | 2011 | 35.000 | 1.780 | 1075.190 | 10.000 | 25.000 | 2.741 | 8.788 | 14.835 | 1.510 | 2.150 | 0.620 | 0.690 | 4.630 | Diesel |
| Central Termica KPM9 | 2011 | 16.000 | 1.780 | 1076.390 | 10.000 | 35.000 | 2.711 | 7.806 | 12.900 | 4.390 | 2.150 | 0.430 | 0.600 | 1.940 | Diesel |
| Central Termica Benfica | 2011 | 23.000 | 0.970 | 1077.590 | 17.000 | 18.000 | 2.704 | 10.008 | 17.313 | 2.570 | 1.340 | 0.830 | 0.760 | 5.290 | Diesel |
| Central Termica Praia do Bispo | 2011 | 38.000 | 1.760 | 1078.790 | 20.000 | 15.000 | 2.667 | 10.730 | 18.792 | 1.940 | 1.160 | 0.960 | 0.810 | 6.890 | Diesel |
| Central Termica dos Quarteis | 2011 | 34.000 | 1.750 | 1076.520 | 30.000 | 37.000 | 2.743 | 10.507 | 18.270 | -1.660 | 0.700 | 0.420 | 0.870 | 7.060 | Diesel |
| Central Termica Boavista I | 2011 | 35.000 | 1.920 | 1084.590 | 15.000 | 30.000 | 2.728 | 9.351 | 15.975 | 1.620 | 1.420 | 0.510 | 0.750 | 4.340 | Diesel |
| Central Termica Boavista II | 2011 | 23.000 | 1.860 | 1069.140 | 10.000 | 45.000 | 2.785 | 9.094 | 15.403 | 0.420 | 2.110 | 0.360 | 0.730 | 4.350 | Diesel |
| Central Termica Boavista III | 2011 | 24.000 | 1.820 | 1087.580 | 16.000 | 42.000 | 2.796 | 8.886 | 14.976 | 1.320 | 1.300 | 0.390 | 0.720 | 3.180 | Diesel |
| Central Termica Kassaki | 2011 | 12.000 | 1.800 | 1114.770 | 8.000 | 28.000 | 2.752 | 8.628 | 14.504 | 1.770 | 2.590 | 0.560 | 0.700 | 3.320 | Diesel |
| Central Termica CEEF | 2011 | 17.000 | 1.790 | 1206.390 | 10.000 | 20.000 | 2.681 | 7.798 | 12.915 | 5.020 | 2.050 | 0.730 | 0.630 | 0.930 | Diesel |
| Central Termica do Bengo | 2011 | 34.000 | 1.770 | 1271.350 | 18.000 | 25.000 | 2.725 | 9.228 | 15.732 | 0.980 | 1.150 | 0.610 | 0.760 | 4.370 | Diesel |
| Central Termica do Uige | 2011 | 23.000 | 1.800 | 1211.060 | 15.000 | 20.000 | 2.708 | 8.703 | 14.697 | 1.930 | 1.420 | 0.750 | 0.690 | 4.400 | Diesel |
| Central Termica Banza Congo | 2011 | 24.000 | 1.770 | 1181.560 | 10.000 | 35.000 | 2.734 | 8.151 | 13.568 | 4.000 | 2.120 | 0.440 | 0.640 | 1.890 | Diesel |
| Central Termica Soyo | 2011 | 100.000 | 2.040 | 1639.300 | 70.000 | 15.000 | 2.688 | 29.330 | 11.977 | 5.090 | 0.290 | 0.980 | 0.590 | 0.680 | Combined Cycle Gas |
| Central Termica Landana | 2011 | 34.000 | 2.040 | 1263.380 | 20.000 | 30.000 | 2.708 | 8.032 | 13.356 | 3.510 | 1.060 | 0.500 | 0.630 | 2.620 | Diesel |
| Central Termica Malongo | 2011 | 85.000 | 1.610 | 1151.490 | 40.000 | 15.000 | 2.698 | 9.511 | 16.324 | 2.760 | 0.530 | 0.990 | 0.770 | 3.790 | Diesel |
| Central Termica de Xitoto Novo | 2010 | 13.000 | 1.640 | 1021.920 | 70.000 | 45.000 | 2.728 | 9.694 | 16.660 | 3.120 | 0.340 | 0.340 | 0.700 | 5.240 | Diesel |
| Central Termica de Xitoto Antigo | 2010 | 13.000 | 1.990 | 1032.190 | 8.000 | 40.000 | 2.773 | 9.702 | 16.632 | 2.560 | 2.970 | 0.400 | 0.700 | 5.230 | Diesel |
| Central Termica do Aeroporto | 2010 | 46.000 | 1.970 | 1053.040 | 8.000 | 23.000 | 2.689 | 7.729 | 12.768 | 4.480 | 2.660 | 0.640 | 0.600 | 2.070 | Diesel |
| Central Termica de Arimba | 2010 | 36.000 | 1.950 | 1042.560 | 35.000 | 15.000 | 2.688 | 9.243 | 15.799 | 2.800 | 0.610 | 0.980 | 0.740 | 3.800 | Diesel |
| Central Termica de Anexo SE | 2010 | 39.600 | 2.010 | 1040.270 | 20.000 | 30.000 | 2.747 | 9.623 | 16.498 | 1.270 | 1.130 | 0.520 | 0.730 | 5.590 | Diesel |
| Central Termica de Kileva | 2010 | 24.000 | 1.930 | 1036.920 | 30.000 | 69.000 | 2.764 | 9.818 | 16.872 | 0.610 | 0.760 | 0.230 | 0.740 | 6.460 | Diesel |
| Central Termical do Lobito | 2010 | 100.000 | 1.910 | 1018.640 | 5.000 | 31.000 | 2.721 | 6.664 | 10.608 | 8.040 | 4.160 | 0.490 | 0.510 | -2.420 | Diesel |
| Central Termica de Biopio | 2010 | 18.000 | 1.890 | 1026.610 | 15.000 | 46.000 | 2.750 | 7.045 | 11.340 | 4.420 | 1.200 | 0.340 | 0.630 | -2.000 | Diesel |
| Central Termica do Cunene | 2010 | 34.000 | 1.890 | 1023.180 | 5.000 | 20.000 | 2.708 | 9.973 | 17.238 | 1.210 | 4.420 | 0.750 | 0.780 | 5.870 | Diesel |
| Central Termica Do Kuando Kubango | 2010 | 45.000 | 1.850 | 1053.040 | 10.000 | 16.000 | 2.721 | 8.129 | 13.536 | 1.090 | 1.880 | 0.950 | 0.720 | 2.540 | Diesel |
| Central Termica do Benfica | 2010 | 12.000 | 1.840 | 1063.620 | 35.000 | 34.000 | 2.771 | 10.353 | 17.934 | -1.580 | 0.610 | 0.470 | 0.840 | 6.790 | Diesel |
| Central Termica do Cuito | 2010 | 45.000 | 1.820 | 1051.920 | 7.000 | 42.000 | 2.743 | 8.421 | 14.098 | 0.960 | 2.650 | 0.370 | 0.760 | 2.250 | Diesel |
| Central Termica do Moxico | 2010 | 45.000 | 1.800 | 1036.930 | 30.000 | 23.000 | 2.735 | 9.967 | 17.199 | 1.200 | 0.630 | 0.670 | 0.910 | 2.250 | Diesel |
| Central Termica de Cazenga | 2010 | 89.000 | 1.780 | 1033.330 | 30.000 | 50.000 | 2.773 | 43.891 | 19.173 | 0.450 | 0.830 | 0.320 | 0.770 | 8.380 | Combined Cycle Gas |
| Central Termica do Caminho de Ferro de Luanda | 2010 | 34.000 | 1.760 | 1020.790 | 50.000 | 65.000 | 2.788 | 10.394 | 18.000 | 1.120 | 0.500 | 0.250 | 0.720 | 7.280 | Diesel |
| Central Termica do Morro Bento | 2010 | 35.000 | 1.750 | 1021.590 | 15.000 | 32.000 | 2.752 | 10.208 | 17.664 | 2.420 | 1.840 | 0.490 | 0.640 | 9.470 | Diesel |
| Central Termica do Morro da Luz | 2010 | 16.000 | 1.730 | 1032.190 | 10.000 | 25.000 | 2.725 | 8.780 | 14.835 | 1.500 | 2.150 | 0.610 | 0.690 | 4.630 | Diesel |
| Central Termica KPM9 | 2010 | 23.000 | 1.730 | 1033.340 | 10.000 | 35.000 | 2.711 | 7.698 | 12.685 | 4.380 | 2.150 | 0.430 | 0.590 | 1.940 | Diesel |
| Central Termica Benfica | 2010 | 38.000 | 0.940 | 1034.480 | 17.000 | 18.000 | 2.704 | 10.008 | 17.313 | 2.560 | 1.340 | 0.830 | 0.760 | 5.290 | Diesel |
| Central Termica Praia do Bispo | 2010 | 34.000 | 1.710 | 1035.630 | 20.000 | 15.000 | 2.657 | 10.724 | 18.792 | 1.930 | 1.160 | 0.950 | 0.810 | 6.890 | Diesel |
| Central Termica dos Quarteis | 2010 | 35.000 | 1.690 | 1033.460 | 30.000 | 37.000 | 2.743 | 10.507 | 18.270 | -1.670 | 0.700 | 0.420 | 0.870 | 7.060 | Diesel |
| Central Termica Boavista I | 2010 | 23.000 | 1.860 | 1041.210 | 15.000 | 30.000 | 2.728 | 9.351 | 15.975 | 1.610 | 1.420 | 0.510 | 0.750 | 4.340 | Diesel |
| Central Termica Boavista II | 2010 | 24.000 | 1.800 | 1026.370 | 10.000 | 45.000 | 2.785 | 9.094 | 15.403 | 0.410 | 2.110 | 0.360 | 0.730 | 4.350 | Diesel |
| Central Termica Boavista III | 2010 | 12.000 | 1.770 | 1044.070 | 16.000 | 42.000 | 2.796 | 8.828 | 14.861 | 1.310 | 1.290 | 0.390 | 0.720 | 3.180 | Diesel |
| Central Termica Kassaki | 2010 | 17.000 | 1.750 | 1070.180 | 8.000 | 28.000 | 2.752 | 8.628 | 14.504 | 1.760 | 2.590 | 0.560 | 0.700 | 3.320 | Diesel |
| Central Termica CEEF | 2010 | 34.000 | 1.730 | 1158.130 | 10.000 | 20.000 | 2.681 | 7.798 | 12.915 | 5.010 | 2.050 | 0.730 | 0.630 | 0.930 | Diesel |
| Central Termica do Bengo | 2010 | 23.000 | 1.710 | 1220.500 | 18.000 | 25.000 | 2.725 | 9.160 | 15.595 | 0.970 | 1.140 | 0.610 | 0.760 | 4.370 | Diesel |
| Central Termica do Uige | 2010 | 24.000 | 1.750 | 1162.620 | 15.000 | 20.000 | 2.708 | 8.703 | 14.697 | 1.920 | 1.420 | 0.750 | 0.690 | 4.400 | Diesel |
| Central Termica Banza Congo | 2010 | 100.000 | 1.710 | 1134.300 | 10.000 | 35.000 | 2.734 | 8.045 | 13.356 | 3.990 | 2.120 | 0.440 | 0.630 | 1.890 | Diesel |
| Central Termica Soyo | 2010 | 34.000 | 1.980 | 1573.730 | 70.000 | 15.000 | 2.688 | 29.330 | 11.977 | 5.080 | 0.290 | 0.980 | 0.590 | 0.680 | Combined Cycle Gas |
| Central Termica Landana | 2010 | 28.000 | 1.980 | 1212.840 | 20.000 | 30.000 | 2.708 | 8.032 | 13.356 | 3.500 | 1.060 | 0.500 | 0.630 | 2.620 | Diesel |
| Central Termica Malongo | 2010 | 45.000 | 1.560 | 1105.430 | 40.000 | 15.000 | 2.698 | 9.511 | 16.324 | 2.750 | 0.530 | 0.990 | 0.770 | 3.790 | Diesel |
Appendix B. Complete Ranking of DMUs
| DMU | Phase I | Phase II | Rank | DMU Location | DMU Name | DMU Capacity (MW) | |||||||
| 1 | 1.0825 | 0.85 | 0.9169 | 0.991 | 0.9904 | 1.1773 | 1.2453 | 1.4068 | - | 15 | Namibe | Xitoto Novo | 70 |
| 2 | 1.226 | 1.0524 | 1.0915 | 1.1361 | 1.1345 | 1.3469 | 1.4104 | 1.4101 | - | 23 | Namibe | Xitoto Antigo | 8 |
| 3 | 1.1193 | 1.212 | 1.1884 | 1.155 | 1.1546 | 1.0444 | 1.043 | 1.0376 | - | 16 | Namibe | Aeroporto | 8 |
| 4 | 0.9546 | 0.951 | 0.9517 | 0.9519 | 0.9569 | 0.9418 | 0.9601 | 0.9691 | - | 8 | Lubango | Arimba | 35 |
| 5 | 1.2801 | 1.2981 | 1.2805 | 1.2627 | 1.2614 | 1.2819 | 1.2762 | 1.3001 | - | 29 | Lubango | Anexo SE | 20 |
| 6 | 1.1208 | 0.8338 | 0.8427 | 0.8585 | 0.8632 | 1.4997 | 1.4707 | 1.4769 | - | 17 | Benguela | Kileva | 30 |
| 7 | 0.7757 | 0.9064 | 0.8848 | 0.8521 | 0.8524 | 0.7232 | 0.7245 | 0.4868 | - | 4 | Benguela | Lobito | 5 |
| 8 | 0.5208 | 0.448 | 0.4514 | 0.4534 | 0.4622 | 0.3726 | 0.4035 | 1.0545 | - | 1 | Benguela | Biópio | 15 |
| 9 | 0.7547 | 0.7534 | 0.7539 | 0.7544 | 0.7547 | 0.755 | 0.7555 | 0.756 | - | 3 | Cunene | Cunene | 5 |
| 10 | 0.8143 | 0.8274 | 0.8181 | 0.806 | 0.8002 | 0.8108 | 0.8104 | 0.8275 | - | 5 | Cuando-Cubango | Kuando Kubango | 10 |
| 11 | 1.1904 | 1.0509 | 1.0534 | 1.057 | 1.0557 | 1.3517 | 1.3566 | 1.4074 | - | 19 | Huambo | Benfica | 35 |
| 12 | 1.3248 | 1.3825 | 1.3823 | 1.3827 | 1.3812 | 1.2493 | 1.2456 | 1.2496 | - | 31 | Bié | Cuito | 7 |
| 13 | 1.2069 | 1.2522 | 1.2149 | 1.1736 | 1.1742 | 1.1858 | 1.2014 | 1.2459 | - | 21 | Moxico | Moxico | 30 |
| 14 | 2.3954 | 2.5889 | 2.5306 | 2.4504 | 2.453 | 2.4537 | 2.4937 | 1.7977 | - | 32 | Luanda | Cazenga | 30 |
| 15 | 1.2533 | 1.0851 | 1.0762 | 1.0779 | 1.0769 | 1.4617 | 1.4639 | 1.5313 | - | 26 | Luanda | Caminho de Ferro de Luanda | 50 |
| 16 | 1.23 | 1.1608 | 1.1517 | 1.1362 | 1.1366 | 1.3331 | 1.337 | 1.3543 | - | 24 | Luanda | Morro Bento | 15 |
| 17 | 1.0105 | 0.8956 | 0.9149 | 0.9376 | 0.9395 | 1.1263 | 1.121 | 1.1387 | - | 9 | Luanda | Morro da Luz | 10 |
| 18 | 1.2566 | 1.4324 | 1.3648 | 1.3078 | 1.3084 | 1.129 | 1.1311 | 1.1228 | - | 27 | Luanda | KM9 | 10 |
| 19 | 1.0157 | 0.9742 | 0.9769 | 0.9786 | 0.9822 | 1.1277 | 1.0333 | 1.0371 | - | 10 | Luanda | Benfica | 17 |
| 20 | 0.9266 | 0.9355 | 0.9364 | 0.9374 | 0.9399 | 0.8488 | 0.9435 | 0.9448 | - | 7 | Luanda | Praia do Bispo | 20 |
| 21 | 1.2979 | 1.2124 | 1.2143 | 1.2135 | 1.2143 | 1.4004 | 1.4049 | 1.4252 | - | 30 | Luanda | Quarteis | 30 |
| 22 | 1.2056 | 1.1773 | 1.18 | 1.176 | 1.1753 | 1.2183 | 1.2474 | 1.2648 | - | 20 | Luanda | Boavista I | 15 |
| 23 | 1.2693 | 1.1584 | 1.1972 | 1.2448 | 1.245 | 1.35 | 1.3436 | 1.3463 | - | 28 | Luanda | Boavista II | 10 |
| 24 | 1.236 | 1.1493 | 1.1675 | 1.2084 | 1.2086 | 1.3093 | 1.3064 | 1.3022 | - | 25 | Luanda | Boavista III | 16 |
| 25 | 1.0691 | 1.0057 | 1.0181 | 1.0335 | 1.0315 | 1.1312 | 1.1309 | 1.133 | - | 14 | Luanda | Kassaki | 8 |
| 26 | 1.0321 | 1.0818 | 1.0726 | 1.0513 | 1.0508 | 0.9891 | 0.9892 | 0.9897 | - | 12 | Luanda | CEEF | 10 |
| 27 | 1.1248 | 1.0936 | 1.0876 | 1.0811 | 1.0822 | 1.1697 | 1.1743 | 1.1852 | - | 18 | Bengo | Bengo | 18 |
| 28 | 1.0236 | 0.973 | 0.975 | 0.9772 | 0.9791 | 1.0796 | 1.09 | 1.0914 | - | 11 | Uige | Uige | 15 |
| 29 | 1.0657 | 0.9578 | 0.9868 | 1.0278 | 1.028 | 1.1666 | 1.1657 | 1.1274 | - | 13 | Zaire | Banza Congo | 10 |
| 30 | 0.6098 | 0.4069 | 0.4487 | 0.5 | 0.5055 | 0.5055 | 0.85 | 1.0524 | - | 2 | Zaire | Soyo | 70 |
| 31 | 1.2169 | 1.3405 | 1.296 | 1.245 | 1.2438 | 1.1195 | 1.1252 | 1.1483 | - | 22 | Cabinda | Landana | 20 |
| 32 | 0.8512 | 0.9106 | 0.8922 | 0.8718 | 0.866 | 0.9213 | 0.5817 | 0.9149 | - | 6 | Cabinda | Malongo | 40 |
References
- Eser, P.; Singh, A.; Chokani, N.; Abhari, R. Effect of increased renewables generation on operation of thermal power plants. Appl. Energy 2016, 164, 723–732. [Google Scholar] [CrossRef]
- Faraway, J.J. Extending the Linear Model with R: Generalized Linear, Mixed Effects and Nonparametric Regression Models; Chapman & Hall/CRC: Boca Raton, FL, USA, 2006. [Google Scholar]
- Chien, C.F.; Chen, W.C.; Lo, F.Y.; Lin, Y.C. A case study to evaluate the productivity change of the thermal power plants of the Taiwan power company. IEEE Trans. Energy Conserv. 2007, 22, 680–688. [Google Scholar] [CrossRef]
- Yao, X.; Guo, C.; Shao, S.; Jiang, Z. Total-factor CO2 emission performance of China’s provincial industrial sector: A meta-frontier non-radial Malmquist index approach. Appl. Energy 2016, 184, 1142–1153. [Google Scholar] [CrossRef]
- Wang, Y.-S.; Xie, B.-C.; Shang, L.-F.; Li, W.-H. Measures to improve the performance of China’s thermal power industry in view of cost efficiency. Appl. Energy 2013, 112, 1078–1086. [Google Scholar] [CrossRef]
- Lin, B.; Yang, L. Efficiency effect of changing investment structure on China’s power industry. Renew. Sustain. Energy Rev. 2014, 39, 403–411. [Google Scholar] [CrossRef]
- Barros, C.P.; Wanke, P. Efficiency in Angolan thermal power plants: Evidence from cost structure and pollutant emissions. Energy 2017, 130, 129–143. [Google Scholar] [CrossRef]
- Wanke, P.; Barros, C.P. Efficiency thresholds and cost structure in Senegal airports. J. Air Transp. Manag. 2017, 58, 100–112. [Google Scholar] [CrossRef]
- Park, S.U.; Lesourd, J.B. The efficiency of conventional fuel power plants in South Korea: A comparison of parametric and non-parametric approaches. Int. J. Prod. Econ. 2000, 63, 59–67. [Google Scholar] [CrossRef]
- Lam, P.L.; Shiu, A. A data envelopment analysis of the efficiency of China’s thermal power generation. Util. Policy 2001, 10, 75–83. [Google Scholar] [CrossRef]
- Sarica, K.; Or, I. Efficiency assessment of Turkish power plants using data envelopment analysis. Energy 2007, 32, 1484–1499. [Google Scholar] [CrossRef]
- Barros, C.P.; Peypoch, N. Technical efficiency of thermoelectric power plants. Energy Econ. 2008, 30, 3118–3127. [Google Scholar] [CrossRef]
- Nakano, M.; Managi, S. Regulatory reforms and productivity: An empirical analysis of the Japanese electricity industry. Energy Policy 2008, 36, 201–209. [Google Scholar] [CrossRef]
- Sozen, A.; Alp, I.; Özdemir, A. Assessment of operational and environmental performance of the thermal power plants in Turkey by using data envelopment analysis. Energy Policy 2010, 38, 6194–6203. [Google Scholar] [CrossRef]
- Liu, C.H.; Lin, S.J.; Lewis, C. Evaluation of thermal power plant operational performance in Taiwan by data envelopment analysis. Energy Policy 2010, 38, 1049–1058. [Google Scholar] [CrossRef]
- Rezaee, M.J.; Moini, A.; Makui, A. Operational and non-operational performance evaluation of thermal power plants in Iran: A game theory approach. Energy 2012, 38, 96–103. [Google Scholar] [CrossRef]
- Rezaee, M.J. Using Shapley value in multi-objective data envelopment analysis: Power plants evaluation with multiple frontiers. Int. J. Electr. Power Energy Syst. 2015, 69, 141–149. [Google Scholar] [CrossRef]
- Shrivastava, N.; Sharma, S.; Chauhan, K. Efficiency assessment and benchmarking of thermal power plants in India. Energy Policy 2012, 40, 159–176. [Google Scholar] [CrossRef]
- Sueyoshi, T.; Goto, M. DEA environmental assessment of coal fired power plants: Methodological comparison between radial and non-radial models. Energy Econ. 2012, 34, 1854–1863. [Google Scholar] [CrossRef]
- Du, L.; Mao, J. Estimating the environmental efficiency and marginal CO2 abatement cost of coal-fired power plants in China. Energy Policy 2015, 85, 347–356. [Google Scholar] [CrossRef]
- Ghosh, R.; Kathuria, V. The effect of regulatory governance on efficiency of thermal power generation in India: A stochastic frontier analysis. Energy Policy 2016, 89, 11–24. [Google Scholar] [CrossRef]
- Yan, D.; Lei, Y.; Li, L.; Song, W. Carbon emission efficiency and spatial clustering analyses in China’s thermal power industry: Evidence from the provincial level. J. Clean. Prod. 2017, 156, 518–527. [Google Scholar] [CrossRef]
- Wu, Y.; Ke, Y.; Xu, C.; Xiao, X.; Hu, Y. Eco-efficiency measurement of coal-fired power plants in China using super efficiency data envelopment analysis. Sustain. Cities Soc. 2018, 36, 157–168. [Google Scholar] [CrossRef]
- See, K.F.; Coelli, T. An analysis of factors that influence the technical efficiency of Malaysian thermal power plants. Energy Econ. 2012, 34, 677–685. [Google Scholar] [CrossRef]
- Munisamy, S.; Arabi, B. Eco-efficiency change in power plants: Using a slacks-based measure for the meta-frontier Malmquist–Luenberger productivity index. J. Clean Prod. 2015, 105, 218–232. [Google Scholar] [CrossRef]
- Mahmoudi, R.; Emrouznejad, A.; Khosroshahi, H.; Khashei, M.; Rajabi, P. Performance evaluation of thermal power plants considering CO2 emission: A multistage PCA, clustering, game theory and data envelopment analysis. J. Clean. Prod. 2019, 223, 641–650. [Google Scholar] [CrossRef]
- Wei, X.; Zhang, N. The shadow prices of CO2 and SO2 for Chinese Coal-fired Power Plants: A partial frontier approach. Energy Econ. 2020, 85, 104576. [Google Scholar] [CrossRef]
- Emrouznejad, A.; Yang, G. A survey and analysis of the first 40 years of scholarly literature in DEA: 1978–2016. Socio-Econ. Plan. Sci. 2018, 61, 4–8. [Google Scholar] [CrossRef]
- Fernández, D.; Pozo, C.; Folgado, R.; Jiménez, L.; Guillén-Gosálbez, G. Productivity and energy efficiency assessment of existing industrial gases facilities via data envelopment analysis and the Malmquist index. Appl. Energy 2018, 212, 1563–1577. [Google Scholar] [CrossRef]
- Charnes, A.; Clark, C.T.; Cooper, W.W.; Golany, B. A developmental study of data envelopment analysis in measuring the efficiency of maintenance units in the U.S. air forces. Ann. Oper. Res. 1985, 2, 95–112. [Google Scholar] [CrossRef]
- Färe, R.; Grosskopf, S. Intertemporal Production Functions with Dynamic DEA; Kluwer Academic Publishers: Boston, MA, USA, 1996. [Google Scholar]
- Nemoto, J.; Goto, M. Dynamic data envelopment analysis: modeling intertemporal behavior of a firm in the presence of productive inefficiencies. Econ. Lett. 1999, 64, 51–56. [Google Scholar] [CrossRef]
- Thompson, R.G.; Dharmapala, P.S.; Thrall, R.M. Linked-cone DEA profit ratios and technical efficiency with application to Illinois coal mines. Int. J. Prod. Econ. 1995, 39, 99–115. [Google Scholar] [CrossRef]
- Jahanshahloo, G.R.; Soleimani-damaneh, M.; Reshadi, M. On the Pareto (dynamically) efficient paths. Int. J. Comput. Math. 2006, 83, 629–633. [Google Scholar] [CrossRef]
- Silva, E.; Stefanou, S.E. Nonparametric dynamic efficiency measurement: Theory and application. Am. J. Agric. Econ. 2007, 89, 398–419. [Google Scholar] [CrossRef]
- Soleimani-damaneh, M. An effective computational attempt in DDEA. Appl. Math. Model. 2009, 33, 3943–3948. [Google Scholar] [CrossRef]
- Sam Park, K.; Park, K. Measurement of multi-period aggregative efficiency. Eur. J Oper. Res. 2009, 193, 567–580. [Google Scholar] [CrossRef]
- Charnes, A.; Cooper, W.; Rhodes, E. Measuring the efficiency of decision making units. Eur. J. Oper. Res. 1978, 2, 429–444. [Google Scholar] [CrossRef]
- Andersen, P.; Petersen, N.C. A procedure for ranking efficient units in data envelopment analysis. Manag. Sci. 1993, 39, 1261–1264. [Google Scholar] [CrossRef]
- Mariano, E.B.; Gobbo, J.A., Jr.; Camioto, F.C.; Rebelatto, D.A.N. CO2 emissions and logistics performance: A composite index proposal. J. Clean Prod. 2016, 163, 166–178. [Google Scholar] [CrossRef]
- Ozkan, N.F.; Ulutas, B.H. Efficiency analysis of cement manufacturing facilities in Turkey considering undesirable outputs. J. Clean Prod. 2017, 156, 932–938. [Google Scholar] [CrossRef]
- Scheel, H. Undesirable outputs in efficiency valuations. Eur. J. Oper. Res. 2001, 132, 400–410. [Google Scholar] [CrossRef]
- Seiford, L.M.; Zhu, J. Modeling undesirable factors in efficiency evaluation. Eur. J. Oper. Res. 2002, 142, 16–20. [Google Scholar] [CrossRef]
- Hadi-Vencheh, A.; Kazemi Matin, R.; Tavassoli Kajani, M. Undesirable factors in efficiency measurement. Appl. Math. Comput. 2005, 63, 547–552. [Google Scholar] [CrossRef]
- EIA. How Much Does It Cost to Generate Electricity with Different Types of Power Plants? 2017. Available online: https://www.eia.gov/tools/faqs/faq.php?id=19&t=3 (accessed on 1 March 2018).
- EIA. How Much Does It Cost to Build Different Types of Power Plants? 2018. Available online: https://www.eia.gov/tools/faqs/faq.php?id=487&t=3 (accessed on 7 July 2018).
- Morgan, J.; Sonquist, J. Problems in the analysis of survey data and a proposal. J. Am. Stat. Assoc. 1963, 58, 415–434. [Google Scholar] [CrossRef]
- Breiman, L.; Friedman, J.; Olshen, R.; Stone, C. Classification and Regression Trees; Wadsworth: Belmont, CA, USA, 1984. [Google Scholar]
- James, G.; Witten, D.; Hastie, T.; Tibshirani, R. An Introduction to Statistical Learning with Applications in R; Springer: New York, NY, USA, 2013. [Google Scholar]
- Opitz, D.; Maclin, R. Popular ensemble methods: An empirical study. J. Artif. Intell. Res. 1999, 11, 169–198. [Google Scholar] [CrossRef]
- Polikar, R. Ensemble based systems in decision making. IEEE Circuits Syst. Mag. 2006, 6, 21–45. [Google Scholar] [CrossRef]
- Torgo, L. Data Mining with R: Learning with Case Studies; CRC Press: Boca Raton, FL, USA, 2011. [Google Scholar]
- Breiman, L. Bagging predictors. Mach. Learn. 1996, 24, 123–140. [Google Scholar] [CrossRef]
- Ledolter, J. Data Mining and Business Analytics with R; Wiley: Hoboken, NJ, USA, 2013. [Google Scholar]


| Author (Year) | Country | Sample Size | Methods |
|---|---|---|---|
| Park and Lesourd [9] | South Korea | 64 fuel power plants | DEA and Stochastic-Frontier |
| Lam and Shiu [10] | China | Thermal Power Generation in 30 provinces, autonomous regions, and municipalities | DEA and Tobit Regression |
| Chien et al. [3] | Taiwan | 8 thermal power plants | DEA–Malmquist |
| Sarica and Or [3] | Turkey | 65 thermal, hydro, and wind power plants | Constant returns to scale (CRS) DEA, variable returns to scale (VRS) DEA, and Assurance region DEA |
| Barros and Peypoch [11] | Portugal | 7 thermoelectric plants data from 1996 to 2004 | DEA and Simar and Wilson bootstrapped procedure |
| Nakano and Managi [13] | Japan | 10 local monopoly companies data from 1965 to 2003 | DEA, Luenberger productivity indicator and Generalized Method of Moments (GMM) estimation |
| Sozen et al. [14] | Turkey | 15 thermal power plants | CRS DEA and VRS DEA |
| Liu et al. [15] | Taiwan | 9 thermal power plants | DEA |
| Rezaee et al. [16] | Iran | 24 power plants | DEA and game theory |
| See and Coelli [24] | Malaysia | 14 thermal plants | Stochastic Frontier Analysis (SFA) |
| Shrivastava et al. [18] | India | 60 coal-fired power plants | CRS (Constant Returns-to-Scale) DEA and VRS (Variable Returns-to-Scale) DEA |
| Sueyoshi and Goto [19] | United States | 20 U.S. coal-fired power plants | Non-radial DEA model |
| Wang et al. [5] | China | 30 thermal power | DEA, Malmquist–Luenberger productivity index |
| Lin and Yang [6] | China | Power industry for 31 provinces from 2005 to 2010 | Slacks-Based Measure (SBM) in dynamic DEA model |
| Rezaee [17] | Iran | 20 power plants | Shapley value and multiobjective DEA |
| Du and Mao [20] | China | 1158 power plants data | Parametric Linear Programing |
| Munisamy and Arabi [25] | Iran | 48 thermal power plants | SBM, Malmquist–Luenberger index |
| Ghosh and Kathuria [21] | India | 77 coal-based thermal power plants | SFA |
| Barros and Wanke [7] | Angola | 32 Angolan thermal power plants from 2010 to 2014 | SBM-Undesirable and Beta regression |
| Yan et al. [22] | China | Power industry in 30 provinces | SBM-Undesirable, Malmquist index |
| Wu et al. [23] | China | 58 coal-fired power plants | Super Efficiency DEA, Kruskal–Wallis rank, Tobit regression |
| Xie et al. [2] | China | Thermal power plants in 30 provinces | Nonparametric weighted Russell directional distance method |
| Mahmoudi et al. [26] | Iran | 52 thermal power plants | Multivariate data analysis techniques, game theory, and Shannon entropy combined with DEA |
| Wei and Zhang [27] | China | 93 coal-fired power plants | Partial parametric environmental production frontier |
| Variables | Min | Max | Mean | SD | |
|---|---|---|---|---|---|
| Inputs | Plant capacity in MW | 5 | 70 | 21.533 | 16.663 |
| Investment costs * (log) | 10.608 | 21.945 | 15.6845 | 2.3792 | |
| Employee costs per year * (log) | 2.657 | 2.801 | 2.73681 | 0.0332 | |
| Fuel costs per year * (log) | 6.664 | 43.891 | 11.0235 | 7.3653 | |
| Number of employees | 15 | 69 | 31.613 | 13.671 | |
| Outputs | Production in 1000 MWh | 10 | 117 | 35.292 | 24.206 |
| Carbon dioxide emissions in tons per year | 0.940 | 2.720 | 1.989 | 0.251 | |
| Discharge of polluted water in liters per year | 1,018.64 | 1,898.21 | 1,190.07 | 136.460 | |
| Trend | Trend | 1 | 7 | 3.987 | 2.005 |
| Trend squared | 1 | 49 | 19.916 | 16.407 | |
| Cost Structure | Capital–labor ratio | −1.700 | 11.408 | 2.257 | 1.923 |
| Capacity cost per MW | 0.290 | 4.430 | 1.571 | 0.959 | |
| Labor cost per employee | 0.230 | 0.996 | 0.576 | 0.226 | |
| Capital cost | 0.510 | 1 | 0.721 | 0.089 | |
| Cost–asset ratio | −2.420 | 12.058 | 4.237 | 2.869 | |
| Method | R Library | R Function | Values |
|---|---|---|---|
| RF-CART | randomForest | randomForest | x, where x represents a data frame or matrix of predictors, y = NULL, xtest = NULL, ytest = NULL, ntree = 500, mtry = max(floor(ncol(x)/3), 1), replace = TRUE, classwt = NULL, sampsize = nrow(x), nodesize = 5, maxnodes = NULL, importance = FALSE, localImp = FALSE, nPerm = 1, norm.votes = TRUE, do.trace = FALSE, keep.forest = TRUE, corr.bias = FALSE, keep.inbag = FALSE |
| CART | tree | Tree | na.action = na.pass, method = "recursive.partition", split = c("deviance", "gini"), model = FALSE, x = FALSE, y = TRUE, wts = TRUE, mincut = 5, minsize = 10, mindev = 0.01 |
© 2020 by the authors. Licensee MDPI, Basel, Switzerland. This article is an open access article distributed under the terms and conditions of the Creative Commons Attribution (CC BY) license (http://creativecommons.org/licenses/by/4.0/).
Share and Cite
Hadi-Vencheh, A.; Wanke, P.; Jamshidi, A. What Does Cost Structure Have to Say about Thermal Plant Energy Efficiency? The Case from Angola. Energies 2020, 13, 2404. https://doi.org/10.3390/en13092404
Hadi-Vencheh A, Wanke P, Jamshidi A. What Does Cost Structure Have to Say about Thermal Plant Energy Efficiency? The Case from Angola. Energies. 2020; 13(9):2404. https://doi.org/10.3390/en13092404
Chicago/Turabian StyleHadi-Vencheh, Abdollah, Peter Wanke, and Ali Jamshidi. 2020. "What Does Cost Structure Have to Say about Thermal Plant Energy Efficiency? The Case from Angola" Energies 13, no. 9: 2404. https://doi.org/10.3390/en13092404
APA StyleHadi-Vencheh, A., Wanke, P., & Jamshidi, A. (2020). What Does Cost Structure Have to Say about Thermal Plant Energy Efficiency? The Case from Angola. Energies, 13(9), 2404. https://doi.org/10.3390/en13092404