Abstract
Within the framework of blade aerodynamic design, the maximum aerodynamic efficiency, power production, and minimum thrust force are the targets to obtain. This paper describes an improved optimization framework for blade aerodynamic design under realistic conditions, while considering multiple design parameters. The relationship between the objective function and the design parameters, such as the chord length, maximum chord, and twist angle, were obtained by using the second-order response surface methodology (RSM). Moreover, the identified parameters were organized to optimize the aerodynamic design of the blades. Furthermore, the initial and optimized blade geometries were compared and showed that the performance of the optimized blade improved significantly. In fact, the efficiency was increased by approximately 10%, although its thrust was not varied. In addition, to demonstrate the improvement in the resulting optimized blades, the annual energy production (AEP) was estimated when installed in a specific regional location. The result showed a significant improvement when compared to the baseline blades. This result will be extended to a new perspective approach for a more robust optimal design of a wind turbine blade.
1. Introduction
The wind turbine is a complex engineering system, subjected to highly fluctuating and irregular loads. In addition, as wind turbines continue to grow in size and rated power, obtaining an optimal blade design is a significant task. For the design and performance calculation of the blades, numerous papers have used blade element momentum theory (BEMT), which was developed originally for airplane propellers by Glauert [1], and is combined with momentum theory and blade element theory to analyze wind turbine performances. Many researchers have predicted wind turbine performance using those theories [2,3,4,5,6]. Mostafa et al. [7] improved the aerodynamic performance of a wind turbine blade by the cavity shape optimization. Ozge and Ismail [8] explained an aerodynamic shape optimization methodology based on a genetic algorithm and BEMT. Wei et al. [9] presented an integrated method for designing the airfoil families of large wind turbine blades. Krishnil et al. [10] designed and optimized airfoils for a 20 kW wind turbine using a multi-objective genetic algorithm. In addition, in relation to the optimization of the blade design, many studies have already been conducted in helicopter and aeronautical engineering fields. Kumar and Cesnik [11] presented a mixed-variable optimization method for the aeroelastic analysis and design of active twist rotors. Sekula and Wilbur [12] identified the optimal blade tip planform for an active twist rotor. For vibration reduction with an active twist rotor blade in helicopters, Shin et al. [13] studied the design and manufacturing procedure.
For improving the efficiency of the blade, most of the literature has focused on the optimization of the airfoil profile or active twist rotors, etc. However, in addition to these factors, there are more possibilities for aerodynamic design for an optimal design of the blades, and further study is needed. In particular, most research in the past had yielded optimal blade designs by a number of iterations, which consumed a lot of time and computational resources, and it was difficult to acquire quick results. Therefore, it is necessary to consider a straightforward design scheme with multiple design parameters for an optimum aerodynamic design at an early stage of the design and to grasp significant design parameters along with their correlation. The response surface methodology (RSM) is a statistical method for studying the relationship between multiple design variables and one or more response variables. Ali et al. [14] developed an airfoil profile optimization for wind turbines with computational fluid dynamics (CFD) analysis and the RSM. Li et al. [15] presented an airfoil optimization for a wind turbine based on the response surface method. Toft et al. [16] assessed the structural integrity of a wind turbine using the RSM. Tabatabaeikia et al. [17] studied the optimization of a wind turbine based on the computational and experimental method. In that study, as an analytical procedure for the optimization method, the RSM was utilized using multivariate statistical techniques. Huang et al. [18] presented the optimal blade setting angle of a tidal turbine using the RSM and validated it with an experimental method. Sun [19] presented a wind turbine airfoil design using the RSM under various operating conditions.
Previous research on the blade design using the RSM focused on the micro-range, such as blade airfoil optimal design, blade setting angle optimization, etc. However, in addition to those approaches, it will be a good study to identify the key design parameters in the blade aerodynamic design and to find and use the best combination of these parameters to obtain the optimal design of the blade. Such a method may become a research objective for additional and improved blade design. However, in the past, optimization in the field of wind turbine blades has been carried out, taking into account the influence of a single factor at a time. Therefore, only a single parameter was modified, while the other factors were not varied. One of the significant disadvantages for such methods was that it did not take into account the possibility that the used variables could interact with the others. As a result, those methods were not capable of expressing the effect of the other parameters on the response. Another disadvantage of the single-parameter optimization was that the number of experiments required increased, while increasing time, cost, and computing resources.
This paper presents a multi-parametric blade design methodology with maximum efficiency using a second-order RSM based on the BEMT. The ultimate goal of the RSM application is obtaining the best blade performance by identifying the design variables that significantly affect the blade efficiency, such as chord length, max chord length, and twist angle, etc., and designing the blades with maximum efficiency and maximum energy production through the optimal combination of these variables. Additionally, in using the optimized blades, an annual energy production (AEP) is estimated and compared for the case where an optimal blade is installed in a specific area. As a result, the AEP shows a significant improvement over the baseline blade.
2. Theoretical Method and Geometry Description
BEMT has been used as a theory to predict blade performance, and this theory has the assumption that the wind is a one-dimensional, non-viscous, and incompressible flow. This theory has been applied in numerous studies dealing with the simulation of wind turbine performance [2,3,4,5,6].
2.1. Blade Element Momentum Thoery (BEMT)
Based on BEMT, wind turbine blades are considered as actuator discs and have no thickness, as shown in Figure 1. The definition of the power coefficient () is as follows:
where , , and are the air density, cross-section of the rotor, and wind velocity, respectively. We introduce the axial induction factor as
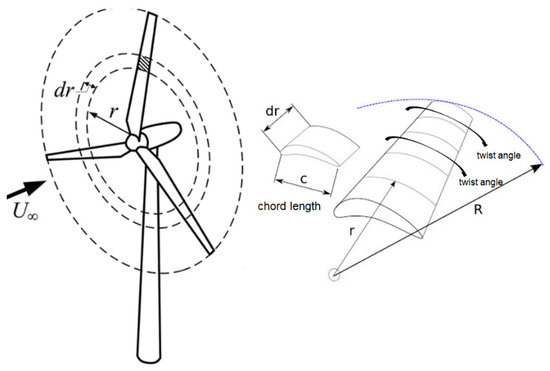
Figure 1.
Schematics of the blade elements.
Regarding the upstream flow, it is assumed that the downstream flow is rotated at angular velocity while it is entirely axial. Taking into account the tangent flow behind the rotor, a factor defined as , the tangential induction factor is introduced as follows:
where is the induced tangential angular velocity of the flow and is the angular velocity of the rotor, respectively.
The thrust force by the annular element can be expressed as follows, and the power produced by the rotor, is found to be the product of the annular elemental torque and the angular velocity, described as follows:
The is a blade element of length and is a distance from the rotor axis, shown in Figure 1, and the power coefficient, , is given as follows.
where is the tip speed ratio, is the speed ratio at the hub radius, and is the speed radius at rotor radius .
Several research studies have considered the effects of tip losses [8]. Prandtl’s tip loss coefficient () is shown below.
The power coefficient, along with the tip loss coefficient of the blade can be determined as
By looking at Equation (8), it is obvious that the torque and power depend on the angle of attack, , which is determined by the inflow wind speed and the rotational speed of the turbine.
2.2. Aerodynamic Design
In the initial blade design phase, the design parameter, such as the diameter of the blade, , rated speed, , and design tip speed ratio, , can be predicted by using Equations (9)–(11).
After determining the design parameters, the computation of the chord length and twist angle is processed as follows [3].
- (1)
- Compute the tip loss factor in Equation (7), ()
- (2)
- Calculation of the axial flow induction factor,
- (3)
- Check the convergence digit after iterative computations for and
- (4)
- Obtain the tangential flow induction factor,
- (5)
- Calculate the chord length,
- (6)
- Calculate the twist angle,
Through this procedure, the aerodynamic blade design for the wind turbine is completed, and its power and efficiency are obtained based on BEMT.
2.3. Response Surface Method (RSM)
The RSM is an important statistical methodology for investigating the relationships between the variables, which is to set-up an estimated specific relation between the design parameters and their responses. The main purpose of the RSM is to use a series of designed experiments to acquire a best response. It is used to maximize the performance of a product by optimizing the operating elements. Independent variables are assumed to be continuous and can be controlled by experiments with minor errors. It is needed to find an appropriate assumption of the actual practical relationship between the individual variables and the responses. Generally, the second-order RSM model is used as follows.
where is the response value of the system, is the regression coefficient intercept, are the linear terms, are the quadratic terms, and are the interaction terms. and are the coded independent variables for the design parameters. In addition, and are the number of the variables and the statistical error, respectively.
Using the least-squares method, Equations (17) and (18) are solved, and the equation coefficients are computed. After obtaining the equation coefficients, the response is estimated by solving the equations. In Section 2.2 and [2,3,4], the chord length and the twist angle distribution along the blade are recognized as the most important design parameters for the blade efficiency, and research on the optimal blade design is conducted by focusing on these two parameters using the RSM.
3. Optimal Design of the Blade
In order to achieve the highest power coefficient of the wind turbine, multivariate statistical techniques are used in carrying out the optimization of the blade. For this, the second-order RSM in a commercial software, Minitab 18 [20], is applied to the design of experiment (DOE) approach. Moreover, GH Bladed [21] is used for the estimation of the blade efficiency (). GH Bladed is a commercial code used for wind turbine design and certification based on the BEMT, and is commonly used in the field of wind turbines.
With regard to optimal blade design, a flowchart of the present process is shown in Figure 2. First, based on BEMT, the shape design of the blades, i.e., the aerodynamic design, is carried out as a baseline blade. To check the adequacy of the aerodynamically designed blade, the blade will be examined regarding whether it is applicable to an actual turbine based on various parameters such as blade efficiency, power production, and trust force, obtained using GH Bladed. In this process, it is important to identify the design variables that affect blade efficiency in the blade design procedure. Next, using the identified design variables, the best combination of the design variables that can yield the maximum blade efficiency will be obtained. In this paper and research [2,3,4], we identified that the blade chord length and the built-in twist angle will be the most significant design variables, and the design process to determine the optimal combination of those will be conducted. Meanwhile, as a first step in the optimal design using the RSM, several calculation locations are chosen along the length of the blade. In the case of a substantial change in the geometry of the blade, a significant amount of computation is performed by placing the calculation locations more densely. For the computation of the RSM, the ranges and levels of the variables for the chord length and built-in twist angle are assigned for each calculation location. At each calculation location, various combinations of the chord length and twist angle are presented using the RSM, and the blade efficiency will then be estimated by GH Bladed based on those combinations. These computations are performed at each calculation location. The chord length and the twist angle, determined by the optimal combination at each location [2,3,4,5], finally represent the geometry of the blade as a result of the aerodynamic design. As the final step, the blade efficiency, power production, and thrust forces are obtained using the optimal design blade again. If the results are within the blade design objectives, the blade optimization will be completed. However, if they do not match, the redesign will be performed by changing the design parameters. In addition, using the optimized blades, the AEP will be predicted, and it will be found that the blade optimization technique using the RSM introduced in this paper has a significant economic value, as well as technical aspects.
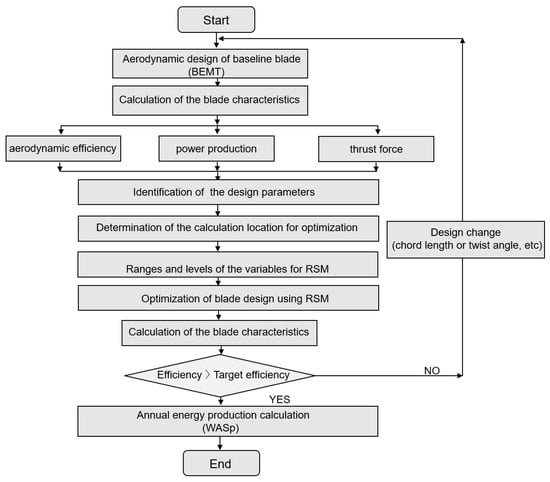
Figure 2.
Schematic diagram of the present blade design optimization procedure.
3.1. Initial Blade Design
For designing the initial baseline blade, the airfoils and the information used in this paper are shown in Figure 3 and Table 1. Choosing the appropriate blade profile depends on blade performance, and more than one airfoil is applied according to the selected thickness distribution. For structural reasons, a thicker airfoil is typically used closer to the blade root, while a thinner airfoil is used along the tip area as it is distributed smoothly from the root to the tip. Krishnil et al. [10] had applied a single airfoil, which differs from the large commercial blades currently in use; in general, large blades have 5 to 7 airfoil applications. In this paper, six types of airfoils are used, including the NACA and DU series, and especially, NACA 64–618 is considered as an airfoil at the tip. The aerodynamic performance in terms of the Reynolds number at the blade tip region () is obtained using the aerodynamic table generator (ATG) [22]. The ATG uses the aerodynamic database obtained by wind tunnel experiments, and revises the aerodynamic performance by considering the thickness distribution of adjacent airfoil shapes, change in the Reynolds number, and three-dimensional influence on a rotating blade by the aerodynamic performance re-assessment method [23] The lift and drag coefficients () of various types of airfoil are applied to the airfoil section and predict the aerodynamic performance of the blades, which are functions of the angle of attack.
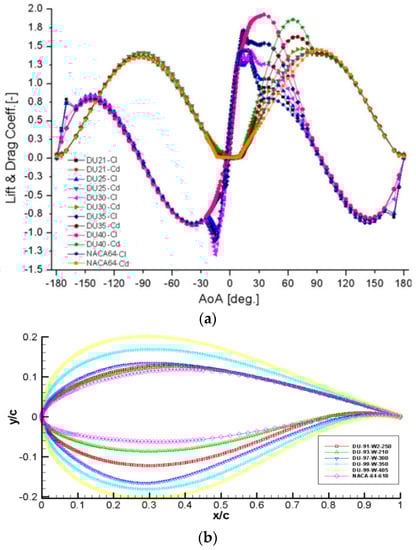
Figure 3.
Aerodynamic coefficients and airfoil shapes. (a) Aerodynamic coefficients of the airfoils. (b) Airfoil shapes of NACA and DU series.

Table 1.
Airfoil distribution.
In Section 2.2 and the equations described therein, the blade design starts by dividing the blade into several elements, and assumes the initial axis induction factor and the initial tangential induction factor at the specific blade element. Then, the angle of attack, blade efficiency, and thrust force of the blade are calculated using BEMT. During this process, the governing equation is solved by repeatedly updating the axial induction and tangential induction factors until it converges. These procedures will also be repeated in the next elements, and the calculation will continue until all elements are completed. There are many computational codes, such as Flex5 (ECN: Energy Research Centre of the Netherlands) and WT-Perf (NREL: National Renewable Energy Laboratory), based on this logic, and the program, GH Bladed, is utilized in this work.
Through multiple iterations for maximum efficiency () in the blade design, the chord length and the twist angle distribution along the blade are recognized as the most important design factors for the blade efficiency [2,3,4,5]. In the meantime, the chord length and the twist angle distribution along the span-wise direction are obtained in Figure 4, which are 40.1 and 2.6 m, in length and chord, respectively. Additionally, the aerodynamic performance () distribution is shown in Figure 5 and has a 2 MW rated power and 221.415 kN max thrust force. Even though that is a well-created blade based on BEMT, it is a blade that requires an improvement in terms of efficiency, and the RSM is applied to optimize the blade design.
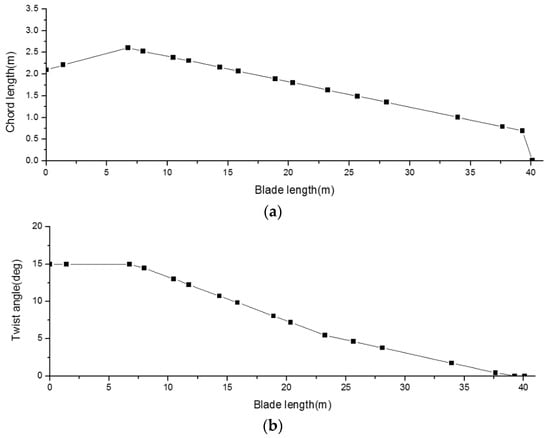
Figure 4.
Baseline blade geometry. (a) Chord length distribution. (b) Twist angle distribution.
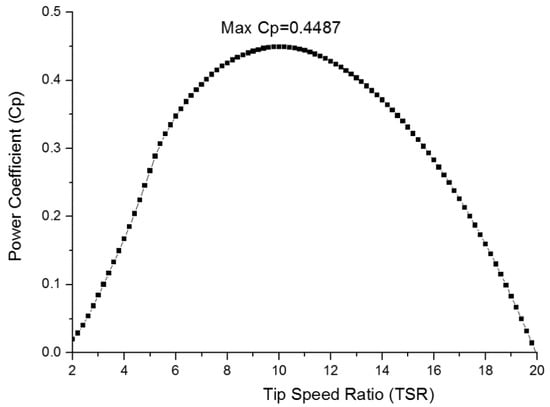
Figure 5.
Power coefficients in terms of the tip speed ratio (TSR).
3.2. Objective Function
In the blade optimization design process, the objective function and constraint are established first. The objective function is chosen to maximize the efficiency of the blade in order for increased energy production. For that, the most fundamental target in the wind turbine blade optimal design is to obtain the blade design at its highest possible values. The design variables are selected to be the chord length and the twist angle distribution, by referring to many existing studies. As a constraint, when all the designs are completed, the overall blade geometry should be designed smoothly. The above is summarized as follows.
- -
- Objective function: To maximize the efficiency () of the blade
- -
- Design variables: Chord length, twist angle (± 10% based on the calculation location)
- -
- Constraints: Chord length and twist angle, not exceeding 2.5 m and 15°, respectively
3.3. Design Parameter and Calculation Locations
In the blade design procedure, the most significant design parameters are identified as the chord length and the twist angle distribution, as shown in studies 3 and 4. Therefore, considering the effects of the two parameters on the wind blade performance, simultaneously, is required. For comparison purposes of the optimization, the baseline blade is used as an initial design. Table 2 presents the baseline blade geometry and calculation location. The blade is divided into 16 sections (17 locations), and 14 locations, from 3 to 16, are regarded as optimization locations using the RSM, as shown in Figure 6. The other locations (1, 2, and 17) are excluded as calculation locations because the optimization effect will be minimal from an aerodynamic point of view. The optimal design is performed by placing calculated optimization locations intensively from 40% to 90% span-wise location, which significantly affects the blade efficiency. The ranges and levels of the variables are decided based on the adjacent chord length and the twist angle for the calculation locations, as listed in Table 3. At the calculation location, the values of the chord length and twist angle are determined to be + 10% for −1 and −10% for +1, respectively. If this value is greater than 10%, the inconsistency may occur that the chord length and twist angle at the calculation location do not smoothly connect with those determined at the adjacent calculation location. In this case, considering the blade fabrication process using the infusion method, the result is an impractical design.
Table 2.
Baseline blade geometry and calculation location.
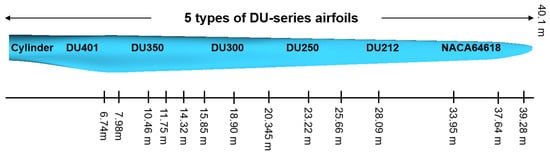
Figure 6.
Calculation locations of the baseline blade for optimization.
Table 3.
Ranges and levels of variables, chord length (m), and twist angle (°).
3.4. Calculation Procedure
Thirteen simulations with different design parameters are conducted for each calculation location, from 3 to 16, and only calculation location 3 is shown as a sample in Table 4. The 9th–13th simulations are the central experiments, which are used to guarantee a reliable prediction. In it, an estimation of the relationship between the design variables and output responses is attempted by using the experimental design method with the RSM and the GH Bladed results. The two main factors are determined as design variables, and the case of various combinations of these variables will be obtained. The first factor is the chord length and the second factor is the twist angle. The last column shows values by GH Bladed for each sample at multiple parameters. It is most important to find the best combination of the two variables, chord length and twist angle. The RSM calculation finds the number of optimal combinations of these two variables as “Variables” in 13 cases; the efficiency at this time is expressed as "Response" through BEMT calculation in Table 4. Then, it chooses a case that indicates the maximum efficiency (Cp). The chord length and twist angle values are selected as geometries for the location and are reflected in the final design. These computations are performed for each calculation location, and 13 computations per location are performed, and thus, a total of 182 (13 14 = 182) calculations are performed.
Table 4.
Design of the parameters for calculation location 3.
4. Results and Discussions
In this paper, the RSM used a mathematical formulation to find combinations that could represent the best blade efficiency using two independent variables. The blade is divided into 17 locations, and 14 locations are regarded as optimization locations.
4.1. Surface and Contour Plot
Surface plots, which are a pairwise relationship between the chord length, twist angle, and values, are shown in Figure 7. In this diagram, at location 3, an optimum efficiency is achieved at 2.6 m chord length and 14.9° twist angle, at which the maximum will become 0.448. This diagram demonstrates the positive effects of increasing the chord length on the value of , whereas the changes in the twist angle do not have such effect. It is estimated that increasing the chord length to a specific twist angle value, approximately 15°, will also increase the efficiency. In consideration of this, the design should focus on the changes in the chord length rather than the twist angle near the blade root. However, other locations, such as locations 4 through 15, have different tendencies. This diagram shows an inverse relationship between these two parameters. If the chord length increases and the twist angle decreases to a certain point, will show an increased tendency.
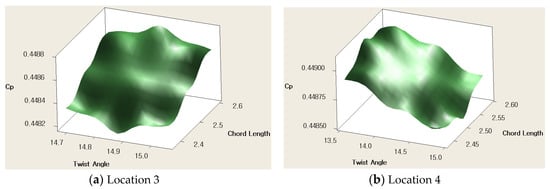
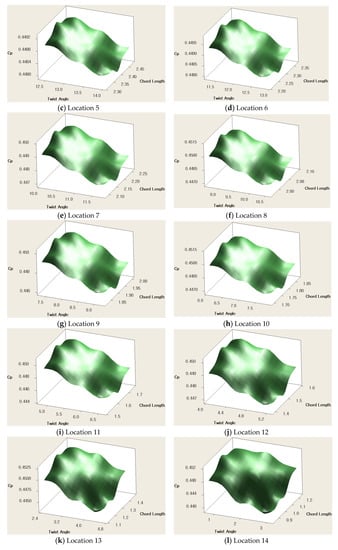
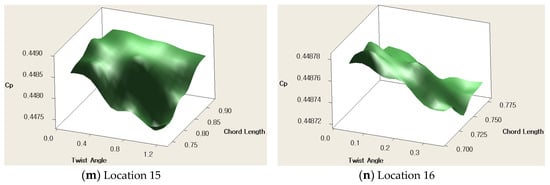
Figure 7.
Surface plots of in terms of chord length and twist angle. (a) Location 3. (b) Location 4. (c) Location 5. (d) Location 6. (e) Location 7. (f) Location 8. (g) Location 9. (h) Location 10. (i) Location 11. (j) Location 12. (k) Location 13. (l) Location 14. (m) Location 15. (n) Location 16.
The correlation between the values is shown in terms of the chord length and twist angle in Figure 8 as contour plots. In this diagram, it is straightforward to verify the relationship among the design parameters. At the calculation locations from 4 to 16, the dark color, which means a larger value, is mostly located on the left and top. This indicates increasing size of the chord length, while taking the twist angle smaller, rather than increasing the value of the twist angle. Based on these trends in the contour plot, proceeding with the blade optimization design is found to be appropriate.
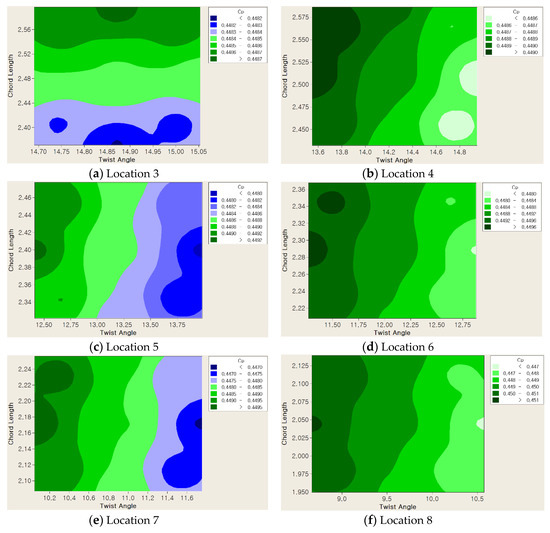
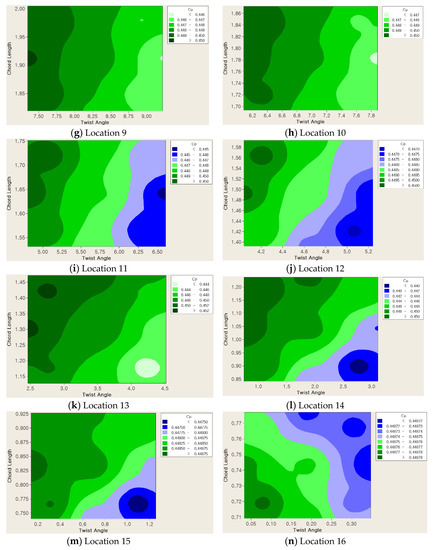
Figure 8.
Contour plots of in terms of chord length and twist angle. (a) Location 3. (b) Location 4. (c) Location 5. (d) Location 6. (e) Location 7. (f) Location 8. (g) Location 9. (h) Location 10. (i) Location 11. (j) Location 12. (k) Location 13. (l) Location 14. (m) Location 15. (n) Location 16.
4.2. Blade Optimization Results
The optimization results for each calculation location are listed in Table 5. The optimum chord and twist derived from the present RSM at each calculation location are applied to estimate . at each location shown in Table 5 is the resulting value of of the blade when the optimal design is obtained only at the respective location. Therefore, the combination of the optimal design by all the calculation locations, i.e., the final optimal blade design result, shows a further increased value of , as shown in Figure 9 and Figure 10. In the case of the locations from 7 (14.327 m from the root, 36% of the blade length) to 14 (33.95 m from the root, 85% of the blade length), although optimized only at the respective locations, the overall efficiency is found to exceed 0.45. This means that most of the blade efficiency is rather influenced by that area, a length of approximately 40% to 90% from the root [24]. Thus, for the blade optimization, it will be effective to concentrate on the part that is responsible for most of the efficiencies and power of the blade, and then perform the optimal design. The optimized combinations of the calculation locations, from locations 3 to 16, are listed as the results of the optimum blade design in Table 6. It shows the geometric comparison between the initial blade and the optimum blade with respect to the chord length and the twist angle. The chord length is increased by approximately 5% as compared to that of the baseline blade. However, the built-in twist angle is decreased dramatically, specifically 69% at 37.64 m of the blade. As shown in Figure 7 and Figure 8, the present optimization progresses in the direction of increasing chord length and decreasing twist angle.
Table 5.
Optimized results for each calculation location.
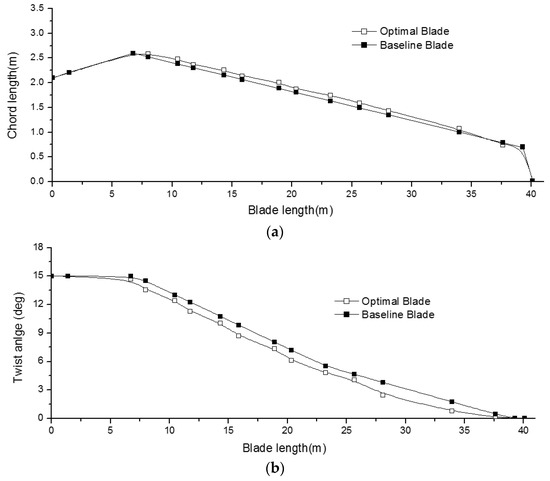
Figure 9.
Comparison between the optimal and baseline geometry. (a) Chord length distribution. (b) Twist angle distribution.
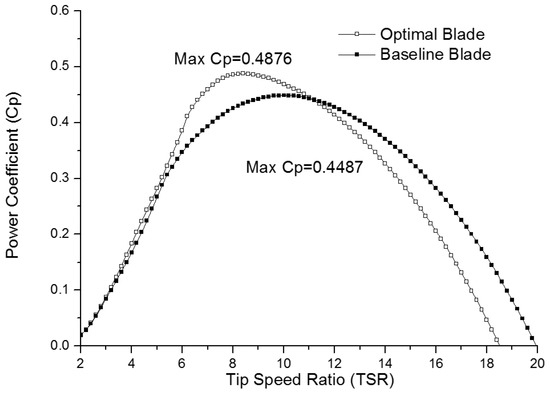
Figure 10.
Power efficiency comparison between the optimal and baseline blades.
Table 6.
Geometric comparison.
Additionally, in the optimal blade design results, the chord length and the twist angle distribution along the span-wise direction are shown in Figure 9. The chord length is thicker than the baseline blade. It is found that the twist angle is reduced considerably. By looking at the results of the optimal chord length and the twist angle, comparison of the efficiency () is shown in Figure 10. In Table 7, the optimized blade performance is significantly improved, of which the efficiency () is significantly increased, approximately 8.7%, from 0.4487 to 0.4876. In agreement with the efficiency, the thrust force is also increased in Figure 11. However, most of the wind turbines have a pitch control system for optimal operation of the blade and to reduce the thrust force imposed by the wind load. The advantage of the optimal design is found to be greater than the loss due to the increase in the blade thrust force.
Table 7.
Results comparison.
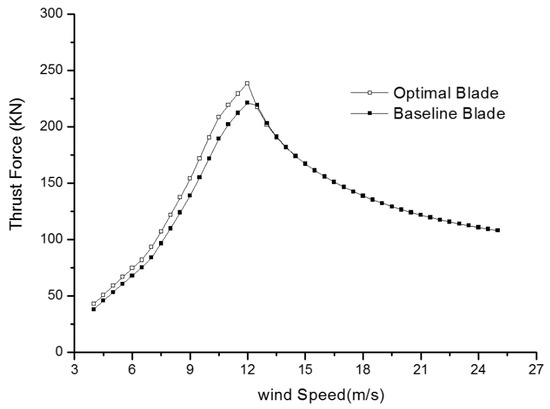
Figure 11.
Thrust force comparison between the optimal and baseline blades.
Finally, the power curve comparison between the two blades is shown in Figure 12. The rated wind speed of the optimized blade is changed from 12.5 to 12.0 m/s, which is the rated wind speed shifted to the left at 4%. This indicates that the rated power of 2 MW occurs at a lower wind speed, which indicates an AEP increase. Two megawatts is the maximum energy produced in the optimum condition for the wind turbine. The turbine with a lower rated wind velocity means that 2 MW of electricity can be produced at a relatively low speed, as compared to a high rated wind speed turbine. This represents a highly desirable design for the turbines. As an optimal power is generated at relatively low wind speeds, it is possible to have more energy production and, therefore, an increased efficiency.
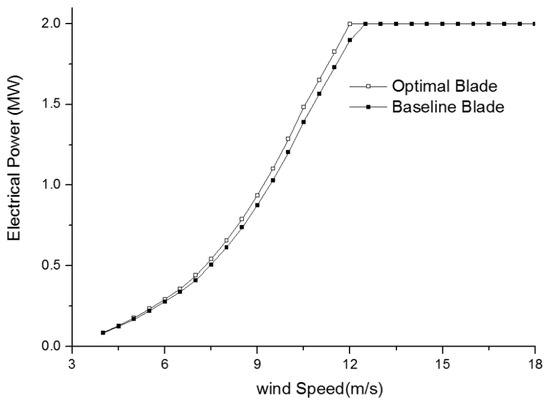
Figure 12.
Power curve comparison between the optimal and baseline blades.
5. Improvements in AEP
In this section, the annual energy production (AEP) is calculated, and the results are compared between the baseline blade and the optimal designed blade when installed in a specific area, Jeju Island, South Korea (N33.5, E126.8). For this, WAsP 11 [25], a commercial software for the wind turbine and the site data analysis, is used. Meanwhile, information on the probability distribution of the wind and the wind speed for each direction required for this calculation are shown in Figure 13.
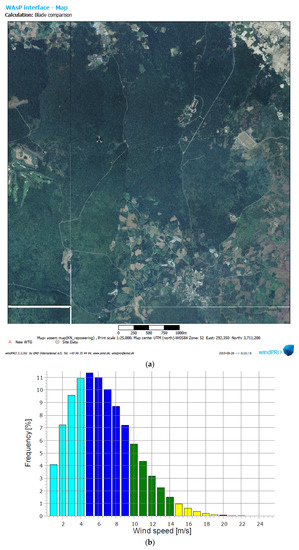
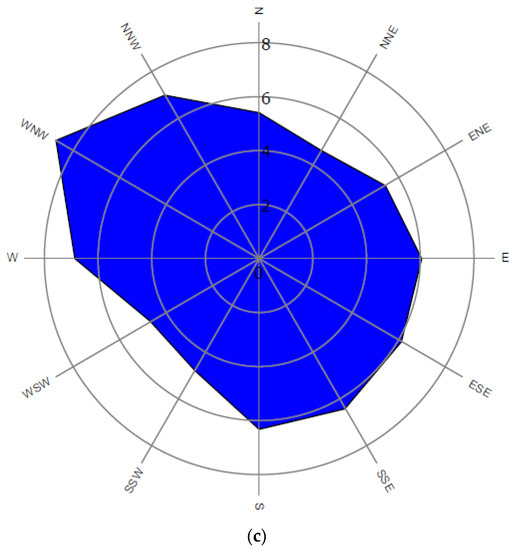
Figure 13.
Wind data for annual energy production (AEP) calculation at Jeju Island, South Korea. (a) Site map; Jeju Island, South Korea, Scale 1:75,000. (b) Weibull distribution with respect to wind speed. (c) Mean wind speed (m/s) with respect to wind direction.
In the case of the blade used in this calculation, a blade capable of generating a rated power of 2 MW/h, when the wind velocity is greater than the rated wind speed (12 or 12.5 m/s) only, is 17,520 MWh/y, theoretically. However, as shown in Figure 13, when considering the wind probability distribution and the wind direction according to the wind speed, the actual output amount of the electricity is only about 20% of the maximum output due to a low wind velocity distribution. Therefore, the design of a blade with a rated speed at a low speed that can produce a rated output early is of paramount importance. The rated wind speed of the optimized blade moves to the left compared to the baseline blade. This suggests that a rated wind speed of 2 MW occurs at lower wind speeds, which means an increase in the AEP. This difference is especially significant in the lower wind speed regions. The turbines with lower rated wind speeds may produce 2 MW of electricity at lower wind speeds. The optimum power is generated at relatively low wind speeds, allowing for more energy production, which can improve efficiency.
The AEP is calculated by WAsP 11 as 4665 and 4975 MWh/y for the baseline blade and the optimal designed blade, respectively, and summarized in Table 7. With an increase of approximately 6.65% in terms of the AEP, the average durability of a wind turbine is 20 years or longer, which has a significant economic value in terms of energy production. Considering these results, the optimum design of the blade is an essential procedure in wind turbine design, and the present design scheme, which considers multiple design parameters using the RSM, is a meritorious method.
6. Conclusions
This paper proposes an improved blade design scheme that considers multiple design parameters, such as the chord length and twist angles along the blades, for an optimal design of the wind blades by using the second-order RSM. In this study, the blade efficiency, rated power, and thrust force are calculated based on BEMT. For comparison of the proposed design optimization, an initial baseline blade is designed and optimized using the RSM. Even though the baseline blade is well-designed based on BEMT, with appropriate chord length and twist angle distribution, it is a blade that requires improvement in terms of efficiency. Through the proposed optimization methodology using the RSM, the blade efficiency increases by 8.7% and the rated wind speed also improves by 4% from 12.5 to 12 m/s. In addition, because of these results, the annual energy production (AEP) shows an increase of approximately 7%. It is observed that this is the result of an economic improvement resulting from the technological improvements.
For an optimal design of the blades in the wind turbine, various approaches were introduced by many researchers, but there were disadvantages that were relatively complex and accompanied by a significant amount of calculations. Contrary to those constraints, the present RSM method is capable of an efficient blade design optimization. Additionally, this design method provides faster and more accurate access to blade design and evaluation, which enables wind turbine blade designers to obtain efficient and reliable designs from various design parameters. In the future, as an extension of this paper, CFD analysis will be used to provide further improvement regarding the three-dimensional flow effects around the wind turbine blade, which may not be fully captured by the present BEM method.
Author Contributions
S.-L.L. wrote the manuscript, conceptualized and analyzed; S.S. reviewed, edited and supervised. All authors have read and agreed to the published version of the manuscript.
Funding
This work was supported by the Korea Institute of Energy Technology Evaluation and Planning (KETEP) and the Ministry of Trade, Industry & Energy (MOTIE) of the Republic of Korea (No. 20193010025800).
Conflicts of Interest
The authors declare no conflict of interest.
Nomenclature
| AEP | Annual Energy Production |
| ATG | Aerodynamic Table Generator |
| BEMT | Blade Element Momentum Theory |
| CFD | Computational Fluid Dynamics |
| DOE | Design of Experiment |
| ECN | Energy Research Centre of the Netherlands |
| NREL | National Renewable Energy Laboratory |
| RSM | Response Surface Methodology |
| WAsP | Wind Atlas Analysis and Application Program |
| Drag coefficient | |
| Lift coefficient | |
| Power coefficient | |
| Tip loss factor | |
| Hub diameter | |
| Rotor diameter | |
| Number of blade | |
| Rated power | |
| Torque | |
| Radius | |
| Reynolds number | |
| Thrust force | |
| Axial flow induction factor | |
| Tangential flow induction factor | |
| Critical axial induction factor | |
| Chord length | |
| Tip loss factor | |
| Angle of attack at tip airfoil | |
| Upper limit of twist angle | |
| Twist angle | |
| Design tip speed ratio | |
| Inflow angle | |
| Minimum blade rotational speed | |
| Maximum blade rotational speed | |
| Rated rotating speed of blade |
References
- Glauert, H. Airplane Propellers. In Division L of Aerodynamic Theory; Springer: Berlin/Heidelberg, Germany, 1976. [Google Scholar]
- Ceyhan, O.; Sezer-Uzol, N.; Tuncer, I. Optimization of horizontal axis wind turbines by using BEM theory and genetic algorithm. In Proceedings of the 5th Ankara International Aerospace Conference; METU: Ankara, Turkey, 2009; pp. 17–19. [Google Scholar]
- Kim, B.S.; Kim, W.J.; Bae, S.Y.; Park, J.H.; Kim, M.E. Aerodynamic Ddesign and Performance Analysis of Multi-MW Class Wind Turbine Blade. J. Mech. Sci. Technol. 2011, 25, 1995. [Google Scholar] [CrossRef]
- Kim, B.S.; Kim, W.J.; Lee, S.L.; Bae, S.Y.; Lee, Y.H. Development and Verification of a Performance Based Optimal Design Software for Wind Turbine Blades. Renew. Energy 2013, 54, 166–172. [Google Scholar] [CrossRef]
- Sohail, R.R.; Dulikravich, G.S.; Sobieczky, H.; Gonzalez, M. Bladelets-Winglets on Blades of Wind Turbines: A Multiobjective Design Optimization Study. J. Solar Energy Eng. 2019, 141, 175–180. [Google Scholar]
- Matias, S.; Feng, J.; Ramos-García, N.; Horcas, S.G. Design optimization of a curved wind turbine blade using neural networks and an aero-elastic vortex method under turbulent inflow. Renew. Energy 2020, 146, 1524–1535. [Google Scholar]
- Mostafa, F.; Mahdi, N.A.; Omid, N.; Ali, M.; Kim, K.C. Aerodynamic Performance Improvement of Wind Turbine Blade by Cavity Shape Optimization. Renew. Energy 2019, 132, 1524–1535. [Google Scholar]
- Ozge, P.; Ismail, H.T. Aerodynamic Shape Optimization of Wind Turbine Blades Using a Parallel Genetic Algorithm. Procedia Eng. 2013, 61, 28–31. [Google Scholar] [CrossRef]
- Wei, J.Z.; Wen, Z.S.; Jens, N.S. Integrated Airfoil and Blade Design Method for Large Wind Turbines. Renew. Energy 2014, 70, 172–183. [Google Scholar]
- Ram, K.R.; Lal, S.P.; Ahmed, M.R. Design and Optimization of Airfoils and a 20kW Wind Turbine Using Multi-Objective Genetic Algorithm and HARP_Opt Code. Renew. Energy 2019, 144, 56–67. [Google Scholar] [CrossRef]
- Kumar, D.; Cesnik, C.E.S. New Optimization Strategy for Design of Active Twist Rotor. AIAA J. 2015, 53, 436–448. [Google Scholar] [CrossRef]
- Sekula, M.K.; Wilbur, M.L. Optimization of an Active Twist Rotor Blade Planform for Improved Active Response and Forward Flight Performance. J. Am. Helicopter Soc. 2017, 62, 1–12. [Google Scholar] [CrossRef]
- Shin, S.J.; Cesnik, C.E.S.; Wilkie, W.K.; Wilbur, M.L. Design and Manufacturing of a Model-scale Active Twist Rotor Prototype Blade. J. Intell. Mater. Syst. Struct. 2008, 19, 1443–1456. [Google Scholar] [CrossRef]
- Ali, C.B.; Michael, D.; Bjorn, P. Aerodynamic Optimization of Airfoil Profiles for Small Horizontal Axis Wind Turbines. Computation 2018, 6, 34. [Google Scholar]
- Li, J.Y.; Li, R.; Gao, Y.; Huang, J. Aerodynamic Optimization of Wind Turbine Airfoils Using Response Surface Techniques. Proc. Inst. Mech. Eng. Part A J. Power Energy 2010, 224, 827–838. [Google Scholar] [CrossRef]
- Toft, H.S.; Svenningsen, L.; Moser, W.; Sørensen, J.D.; Thøgersen, M.L. Assessment of Wind Turbine Structural Integrity Using Response Surface Methodology. Eng. Struct. 2016, 106, 471–483. [Google Scholar] [CrossRef]
- Tabatabaeikia, S.; Ghazali, N.N.B.N.; Chong, W.T.; Shahizare, B.; Izadyar, N.; Esmaeilzadeh, A.; Fazlizan, A. Computational and Experimental Optimization of the Exhaust Air Energy Recovery Wind Turbine Generator. Energy Convers. Manag. 2016, 126, 862–874. [Google Scholar] [CrossRef]
- Huang, B.; Usui, Y.; Takaki, K.; Kanemoto, T. Optimization of Blade Setting Angles of a Counter-Rotating Type Horizontal-Axis Tidal Turbine Using Response Surface Methodology and Experimental Validation. Int. J. Energy Res. 2016, 40, 610–617. [Google Scholar] [CrossRef]
- Sun, H.S. Wind Turbine Airfoil Design Using Response Surface Method. J. Mech. Sci. Technol. 2011, 25, 1335–1340. [Google Scholar] [CrossRef]
- Available online: http://www.minitab.com (accessed on 29 January 2019).
- Bossanyi, E.A. GH Bladed Theory Manual; Garrad Hassan and Partners Ltd: Bristol, UK, 2009. [Google Scholar]
- Anonymous. Aerodynamic Table Generator v3.1 User Manual; Energy Research Centre of the Netherlands (ECN): Petten, The Netherlands, 2007. [Google Scholar]
- Snel, H.; Houwink, R.; Piers, W.J. Sectional Prediction of 3D Effects for Separated Flow on Rotating Blade. In Proceedings of the 18th European Rotorcraft Forum, Avignon, France, 15–18 September 1992. [Google Scholar]
- Available online: https://www.lmwindpower.com/en/stories-and-press/stories/innovation/innotip-at-the-tip-of-innovation (accessed on 29 January 2019).
- Available online: https://www.wasp.dk/products (accessed on 29 January 2019).
© 2020 by the authors. Licensee MDPI, Basel, Switzerland. This article is an open access article distributed under the terms and conditions of the Creative Commons Attribution (CC BY) license (http://creativecommons.org/licenses/by/4.0/).