Thermogravimetric Kinetic Study of Automobile Shredder Residue (ASR) Pyrolysis


Abstract
1. Introduction
2. Materials and Methods
2.1. Materials
2.2. Thermogravimetry Analysis Procedure
2.3. Kinetic Theory
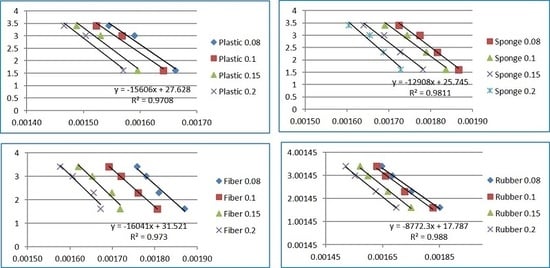
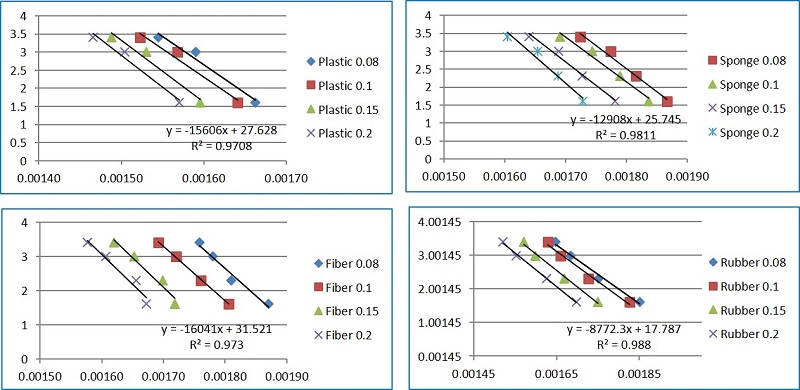
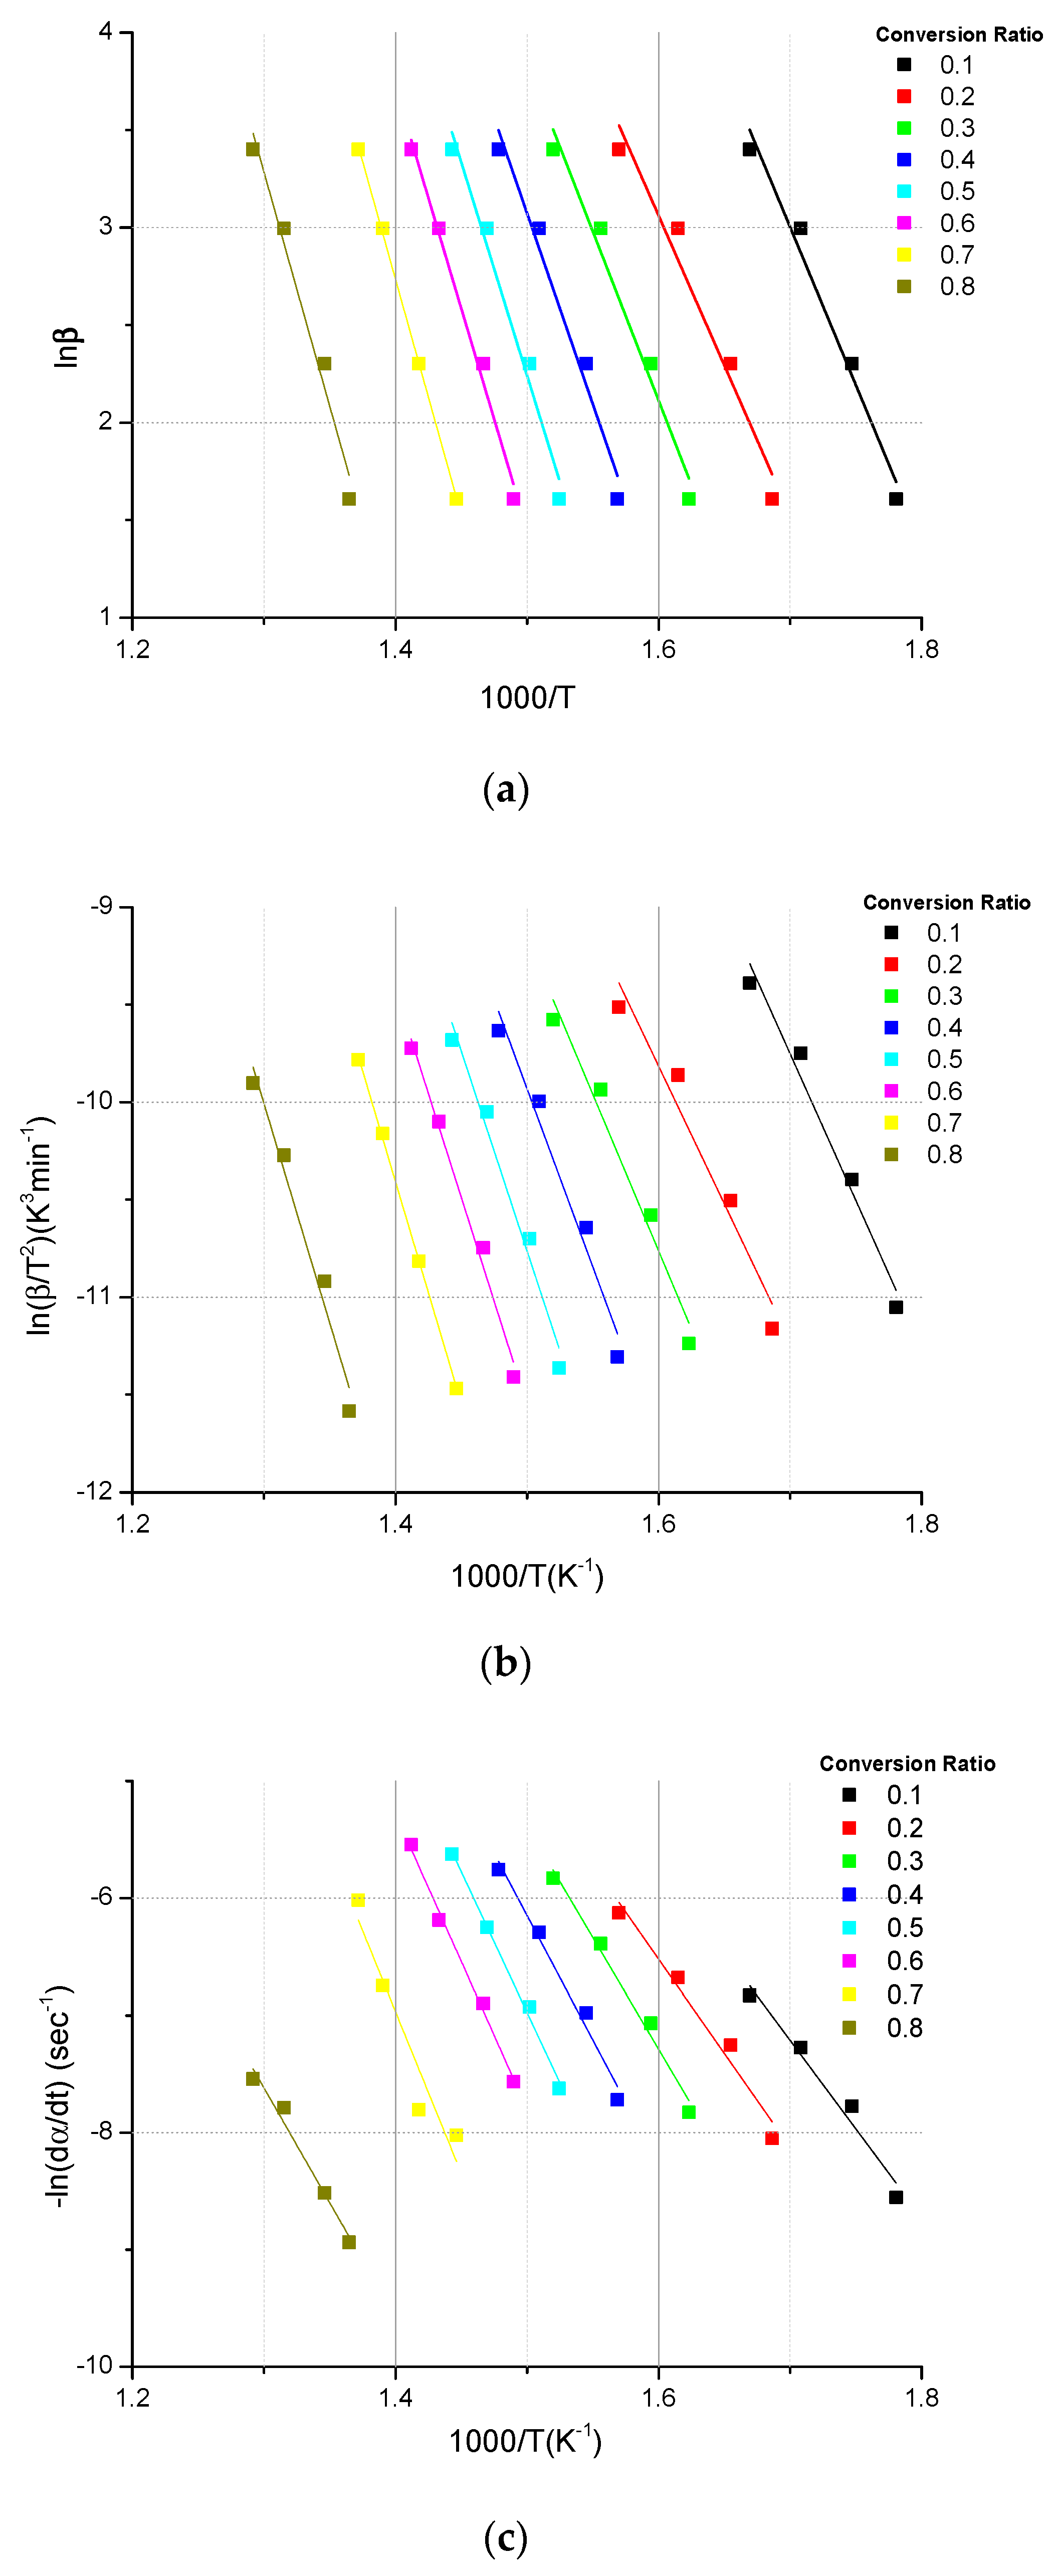
2.4. Model-Free Methods
3. Results and Discussion
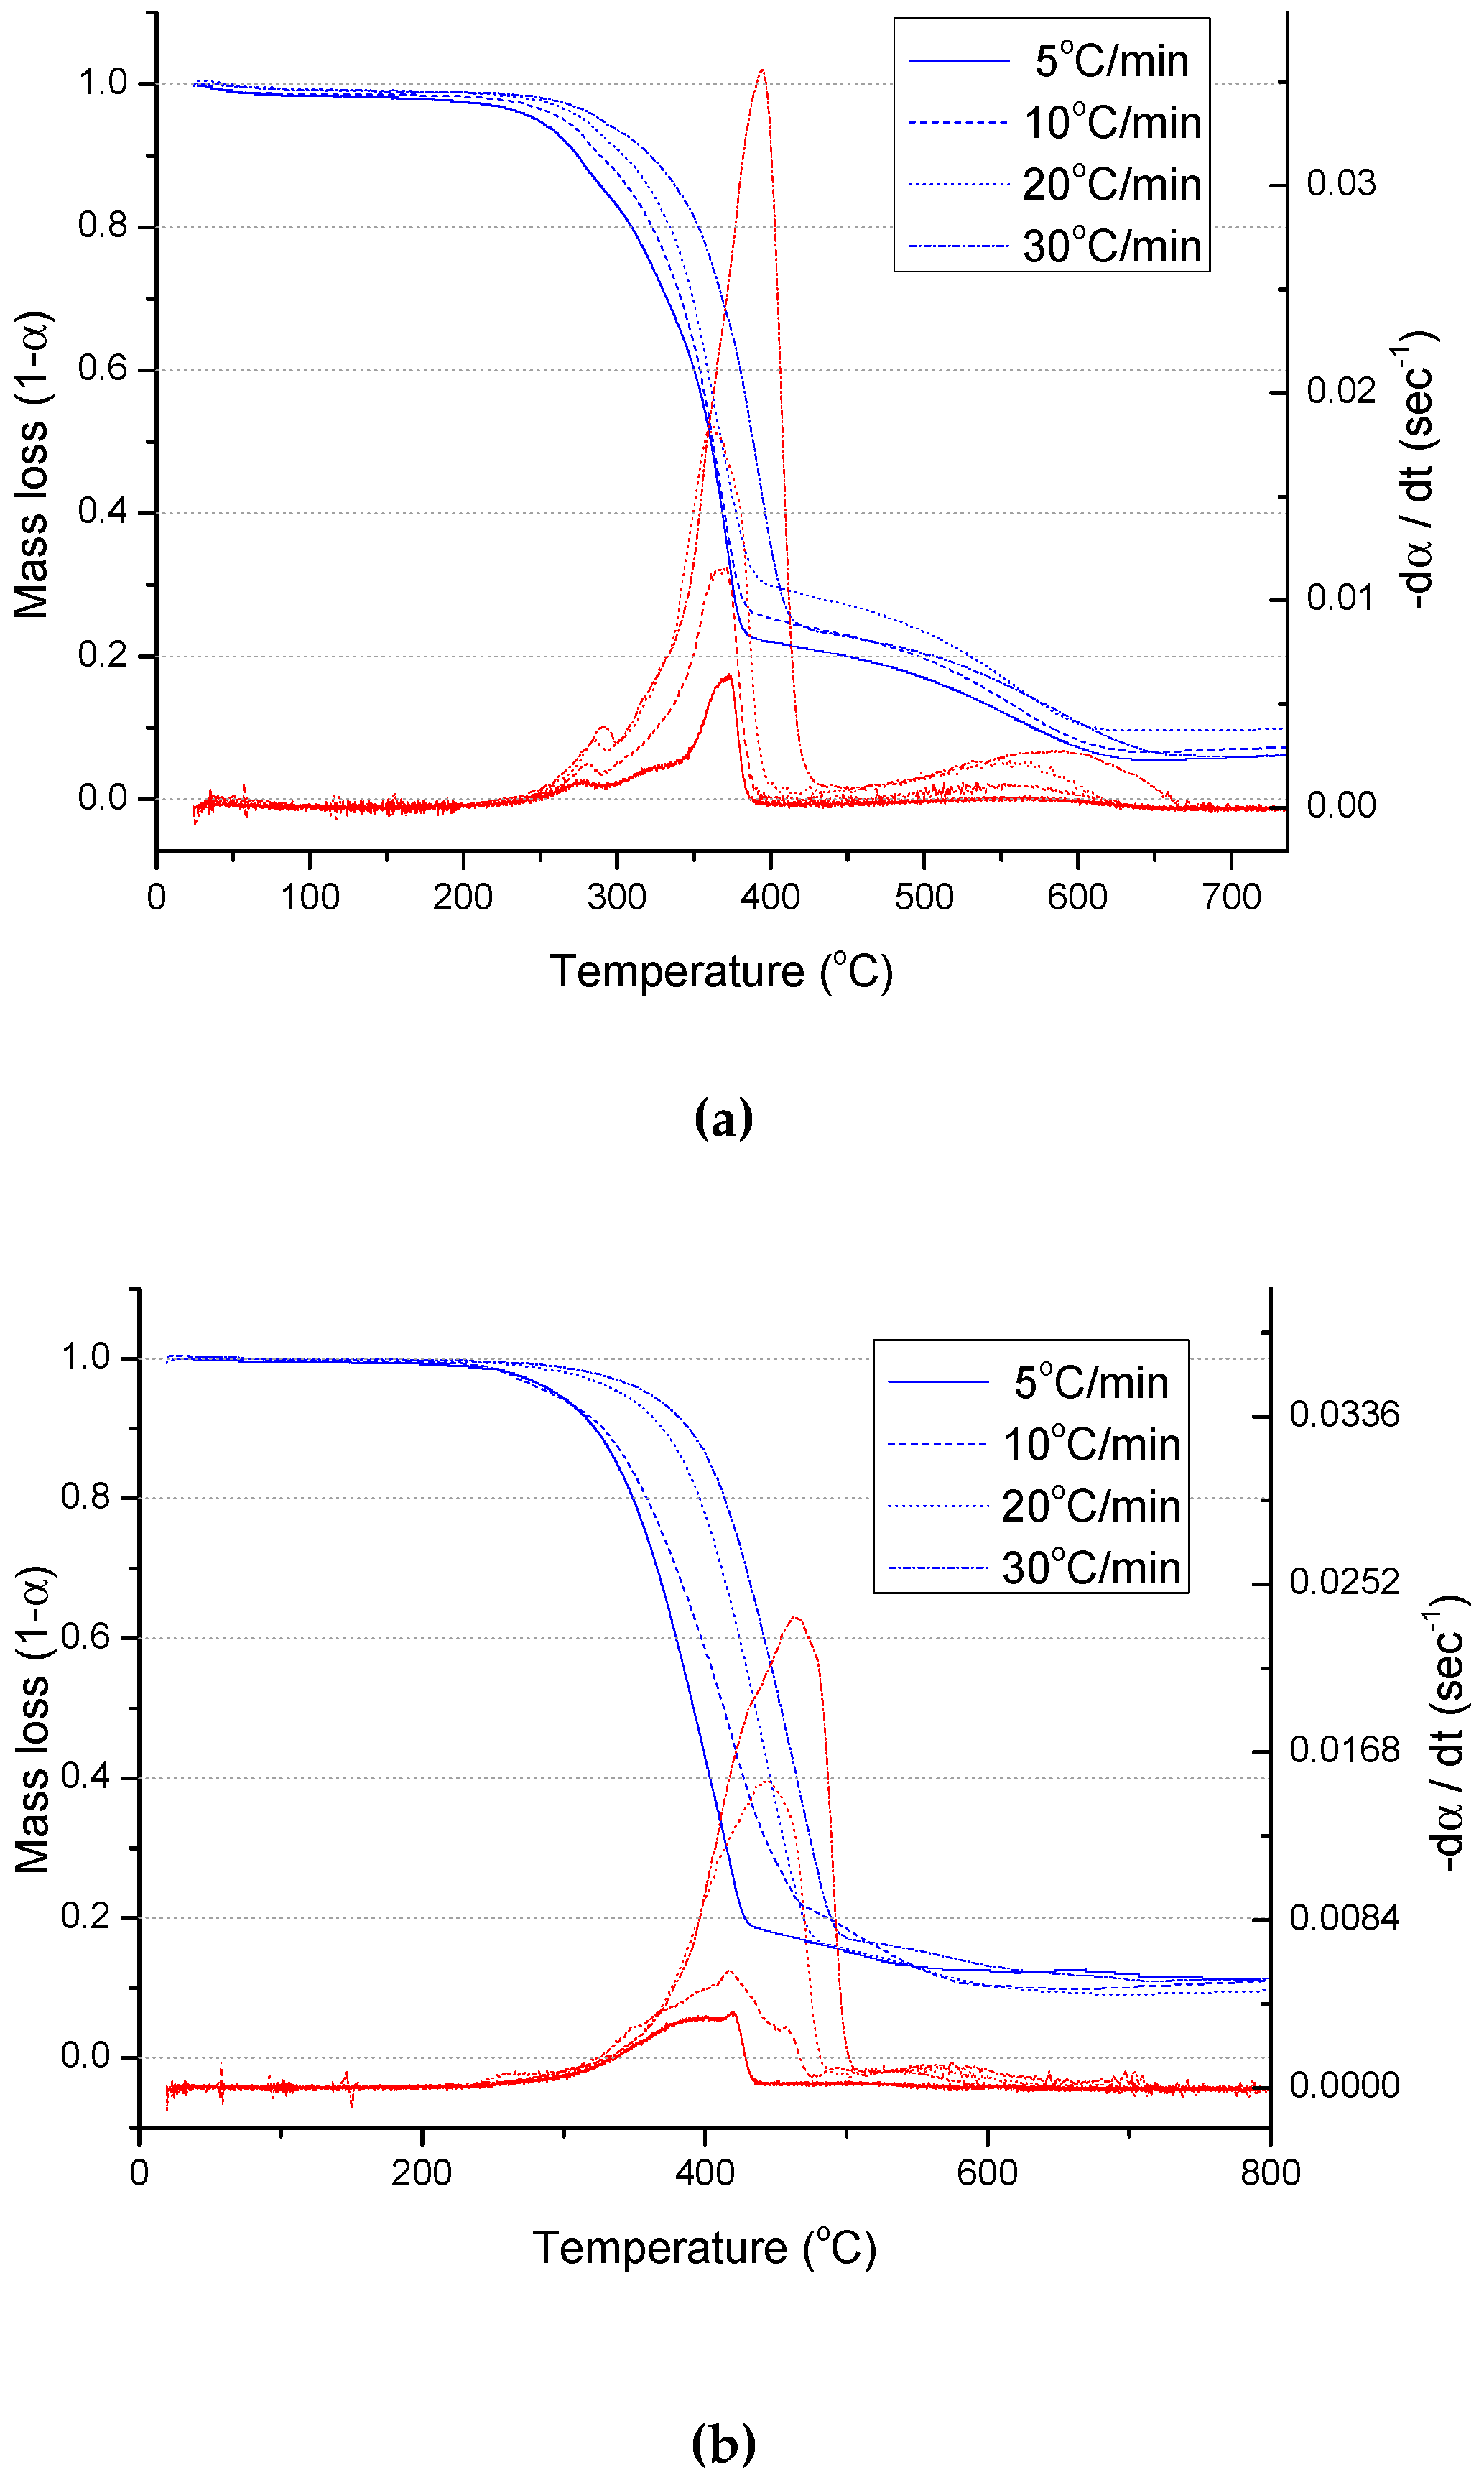
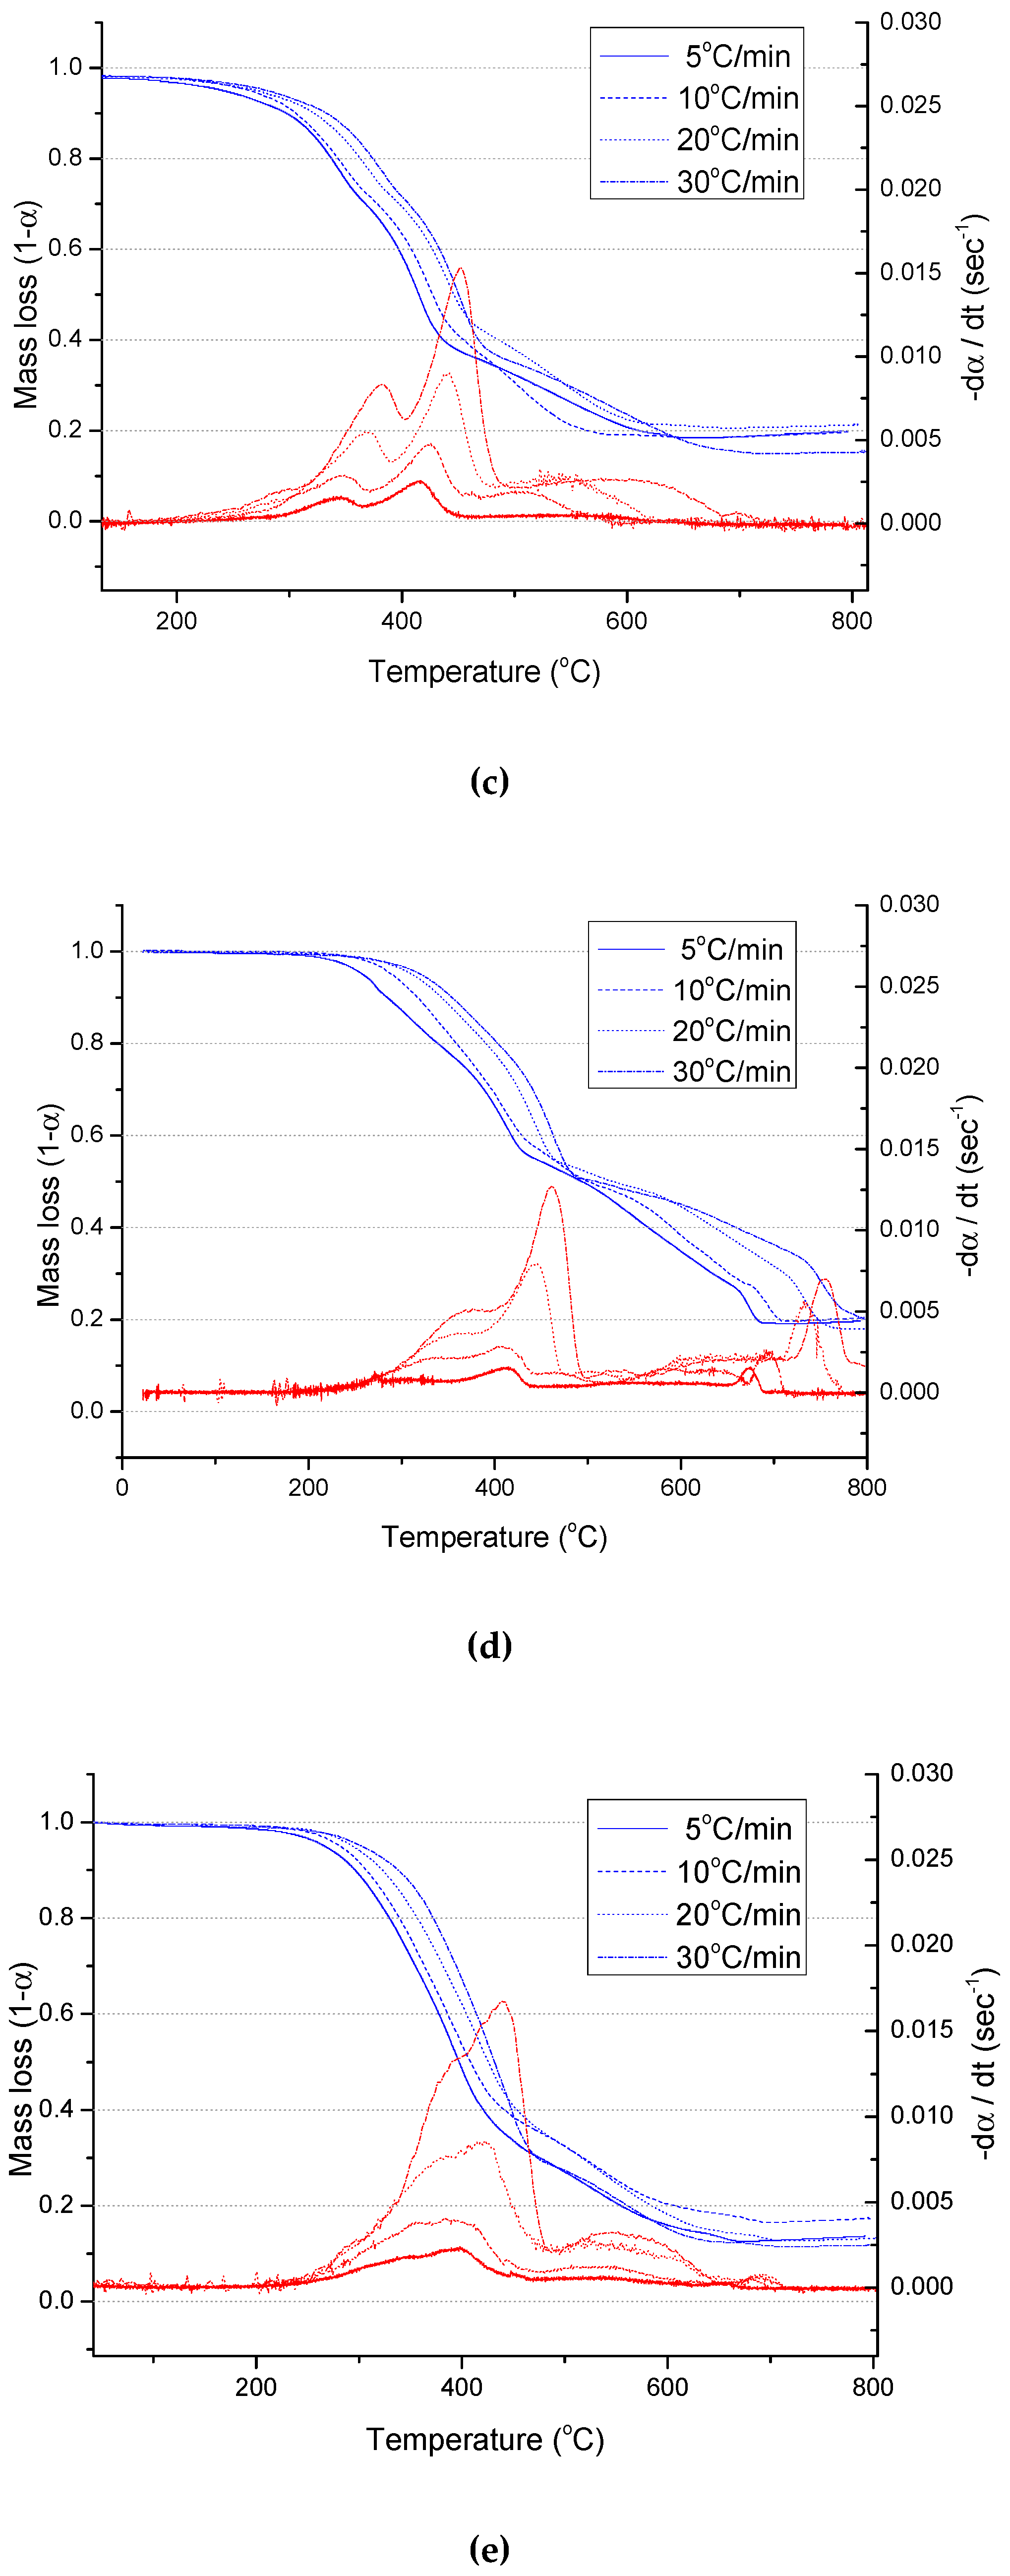
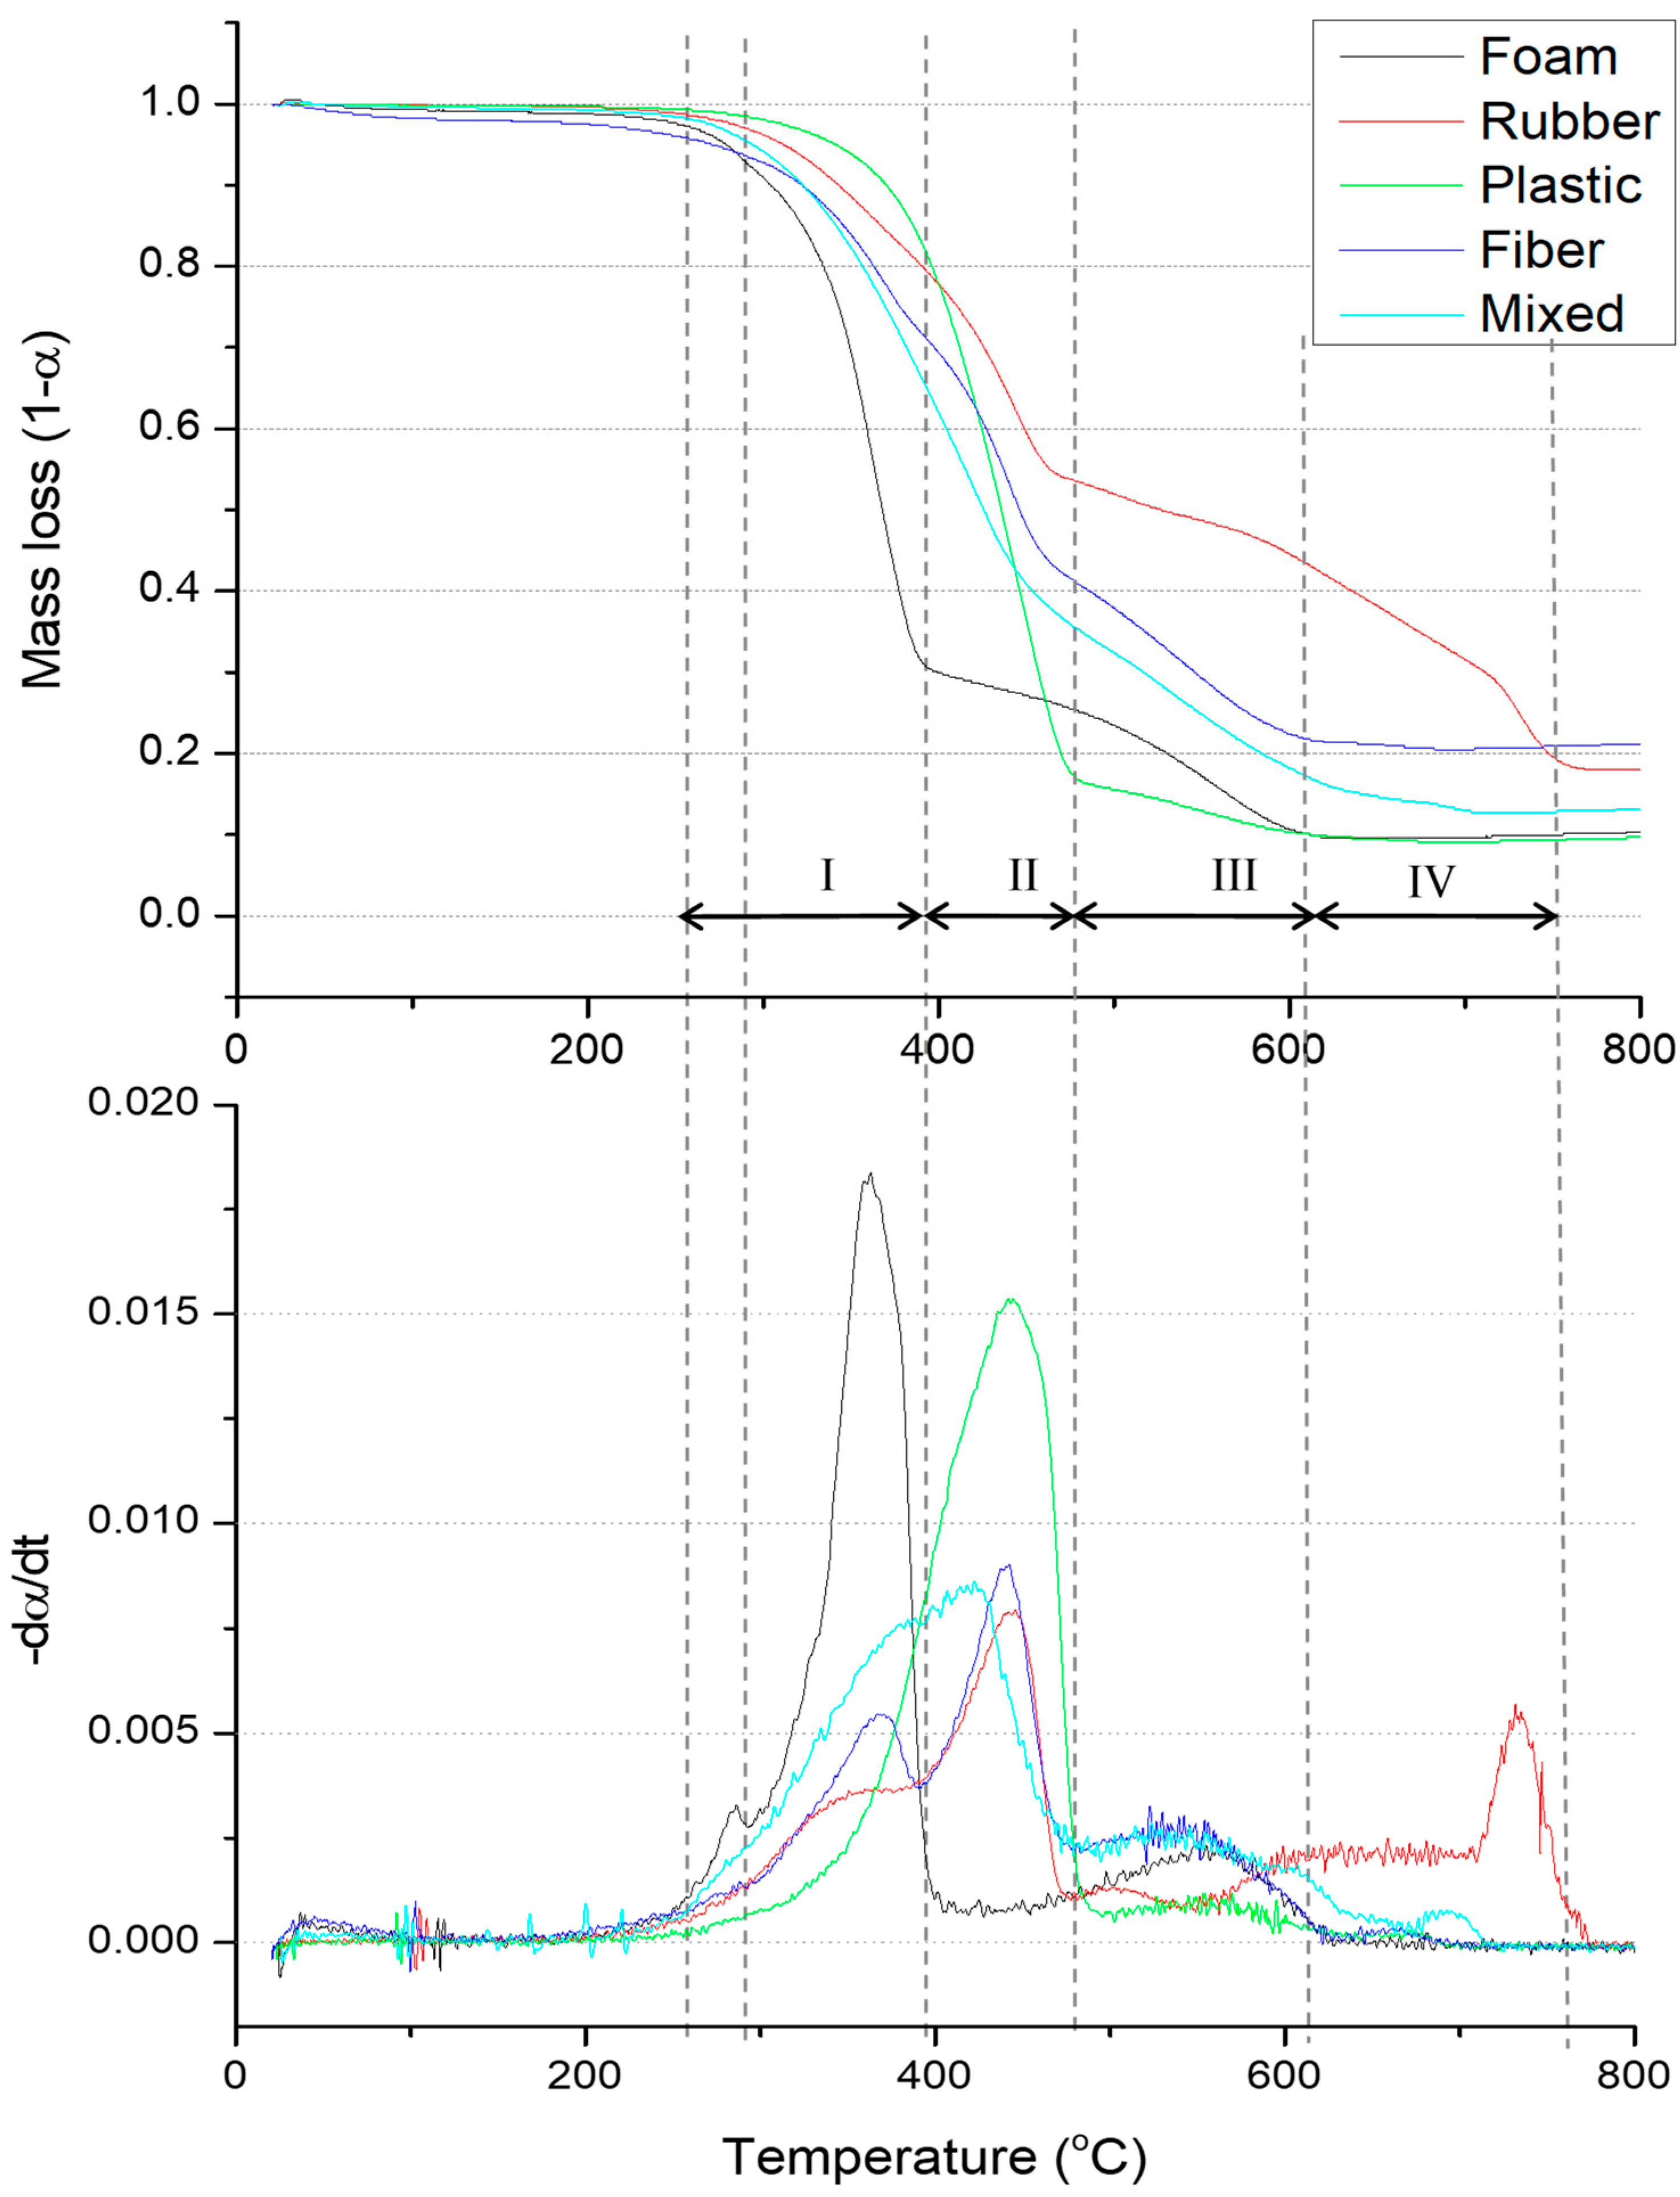
3.1. Physical Analysis and TGA Results
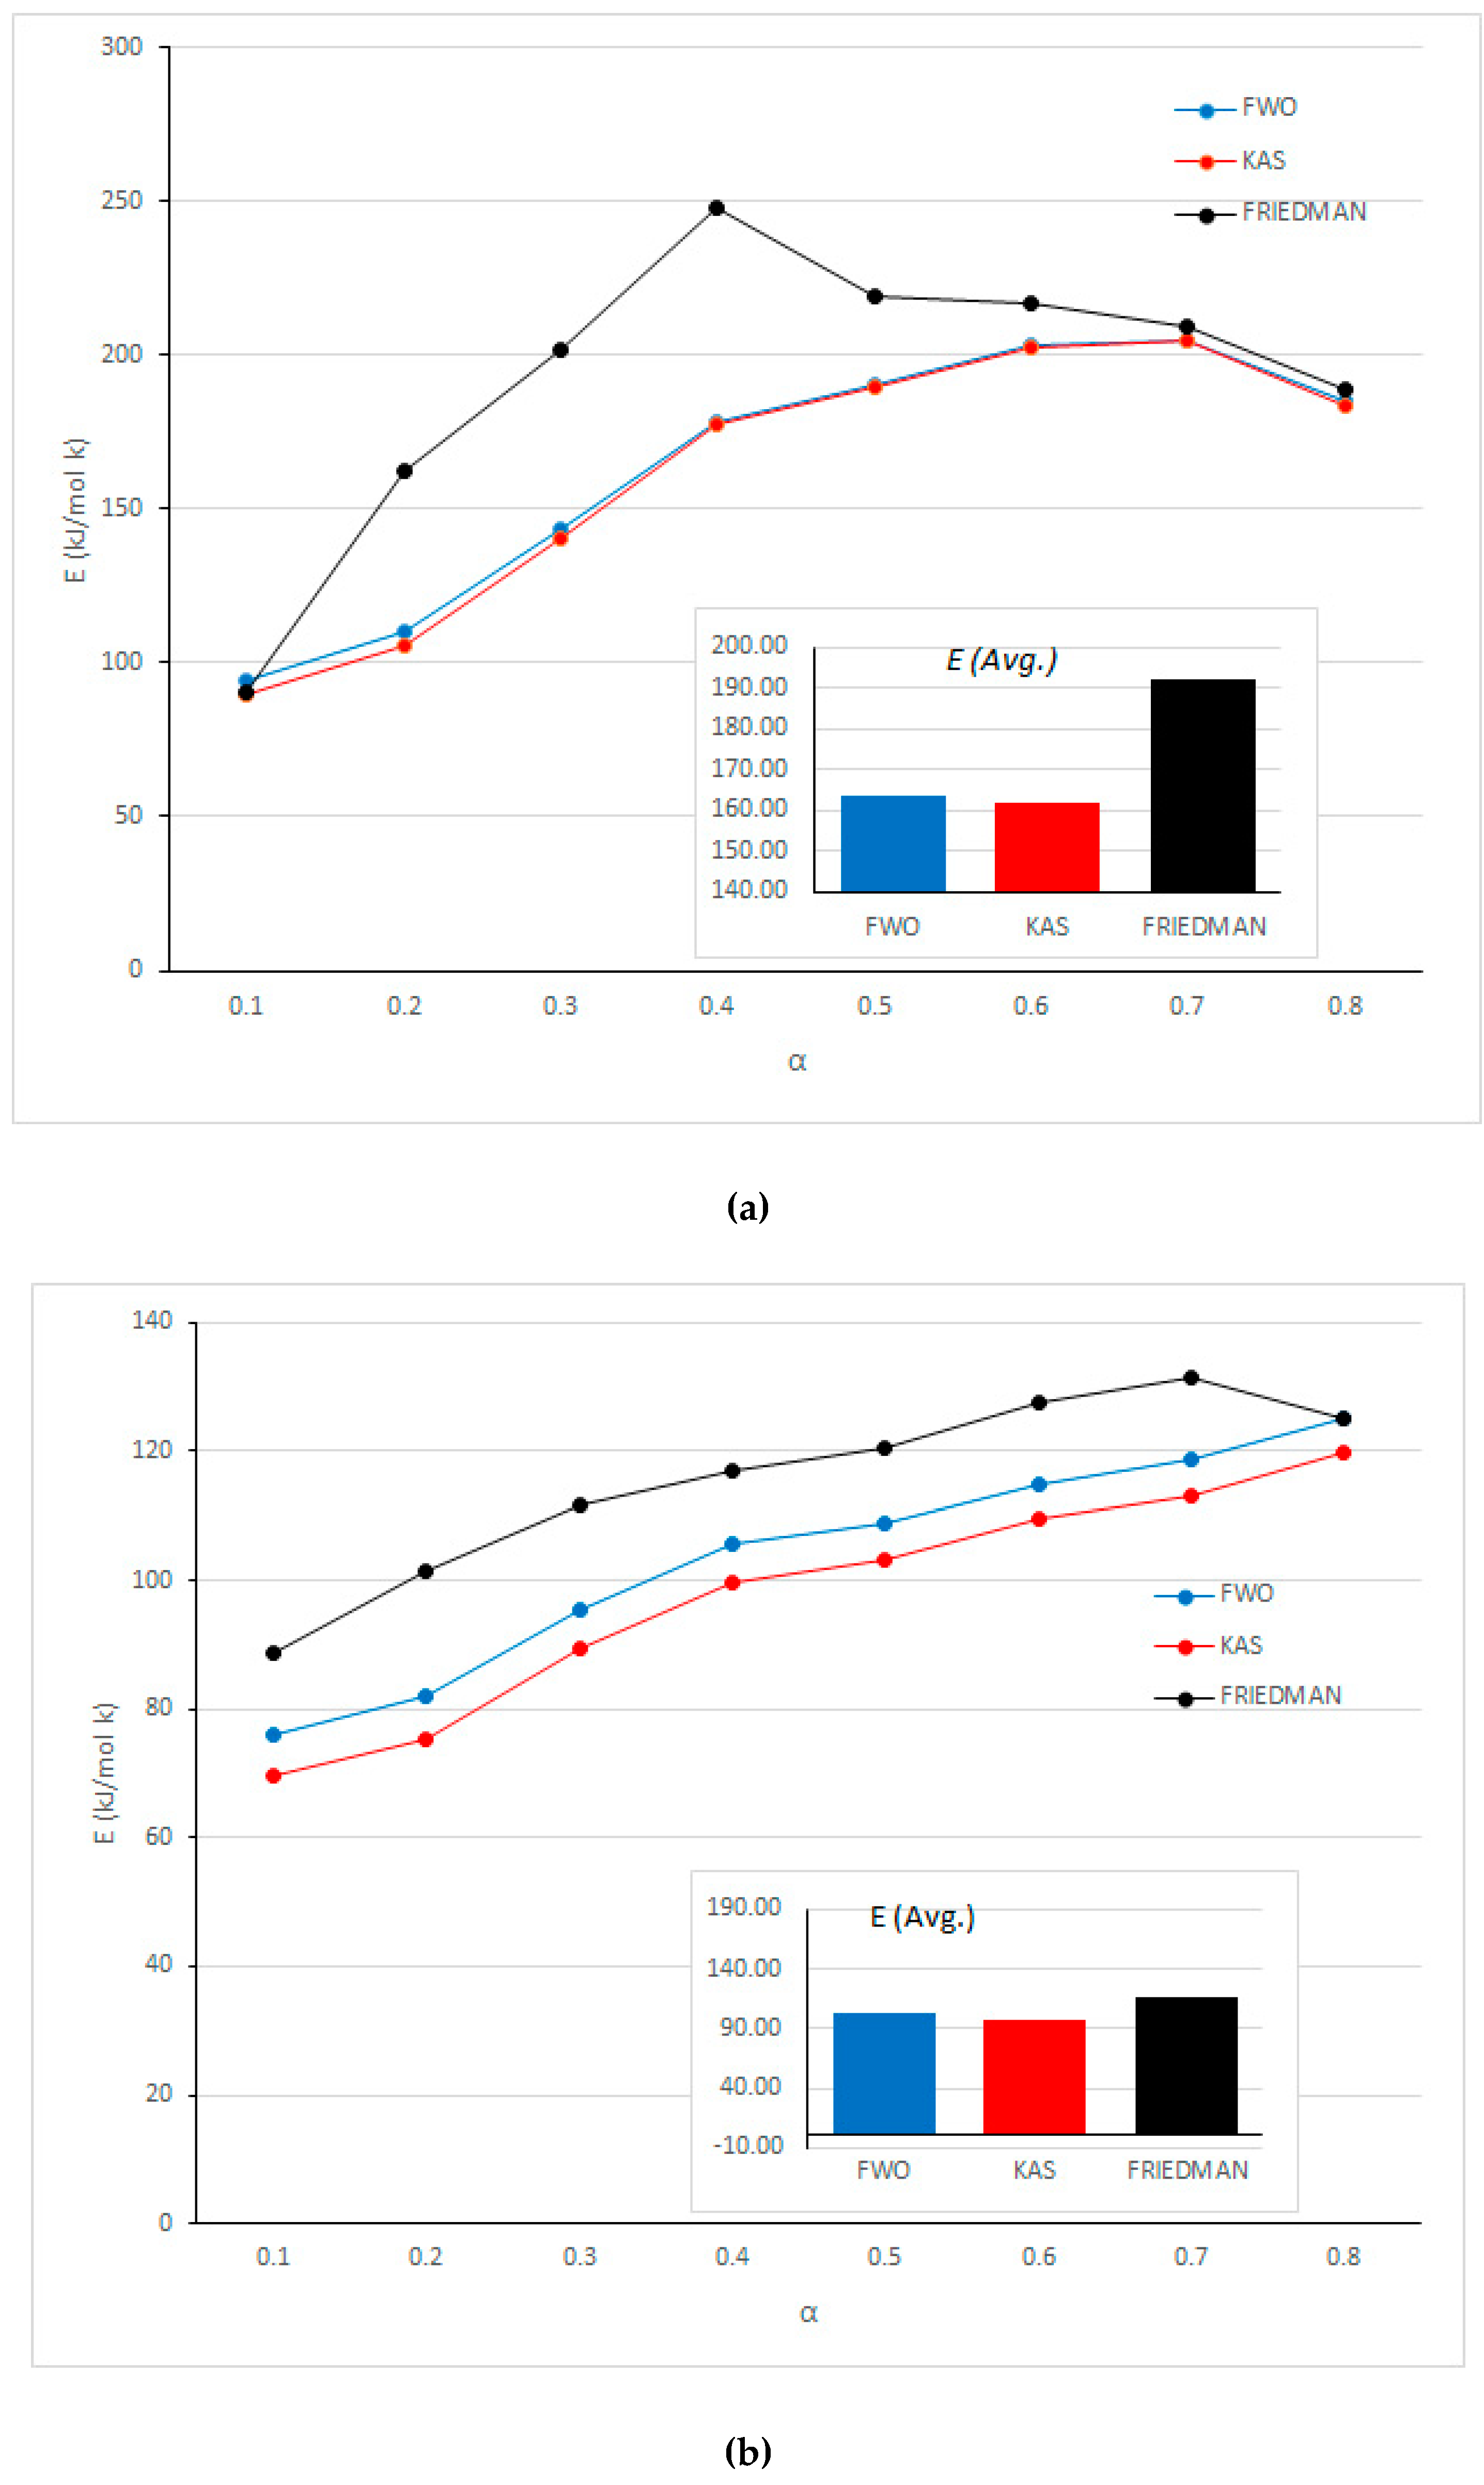
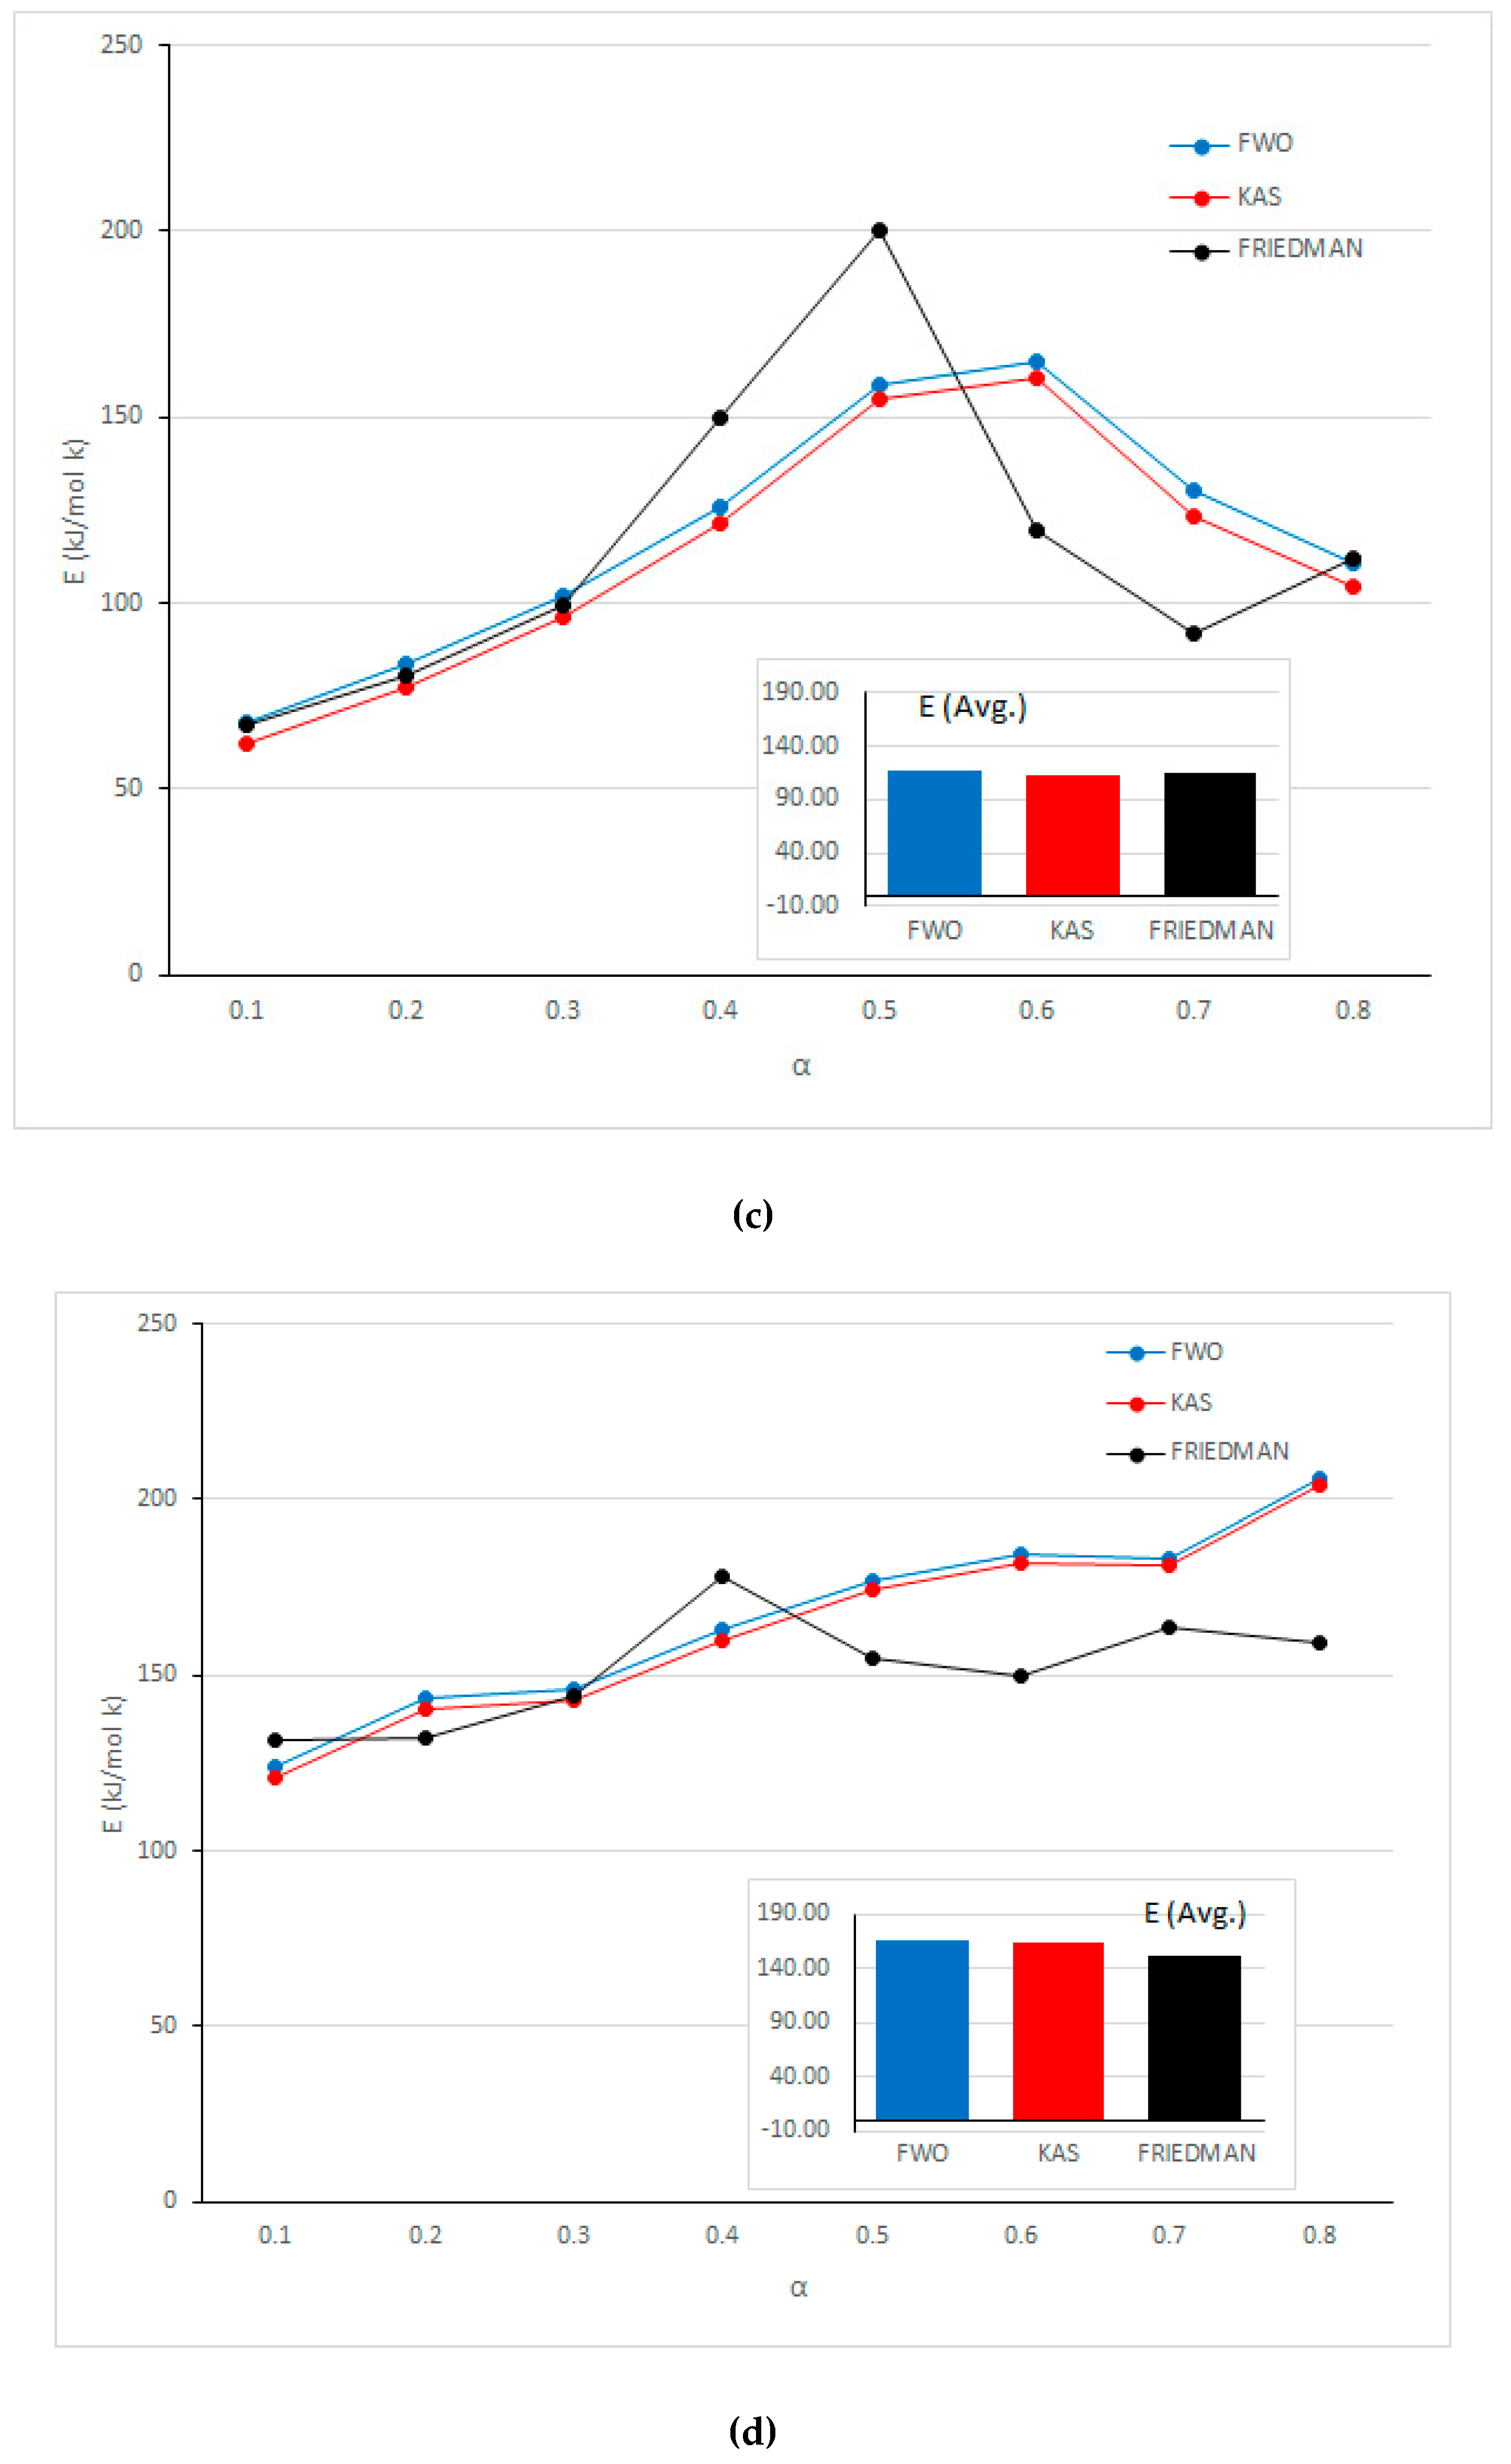
3.2. Kinetic Analysis of ASR Samples Decomposition
4. Conclusions
Author Contributions
Funding
Conflicts of Interest
Nomenclature
| E | Activation Energy | kJ/mol |
| A | Frequency factor | s−1 |
| T | Temperature | K |
| R | Gas Constant | kJ·K/mol |
| X0 | Initial Sample Mass | g |
| Xг | Residual Sample Mass at time г | g |
| Xf | Final Sample Mass | g |
| k | Rate Constant | |
| α | Conversion | |
| β | Heating rate | °C/min |
| t | Time | s |
References
- Korea Ministry of Land, Infrastructure and Transport. Car Registration Status. Available online: http://www.index.go.kr/potal/main/EachDtlPageDetail.do?idx_cd=1257 (accessed on 20 November 2019).
- Korea Auto Dismantlement Recycling Association. Available online: http://kadra.or.kr/kadra/contents/main/main.html (accessed on 20 November 2019).
- Ho-suk, J. Development of Physical Separation System for Resource Recycling of ASR; Korea Ministry of Environment: Sejong City, Korea, 2016.
- Granata, G.; Moscardini, E.; Furlani, G.; Pagnanelli, F.; Toro, L. Automobile shredded residue valorisation by hydrometallurgical metal recovery. J. Hazard. Mater. 2011, 185, 44–48. [Google Scholar] [CrossRef] [PubMed]
- Kuwayama, Y.; Ito, M.; Hiroyoshi, N.; Tsunekawa, M. Jig separation of crushed automobile shredded residue and its evaluation by float and sink analysis. J. Mater. Cycles Waste Manag. 2011, 13, 240–246. [Google Scholar] [CrossRef]
- Di Palma, L.; Medici, F.; Vilardi, G. Artificial aggregate from non-metallic automotive shredder residue. Chem. Eng. Trans. 2015, 43, 1723–1728. [Google Scholar]
- Lee, H.Y.; Oh, J.K. A study on the shredding of end-of-life vehicles and materials separation. Geosyst. Eng. (KSGM) 2003, 6, 100–105. [Google Scholar] [CrossRef]
- Allen, T.; Anew, E. Benefits of holistic shredder residue recovery: Mechanical recycling and energy recovery. In Proceedings of the International Thermal Treatment Technologies (IT3) and Hazardous Waste Combustors (HWC) Joint Conference 2009, Cincinnati, OH, USA, 18–21 May 2009; pp. 484–491. [Google Scholar]
- Ujsághy, Z. Recycling methods of car wreck residues. In Proceedings of the Mini Conference on Vehicle System Dynamics, Identification and Anomalies; Technical University of Budapest: Budapest, Hungary, 2008; pp. 483–489. [Google Scholar]
- Bezergianni, S.; Dimitriadis, A.; Faussone, G.C.; Karonis, D. Alternative diesel from waste plastics. Energies 2017, 10, 1750. [Google Scholar] [CrossRef]
- Zolezzi, M.; Nicolella, C.; Ferrara, S.; Iacobucci, C.; Rovatti, M. Conventional and fast pyrolysis of automobile shredder residues (ASR). Waste Manag. 2004, 24, 691–699. [Google Scholar] [CrossRef]
- Tomita, Y.; Takasuka, G.; Sugimoto, T.; Itaya, M. Treatment of Automobile Shredded Residue by Kiln-type Pyrolysis and Melting Process. Proc. Symp. Environ. Eng. 2001, 11, 246–249. [Google Scholar] [CrossRef]
- Roh, S.A.; Kim, W.H.; Yun, J.H.; Min, T.J.; Kwak, Y.H.; Seo, Y.C. Pyrolysis and gasification-melting of automobile shredder residue. J. Air Waste Manag. 2013, 63, 1137–1147. [Google Scholar] [CrossRef]
- Yatsun, A.V.; Konovalov, N.P.; Efimenko, I.S. Liquid products of the microwave pyrolysis of scrap tires. Solid Fuel Chem. 2013, 47, 252–254. [Google Scholar] [CrossRef]
- Day, M.; Cooney, D.; Mackinnon, M. Degradation of contaminated plastics: A kinetic study. Polyim. Degrad. Stab. 1995, 48, 341–349. [Google Scholar] [CrossRef]
- Donaji, P.; Yang, W.; Blasiak, W. Kinetic study of decomposition of ASR residues after pyrolysis in inert and oxidative atmospheres. In Proceedings of the International Thermal Treatment Technologies (IT3) & Hazardous Waste Combustors (HWC) Joint Conference 2009, Cincinnati, OH, USA, 18–21 May 2009; pp. 465–483. [Google Scholar]
- Haydary, J.; Susa, D.; Gelinger, V.; Čacho, F. Pyrolysis of automobile shredder residue in a laboratory scale screw type reactor. J. Environ. Chem. Eng. 2016, 4, 965–972. [Google Scholar] [CrossRef]
- Mayyas, M.; Pahlevani, F.; Handoko, W.; Sahajwalla, V. Preliminary investigation on the thermal conversion of automotive shredder residue into value-added products: Graphitic carbon and nano-ceramics. Waste Manag. 2016, 50, 173–183. [Google Scholar] [CrossRef]
- Srogi, K. An overview of current processes for the thermochemical treatment of automobile shredder residue. Clean Technol. Environ. 2008, 10, 235–244. [Google Scholar] [CrossRef]
- Sun, J.; Wang, W.; Liu, Z.; Ma, Q.; Zhao, C.; Ma, C. Kinetic study of the pyrolysis of waste printed circuit boards subject to conventional and microwave heating. Energies 2012, 5, 3295–3306. [Google Scholar] [CrossRef]
- Sørum, L.; Gronli, M.G.; Hustad, J.E. Pyrolysis characteristics and kinetics of municipal solid wastes. Fuel 2001, 80, 1217–1227. [Google Scholar] [CrossRef]
- Mohammed, I.Y.; Abakr, Y.A.; Kazi, F.K.; Yusup, S.; Alshareef, I.; Chin, S.A. Comprehensive characterization of Napier grass as a feedstock for thermochemical conversion. Energies 2015, 8, 3403–3417. [Google Scholar] [CrossRef]
- Vyazovkin, S.; Wight, C. Model-free and model-fitting approaches to kinetic analysis of isothermal and non-isothermal data. Thermochim. Acta 1999, 340–341, 53–68. [Google Scholar] [CrossRef]
- Friedman, H.L. Kinetics of thermal degradation of char-forming plastics from thermogravimetry. Application to a phenolic plastic. J. Polym. Sci. Polym. Symp. 2007, 6, 183–195. [Google Scholar] [CrossRef]
- Ozawa, T. A New Method of Analyzing Thermogravimetric Data. Bull. Chem. Soc. Jpn. 1965, 38, 1881–1886. [Google Scholar] [CrossRef]
- Doyle, C.D. Kinetic analysis of thermogravimetric data. J. Appl. Polym. 1961, 5, 285–292. [Google Scholar] [CrossRef]
- Apaydin, V.E.; Polat, S.; Putun, A.E. Pyrolysis kinetics and thermal decomposition behavior of polycarbonate—A TGA—FTIR study. Therm. Sci. 2014, 18, 833–842. [Google Scholar] [CrossRef]
- Kissinger, H.E. Reaction Kinetics in Differential Thermal Analysis. Anal. Chem. 1957, 29, 1702–1706. [Google Scholar] [CrossRef]
- Milos, R.; Martina, B.; Vladimir, J.; Dragoslava, S.; Nebojsa, M. Thermogravimetric kinetic study of solid recovered fuels pyrolysis. Hem. Ind. 2018, 72, 99–106. [Google Scholar]
- Joung, H.T.; Seo, Y.C.; Kim, K.H.; Hong, J.H.; Yoo, T.W. Distribution and characteristics of pyrolysis products from automobile shredder residue using an experimental semi-batch reactor. Korean J. Chem. Eng. 2007, 24, 996–1002. [Google Scholar] [CrossRef]
- Chao-Hsiung, W. On the thermal treatment of plastic mixtures of MSW: Pyrolysis kinetics. Waste Manag. 1993, 13, 221–235. [Google Scholar] [CrossRef]
- Park, P.M.; Yeo, S.G.; Hyun, S.M.; Yoon, J.R.; Dong, J.I. Thermogravimetric analysis and kinetic studies of biomass mixed with waste plastic. J. Korea Soc. Waste Manag. 2018, 35, 72–83. [Google Scholar] [CrossRef]


| Physical Properties (Dry Basis) | Mixed ASR | Sponge Foam | Plastic | Fiber | Rubber | |
|---|---|---|---|---|---|---|
| Volatile (wt.%) | 79.16 | 83.09 | 90.52 | 70.61 | 62.03 | |
| Fixed carbon (wt.%) | 7.94 | 6.36 | 0.96 | 10.40 | 20.09 | |
| Ash (wt.%) | 12.90 | 9.93 | 8.51 | 18.05 | 17.86 | |
| Element (wt.%) | C | 63.05 | 60.3 | 75.6 | 49.46 | 67.05 |
| H | 8.21 | 7.93 | 10.34 | 5.00 | 7.09 | |
| O1 | 13.58 | 17.16 | 4.3 | 25.85 | 6.94 | |
| N | 1.87 | 4.31 | 0.97 | 1.31 | 0.52 | |
| S | 0.08 | 0.04 | 0.08 | 0.11 | 0.19 | |
| Cl | 0.31 | 0.33 | 0.20 | 0.22 | 0.35 | |
| HHV (cal/g) | 6970 | 6680 | 8930 | 5110 | 7230 |
| Conversion Ratio | Friedman Approach | KAS Approach | FWO Approach | ||||
|---|---|---|---|---|---|---|---|
| r2 | E(kJ/mol) | r2 | E(kJ/mol) | r2 | E(kJ/mol) | ||
| Sponge foam | 0.1 | 0.98 | 90.10 | 0.93 | 89.92 | 0.95 | 94.47 |
| 0.2 | 0.95 | 162.34 | 0.95 | 105.89 | 0.96 | 110.14 | |
| 0.3 | 0.88 | 201.65 | 0.86 | 140.70 | 0.88 | 143.54 | |
| 0.4 | 0.80 | 247.58 | 0.88 | 177.15 | 0.89 | 178.41 | |
| 0.5 | 0.72 | 218.79 | 0.75 | 189.52 | 0.77 | 190.34 | |
| 0.6 | 0.83 | 216.70 | 0.79 | 202.70 | 0.81 | 202.98 | |
| 0.7 | 0.95 | 209.12 | 0.86 | 204.40 | 0.87 | 204.70 | |
| 0.8 | 0.90 | 188.62 | 0.95 | 183.64 | 0.96 | 185.10 | |
| Average | 192.32 | 161.74 | 163.71 | ||||
| Plastic | 0.1 | 0.98 | 88.72 | 0.87 | 69.58 | 0.90 | 75.98 |
| 0.2 | 0.99 | 101.55 | 0.91 | 75.34 | 0.93 | 81.88 | |
| 0.3 | 0.99 | 111.82 | 0.97 | 89.32 | 0.98 | 95.41 | |
| 0.4 | 0.99 | 116.83 | 1.00 | 99.84 | 0.99 | 105.60 | |
| 0.5 | 0.95 | 120.55 | 0.99 | 103.22 | 0.99 | 108.99 | |
| 0.6 | 0.98 | 127.46 | 0.99 | 109.40 | 0.99 | 115.03 | |
| 0.7 | 0.98 | 131.33 | 0.99 | 113.06 | 0.99 | 118.67 | |
| 0.8 | 0.98 | 124.99 | 0.99 | 119.65 | 0.99 | 125.10 | |
| Average | 115.41 | 97.43 | 103.33 | ||||
| Rubber | 0.1 | 0.98 | 67.46 | 0.97 | 61.95 | 0.98 | 68.05 |
| 0.2 | 0.99 | 80.45 | 1.00 | 77.45 | 0.99 | 83.62 | |
| 0.3 | 0.98 | 99.53 | 0.98 | 96.11 | 0.99 | 101.82 | |
| 0.4 | 0.97 | 149.87 | 0.96 | 121.17 | 0.97 | 126.11 | |
| 0.5 | 0.99 | 200.14 | 0.96 | 155.12 | 0.96 | 158.71 | |
| 0.6 | 0.94 | 119.33 | 0.99 | 160.65 | 0.99 | 164.90 | |
| 0.7 | 0.87 | 91.55 | 0.99 | 123.21 | 0.99 | 130.51 | |
| 0.8 | 0.96 | 111.79 | 0.96 | 104.43 | 0.97 | 110.74 | |
| Average | 115.02 | 112.51 | 118.06 | ||||
| Fiber | 0.1 | 0.98 | 131.42 | 0.99 | 120.67 | 0.99 | 123.71 |
| 0.2 | 0.97 | 132.20 | 0.95 | 140.51 | 0.95 | 143.29 | |
| 0.3 | 0.99 | 144.26 | 0.97 | 143.07 | 0.97 | 146.10 | |
| 0.4 | 0.98 | 177.89 | 0.96 | 160.20 | 0.97 | 162.82 | |
| 0.5 | 0.99 | 155.04 | 0.96 | 174.57 | 0.97 | 176.80 | |
| 0.6 | 0.99 | 149.65 | 0.97 | 182.29 | 0.98 | 184.38 | |
| 0.7 | 0.91 | 163.77 | 0.99 | 181.13 | 0.99 | 183.52 | |
| 0.8 | 0.73 | 159.40 | 0.89 | 204.35 | 0.90 | 206.22 | |
| Average | 151.70 | 163.35 | 165.86 | ||||
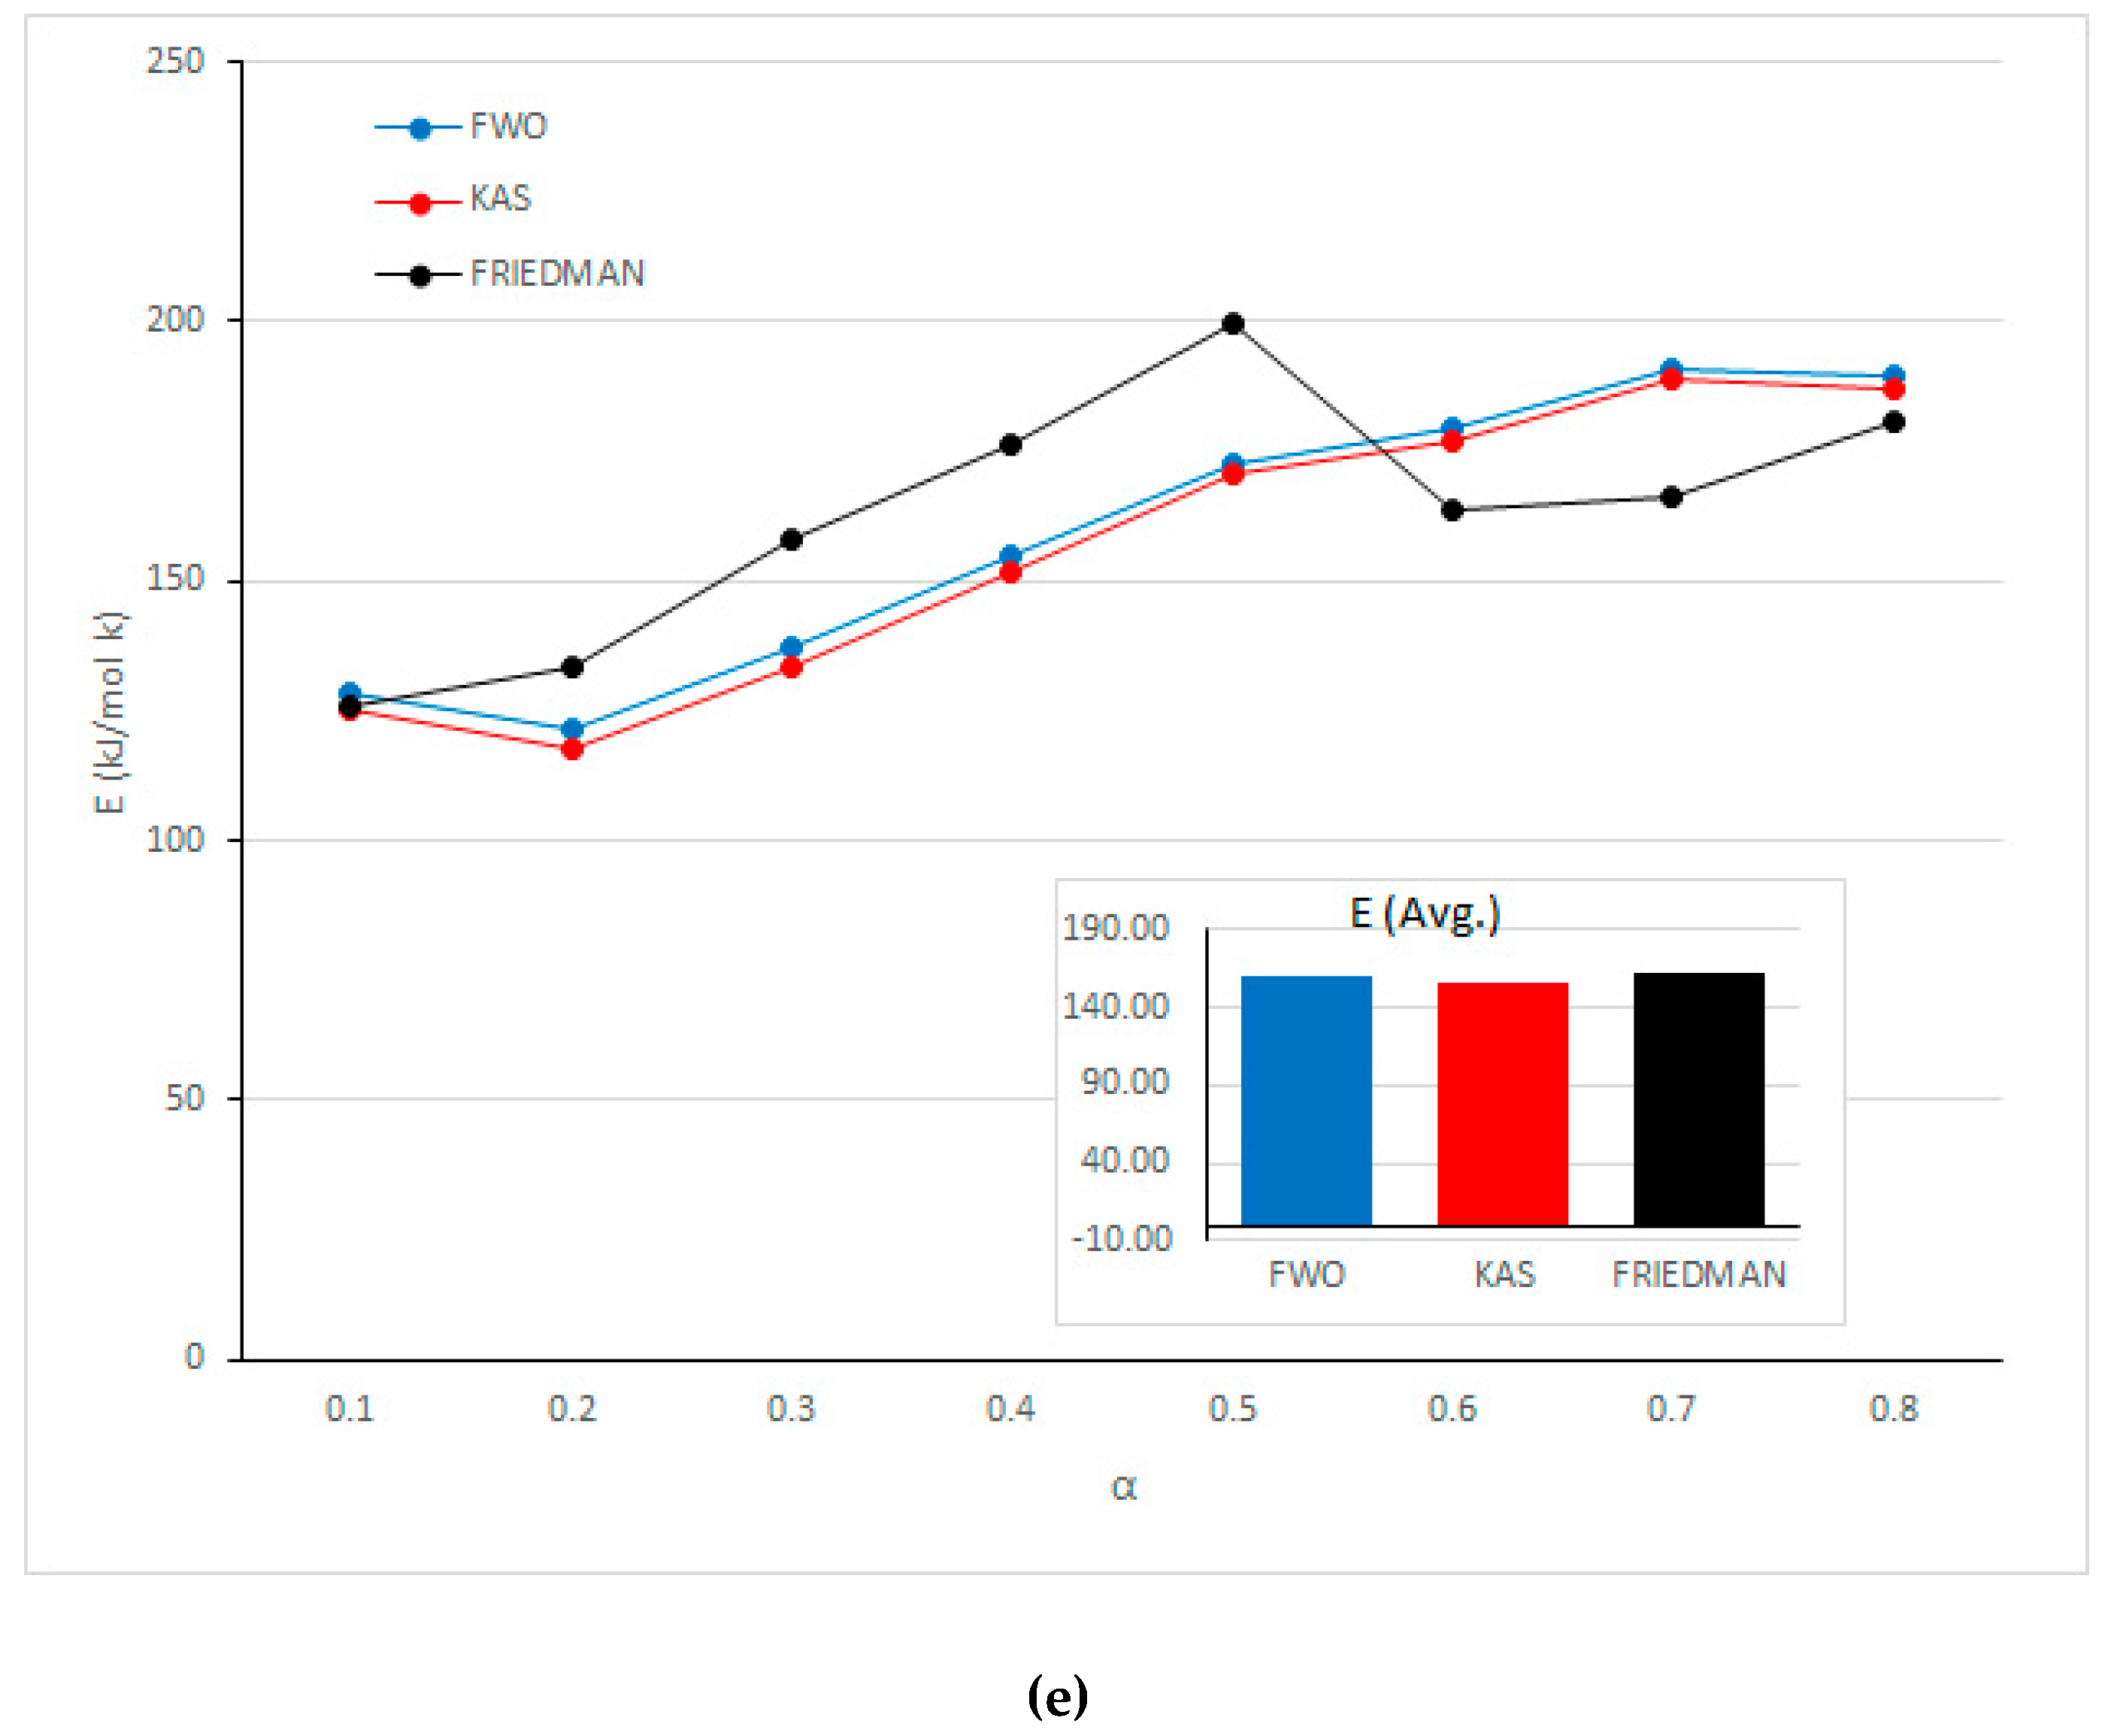
| Mixed samples | 0.1 | 0.96 | 125.75 | 0.97 | 125.10 | 0.97 | 128.08 |
| 0.2 | 0.96 | 133.53 | 0.94 | 117.49 | 0.95 | 121.40 | |
| 0.3 | 0.98 | 158.22 | 0.96 | 133.48 | 0.96 | 136.95 | |
| 0.4 | 0.97 | 176.37 | 0.96 | 151.90 | 0.96 | 154.77 | |
| 0.5 | 0.99 | 199.61 | 0.97 | 170.44 | 0.97 | 172.67 | |
| 0.6 | 0.99 | 163.79 | 0.98 | 177.10 | 0.99 | 179.24 | |
| 0.7 | 0.89 | 166.13 | 1.00 | 189.05 | 0.99 | 190.93 | |
| 0.8 | 0.97 | 180.70 | 0.96 | 187.07 | 0.96 | 189.73 | |
| Average | 163.01 | 156.45 | 159.22 | ||||
© 2020 by the authors. Licensee MDPI, Basel, Switzerland. This article is an open access article distributed under the terms and conditions of the Creative Commons Attribution (CC BY) license (http://creativecommons.org/licenses/by/4.0/).
Share and Cite
Han, S.; Jang, Y.-C.; Choi, Y.-S.; Choi, S.-K. Thermogravimetric Kinetic Study of Automobile Shredder Residue (ASR) Pyrolysis. Energies 2020, 13, 1451. https://doi.org/10.3390/en13061451
Han S, Jang Y-C, Choi Y-S, Choi S-K. Thermogravimetric Kinetic Study of Automobile Shredder Residue (ASR) Pyrolysis. Energies. 2020; 13(6):1451. https://doi.org/10.3390/en13061451
Chicago/Turabian StyleHan, Soyoung, Yong-Chul Jang, Yeon-Seok Choi, and Sang-Kyu Choi. 2020. "Thermogravimetric Kinetic Study of Automobile Shredder Residue (ASR) Pyrolysis" Energies 13, no. 6: 1451. https://doi.org/10.3390/en13061451
APA StyleHan, S., Jang, Y.-C., Choi, Y.-S., & Choi, S.-K. (2020). Thermogravimetric Kinetic Study of Automobile Shredder Residue (ASR) Pyrolysis. Energies, 13(6), 1451. https://doi.org/10.3390/en13061451