Abstract
Infrared Thermography has been used as a tool for predictive and preventive maintenance of Photovoltaic panels. International Electrotechnical Commission provides some guidelines for using thermography to detect defects in Photovoltaic panels. However, the proposed guidelines focus only on the location of the hot spot than diagnosing the types of faults. The long-term reliability and efficiency of panels can be affected by progressive defects such as discolouring and delamination. This paper proposed the new Thermal Pixel Counting algorithm to detect the above faults based on three thermal profile index values. The real-time experimental testing was carried out using FLIR T420bx® thermal imager and results have been provided to validate the proposed method. In this work, the fuzzy rule-based classification system is proposed to automate the classification process. Fuzzy reasoning method based on a single winner rule fuzzy classifier is designed with modified rule weights by particular grade. The performance of the proposed classifier is compared with the conventional fuzzy classifier and neural network model.
1. Introduction
A Photovoltaic (PV) panel defects reduce the panel power and long-term reliability that is not recovered during regular operation. The defects may be initiated during the manufacturing process, transportation, installation and real operating environmental condition [1]. As long as the defect is not much relevant to safety issues and power degradation, that defect is not considered as a failure or series defect. The investment cost of PV based power generation system is high, and it is payback time mainly depends on electrical performance and panels operating lifetime. The major PV panel defects are delamination, Ethylene Vinyl Acetate (EVA) discoloring and cell part isolation due to cell cracks. These defects will initiate safety issues, reliability problems and power loss in the power system (~15%) [2,3]. Condition monitoring methods are developed to detect such issues for increasing the lifetime of the PV panel [4].
Commonly Current-Voltage (I-V) characteristics measurement is used for faults diagnosis on solar PV panels. Nevertheless, it is a time-consuming process as well as inability to classify the defects such as delamination, EVA discolouring and cell part isolation due to cell cracks. Ref. [5] provides a comprehensive literature review report of faults detection methods developed in the earlier research work.
Infrared Thermography (IRT) usages in preventive maintenance and condition monitoring of electrical types of equipment are increased in recent years due to its user-friendly operation and accuracy in fault diagnosis with an exact spot. Ref. [6] reviewed the IRT image-based fault detection methods used for electrical apparatus maintenances, with thermal image measurement technique and its features extraction, the impact of environmental factors and real-time operating conditions in image measurement. Operating temperature of PV panels/cells creates a negative effect on the power efficiency of the panel, and it is considered as an essential reference value for detecting the hot spot location of the panel. Ref. [7,8] provide the current and voltage based faulty indicator to detect the faults in the PV system. [9] heightened the value of the mounting variable of commercial-grade PV panel used in a building-integrated PV system for operating with its designed efficiency.
Electroluminescent (EL) method is used for diagnosing the solar PV modules and strings as a non-invasive method; it can be effectively used for diagnosing the cell cracks and shunt fault, inactive modules with reasonable accuracy. However, it is inefficient for detecting progressive faults such as discolouring, delamination and optical degradation. IRT imaging technique can be used as non-destructive testing for inspecting the PV panels working conditions, and it has many advantages over EL imaging [10]. A hot-spot appears in PV panels due to imbalance current between the affected cell and healthy cell, and it will increase the reverse biasing, thus dissipating power as heat. Hot spot inspection is a well-known procedure for diagnosing the faults in the PV panels. The temperature difference index values for non-defective, defective and defective with power losses PV panels were reported in Ref. [11]. However, these index values mainly depend on the operating conditions such as climatic irradiation values, and there are no temperature index values derived for progressive defects classification.
Thermal image pre-processing provides the preliminary inputs for assessing the condition of the panels. The line profile analysis and image histogram analysis method has been implemented in a condition monitoring system of PV panels [12]. In Ref. [13] different PV modules have studied the reliability of the IR imaging technique with different defects such as cell fracture, deficient solder joints, short-circuited cells and bypassed substring. The interrelationship between the junction and surface temperature of the PV panel has been measured for improving the measurement accuracy of the IR image [14]. The relationship between the I-V characteristics and thermal image of PV panels under healthy, miner fault, massive fault, open circuit and short circuit fault conditions are presented in [15]. Thermal mapping with defects characterization and classification has been reported in [16,17]. Canny edge detection algorithm [18,19] and digital colour conversion algorithm [20,21] have been successfully implanted for identifying the hot spot regions and defects of the PV panels. Tsanakas [22] has developed a new thermal image characterization algorithm based on aerial triangulation and terrestrial georeferencing of thermal images. Vergura [23] has developed a new algorithm for quantifying thermal image features via computer-aided thermography for diagnosing PV panel defects.
The available literature work does not provide a solution to detect and distinguish progressive faults such as discolouring, delamination and optical degradation. Therefore, this paper provides a digital thermal image pixel counting technique with fuzzy classifier for diagnosing and distinguishing the EVA discolouring and delamination defects of PV panels. The proposed diagnosis technique is developed based on the method have been proposed in [24] for faults classification of induction motor. This algorithm can be easily implantable in the digital processor, which is used in automated condition monitoring and defect diagnosis system.
This research work mainly investigates the real-time surface faults occur in PV panel due to environmental stress and proposed novel diagnosis solution for the fault’s detection through IR image analysis, and it is required detailed investigation for detecting the internal PV faults such as short circuit string, bypass diode problem, etc.
The fuzzy rule-based classification system is used in many engineering application and pattern classification problems [25,26]. In this work, the fuzzy rule-based classifier is developed, based on the input pattern database collected from the proposed diagnostic algorithm. It is designed for implementation of Internet of Think (IoT) based fault classification system, which requires less calculation time and fast response. Fuzzy rule-based classifier is one of the simple systems for uncertainly condition problems with least calculation memory [27]. The monitoring the complete solar PV panels in one power system involves a high volume of the data, the fuzzy rule-based classifier can handle this kind of high dimensional database and gives the accurate classification results [28].
The paper is structured as follows. A defect in the PV panel is studied in Section 2. In Section 3, the practical testing experimental setup is explained. In Section 4, the proposed digital image temperature pixels analysis algorithm is described. Section 5 presents the experimental testing results and discussion. Section 6 describes the fuzzy classifier system and Section 7 reports the classification performance of the classifier. Finally, the conclusion of this paper is given in Section 8.
2. Defects in PV Panels
The failures of any product can be categorized into three stages such as infant-failure, midlife-failures and wear-out failures. Graphical view of the PV panel failure is shown in Figure 1. In this, EVA discolouring, delamination and cracked cell isolation are considered as progressive faults because it started at an infant stage and progressed beyond the warranty period to reach the wear-out time. Other than these faults, some defects may be happened due to external causes like clamping, transport and installation, connector failure and lightning.
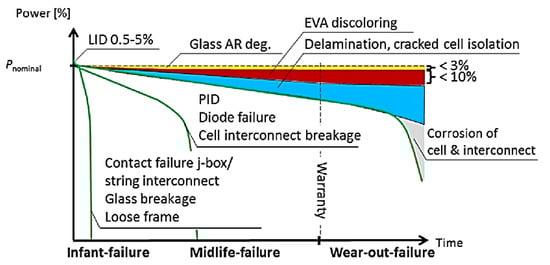
Figure 1.
Power loss due to delamination and corrosion.
In a PV module, EVA guards the solar cells against climate factors such as humidity, UV, pollution and fog. It is essential to laminate the panel composite under an accurately defined temperature (T), pressure (P) and time to confirm that the EVA cures appropriately. Due to the improper process limit settings or deprived quality material usage, the EVA layer becomes melted, and it changes into milky yellow colour in its lifetime. It is named as the discolouring defect. It leads to safety issues and power losses. International Electrotechnical Commission (IEC) categorizes the defects under different classes based on the impact in safety issues and power losses as given in Table 1 and Table 2 [29,30].

Table 1.
Types of safety classes.
Table 2.
Definition of power loss classes.
EVA discolouring defect comes under B(f) safety class and C power losses class and delamination defect come under C(e) and D/E power losses class. It is very much essential to figure out such defects in the early-stage to avoid power loss and ensure safety.
3. Thermal Image Measurement Setup
3.1. Hardware and Software
The defected PV panels such as EVA discolouring and delamination were procured from KCP Solar industry. The PV panels are fitted on the rooftop of the Electrical Engineering Department building at KSRCT (11.362°N, 77.8279°E), India. The PV panels are polycrystalline type, and its technical specifications are used as maximum power Pmax of 18 Wp, short circuit current (ISC) of 2.62 A, rated current IMP of 2.32 A, open-circuit voltage (VOC) of 9.4 V and rated voltage (VMPP) of 7.2 V, under Standard operating condition (STOC). The ISC was measured combined with the voltage VOC. The maximum current (IMAX) and the maximum voltage (VMAX) produced by the panel were also measured with an Ammeter (0–2 A) and Voltmeter (0–30 V). An adjustable rheostat is used as a variable (0 to 15 Ω) to investigate IMAX and VMAX. Figure 2 shows the schematic connection diagram of the experimental model setup to acquire the IR image and measure the electrical characteristics of the PV panel.
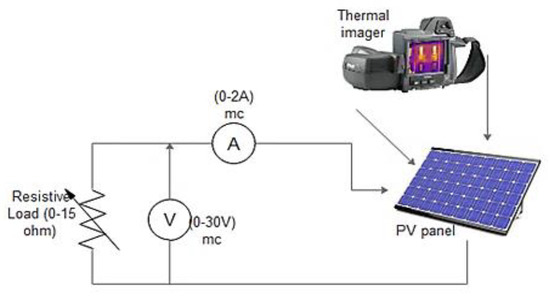
Figure 2.
Schematic diagram of the experimental setup.
T420bx Portable thermal camera is used for the measurement of IR image. Features of the imager are 320 × 240 pixels of Focal Plane Array (FPA) uncooled microbolometer sensor with a spectral range of 7.5–13μm extended. The model has a temperature range of −20 to +350 °C with measurement accuracy calibrated within +/−2 °C or +/−2% of reading. The recorded IR images are further treated in the thermal image processing method.
3.2. IR Image Capture Method
The IR image has been taken in the city of Tiruchengode, Tamil Nadu, southern India (Latitude: 11.36°, Longitude: 77.56°, mean elevation: 246 m), a set of data taken on July 2018 and another set on March 2017, in clear-sky conditions. This set has three instant capture, according to the time 06:00 (transient conditions—sunrise), 13:00 (steady-state conditions) and 18:00 (transient conditions—sunset) for each module. Before each capture, the climatic conditions, such as air temperature, humidity, and the average value of solar irradiance and wind velocity were accounted for the primary set-up of the thermal camera and the emissivity. From the local weather station, the wind velocity, ambient air temperature and humidity data were obtained and recorded by a temperature/humidity meter. Pyrometer (solarimeter) is used to measure solar irradiance values. The recorded climatic conditions for experimental data are tabulated in Table 3. Five faulted modules are used for investigation.
Table 3.
The environmental conditions for the field thermographic measurements.
According to the Indian solar resource maps, the approximate and optimum inclination angle of PV panels has to be set at 13° for Tiruchengode/Tamilnadu. During the performance measurements, whether the panels operate within optimum inclination or not, the aim is to reveal only the possible defects on the panels’ surface that occur, so the difference between the module inclinations did not affect the results of the complete experimental procedure. The distance between the thermal imager and the PV module was kept at about 1–2 m. In order to get an accurate temperature measurement, the specific factors were also considered during the initial set-up of the imager.
4. TPC Algorithm
The proposed Thermal Pixel Counting TPC algorithm is described in this session. The sample PV panel photograph and its thermal image for three different conditions are shown in Figure 3. The defected PV panel may be identified from visual observation of the photograph. The yellow colour shading appeared in the EVA defect panel, surface structure distortion in the delamination defect panel. The thermal image also clearly exposes the defected regions based on the intensity of the thermal pixel values. In the initial condition, the mean and standard deviation (std) of the thermal matrix has been calculated based on the Equations (1) and (2), and its values are tabulated in Table 4. The mean and std values of the healthy and defected panels have been compared with the IEC standards. This value has a less significant difference for different conditions, and it may help to classify the severity of the defects based on safety and power loss classes as per IEC standard. Even though defects are identified based on the above-said factors, still more detailed investigations are required, due to environmental temperature conditions and thermal camera noise. The captured thermal image underwent further analysis in the TPC algorithm. The temperature pixels matrix database of the solar PV panels has been collected from FLIR tool. A developed TPC algorithm works under while and if loop conditions. It checks and counts the temperature pixels values more than that the set, ΔT°C plus minimum temperature. The flow chart of the TPC algorithm is shown in Figure 4, while Table 5 describes the pseudocode of the TPC algorithm. The coding of the algorithm has been developed in MATLAB.
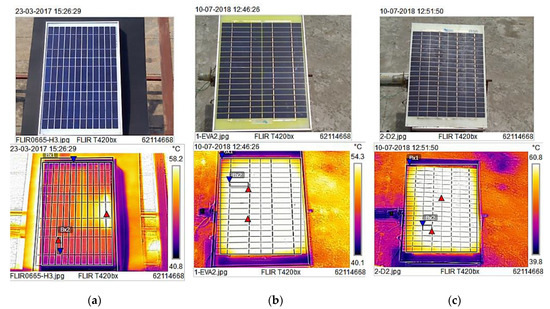
Figure 3.
Photograph and thermal image of the Photovoltaic (PV) panel: (a) healthy, (b) Ethylene Vinyl Acetate (EVA) discolouring defect, (c) delamination defect.
Table 4.
Mean and std of the temperature matrix of the PV panel and cell.
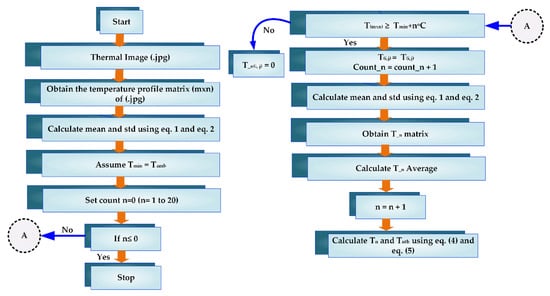
Figure 4.
Flow chart for the proposed TPC algorithm.
Table 5.
Pseudocode for TPC algorithm.
5. Testing Results and Discussion
The thermal image of the PV panel for different defect and healthy conditions are captured in the experimental setup described in Section 3. The captured image has been analyzed in FLIR Tools, and its thermal pixels matrix database is collected. The thermal pixels matrix of three different samples of PV panels under three conditions such as healthy, EVA discolouring defect and delamination defect are stored in MATLAB database. A TPC algorithm has been executed by using a thermal pixel matrix stored in the MATLAB database as an input pattern. The temperature variation of the panel and individual cell under defected conditions for different ΔT° has been compared with healthy panel and cell. Table 6 shows the average temperature matrix of the panel and cell. The percentage of thermal pixels variation of the panel and cell is shown in Figure 5a,b.
Table 6.
Average temperature matrix of the thermal image of the panel and cell.
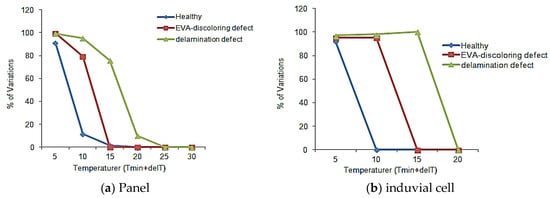
Figure 5.
Percentage of thermal pixels variation of PV panel under different ∆T°C conditions.
The EVA discolouring defect increases the thermal pixel of the panel and cell in the band of T15 C compared than healthy condition. The delamination defect increases the thermal pixel of the panel and cell in the band of T20 C. The percentage variation of the thermal pixel gives the accurate identification and classification of the EVA discolouring and delaminated defects from the healthy panel.
Figure 6 and Figure 7 show the modified thermal image for Tmin + 15 °C and Tmin + 20 °C. From the figure, the defects of the panel and cell-based on the temperature pixel intensity are observed. The performance of the proposed TPC algorithm can be verified by quantifying the results observed in the analysis. The two percentage indicators such as T15 and T20 are proposed for defect diagnosis of the PV panel, and their values are compared with the healthy panel and derived new index values T15fh and T20fh, and the values for three different samples are tabulated in Table 7. The T15 index percentage is varied significantly for delamination defect compared than EVA discolouring defect. T20 index percentage also is increased significantly for delamination defect. There is no such observation observed in EVA discolouring defected panels.
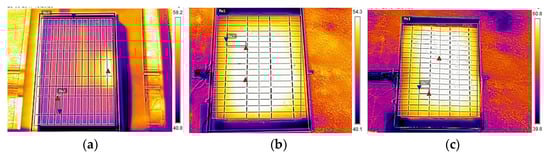
Figure 6.
Modified thermal image of the PV panel under ΔT°C = 15 °C: (a) healthy, (b) EVA discolouring defect, (c) delamination defect.
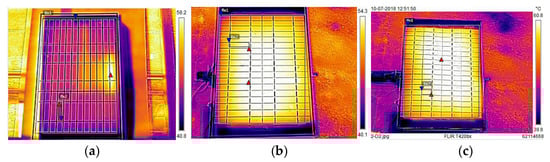
Figure 7.
Modified thermal image of the PV panel under ΔT°C = 20 °C: (a) healthy, (b) EVA discolouring defect, (c) delamination defect.
Table 7.
Comparative analysis of defected panels with the healthy panel.
6. Fuzzy Rule-Based Classification
Fuzzy rule-based classification approach has been successfully implemented to various fault prediction and classification problems [31,32,33]. It is developed based on the fuzzy relation method. The rule weight plays a critical role to decide the performance of the classifier [26]. In this paper, the certainty grade based fuzzy classification system is used for classifying EVA and delamination faults of the solar PV panel. Certainty grade leads the fuzzy membership function to learn and adopt a new input pattern vector without modifying the shape of the membership function.
The Certainty Factor CF values of each fuzzy rule are modified based on Table 8.
Table 8.
Certainty grade values of the fuzzy rule for a different case.
Fuzzy IF-THEN rules for pattern classification problem can be written as
where
- —n-dimensional input vector
- Aj1 to Ajn—Linguistic variables
- Cj—output fault class
- N—Number of Rules
The certainty grade factor is introduced in the Equation (6), and it can be rewritten as
where
- CFj—certainty grade of the Rule Rj ()
The winner rule of the new input vector Xp is defined by
The CF determines the size of the decision region of each rule without modifying the membership function area. The decision region of each rule in three linguistic variable models is shown in Figure 8.
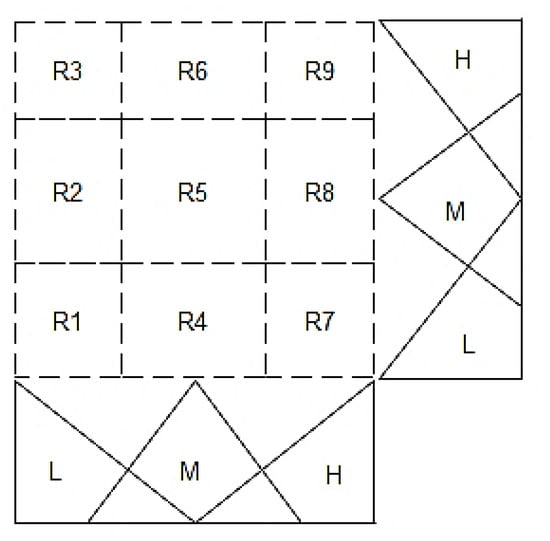
Figure 8.
Decision region of the fuzzy rule without CF.
In this PV fault classification system, two fault classes such as delamination and EVA fault are considered. The following three IF THAN rules are considered to explain the adjustment of the classification boundaries. The membership function of the above-defined rules is shown in Figure 9a,b.
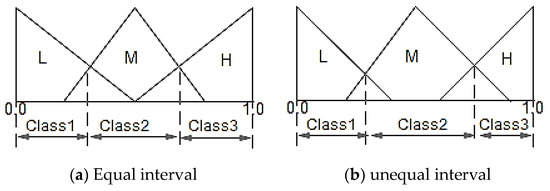
Figure 9.
Membership linguistic variables boundaries without CF.
- IF x(T10th) is Low(L) THAN Class 1 (Healthy condition)
- IF x(T10th) is Medium(M) THAN Class 2 (EVA Fault)
- IF x(T10th) is High(H) THAN Class 3 (Delamination Fault)
The boundaries values of the membership function are modified using CF values, which are shown in Figure 10. The dotted line is drawn by the product of values of CF and the compatibility grade values. The formula to determine the certainty grade values for C class classification problems is
where Cj is the consequent class and
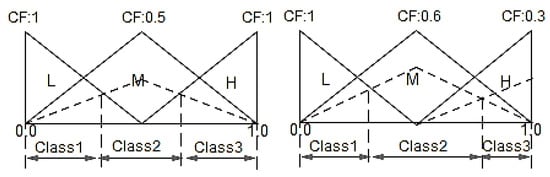
Figure 10.
Membership linguistic variables boundaries with different CF.
7. Performance Evaluation
The PV panel fault information database is collected from 25 sample panels. It has three index attributes [diagnosis index values: T10, T15, T20] for three different classes such as Healthy condition, EVA fault and delamination fault. The real number values are normalized into the unit interval of (0,1). In this work, three numbers of triangular fuzzy membership functions are used with total possible IF-THAN fuzzy rules (33 = 27). The CF value of each fuzzy rule was determined by the procedure described in the above section. The confusion matrix evaluates the classification performance.
The comparative analysis of the different performance classifier is given in Table 9. The fuzzy classifier with CF gives better classification accuracy compared with other methods due to its learning ability of the new input pattern.
Table 9.
PV panels classification test results.
8. Conclusions
The defects in the solar PV panels lead to power loss and safety issues. The detecting and classifying the progressive defects such as EVA-discoloring and delamination through thermal imaging technique is challenging one due to atmospheric temperature variations and camera noise. In this paper proposed the TPC algorithm to detect the EVA discolouring and delamination defects. In this work, we proposed T15 and T20 temperature index values that will highlight the temperature pixel distribution at ∆T°C equal to 15 °C and 20 °C. As per IEC standard, the panel surface temperature higher than above said degree leads to power loss and safety issues. These index values are compared with healthy panel for validating the proposed algorithm efficiency. The classification process is automated with the help of the proposed fuzzy classifier. The classification boundaries are adjusted by modifying the certainty grade of each fuzzy IF-THEN rule without changing the membership function parameter values. The fuzzy classifier with CF gives better classification accuracy compared to other methods and average classification accuracy increased by 10%.
Author Contributions
G.B.; devised the project, the main conceptual ideas, design experimentation and writing-original draft preparation, V.T.; supervision, data validation and review and editing, M.C.; project administration, software, U.S., S.P., L.M.-P.; technical input for testing and validation of results S.P., L.M.-P.; review and suggestion for improvement. All authors have read and agreed to the published version of the manuscript.
Funding
No source of funding for this research activity.
Acknowledgments
Authors would like to thank the Department of Science and Technology (DST)—New Delhi, India for providing financial support under the FIST-(DST-FIST(SR/FST/college-235/2014). The authors like to express sincere gratitude to the Department of Energy Technology, Aalborg University, Esbjerg, Denmark and Renewable Energy lab, Prince 441 Sultan University, Saudi Arabia, for technical inputs and support.
Conflicts of Interest
The authors declare no conflict of interest.
Nomenclatures
| T(m*n) | Thermal pixel matrix |
| Tmean | Mean value of the thermal pixel matrix |
| Tstd | The standard deviation of the thermal pixel matrix |
| Tn | n degree variation of the thermal pixel index value |
| Tnfh | Temperature index value for defect classification |
| N | Temperature degree variation |
| Q | Number of iteration per degree |
| ∆T°C | The small variation in temperature |
| Voc | Open circuit voltage |
| Vmpp | Rated voltage |
| ISC | Short circuit current |
| VMAX | Maximum voltage |
| IMAX | Maximum current |
| PMAX | Maximum power |
| X | Input variables vector |
| N | Number of rules |
| Cj | jth output fault class |
| CFj | jth certainty grade |
| µj | jth membership function |
| XP | Input variable |
| Β | Optimal boundary |
| Rj | jth rule |
| Aj | jth Fuzzy variable |
References
- Phinikarides, A.; Kindyni, N.; Makrides, G.; Georghiou, G.E. Review of photovoltaic degradation rate methodologies. Renew. Sustain. Energy Rev. 2014, 40, 143–152. [Google Scholar] [CrossRef]
- Marc, K.; Sarah, K.; Corinne, P.; Ulrike, J.; Karl, B.; Kazuhilo, K.; Thomas, F.; Haitao, L.; Van Iseghem, M.; Wohlgemuth, J.; et al. Review of Failures of Photovoltaic Modules Final, External Final Report by International Energy Agency (IEA) for Photovoltaic Power Systems Programme (PVPS); IEA: Paris, France, 2014; pp. 1–126. [Google Scholar]
- Sharma, V.; Chandel, S.S. Performance and degradation analysis for long term reliability of solar photovoltaic systems. Renew. Sustain. Energy Rev. 2013, 27, 753–767. [Google Scholar] [CrossRef]
- Mellit, A.; Tina, G.M.; Kalogirou, S.A. Fault detection and diagnosis methods for photovoltaic systems: A review. Renew. Sustain. Energy Rev. 2018, 91, 1–17. [Google Scholar] [CrossRef]
- Madeti, S.R.; Singh, S.N. A comprehensive study on different types of faults and detection techniques for solar photovoltaic system. Sol. Energy 2017, 158, 161–185. [Google Scholar] [CrossRef]
- Jading, M.S.; Taib, S. Recent progress in diagnosing the reliability of electrical equipment by using infrared thermography. J. Infrared Phys. Technol. 2012, 55, 236–245. [Google Scholar] [CrossRef]
- Kudelas, D.; Taušová, M.; Tauš, P.; Gabániová, Ľ.; Koščo, J. Investigation of operating parameters and degradation of photovoltaic panels in a photovoltaic power plant. Energies 2019, 12, 3631. [Google Scholar] [CrossRef]
- Pei, T.; Hao, X. A fault detection method for photovoltaic systems based on voltage and current observation and evaluation. Energies 2019, 12, 1712. [Google Scholar] [CrossRef]
- Skoplaki, E.; Boudouvis, A.G.; Palyvos, J.A. A simple correlation for the operating temperature of photovoltaic modules of arbitrary mounting. Sol. Energy Mater. Sol. Cells 2008, 92, 1393–1402. [Google Scholar] [CrossRef]
- Hoyer, U.; Burkert, A.; Auer, R.; Buerhop-Lutz, C. Analysis of PV modules by electroluminescence and IR thermography. In Proceedings of the 24th European Photovoltaic Solar Energy Conference and Exhibition—EUPVSEC, Hamburg, Germany, 21–25 September 2009; pp. 3262–3266. [Google Scholar]
- Moretón, R.; Lorenzo, E.; Leloux, J.; Carrillo, J.M. Dealing in practice with hot-spots. In Proceedings of the 29th EUPVSEC, Amsterdam, The Netherlands, 22–26 September 2014; pp. 1–6. [Google Scholar]
- Botsaris, P.N.; Tsanakas, J.A. An infrared thermographic approach as a hot-spot detection tool for photovoltaic modules using image histogram and line profile analysis. Int. J. Cond. Monit. 2012, 2, 22–30. [Google Scholar]
- Buerhop, C.L.; Schlegel, D.; Niess, M.; Vodermayer, C.; Weißmann, R.; Brabec, C.J. Reliability of IR-Imaging of PV-Plants under operating conditions. Sol. Energy Mater. Sol. Cells 2012, 107, 154–164. [Google Scholar] [CrossRef]
- Fares, Z.; Becherif, M.; Emziane, M.; Aboubou, A. Infrared thermography study of the temperature effect on the performance of photovoltaic cells and panels. Sustain. Energy Build. Smart Innov. Syst. Technol. 2013, 22, 875–886. [Google Scholar]
- Hu, Y.; Cao, W.; Ma, J.; Finney, S.J.; Li, D. Identifying PV module mismatch faults by a thermography-based temperature distribution analysis. IEEE Trans. Device Mater. Reliab. 2014, 14, 951–960. [Google Scholar] [CrossRef]
- Buerhop-Lutz, C.; Scheuerpflug, H. Characterization of defects in PV-Modules by their temperature development using IR-thermography. In Proceedings of the 31st EUPVSEC, Hamburg, Germany, 14–18 September 2015. [Google Scholar]
- Tsanakas, J.A. Fault diagnosis and classification of large-scale photovoltaic plants through aerial orthophoto thermal mapping. In Proceedings of the 31st EUPVSEC, Hamburg, Germany, 14–18 September 2015; pp. 1783–1788. [Google Scholar]
- Tsanakasa, J.A.; Chrysostomoub, D.; Botsarisa, P.N.; Gasteratosb, A. Fault diagnosis of photovoltaic modules through image processing and canny edge detection on field thermographic measrements. Int. J. Sustain. Energy 2015, 34, 351–372. [Google Scholar] [CrossRef]
- Ha, L.; Tsanakas, J.A.; Buerhop, C. Faults and infrared thermographic diagnosis in operating c-si photovoltaic modules: A review of research and future challenges. J. Renew. Sustain. Energy Rev. 2016, 62, 695–709. [Google Scholar]
- Kaplani, E. Detection of degradation effects in field-aged c-si solar cells through ir thermography and digital image processing. Int. J. Photoenergy 2012, 1–11. [Google Scholar] [CrossRef]
- Uma, J.; Muniraj, C.; Sathya, N. Diagnosis of photovoltaic (PV) panel defects based on testing and evaluation of thermal image. J. Test. Eval. 2018, 47, 1–9. [Google Scholar] [CrossRef]
- Tsanakas, J.A.; Ha, L.D.; Shakarchi, F.A. Advanced inspection of photovoltaic installations by aerial triangulation and terrestrial georeferencing of thermal/visual imagery. Renew. Energy 2017, 102, 224–233. [Google Scholar] [CrossRef]
- Vergura, S.; Marino, F. Quantitative and computer-aided thermography-based diagnostics for pv devices: Part I—Framework. IEEE J. Photovolt. 2017, 7, 822–827. [Google Scholar] [CrossRef]
- Singh, G.; Naikan, V.N.A. Infrared thermography based diagnosis of inter-turn fault and cooling system failure in three phase induction motor. Infrared Phys. Technol. 2017, 87, 134–138. [Google Scholar] [CrossRef]
- Ishibuchi, H.; Nozaki, K.; Tanaka, H. Distributed representation of fuzzy rules and its application to pattern classification. Fuzzy Sets Syst. 1992, 52, 21–32. [Google Scholar] [CrossRef]
- Abe, S.; Lan, M.S. A method for fuzzy rules extraction directly from numerical data and its application to pattern classification. IEEE Trans. Fuzzy Syst. 1995, 3, 18–28. [Google Scholar] [CrossRef]
- Singh, P.; Pal, N.R.; Verma, S.; Vyas, O.P. Fuzzy rule-based approach for software fault prediction. IEEE Trans. Syst. Man Cybern. Syst. 2017, 47, 826–837. [Google Scholar] [CrossRef]
- Ishibuchi, H.; Nakashima, T. Effect of rule weights in fuzzy rule-based classification systems. IEEE Trans. Fuzzy Syst. 2001, 9, 506–515. [Google Scholar] [CrossRef]
- IS/IEC. 61730-1: 2004 Photovoltaic (PV) Module Safety Qualification, Part 1: Requirements for Construction by Bureau of Indian Standard; BIS: New Delhi, India, 2010; pp. 1–23. [Google Scholar]
- IEC. 61853-1 International Electrotechnical Commission (IEC). 61853-1. Photovoltaic (PV) Module Performance Testing and Energy Rating—Part 1: Irradiance and Temperature Performance Measurements and Power Rating; IEC: Geneva, Switzerland, 2011; pp. 1–25. [Google Scholar]
- Mahmoud, D.; Violeta, H.; Bruce, M.; Mark, D.; Peter, M. Photovoltaic fault detection algorithm based on theoretical curves modelling and fuzzy classification system. Energy 2017, 140, 1–10. [Google Scholar]
- Zhao, Q.; Shao, S.; Lu, L.; Liu, X.; Zhu, H. A new PV array fault diagnosis method using fuzzy C-Mean clustering and fuzzy membership algorithm. Energies 2018, 11, 238. [Google Scholar] [CrossRef]
- Chang, H.C.; Lin, S.C.; Kuo, C.C. Induction motor diagnostic system based on electrical detection method and fuzzy algorithm. Int. J. Fuzzy Syst. 2016, 18, 732–738. [Google Scholar] [CrossRef]
© 2020 by the authors. Licensee MDPI, Basel, Switzerland. This article is an open access article distributed under the terms and conditions of the Creative Commons Attribution (CC BY) license (http://creativecommons.org/licenses/by/4.0/).