Infrared Thermography Based Defects Testing of Solar Photovoltaic Panel with Fuzzy Rule-Based Evaluation


 ,
,  and
and 
Abstract
1. Introduction
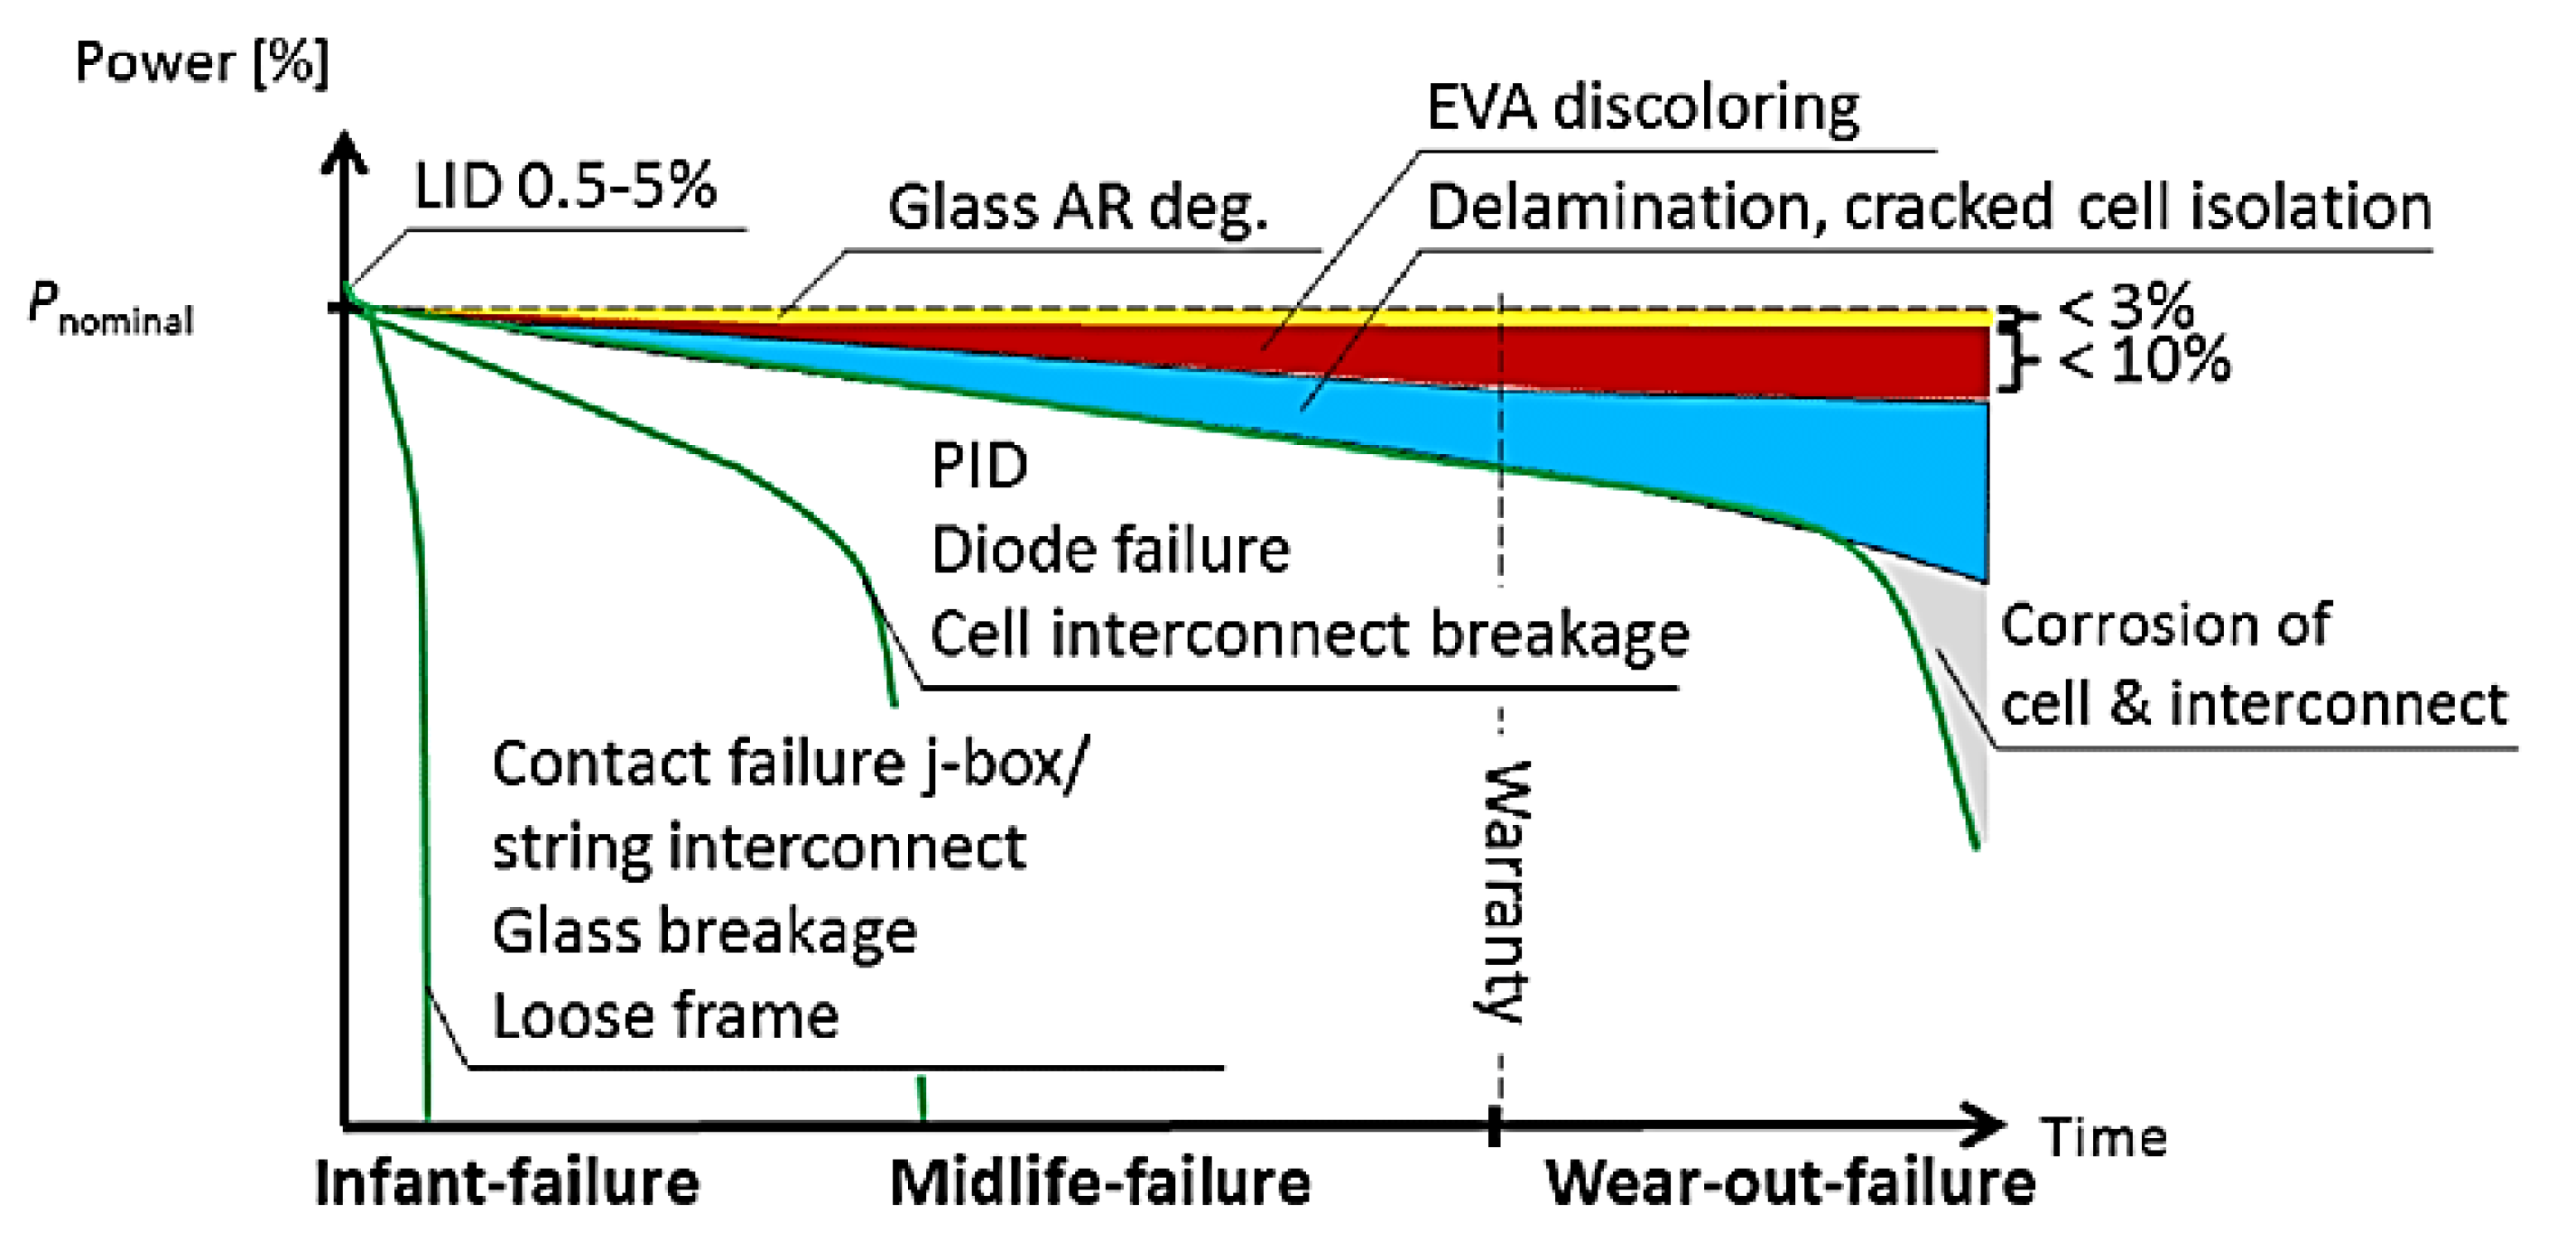
2. Defects in PV Panels
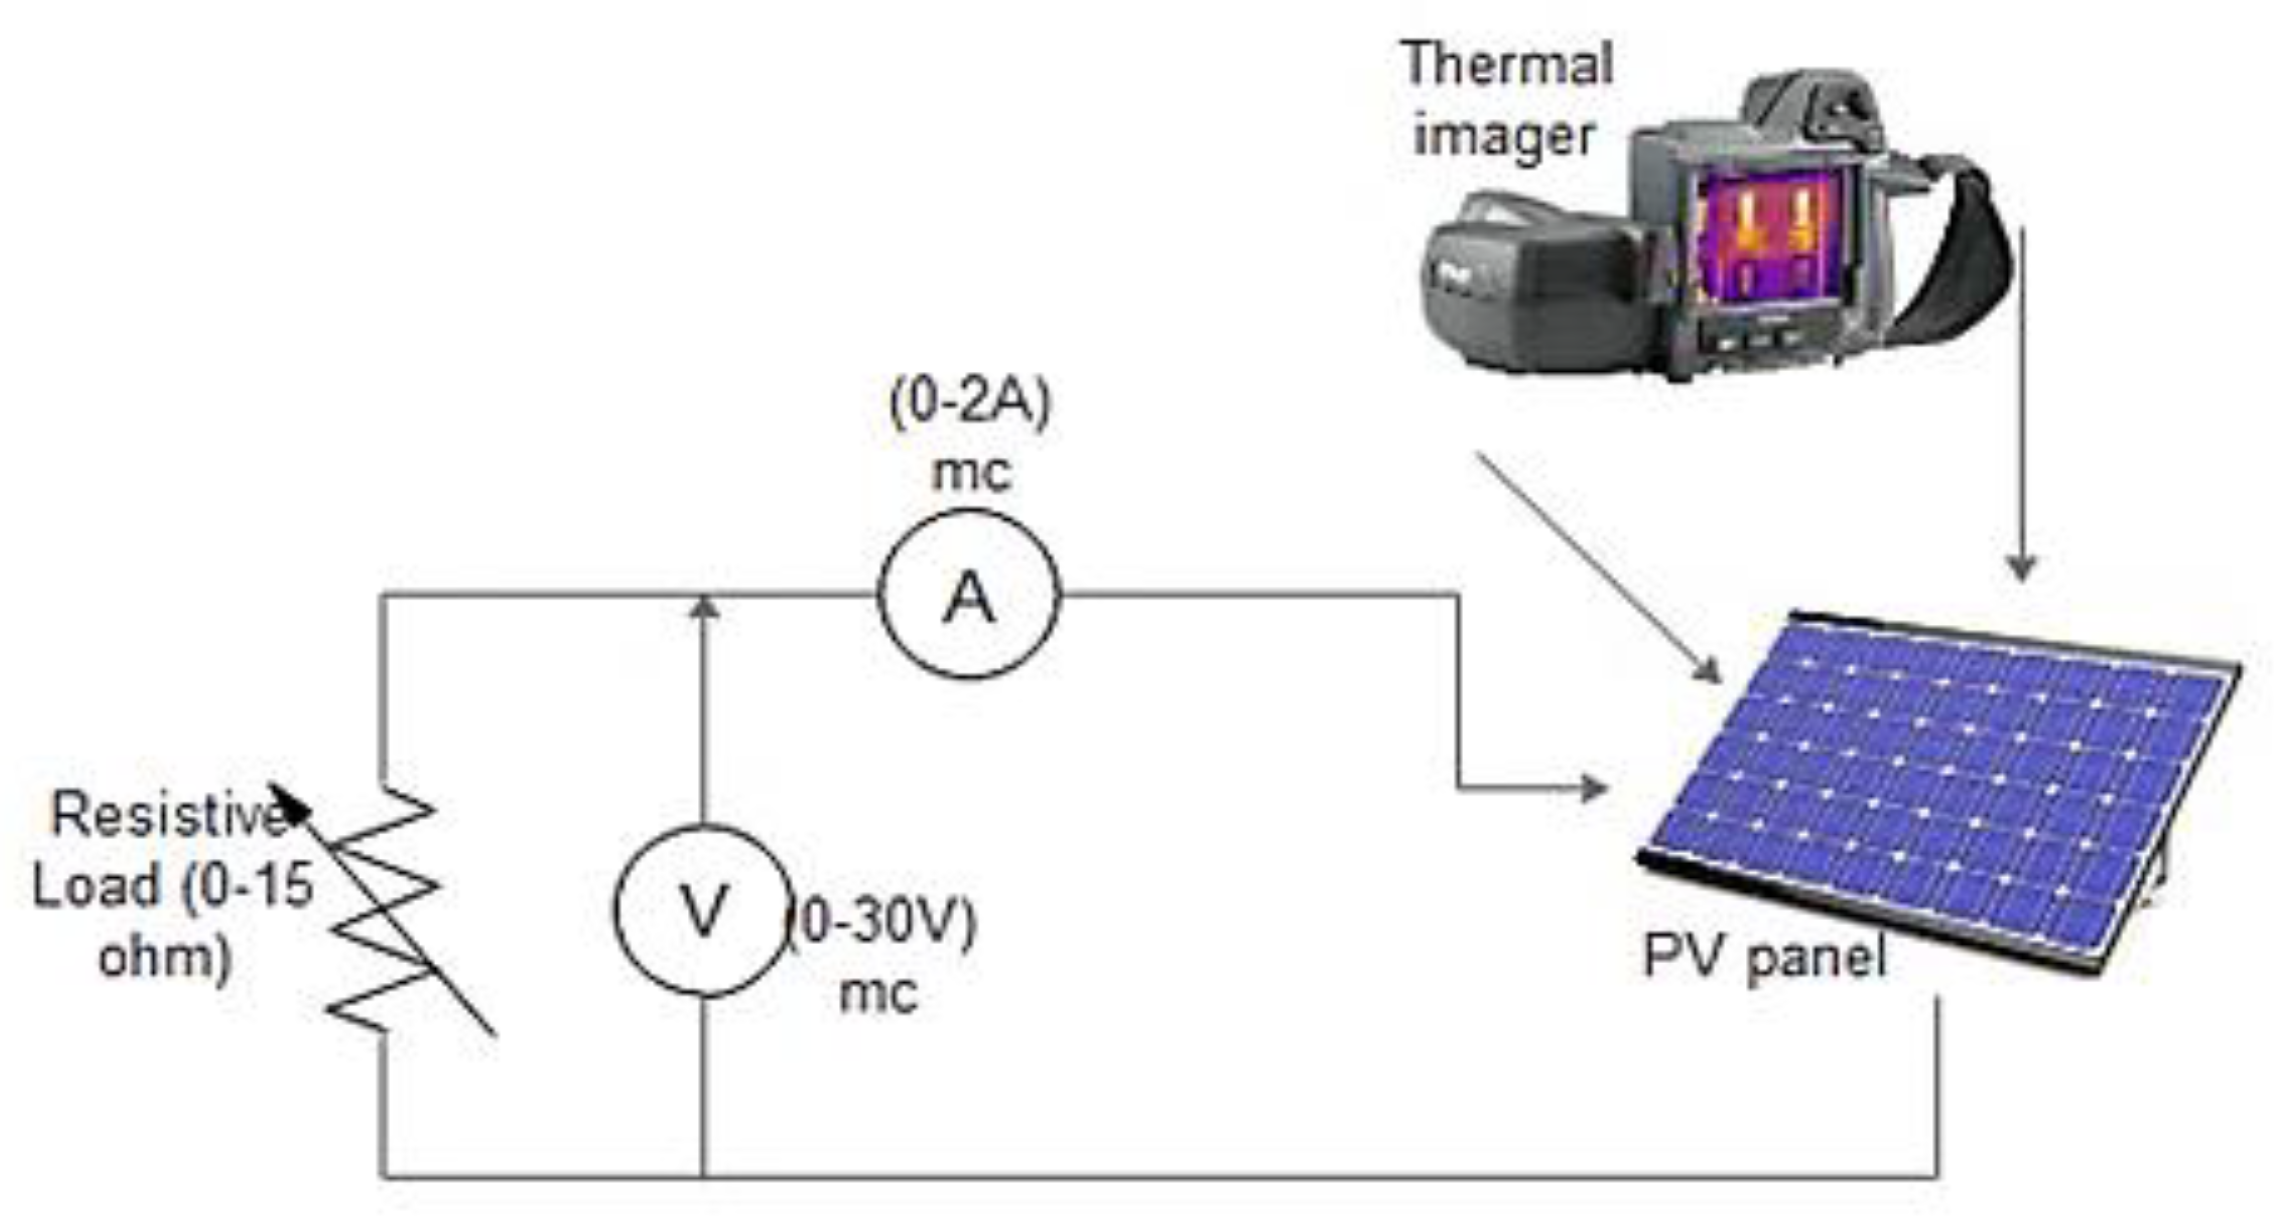
3. Thermal Image Measurement Setup
3.1. Hardware and Software
3.2. IR Image Capture Method
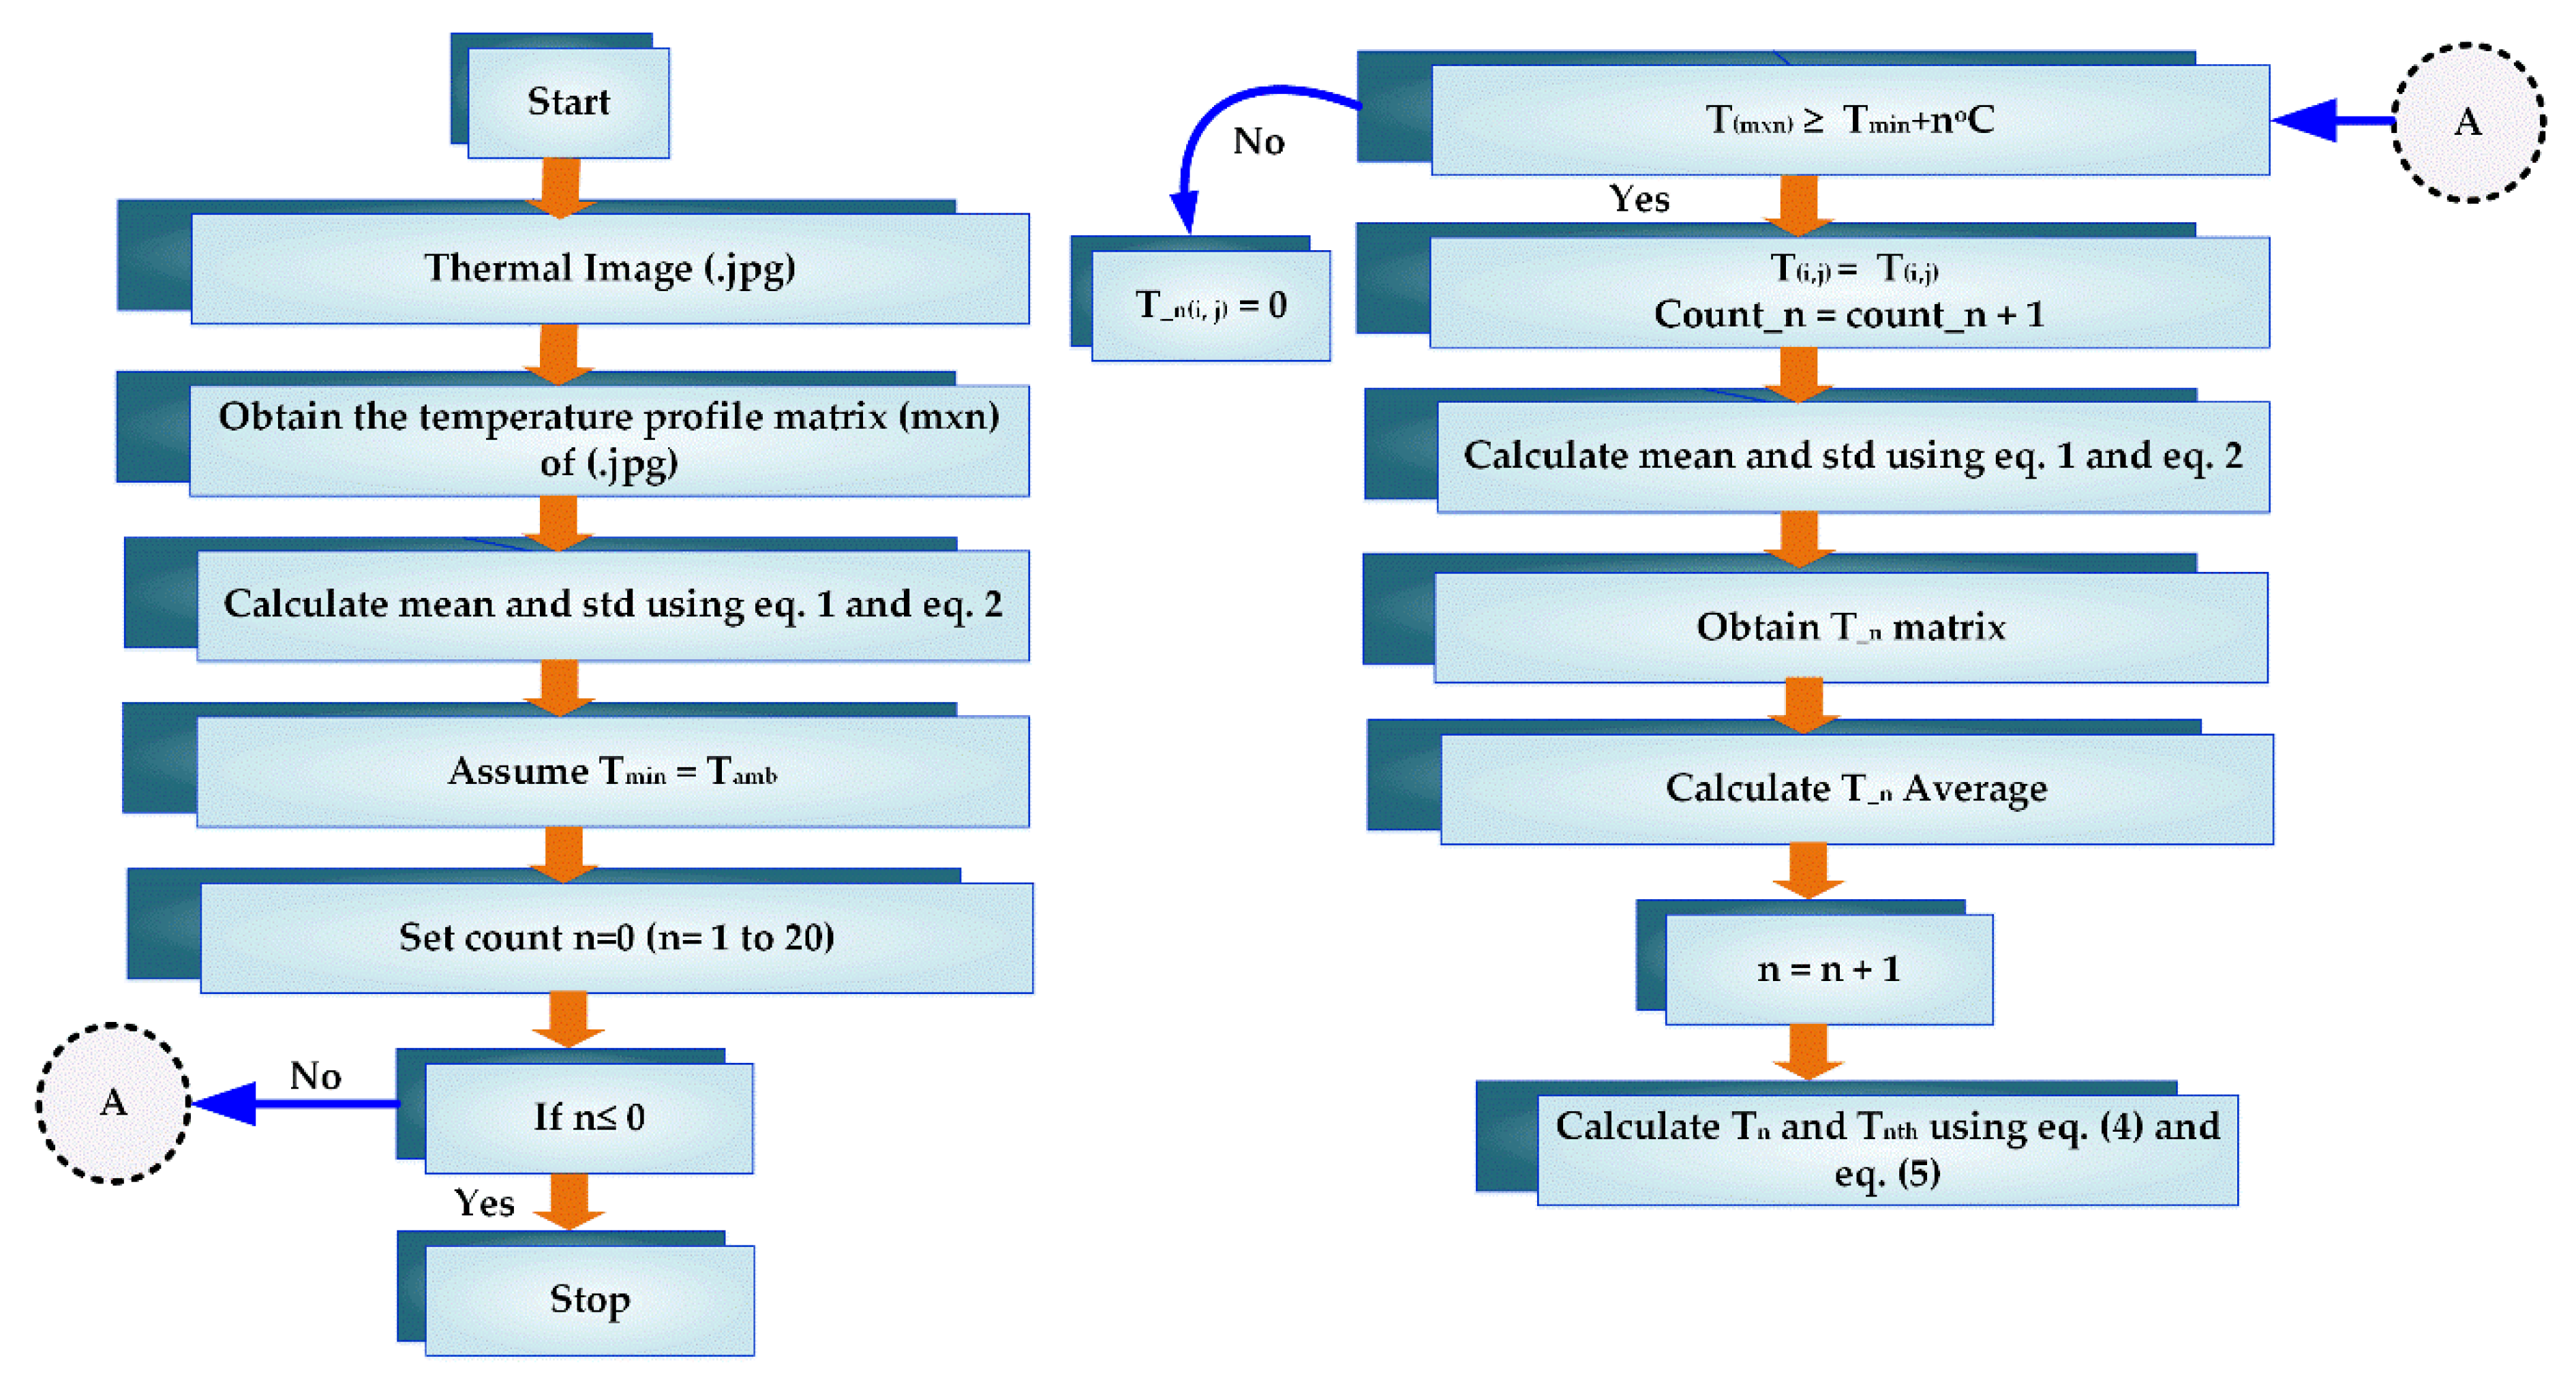
4. TPC Algorithm
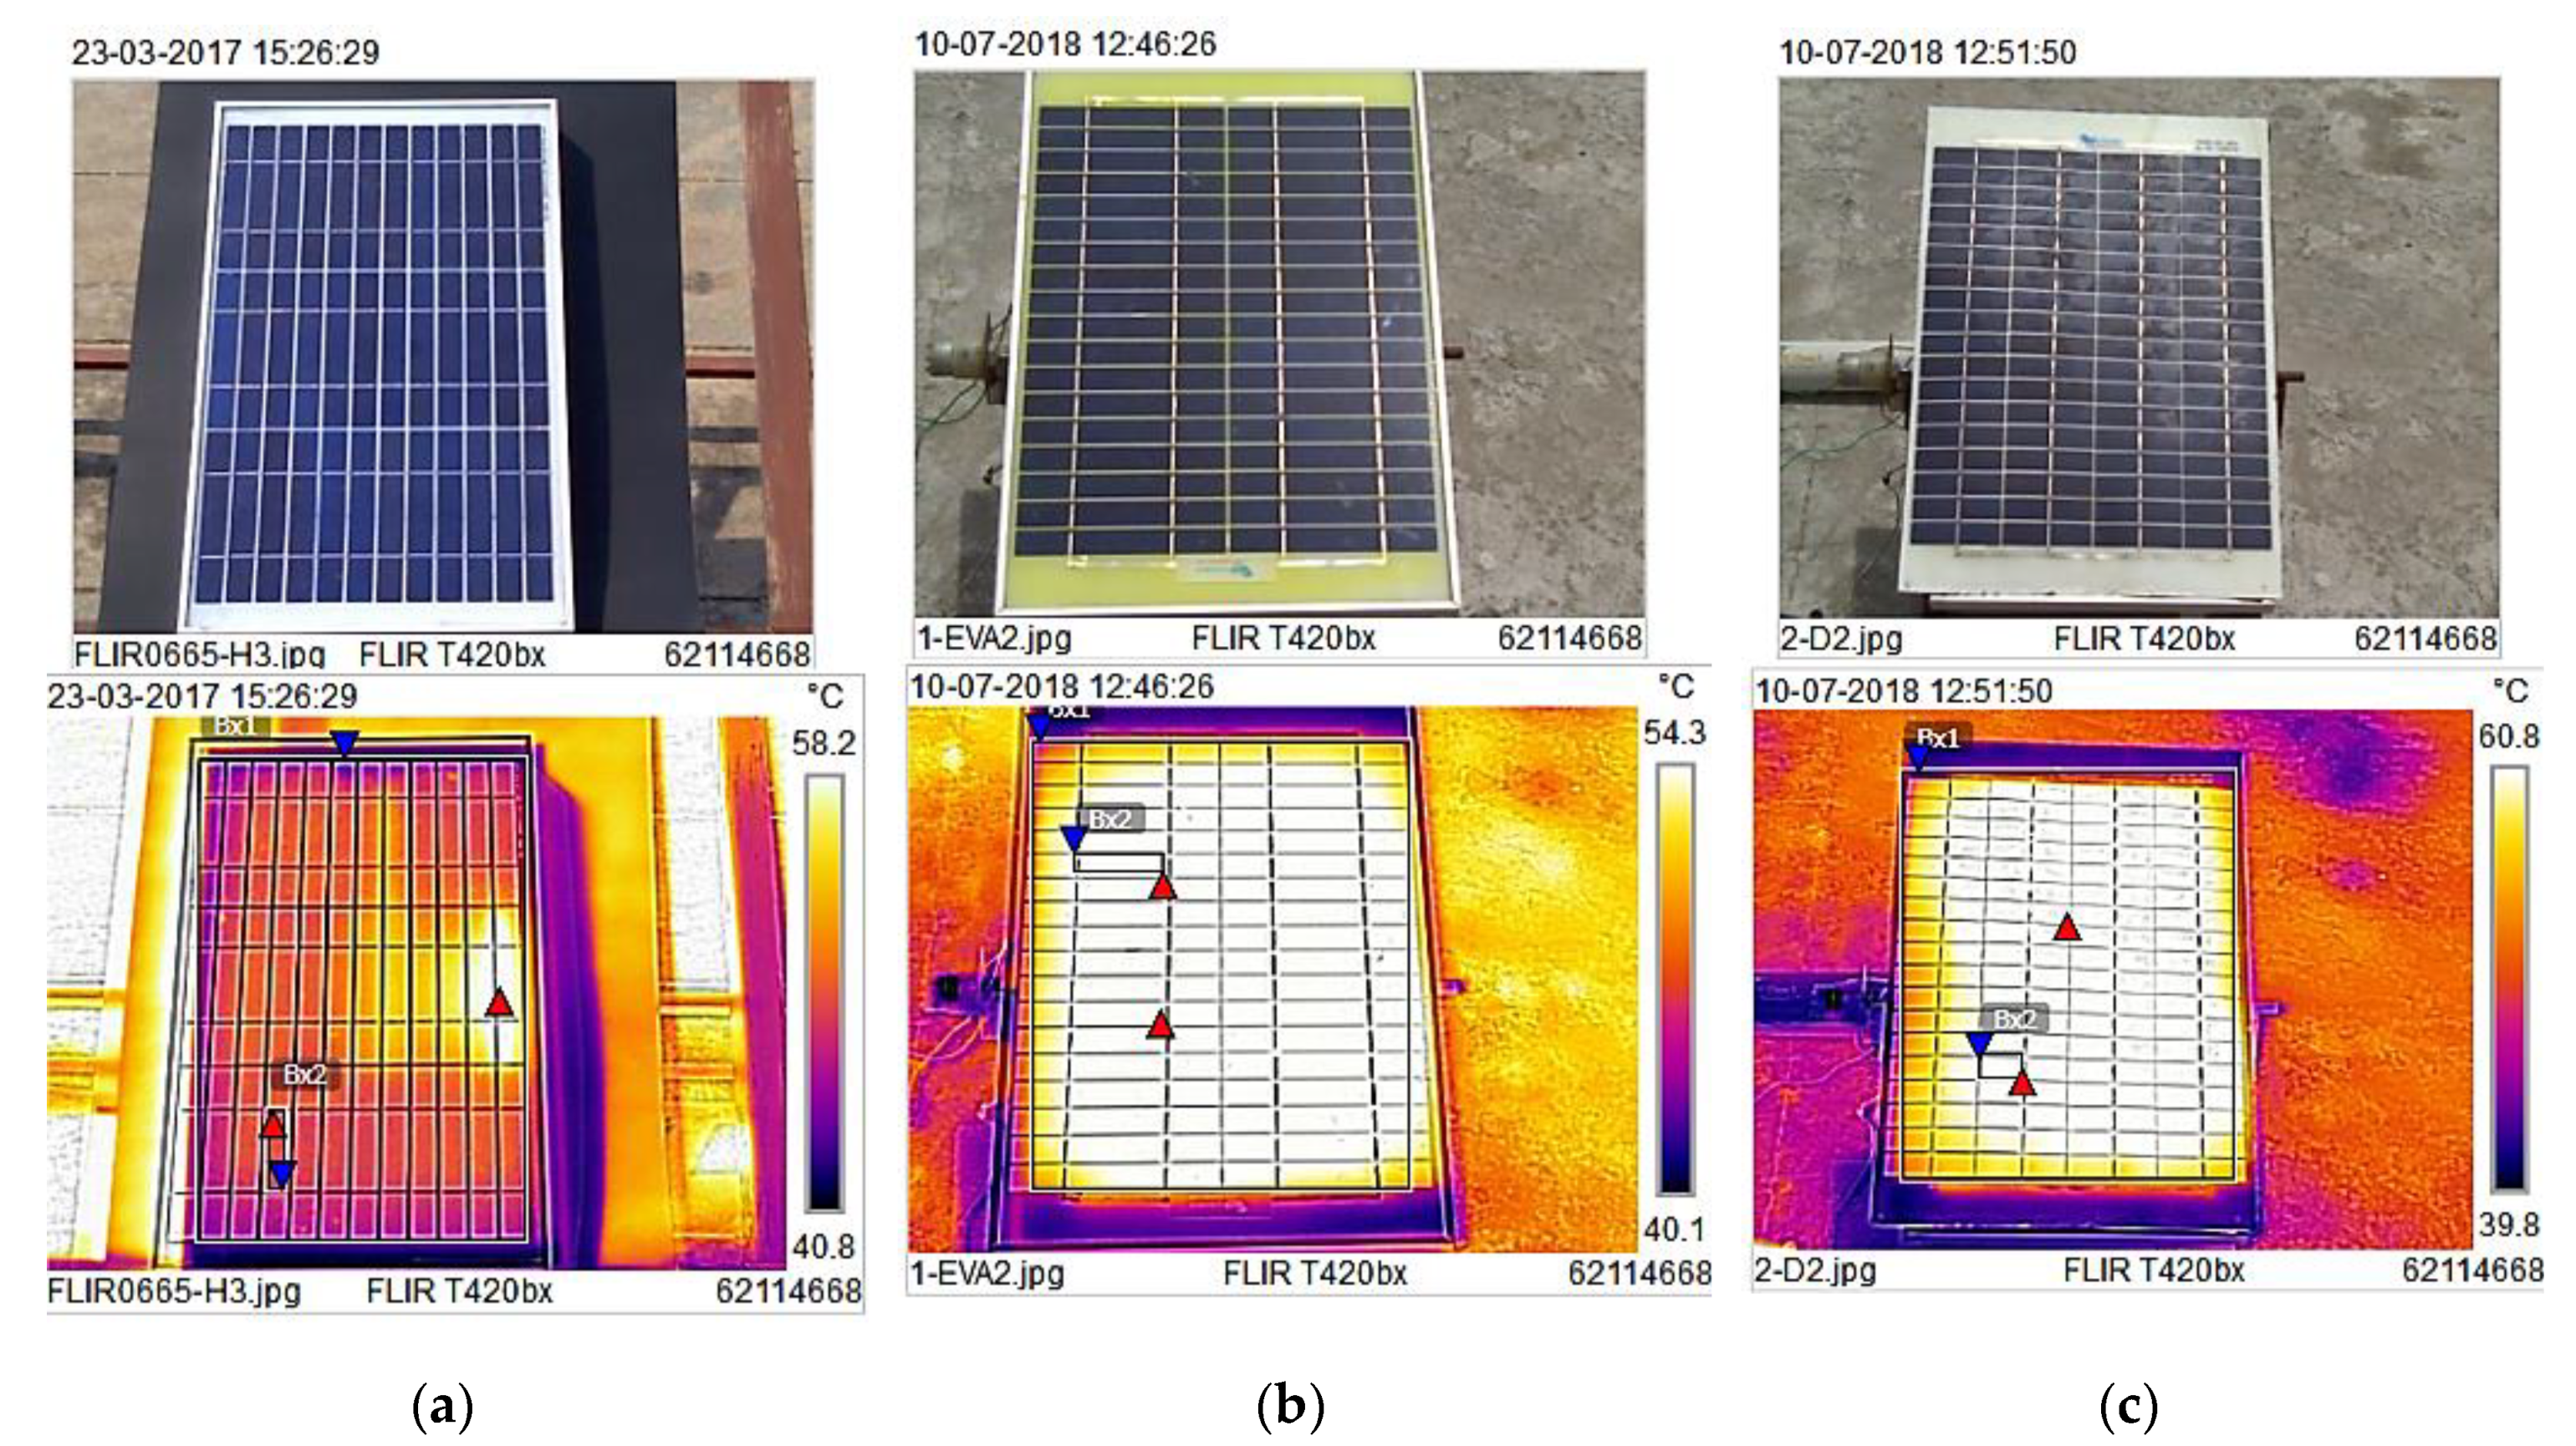
5. Testing Results and Discussion
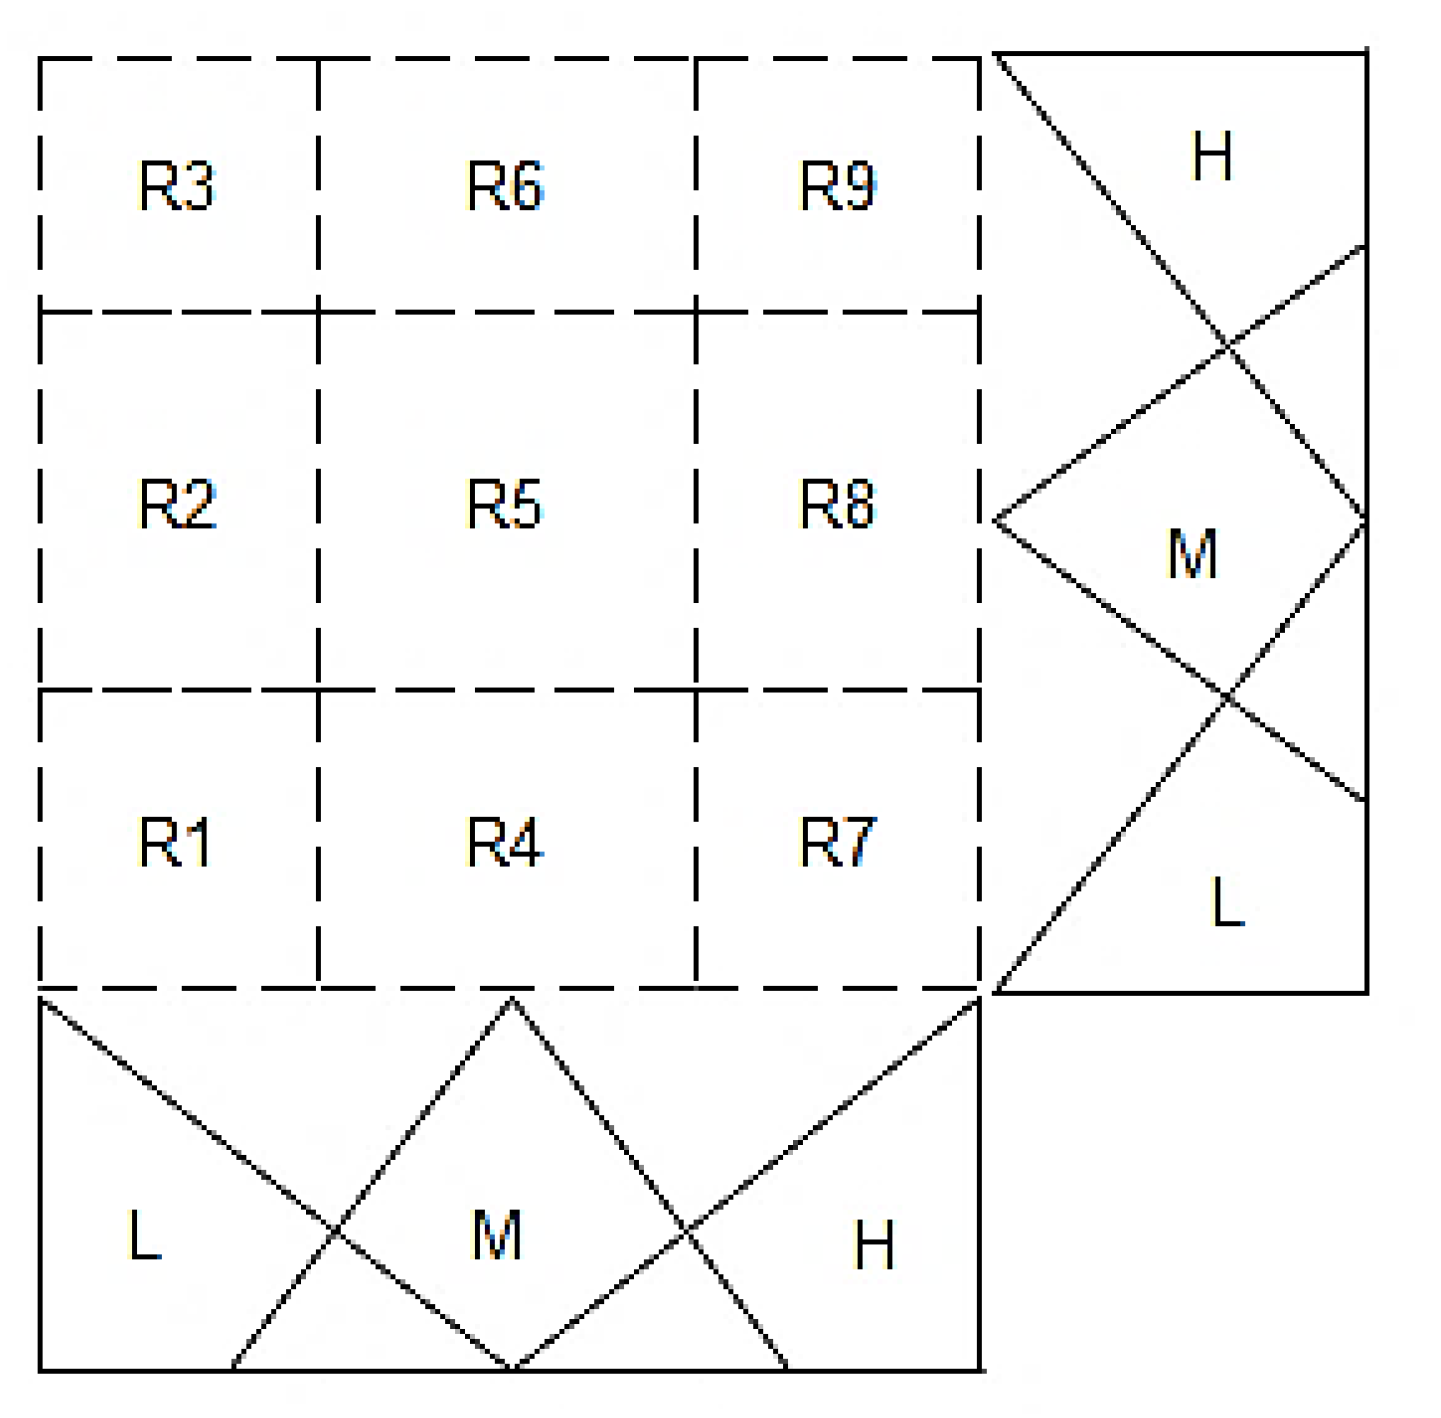
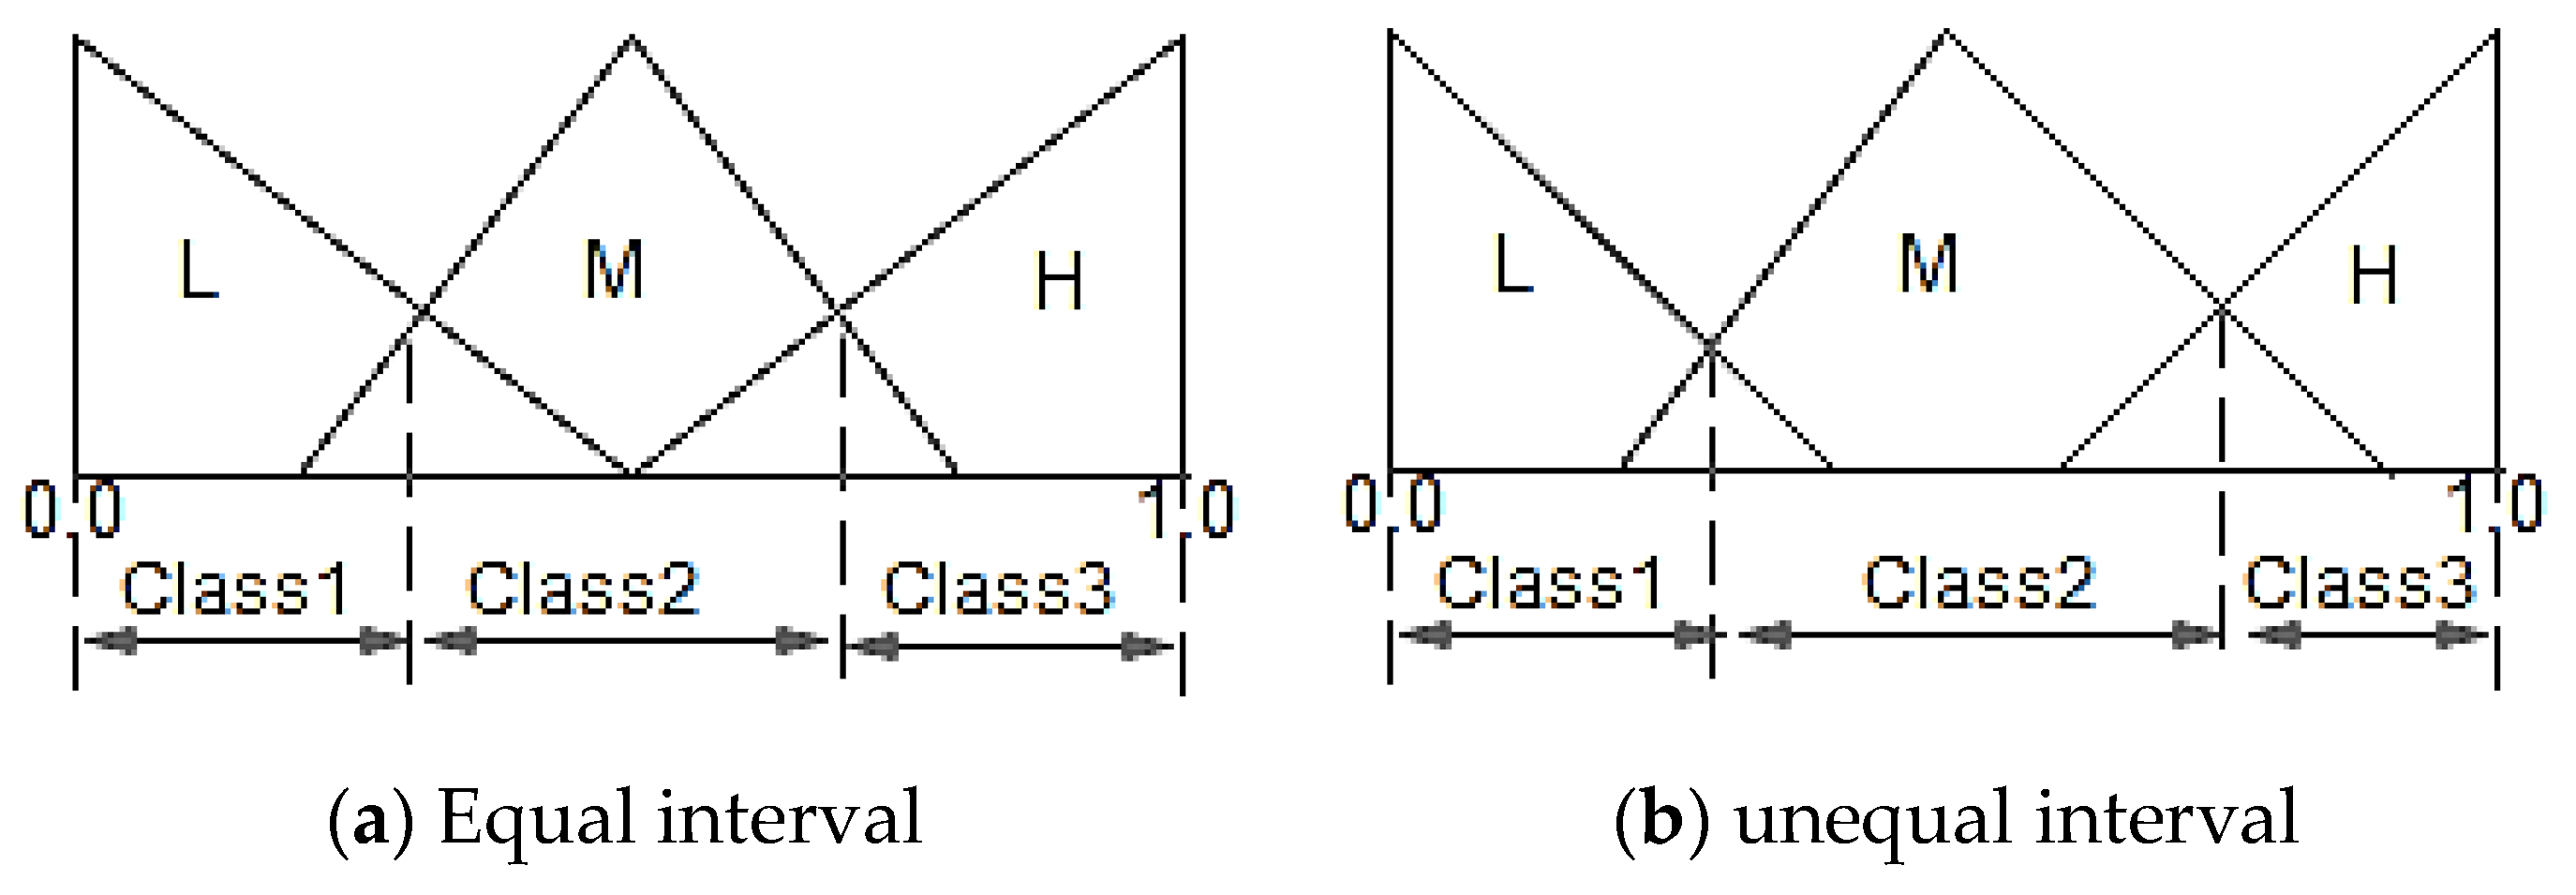
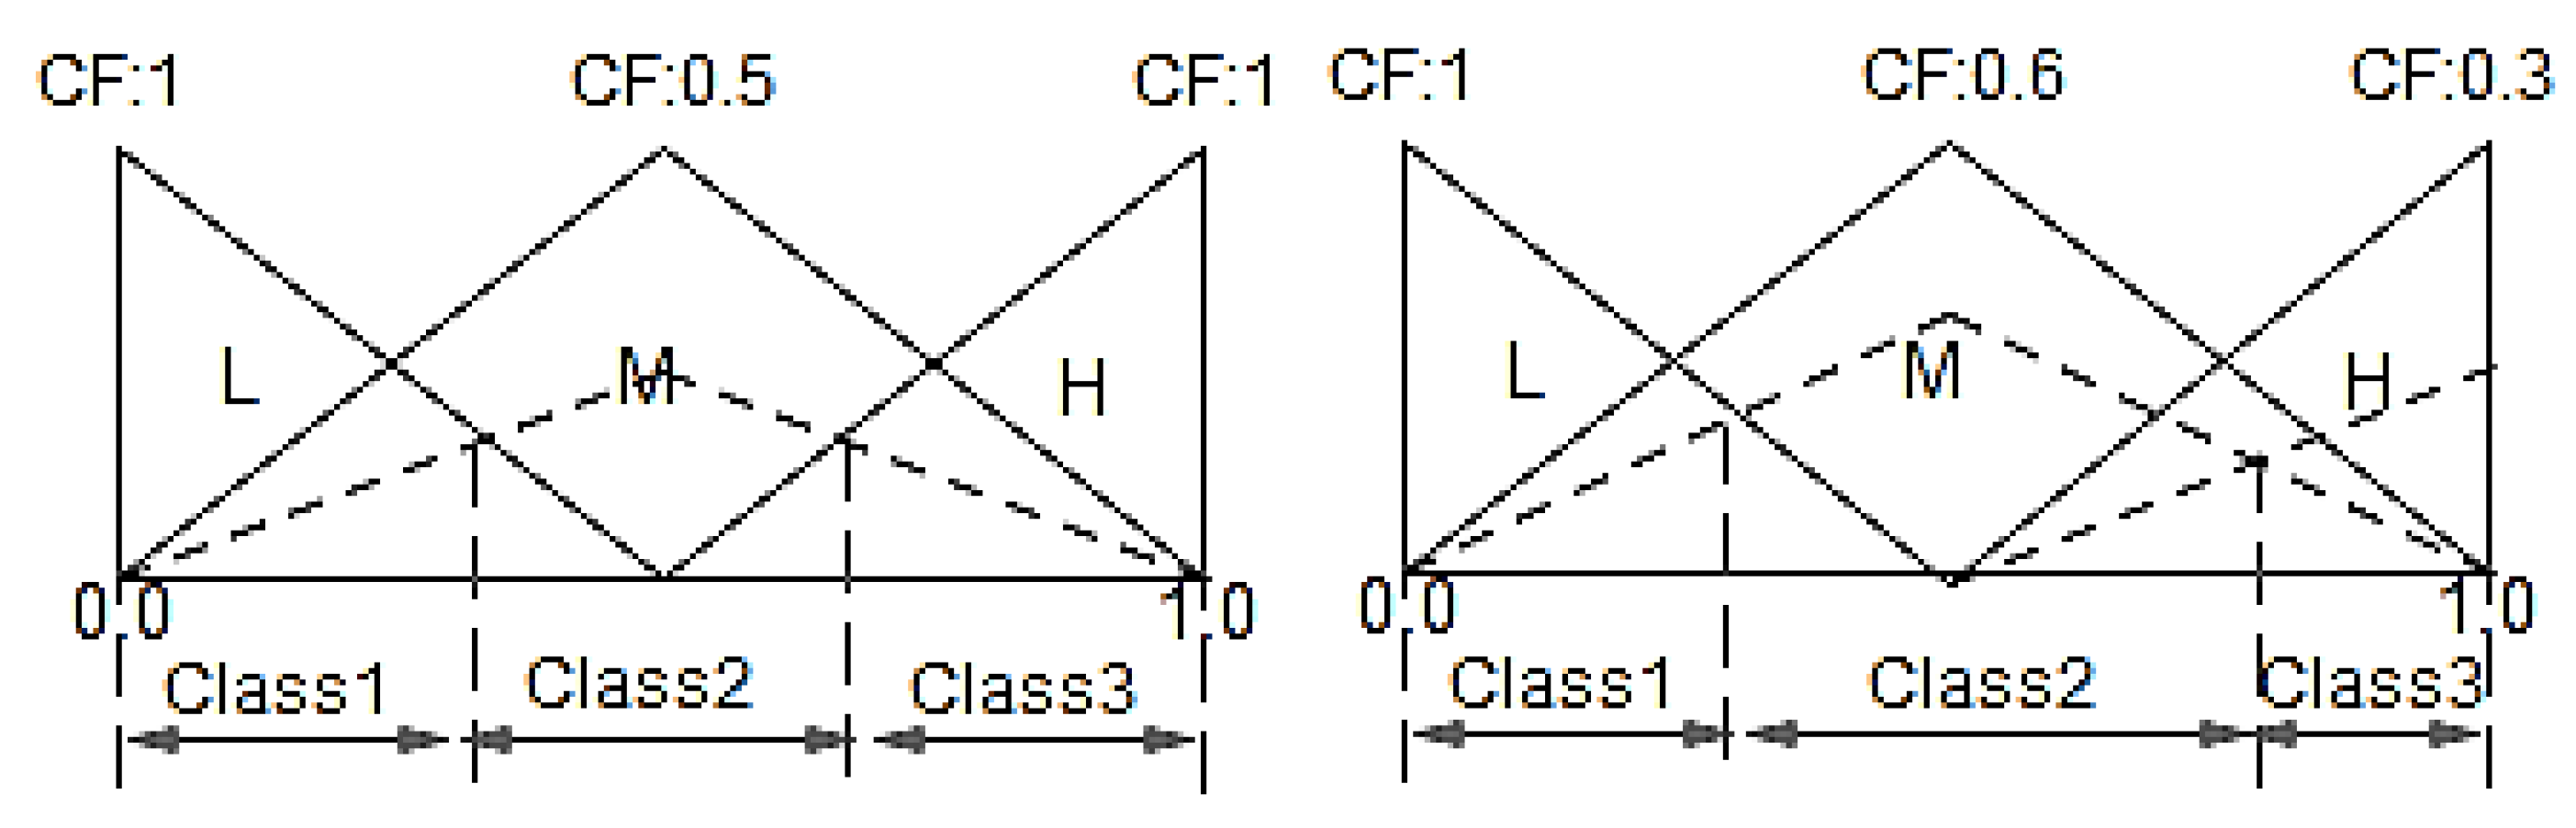
6. Fuzzy Rule-Based Classification
- —n-dimensional input vector
- Aj1 to Ajn—Linguistic variables
- Cj—output fault class
- N—Number of Rules
- CFj—certainty grade of the Rule Rj ()
- IF x(T10th) is Low(L) THAN Class 1 (Healthy condition)
- IF x(T10th) is Medium(M) THAN Class 2 (EVA Fault)
- IF x(T10th) is High(H) THAN Class 3 (Delamination Fault)
7. Performance Evaluation
8. Conclusions
Author Contributions
Funding
Acknowledgments
Conflicts of Interest
Nomenclatures
| T(m*n) | Thermal pixel matrix |
| Tmean | Mean value of the thermal pixel matrix |
| Tstd | The standard deviation of the thermal pixel matrix |
| Tn | n degree variation of the thermal pixel index value |
| Tnfh | Temperature index value for defect classification |
| N | Temperature degree variation |
| Q | Number of iteration per degree |
| ∆T°C | The small variation in temperature |
| Voc | Open circuit voltage |
| Vmpp | Rated voltage |
| ISC | Short circuit current |
| VMAX | Maximum voltage |
| IMAX | Maximum current |
| PMAX | Maximum power |
| X | Input variables vector |
| N | Number of rules |
| Cj | jth output fault class |
| CFj | jth certainty grade |
| µj | jth membership function |
| XP | Input variable |
| Β | Optimal boundary |
| Rj | jth rule |
| Aj | jth Fuzzy variable |
References
- Phinikarides, A.; Kindyni, N.; Makrides, G.; Georghiou, G.E. Review of photovoltaic degradation rate methodologies. Renew. Sustain. Energy Rev. 2014, 40, 143–152. [Google Scholar] [CrossRef]
- Marc, K.; Sarah, K.; Corinne, P.; Ulrike, J.; Karl, B.; Kazuhilo, K.; Thomas, F.; Haitao, L.; Van Iseghem, M.; Wohlgemuth, J.; et al. Review of Failures of Photovoltaic Modules Final, External Final Report by International Energy Agency (IEA) for Photovoltaic Power Systems Programme (PVPS); IEA: Paris, France, 2014; pp. 1–126. [Google Scholar]
- Sharma, V.; Chandel, S.S. Performance and degradation analysis for long term reliability of solar photovoltaic systems. Renew. Sustain. Energy Rev. 2013, 27, 753–767. [Google Scholar] [CrossRef]
- Mellit, A.; Tina, G.M.; Kalogirou, S.A. Fault detection and diagnosis methods for photovoltaic systems: A review. Renew. Sustain. Energy Rev. 2018, 91, 1–17. [Google Scholar] [CrossRef]
- Madeti, S.R.; Singh, S.N. A comprehensive study on different types of faults and detection techniques for solar photovoltaic system. Sol. Energy 2017, 158, 161–185. [Google Scholar] [CrossRef]
- Jading, M.S.; Taib, S. Recent progress in diagnosing the reliability of electrical equipment by using infrared thermography. J. Infrared Phys. Technol. 2012, 55, 236–245. [Google Scholar] [CrossRef]
- Kudelas, D.; Taušová, M.; Tauš, P.; Gabániová, Ľ.; Koščo, J. Investigation of operating parameters and degradation of photovoltaic panels in a photovoltaic power plant. Energies 2019, 12, 3631. [Google Scholar] [CrossRef]
- Pei, T.; Hao, X. A fault detection method for photovoltaic systems based on voltage and current observation and evaluation. Energies 2019, 12, 1712. [Google Scholar] [CrossRef]
- Skoplaki, E.; Boudouvis, A.G.; Palyvos, J.A. A simple correlation for the operating temperature of photovoltaic modules of arbitrary mounting. Sol. Energy Mater. Sol. Cells 2008, 92, 1393–1402. [Google Scholar] [CrossRef]
- Hoyer, U.; Burkert, A.; Auer, R.; Buerhop-Lutz, C. Analysis of PV modules by electroluminescence and IR thermography. In Proceedings of the 24th European Photovoltaic Solar Energy Conference and Exhibition—EUPVSEC, Hamburg, Germany, 21–25 September 2009; pp. 3262–3266. [Google Scholar]
- Moretón, R.; Lorenzo, E.; Leloux, J.; Carrillo, J.M. Dealing in practice with hot-spots. In Proceedings of the 29th EUPVSEC, Amsterdam, The Netherlands, 22–26 September 2014; pp. 1–6. [Google Scholar]
- Botsaris, P.N.; Tsanakas, J.A. An infrared thermographic approach as a hot-spot detection tool for photovoltaic modules using image histogram and line profile analysis. Int. J. Cond. Monit. 2012, 2, 22–30. [Google Scholar]
- Buerhop, C.L.; Schlegel, D.; Niess, M.; Vodermayer, C.; Weißmann, R.; Brabec, C.J. Reliability of IR-Imaging of PV-Plants under operating conditions. Sol. Energy Mater. Sol. Cells 2012, 107, 154–164. [Google Scholar] [CrossRef]
- Fares, Z.; Becherif, M.; Emziane, M.; Aboubou, A. Infrared thermography study of the temperature effect on the performance of photovoltaic cells and panels. Sustain. Energy Build. Smart Innov. Syst. Technol. 2013, 22, 875–886. [Google Scholar]
- Hu, Y.; Cao, W.; Ma, J.; Finney, S.J.; Li, D. Identifying PV module mismatch faults by a thermography-based temperature distribution analysis. IEEE Trans. Device Mater. Reliab. 2014, 14, 951–960. [Google Scholar] [CrossRef]
- Buerhop-Lutz, C.; Scheuerpflug, H. Characterization of defects in PV-Modules by their temperature development using IR-thermography. In Proceedings of the 31st EUPVSEC, Hamburg, Germany, 14–18 September 2015. [Google Scholar]
- Tsanakas, J.A. Fault diagnosis and classification of large-scale photovoltaic plants through aerial orthophoto thermal mapping. In Proceedings of the 31st EUPVSEC, Hamburg, Germany, 14–18 September 2015; pp. 1783–1788. [Google Scholar]
- Tsanakasa, J.A.; Chrysostomoub, D.; Botsarisa, P.N.; Gasteratosb, A. Fault diagnosis of photovoltaic modules through image processing and canny edge detection on field thermographic measrements. Int. J. Sustain. Energy 2015, 34, 351–372. [Google Scholar] [CrossRef]
- Ha, L.; Tsanakas, J.A.; Buerhop, C. Faults and infrared thermographic diagnosis in operating c-si photovoltaic modules: A review of research and future challenges. J. Renew. Sustain. Energy Rev. 2016, 62, 695–709. [Google Scholar]
- Kaplani, E. Detection of degradation effects in field-aged c-si solar cells through ir thermography and digital image processing. Int. J. Photoenergy 2012, 1–11. [Google Scholar] [CrossRef]
- Uma, J.; Muniraj, C.; Sathya, N. Diagnosis of photovoltaic (PV) panel defects based on testing and evaluation of thermal image. J. Test. Eval. 2018, 47, 1–9. [Google Scholar] [CrossRef]
- Tsanakas, J.A.; Ha, L.D.; Shakarchi, F.A. Advanced inspection of photovoltaic installations by aerial triangulation and terrestrial georeferencing of thermal/visual imagery. Renew. Energy 2017, 102, 224–233. [Google Scholar] [CrossRef]
- Vergura, S.; Marino, F. Quantitative and computer-aided thermography-based diagnostics for pv devices: Part I—Framework. IEEE J. Photovolt. 2017, 7, 822–827. [Google Scholar] [CrossRef]
- Singh, G.; Naikan, V.N.A. Infrared thermography based diagnosis of inter-turn fault and cooling system failure in three phase induction motor. Infrared Phys. Technol. 2017, 87, 134–138. [Google Scholar] [CrossRef]
- Ishibuchi, H.; Nozaki, K.; Tanaka, H. Distributed representation of fuzzy rules and its application to pattern classification. Fuzzy Sets Syst. 1992, 52, 21–32. [Google Scholar] [CrossRef]
- Abe, S.; Lan, M.S. A method for fuzzy rules extraction directly from numerical data and its application to pattern classification. IEEE Trans. Fuzzy Syst. 1995, 3, 18–28. [Google Scholar] [CrossRef]
- Singh, P.; Pal, N.R.; Verma, S.; Vyas, O.P. Fuzzy rule-based approach for software fault prediction. IEEE Trans. Syst. Man Cybern. Syst. 2017, 47, 826–837. [Google Scholar] [CrossRef]
- Ishibuchi, H.; Nakashima, T. Effect of rule weights in fuzzy rule-based classification systems. IEEE Trans. Fuzzy Syst. 2001, 9, 506–515. [Google Scholar] [CrossRef]
- IS/IEC. 61730-1: 2004 Photovoltaic (PV) Module Safety Qualification, Part 1: Requirements for Construction by Bureau of Indian Standard; BIS: New Delhi, India, 2010; pp. 1–23. [Google Scholar]
- IEC. 61853-1 International Electrotechnical Commission (IEC). 61853-1. Photovoltaic (PV) Module Performance Testing and Energy Rating—Part 1: Irradiance and Temperature Performance Measurements and Power Rating; IEC: Geneva, Switzerland, 2011; pp. 1–25. [Google Scholar]
- Mahmoud, D.; Violeta, H.; Bruce, M.; Mark, D.; Peter, M. Photovoltaic fault detection algorithm based on theoretical curves modelling and fuzzy classification system. Energy 2017, 140, 1–10. [Google Scholar]
- Zhao, Q.; Shao, S.; Lu, L.; Liu, X.; Zhu, H. A new PV array fault diagnosis method using fuzzy C-Mean clustering and fuzzy membership algorithm. Energies 2018, 11, 238. [Google Scholar] [CrossRef]
- Chang, H.C.; Lin, S.C.; Kuo, C.C. Induction motor diagnostic system based on electrical detection method and fuzzy algorithm. Int. J. Fuzzy Syst. 2016, 18, 732–738. [Google Scholar] [CrossRef]


| Safety Class | Description |
|---|---|
| A | Defects do not lead to safety issues |
| B(f,e,m) | Defects can cause fire(f), electrical accident (e), physical danger(m) and consecutive defects may occur |
| C(f,e,m) | Defects lead to saviour’s safety issues |
| Power Loss Class | Description |
|---|---|
| A | Power loss is <3% (unable to measure) |
| B | Power loss degradation over time by exponentially |
| C | Power loss degradation over time by linearly |
| D | Power loss degradation saturates over time |
| E | Power loss degradation over time by step by step |
| F | Power loss degradation over time by unknown shaped |
| Date | 10.07.2018 | 23.03.2017 | ||||
|---|---|---|---|---|---|---|
| Time | 6:00 | 13:00 | 18:00 | 6:00 | 13:00 | 18:00 |
| Air temperature (°C) | 23 | 34 | 27 | 25 | 36 | 28 |
| RH-Relative humidity (%) | 67 | 29 | 58 | 62 | 25 | 57 |
| Wind speed (m/s) | 0.8 | 2.8 | 3.7 | 0.6 | 1.2 | 3.8 |
| Solar irradiance (W/m2) | 34 | 890 | 182 | 31 | 742 | 154 |
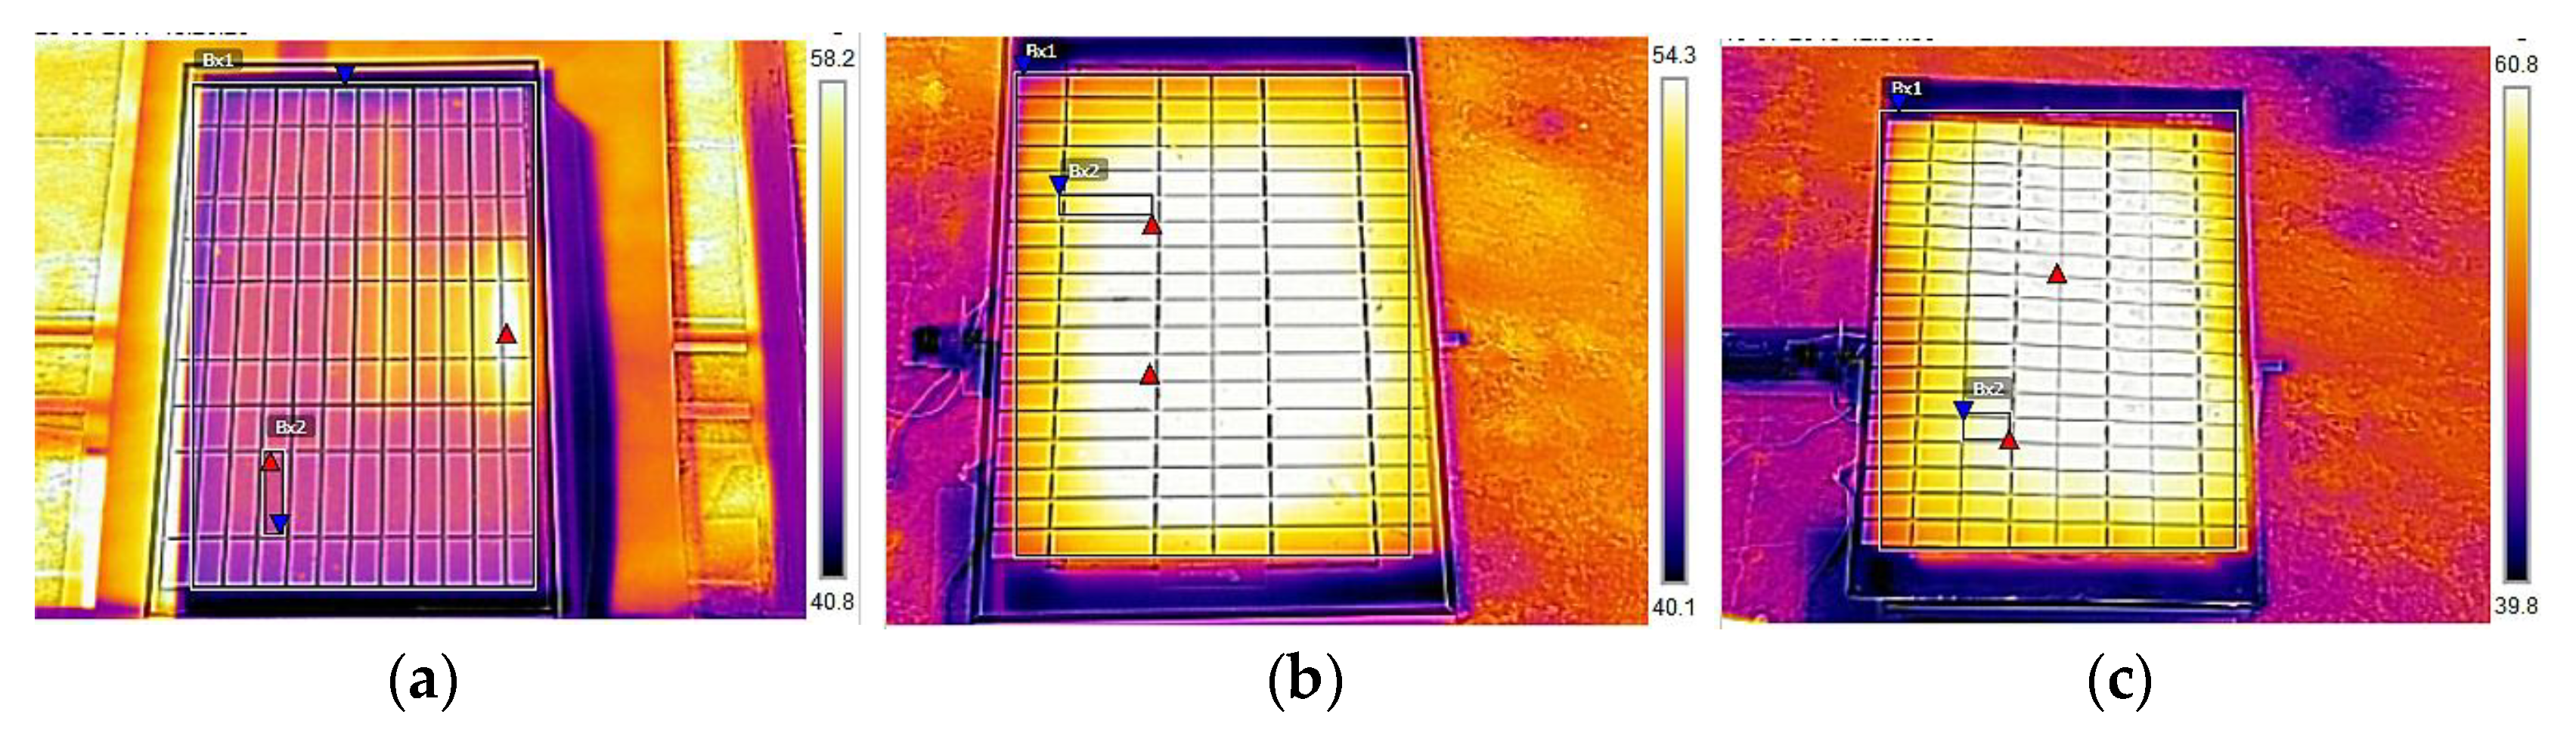
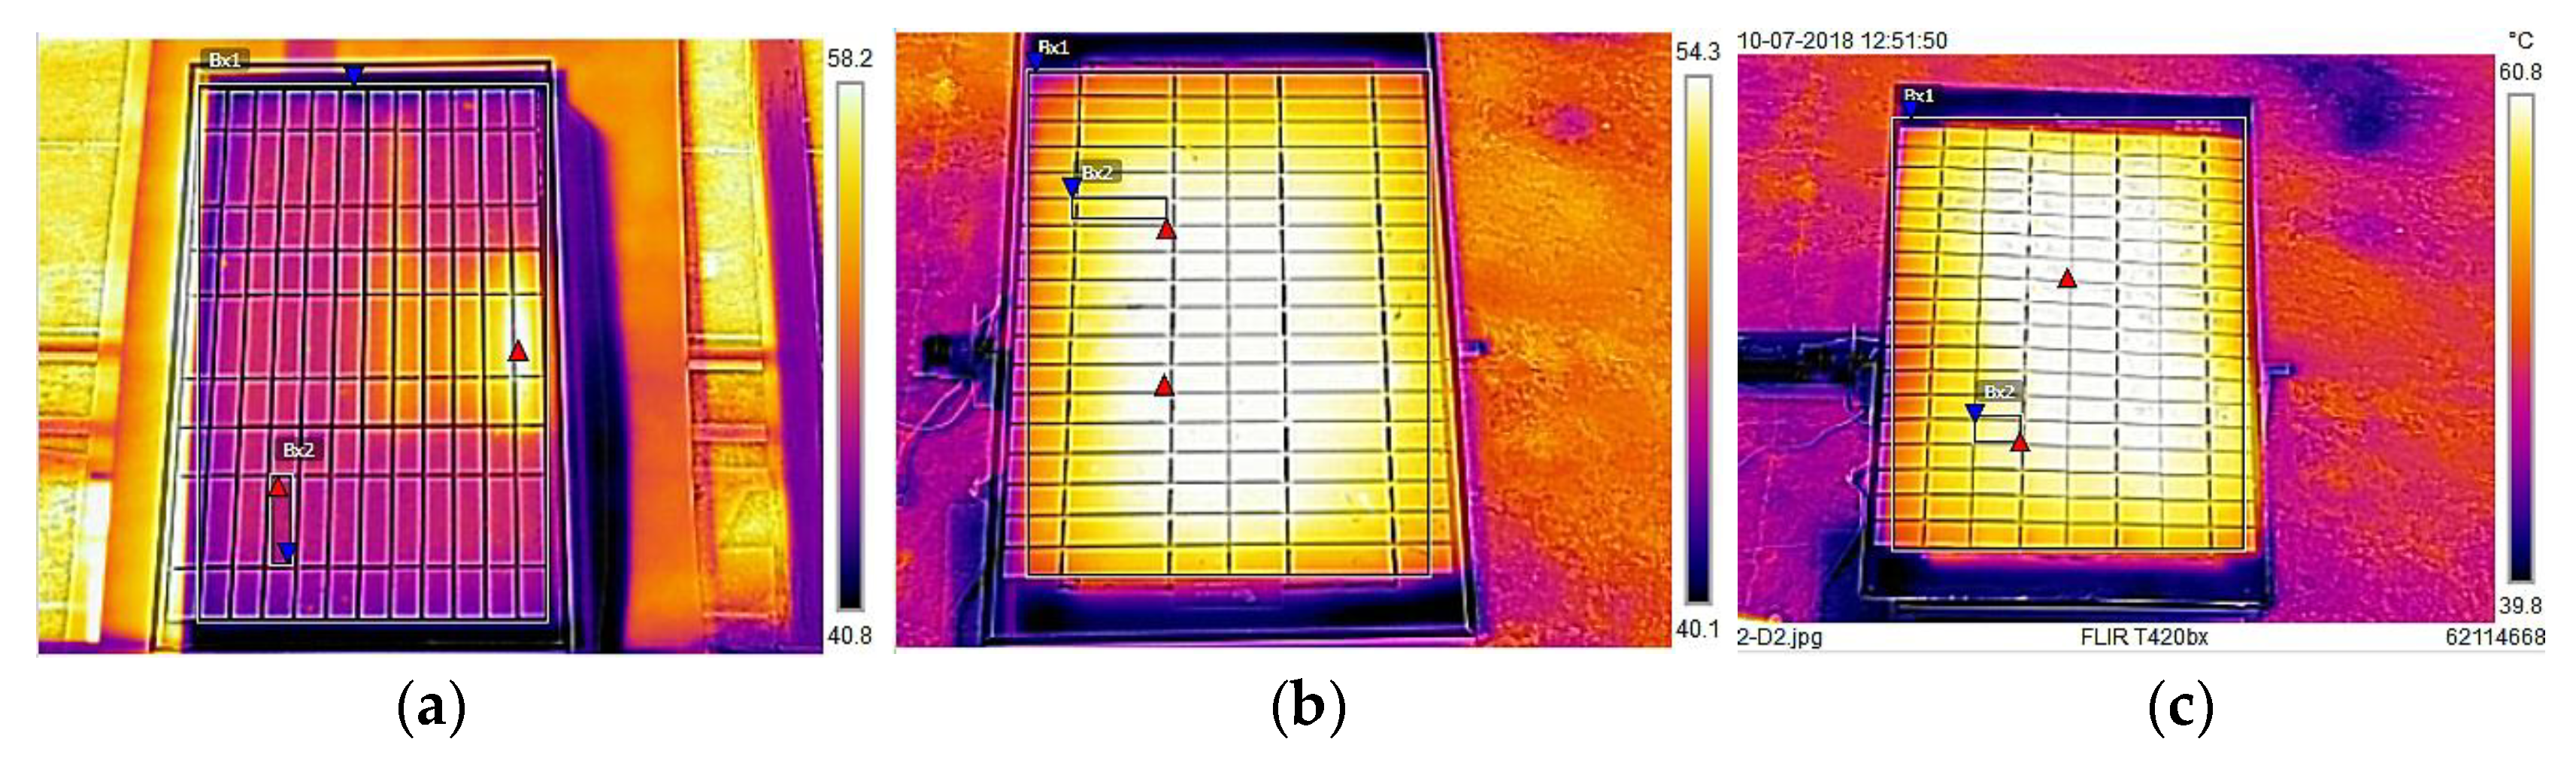
| Defects | Temperature (°C) | IEC Standard | ||
|---|---|---|---|---|
| Mean | Std | Safety Class | Power Loss Class | |
| Healthy-Panel | 48.5 | 1.24 | A | A |
| EVA discolor-panel | 55.4 | 1.82 | B(f) | C |
| Delaminated-panel | 60.72 | 3.32 | B(e) | D/E |
| Healthy-cell | 58.7 | 0.13 | ||
| EVA discolor-cell | 55.87 | 0.65 | ||
| Delaminated-cell | 61.92 | 0.76 | ||
| Pseudocode for TPC Algorithm |
|---|
| Procedure: TPC(S) Initialization: T(mxn) ← Thermal pixel matrix Tmean ← mean value of the thermal pixel matrix Tstd← standard deviation of the thermal pixel matrix Tn ← n degree variation of thermal pixel index value Tnfh ← Temperature index value for defect classification cunt_n ←0 Tmin ←Tamp, assume that minimum temperature values be the ambient temperature Initial Finding: Tmean ← based on the Equation (1) Tstd ← based on the Equation (2) WHILE n ≤ (Q = PV panel temperature difference(∆T°C)) IF T(mxn) ≥ Tmin + ∆T°C T_n(i,j) = T(i,j) count_n = count_n + 1 ELSE T_n(i,j) = 0 count_n ← pixels matrix End IF Tn average ← calculated from Equation (3) Q = N + 1 go to WHILE Tn ← calculated from the Equation (4) Tnfh ← calculated from the Equation (5) End WHILE End Procedure |
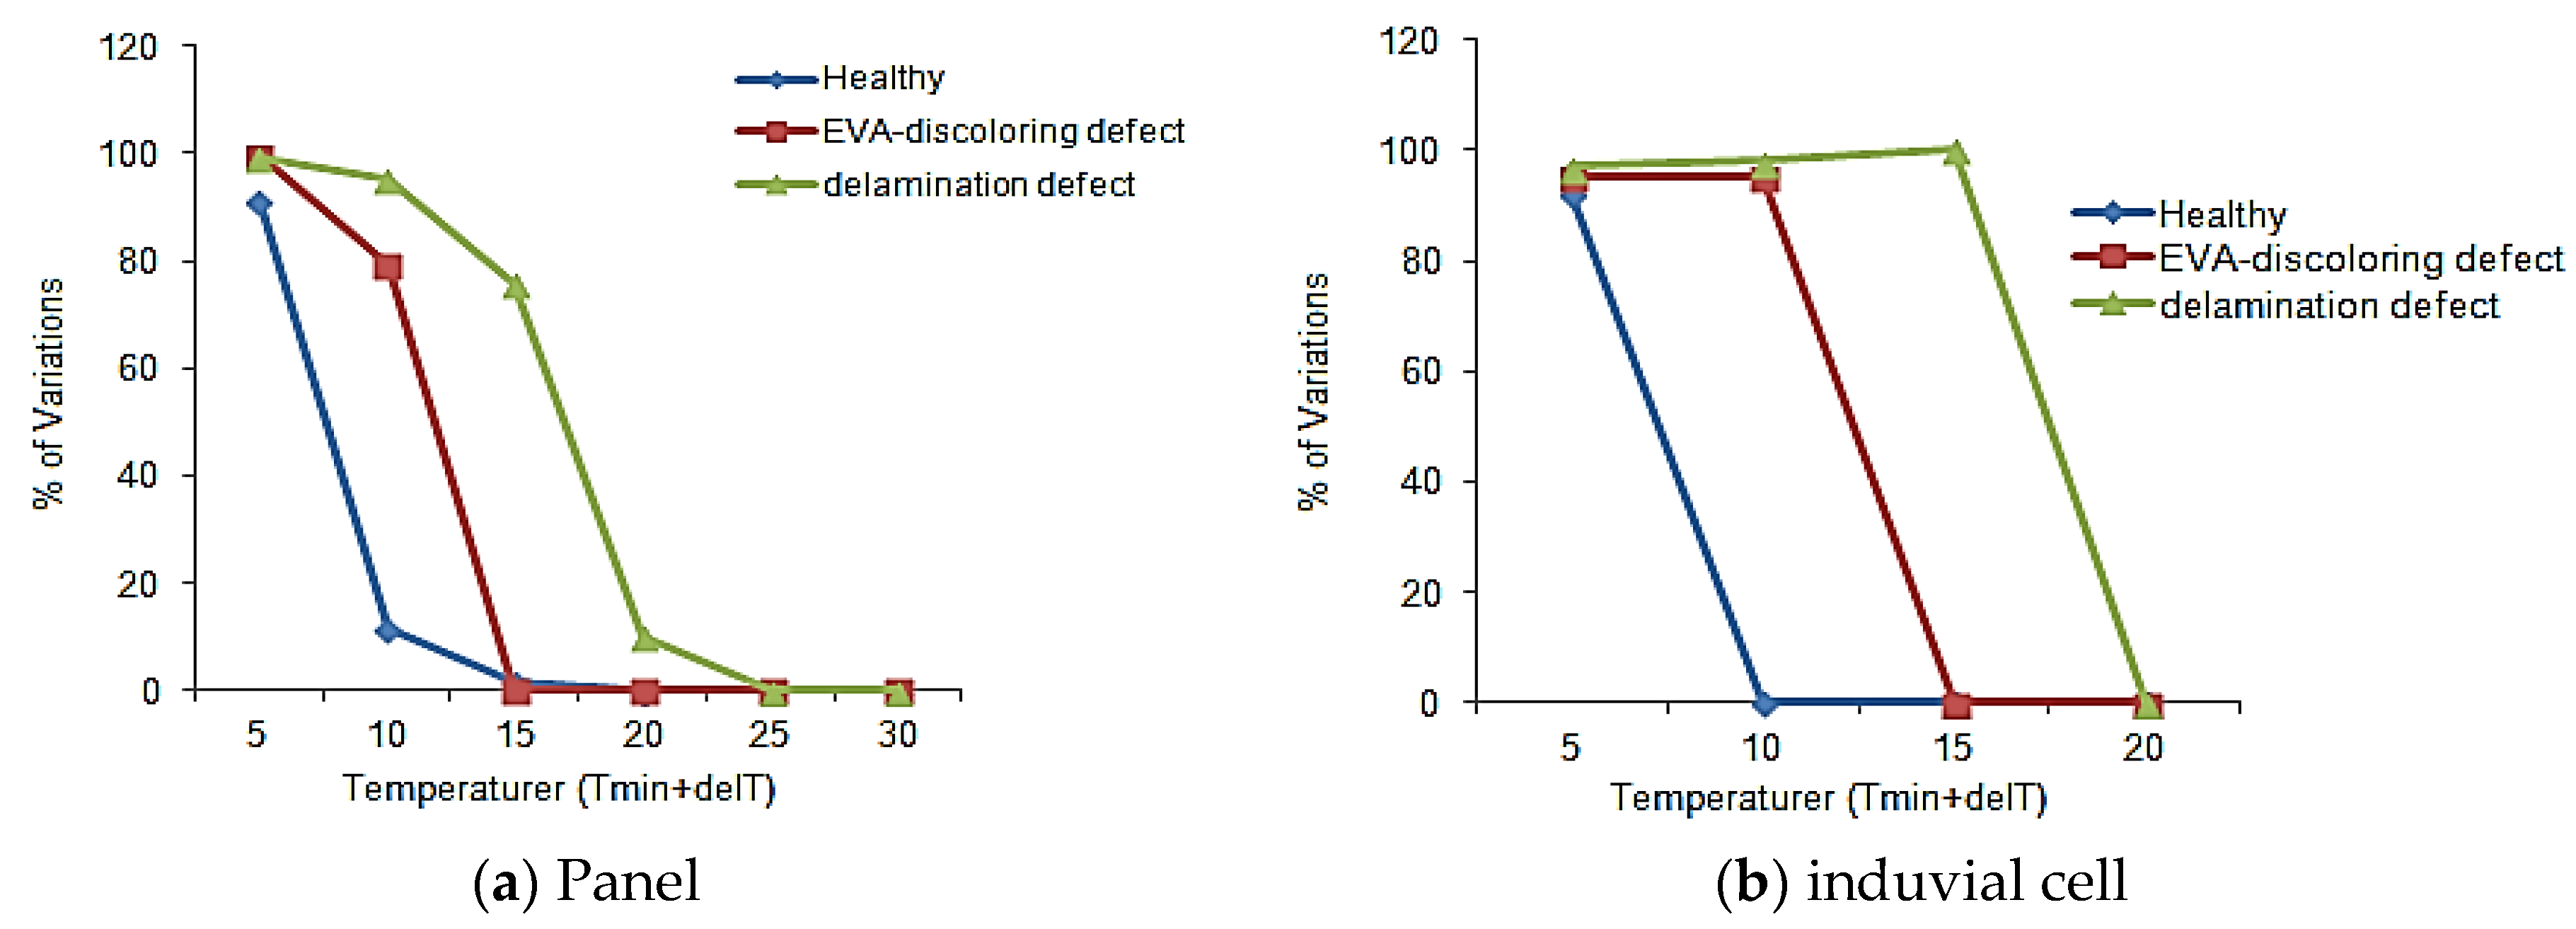
| Panel | Temperature Variation (Tmin + ΔT°C) | |||||
|---|---|---|---|---|---|---|
| 5 | 10 | 15 | 20 | 25 | 30 | |
| Healthy | 51.7 | 56.3 | 60.3 | - | - | - |
| EVA-discoloring defect | 55.5 | 56.2 | 59.2 | - | - | - |
| delamination defect | 60.9 | 61.2 | 62.5 | 64.4 | - | - |
| Cell | ||||||
| Healthy | 50.5 | - | - | - | - | - |
| EVA-discoloring defect | 55.9 | 55.9 | - | - | - | - |
| delamination defect | 61.9 | 61.9 | 61.9 | - | - | - |
| Index | Sample | EVA-Discoloring Defect | Delamination Defect |
|---|---|---|---|
| T10th = (T10-T10_healthy) | 1 | 67.80% | 83.63% |
| 2 | 60.23% | 82.12% | |
| 3 | 61.23% | 84.54% | |
| T15th = (T15-T15_healthy) | 1 | 1.23% | 74.02% |
| 2 | 2.12% | 73.56% | |
| 3 | 1.35% | 74.24% | |
| T20th = (T20-T20_healthy) | 1 | 0 | 10.24% |
| 2 | 0 | 11.26% | |
| 3 | 0 | 10.46% |
| Case | CF1 | CF2 | CF3 | CF4 | CF5 | CF6 | CF7 | CF8 | CF9 |
|---|---|---|---|---|---|---|---|---|---|
| Case 1 | 1 | 1 | 1 | 1 | 1 | 1 | 1 | 1 | 1 |
| Case 2 | 1 | 1 | 1 | 0.5 | 0.5 | 0.5 | 1 | 1 | 1 |
| Case 3 | 0.6 | 0.8 | 1 | 1 | 0.8 | 0.8 | 0.8 | 0.5 | 0.2 |
| Case 4 | 0.2 | 0.8 | 0.6 | 0.5 | 0.7 | 0.9 | 0.35 | 0.8 | 0.4 |
| Case 5 | 0.2 | 0.7 | 0.9 | 0.8 | 0.8 | 0 | 0.6 | 1 | 0.7 |
| Method | TP | FN | FP | TN | % of Accuracy | % of Sensitivity |
|---|---|---|---|---|---|---|
| Fuzzy classifier | 22 | 03 | 21 | 04 | 86 | 88 |
| Fuzzy classifier with CF | 24 | 01 | 23 | 02 | 94 | 96 |
| Neural Network | 20 | 05 | 21 | 04 | 82 | 80 |
© 2020 by the authors. Licensee MDPI, Basel, Switzerland. This article is an open access article distributed under the terms and conditions of the Creative Commons Attribution (CC BY) license (http://creativecommons.org/licenses/by/4.0/).
Share and Cite
Balasubramani, G.; Thangavelu, V.; Chinnusamy, M.; Subramaniam, U.; Padmanaban, S.; Mihet-Popa, L. Infrared Thermography Based Defects Testing of Solar Photovoltaic Panel with Fuzzy Rule-Based Evaluation. Energies 2020, 13, 1343. https://doi.org/10.3390/en13061343
Balasubramani G, Thangavelu V, Chinnusamy M, Subramaniam U, Padmanaban S, Mihet-Popa L. Infrared Thermography Based Defects Testing of Solar Photovoltaic Panel with Fuzzy Rule-Based Evaluation. Energies. 2020; 13(6):1343. https://doi.org/10.3390/en13061343
Chicago/Turabian StyleBalasubramani, Gomathy, Venkatesan Thangavelu, Muniraj Chinnusamy, Umashankar Subramaniam, Sanjeevikumar Padmanaban, and Lucian Mihet-Popa. 2020. "Infrared Thermography Based Defects Testing of Solar Photovoltaic Panel with Fuzzy Rule-Based Evaluation" Energies 13, no. 6: 1343. https://doi.org/10.3390/en13061343
APA StyleBalasubramani, G., Thangavelu, V., Chinnusamy, M., Subramaniam, U., Padmanaban, S., & Mihet-Popa, L. (2020). Infrared Thermography Based Defects Testing of Solar Photovoltaic Panel with Fuzzy Rule-Based Evaluation. Energies, 13(6), 1343. https://doi.org/10.3390/en13061343