1. Introduction
The term ‘passive buildings’ has become common nowadays. However, when this term was coined, it originally related to a building that included passive solar systems [
1] and was designed to maximize solar gains [
2]. Although the passive solar energy gains in buildings are predictable and controllable, protecting buildings against overheating is often neglected during the design process, leading to the construction of buildings with high cooling loads even in heating-dominated climates [
3] and in mild ones [
4]. This occurs because the measures to protect buildings against the risk of overheating are commonly poorly understood given the dynamicity of solar heat gains.
The lack of thermal inertia in many modern buildings exacerbates the risk of reaching too high indoor temperatures. In the case of lightweight buildings, there is no opportunity to accumulate the available exterior (solar) energy gains for later use efficiently [
5]. This is why phase change materials (PCM) that store large amounts of energy thanks to the latent heat needed for a phase change process have been proposed over the last two decades [
6].
Specific PCM algorithms have been added to various kinds of simulation tools, as the dynamic control of PCM and of their phase change process requires to be controlled dynamically. One of the largely adopted tools for PCM simulations is EnergyPlus™, which will be considered in this study, and it is briefly presented in the next section.
2. Simulation Method of Phase Changing Materials in EnergyPlus™
The first EnergyPlus™ version, including a PCM simulation algorithm, was released over a decade ago. Pedersen et al. developed an implicit finite difference thermal model of building surfaces that simulates the performance of PCM using their enthalpy law [
7]. This model has been incorporated into EnergyPlus™ and combined with the general transformation based algorithm.
In recent years, many studies have been performed on the validation and verification of the results of the EnergyPlus™ calculations using different procedures: correspondence between the measured and simulated wall surface temperatures [
8], heat flux density [
9], and internal air temperatures [
10], just to cite a few. These works did not lead to modification of the source code of the program, but only to the comparison and assessment of the reliability of the results.
The subjects of the simulation were mainly wall components with PCM. The impact of these components on thermal conditions in the simulated rooms and on the thermal properties of the entire building has been examined in previous research using fiber insulation by Kosny et al. [
11] and concrete tiles by Naraid et al. [
12]. In most cases, the authors reported a relatively strong agreement between simulation results and test data [
13,
14,
15]. In many of these studies, the authors benchmarked EnergyPlus against controlled field data [
14] and confirmed the value of this software.
Numerous simplifications are often used during numerical modeling. For example, the complex geometry of the products containing PCM is replaced with a homogeneous layer to which the enthalpy data is assigned. It is not surprising that the results of some experimental investigations performed did not find a strong agreement between the test results and the simulation ones [
16]. For example, Castell et al. [
16] evaluated software simulations in EnergyPlus™ with measurements done inside 3 × 3 × 3 m test cells in Spain. The authors suggested that the reason for the discrepancy of the results could be the inconsistency of the weather data used for calculations and the actual variable thermal conditions. Recent studies indicating strong agreement between simulation and research results in a moderate United States of America climate [
17] and in the sub-tropical one of Hong Kong [
18] confirmed that the right weather data and material data are key factors for reducing the discrepancy between simulation and test results. Lee et al. showed that the differences between experimental and predicted total heat transfer values were under 5% [
19].
The results of calculations in the EnergyPlus™ program were also compared with the results from the HEATING program [
20]. Errors in the routing of EnergyPlus™ were, hence, corrected over the years [
21]. For example, in version 8, code modifications allowed an acceleration of the calculation process and the inclusion of variable values for the thermal conductivity coefficient.
In EnergyPlus™, the calculation of the energy balance of building surface constructions is based on the conduction transfer function (CTF), but in the case of more advanced constructions, such as PCMs or variable thermal conductivity, a more flexible approach in the form of a conduction finite difference algorithm is used [
22]. Because of the implicit solution of the equation set, it is more efficient to set a time step shorter than those used for the CTF solution algorithm [
20]. Tabares-Velasco recommended a simulation time step of fewer than three minutes for a more accurate prediction of the behavior of PCM [
21]. This approach is critical to allow to fully control the dynamic changes that occur in a PCM during a phase transition. However, one of the critical elements that still remain poorly modeled is the hysteresis of PCM, an aspect that is described in the next section.
2.1. PCM Hysteresis
The hysteresis may be explained as the dependence of the state of a system on its history or the lagging of an effect behind the cause of this state. This effect applies to the phase-change phenomenon. Many researchers have already dealt with the hysteresis effect during simulation modeling, revealing the effects of this phenomenon on simulation results with real conditions [
9]. Biswas et al. [
23] conducted PCM measurements using heat-flow meter apparatus for freezing and melting cycles and used them to model different simulation scenarios both with and without hysteresis. The results showed that including the hysteresis effect significantly impacts the calculated thermal performance of the PCM layer. Barz and Sommer [
24] also confirmed that the phase transition of PCM is significantly affected by hysteresis phenomena. According to their results, the static hysteresis model and the macro kinetic models showed qualitatively consistent results.
Delcroix et al. [
25], Mehling et al. [
26], Berardi and Gallardo [
27] proved that PCM thermal features are sensitive to the testing method and stated that DSC (differential scanning calorimetry) test results are not directly applicable to building simulations as the process of charging and discharging in PCM mixed in other porous materials is hardly represented by testing samples of a few grams. In particular, Delcroix et al. [
25] and Mehling et al. [
26] analyzed hysteresis as a function of the cooling and heating rates and noticed that the hysteresis tested in DSC is low (around 1 °C) at low cooling and heating rates, while it can reach up to around 7–8 °C at higher rates that can be found in real conditions. The authors did not comment in this context on the whole volume complexity of phase change. Mehling et al. [
26] also advised adjustments to measure methods and conditions to PCM application to include the subcooling effect in enthalpy curves.
Mandilaras et al. presented a new hybrid methodology for the precise determination of the effective heat capacity and enthalpy curves of PCMs [
28]. They combined DSC testing with dynamic operated heat flow apparatus followed by the numerical optimization of the obtained experimental enthalpy curves. Fateha et al. included the hysteresis effect in their numerical and experimental investigation of an insulation layer with PCM [
29]. However, no switching between the melting and freezing curves was explored during the cycle. When using the hysteresis model for enthalpy, they were able to identify a strong agreement between measurements and simulations.
Kumarasamy et al. elaborated on the numerical schemes for the testing and simulation of encapsulated PCM with temperature hysteresis [
30]. Their results showed that encapsulation greatly altered the thermal response of PCM in terms of the phase change temperatures and hysteresis. The authors suggested that in such a case, a Computer Fluid Dynamics-based conduction-dominant scheme should be incorporated into the simulation. Moreles et al. investigated the application of PCM, considering the hysteresis of phase change and only complete phase transitions [
31]; based on a developed numerical model, a graphical method of optimized PCM selection was, hence, proposed.
All the previously discussed papers were based on former versions of the EnergyPlus™ program in which the PCM parameters did not take into account the hysteresis effect. In the simplified enthalpy–temperature function, only one curve representing both the melting and solidifying process was given. However, the latest releases of EnergyPlus™ 9.2 (released on September 27, 2019) take into account two separate freezing and melting curves with user-specified temperature data [
20]. In this algorithm, an actual value of the specific heat that is used in the simulation process is not only dependent on the current state of the PCM but also on the former state as in symbolic Equation:
where
cp is the specific heat, and
Ti is the previous and new
i-node temperature. The values of PCM thermal conductivity and density should be entered for the liquid and solid states. It should be noted that the current description of the new algorithm related to hysteresis is unclear in the program documentation, as it is not entirely clear what ‘temperature difference’ refers to in this context and which PCM data should be introduced [
20].
One of the first papers on the new hysteresis algorithm embedded in EnergyPlus™ was written by Goia et al. [
32]. Unfortunately, the hysteresis algorithm was only briefly highlighted in this paper, and the authors’ input data was not presented. The simulation results were compared against experimental data obtained from the small-scale dynamic tests performed with the heat-flow apparatus. It was expected that a new algorithm that enables modelling of hysteresis would closely follow the real mode of phase change and thus the precision of the PCM simulations. Goia et al. confirmed these expectations stating that the numerical results were significantly better than those obtained with more conventional models. However, in the case of an incomplete phase change of PCM, the obtained results were regarded as ‘questionable’.
2.2. PCM Use Efficiency
One of the basic items of technical information of PCM is the transition temperature, usually given as one specified value. It is common knowledge that the real physical course of the PCM occurs within a temperature range of a few degrees. Additionally, the transition temperature range is usually different for the freezing and melting curves because of hysteresis. The total transition from solid to liquid and vice versa does not occur when the real temperature fluctuations around the PCM and do not cover the whole range of both phase change courses. In these conditions, the large amounts of heat are neither stored nor released and the operating results of the system do not meet expectations. Berardi and Soudian discussed this aspect extensively, suggesting the use of night cooling to obtain full solidification of the melted material [
33] and reported the frequency of PCM activation and the percentage of time with full solidification.
The relatively wide phase-change temperature ranges and the thermal conditions in a room not covering this range can be the cause of only a partial solidification or melting. Such situations occur in practice when the entire transformation range goes beyond the minimum or maximum air temperature in the interior or when the time of maintaining a sufficiently low temperature is too short, and the material only partially solidifies.
In the situation of partial phase change, it is necessary for the simulation algorithm to break the initial process and switch to the second enthalpy curve without reaching the end of phase change. Moreles et al. stated that even all the numerical models tested were not fully able to replicate the behavior of PCM layers if the PCM did not melt or re-solidify completely [
31].
The transition process between the heating and cooling enthalpy–temperature curves in the case of incomplete phase change was investigated by Delcroix et al. [
34]. In their experiment, the PCM-equipped wall sample was quickly transferred from a cold to a hot environment and conversely. For the interrupted cooling process, the PCM followed an enthalpy curve that was very close to the heating curve. In the case of the interrupted heating process, PCM followed a new curve that was located between the heating and cooling curve. It was revealed that the transition process was sensitive to the actual values of the boundary conditions. In another paper, Delcroix et al. [
25] showed that varying heat transfer rates have a significant impact on the phase change temperature range and the hysteresis between heating and cooling curves. Higher rates increase the hysteresis and shift the phase change temperature towards colder temperatures. The authors suggested adjusting a PCM testing method to the perspective conditions of its application. All these results of testing and observations mean that a precise description of the material properties is difficult.
The problems highlighted above are known to people involved in PCM research, but they are poorly understood by designers or potential investors. The effective design of a building in which PCM is applied requires extensive and precise information about the material used, and second, a simulation tool that would allow effective modelling of such a phenomenon.
The introduction of the hysteresis modelling and temperature-dependent enthalpy in the EnergyPlus™ program improved the simulation capabilities of this tool. However, the above-highlighted aspect of incomplete PCM transition should be taken into account when modelling phase change phenomena.
3. New Simulation Algorithm
The hysteresis effect is usually shown in the form of two curves describing the course of the same phenomenon. The difficulty associated with modeling the hysteresis is due to the need to introduce two different functions describing the material enthalpy within the phase change range. The selection of the proper curve (
Figure 1) must be based on the history of changes and the identification of the direction of the current changes. Such an algorithm would be appropriate if it could be assumed that the phase transitions occurred in the entire volume of the material.
As outlined in the previous section, the real course of the phase changes is more complicated, and, in many cases, the process of melting/solidification is incomplete. A hysteresis algorithm should enable the direct transition from the melting curve to the freezing curve and vice versa. The concept of a ‘state’ was used by Zastawna [
35] to create a new algorithm.
Figure 2 shows the transition from the ‘cooling curve state’ to the ‘heating curve state’ defined as the occurrence of the third kind of state called the ‘transition curve state’. The states are represented by the colors: blue—cooling curve; red—heating curve; purple-transition curve.
When the cooling phase of the completely melted material has begun (curve 0–1–2,
Figure 2a) and before the phase change starts (point 2), the heat is released in a sensible way. After the phase change process has started, the energy is released in both latent and sensible ways (curve 2–3). At this point (point 3), the heating of the material begins again. Thus far, the enthalpy value follows the cooling curve state. The re-start of heating results in the termination of the cooling curve state and the start of the transition curve state (curve 3–4). For the transition curve, the enthalpy value is determined from either the heating curve or the cooling curve.
Rose et al. [
36] suggested an instantaneous transition between the curves and a horizontal movement of the state until it reaches either the melting or solidifying curve. Bony et al. [
37] assumed a sloped transition curve between the heating and cooling curves but a horizontal transition for the sub-cooling effect. Any change in the system temperature during the transition phase should obviously be associated with a change in enthalpy. The method of transition in the form of a horizontal line adopted in the article is a simplification.
While the hysteresis curves can be measured, the shape and slope of the transition curve are completely unknown, and experimental data are not available as they depend on many parameters, including the current entropy value. Curves describing the full transformation hysteresis are also a kind of idealization of this phenomenon and only describe it in an approximate way. Among others, heating and cooling curves are not usually parallel to each other, so any decision regarding the transition curve slope would always be approximate. Because the impact of simplification in the form of a horizontal transition line is small, and because of this, the modeling algorithm becomes significantly simpler, it was decided to use a horizontal transition curve in the model.
At point 4, the process of melting of the partially solidified material restarts. At this moment, the transition curve state ends, and the heating curve state will restart (curve 4–5 in
Figure 2b). After completion of the phase change, the material again accumulates heat only in a sensible way (curve 5–1) while remaining in the heating curve state.
Equivalent specific heat of a PCM in case of the heating curve is calculated in the following way:
where
is the heating enthalpy of a discrete node ‘
i’ at a time-step ‘
j’ (and respectively ‘
j − 1’) [J/kg]. In the same way for the cooling curve:
where
is the cooling enthalpy of a discrete node ‘
i’ at a time-step ‘
j’ (and respectively ‘
j − 1’) [J/kg].
For the transition from cooling to heating curve 3–4, Equation or, if
then:
where
is the transition enthalpy, taken from transition curve and
If
then
For the transition from heating to cooling curve 4–3, Equation or, if
then:
and
If
then:
Appendix A shows the data that should be entered into the newly created PCM hysteresis algorithm. Each temperature corresponds to two enthalpy values separately for the heating and for the cooling curves.
4. Results
To assess the correctness of the new EnergyPlus™ algorithm, the simulation results have been compared to the results of measurements conducted in the climate chambers shown in
Figure 3. A wall, located between the warm and cold chamber, was made of 15 cm expanded polystyrene covered with the standard gypsum panel on the warm side. Two material samples were glued to the gypsum panel. One of them was a modified gypsum panel (50 × 60 cm) containing 30% by mass of PCM Micronal. The second one was a reference standard gypsum panel of the same size and thickness (12.5 mm) as the PCM panel. The principle of the presented research was based on a comparison of surface temperature fluctuations and energy accumulation in the PCM and the reference standard samples. In this way, the authors wanted to examine the efficiency of the added PCM wall cladding as a form of overheating protection in a hot summer environment.
The melting temperature of the PCM panel, as declared by the manufacturer, was 23 ℃.
Before the experiment, a sample of PCM was tested in the calorimeter DSC214 (Polyma–Netzsch), and measured latent heat was equal to 127.7 J/g. The PCM 23 effective phase change temperature range measured was very wide: 17.8 °C ÷ 31.5 ℃. Both gypsum boards were initially tested for thermal conductivity using the Laser Comp Fox 314 plate apparatus. The tests were performed for different temperature ranges referring to the melting temperature of PCM. In the first case, the average temperature below the phase change temperature range was adopted and the value of thermal conductivity λ was 0.159 W/mK. In the second case, only a part of the material was in the liquid state (the temperature of the heating plate was 40 °C and the cooling plate was 20 ℃). In these conditions, the λ-value was equal to 0.162 W/mK. In the third case, the temperature of both plates exceeded the phase change value, so all the PCM material contained in the tested plate was in the liquid state during the test, and the λ-value was equal to 0.164 W/mK. The observed small differences in the thermal conductivity coefficients (max. 2.8%) can be treated as negligible and were not included in further analysis.
Three temperature sensors were placed on the surface of both gypsum panels (K-type thermocouples, measurement class 2, sensors attached to the surface with adhesive paper tape). The heat flow on both surfaces of the sample plates was measured by means of Ahlborn 118SI silicone heat-flow transducers (sensor size 120 × 120 mm), measurement class A. Air temperature was measured by means of the Pt 100 and Pt 1000 sensors, measurement class B, protected with an aluminum foil against thermal radiation. All the measurements and data recording were performed by the Ahlborn Almemo 5690 data acquisition system and the Data-Control 4.2 program.
Temperature fluctuations in the warm chamber corresponded to the conditions that occur in a room during a hot summer day. However, the technical capabilities of the control system only allowed stepped (non-continuous) changes. Four testing cycles were conducted as reported in
Table 1.
The temperature in the warm chamber was gradually changing during the daily cycle within the range 18 ÷ 37 ℃. The daily maximum temperature was maintained for 4 hours at the same level, which was long enough to enable the phase change in the whole volume of PCM. During the whole night, a constant temperature of 18 ℃ was maintained in the chamber; therefore, after each cycle, it was possible to discharge the total amount of energy stored in the tested materials during the day to the surrounding environment. The air temperature in the cold chamber was maintained at a constant 18 ℃ in two tests, and in the other two tests, it was variable in a similar way as was the case in the warm chamber. The last two cycles were close to the conditions that occur during hot summer days. A simulation model of the climate chambers with the sample wall between the chambers was created in the EnergyPlus™ software. As in the real conditions, the modeled wall consisted of a 15 cm layer of expanded polystyrene and gypsum board, to which a layer of phase-changing material was attached. It was assumed that the conditions of heat exchange between the outer shell of the chamber and the surrounding environment were adiabatic. A dynamically changing cycle of air temperature inside the warm chamber was assumed. This was consistent with the cycle of the experimental measurements. The same model was used as the reference variant of the standard gypsum board.
Measured and calculated temperature fluctuations during one selected day of cycle 0129 are presented in
Figure 4. The red curve shows the daily internal air temperature cycle that was a driving force of the fluctuations and the boundary condition both in the experiment and the simulation.
The scheduled maximum temperature of 36 ℃ was maintained for more than three hours. The curves obtained from numerical calculations and the measurements were, in general, very close to each other, with the exception of the surface temperature of the reference gypsum plate. The relatively low thermal capacity of the standard material in which heat is stored only in a sensible way resulted in a significantly higher temperature of the gypsum surface when the internal air temperature was rising and much lower temperature during the cooling stage. The gypsum plate cooled quicker than the PCM. The results of the simulation by means of both algorithms (with and without the hysteresis effect) fit perfectly with each other and very closely followed the measurements during the heating stage. This means that the enthalpy characteristic introduced to the simplified algorithm without hysteresis followed the heating curve of the PCM.
As could be expected, significant discrepancies may be observed during the cooling stage, when the solidification process starts. Within the wide range of phase change, but still, before the phase change temperature declared by the producer (23 ℃) was reached, the model without hysteresis (orange curve) showed a surface temperature higher than the other models due to the single characteristic curve. The new model that takes into account the effect of hysteresis closely followed the measured values. Below the phase change temperature, this relationship was reversed.
Figure 5 shows the heat flux values on the internal surface of the PCM board obtained from measurements and computer simulations. One simulation was conducted on the model without taking into account phase change hysteresis and the second one with this effect. The cycle begins with the discharge phase of the wall’s thermal capacity (negative flux value). Then, as a result of the internal temperature increase in the tested space, heat flux released from the wall decreased, and then the process of recharging (plus flux value) began. The significant differences between both simulation models may be noticed in the second phase of the research cycle, especially in cooling mode. The maximum instantaneous heat flux value was high and equal to 62 W/m
2. During the whole measuring period, the PCM panel accumulated around 180 Wh/m
2.
To assess the accumulation efficiency of the PCM board,
Figure 6 shows the results of measurement and simulation of heat flux on the internal surface of the reference gypsum board. The heat exchange on the surface of the standard panel took place according to a similar scenario as before, but the instantaneous heat flux values were definitely lower. In the case of material without phase change, the graph obtained from the simulation was very close to the measurement results. The maximum momentary heat flux value was, in this case, equal to 32 W/m
2 and accumulated during the whole cycle amount of energy was only 36 Wh/m
2.
During the full phase transition cycle, the entire volume of PCM material could accumulate 5 times more energy than a standard material of the same volume. The application of PCM wall panels substantially enlarged the storage capacity of the wall and also enabled a decrease in cooling power demand. All these measures support the improvement in space thermal comfort.
6. Conclusions
Numerous experimental tests confirmed that the hysteresis of the phase change process has a noticeable effect on heat accumulation in PCM. It is, therefore, necessary to include this phenomenon in commonly used simulation programs. This article presented the principles of a novel EnergyPlus™ simulation module, which enables the hysteresis effect of phase change in building materials to be taken into account.
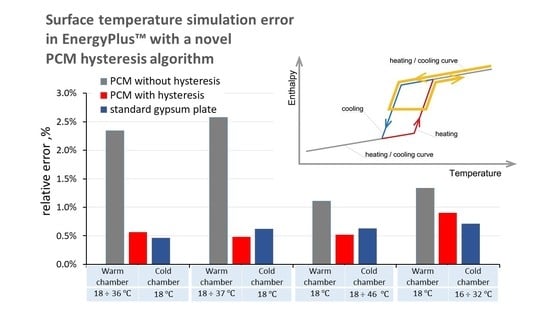
In the developed algorithm, apart from the basic difference associated with a different course of the heating and the cooling phenomenon of the material, it is possible to model an incomplete phase change too. This feature of the algorithm seems to be a unique and important aspect of the developed algorithm because incomplete transition quite often appears in the practical applications of PCM and adversely affects the achieved energy effects. The verification of the new calculation module confirmed its usefulness in simulation analyses. The relative calculation error of surface temperature was less than 1%, while in the case of the simplified model without hysteresis, the simulation error would be even a few times higher. We conducted experimental research and created a simulation model that confirmed the practical effects of PCM application as a passive measure of overheating protection. The addition of 30% phase changing material to the gypsum board increased its effective heat capacity several times and doubled the maximum cooling power of PCM wall cladding.
However, the practical effects of PCM application are often much lower than the expectations associated with them. This may be related to several factors that are poorly understood by building designers. One of these is the phase change temperature, declared by the material manufacturer as a specified numerical value, while in reality, the transformation process covers a temperature range of a few degrees. The incomplete phase transition is largely related to the fact that the phase change does not take place at one temperature but in a fairly wide temperature range. Effective phase change temperature ranges of the PCM 23 applied in this research, measured in the DSC apparatus, was 17.8 ℃–31.5 ℃. As a result, the heat capacity of PCM can be only partially used. Another reason for poor performance is an insufficient temperature fluctuation or too short a heating or cooling stage, during which the material is not fully charged or discharged.
Both experimental tests in the climate chamber, as well as simulation analysis, confirmed the effectiveness of PCM enriched gypsum board as an energy accumulator.


