Article

Effect of Injection Strategies in Diesel/NG Direct-Injection Engines on the Combustion Process and Emissions under Low-Load Operating Conditions

State Key Laboratory of Engines, Tianjin University, Tianjin 300072, China
*
Author to whom correspondence should be addressed.
Energies 2020, 13(4), 990; https://doi.org/10.3390/en13040990
Submission received: 13 January 2020 / Revised: 19 February 2020 / Accepted: 21 February 2020 / Published: 22 February 2020

Abstract

:
The direct injection of natural gas (NG), which is an important research direction in the development of NG engines, has the potential to improve thermal efficiency and emissions. When NG engines operate in low-load conditions, combustion efficiency decreases and hydrocarbon (HC) emissions increase due to lean fuel mixtures and slow flame propagation speeds. The effect of two combustion modes (partially premixed compression ignition (PPCI) and high pressure direct injection (HPDI)) on combustion processes was investigated by CFD (Computational Fluid Dynamics), with a focus on different injection strategies. In the PPCI combustion mode, NG was injected early in the compression stroke and premixed with air, and then the pilot diesel was injected to cause ignition near the top dead center. This combustion mode produced a faster heat release rate, but the HC emissions were higher, and the combustion efficiency was lower. In the HPDI combustion mode, the diesel was injected first and ignited, and then the NG was injected into the flame. This combustion mode resulted in higher emissions of NOx and soot, with a diffusion combustion in the cylinder. HC emissions significantly decreased. Compared with PPCI combustion, HPDI had a higher thermal efficiency.

1. Introduction

In recent decades, road traffic emission legislation has become the main driving force in the development of internal combustion engines. Transportation accounts for approximately 20% of global carbon dioxide emissions that result from the burning of fuel, of which 80% comes from road vehicles [1].
Natural gas (NG) is a low-life-cycle carbon fuel and has been used in engines for a long time due to its cost effectiveness. However, there are a lot of combustion problems that limit spread application. The lower laminar flame velocity is the intrinsic difficulty in combustion organization in engines. Engine performance using NG is characterized by low efficiency, high exhaust gas temperatures, and high methane emissions, which is problematic from the point of view of greenhouse gas emissions.
Engines with pilot ignition diesel and port injection NG exhibit a number of problems, such as low NG substitution rate, incomplete combustion, high emissions of unburned hydrocarbons (UHC) under low-load conditions, and proneness to knock or combustion deterioration under high-load conditions [2]. The direct injection of diesel/NG, which achieves the stratification combustion of the fuel mixture, can improve combustion performance and reduce UHC emissions and engine knock.
The first NG direct injection engine was successfully investigated in 1998 [3]. It showed that when the excess air coefficient is 1.65 with the throttle opened wide, brake specific fuel consumption (BSFC) can be reduced to 190 g/kWh and brake thermal efficiency to 37% through a test of stratified thin combustion [4,5]. Munshi et al. found that homogeneous charge compression ignition (HCCI) in the medium-load and low-load conditions and homogeneous charge direct injection (HCDI) in the high-load conditions could effectively reduce emissions without the deterioration of combustion efficiency [6]. A single-cylinder model was established and then the combustion and emission characteristics of five different injection rate shapes were analyzed, showing that The trapezoid and wedge shapes achieved a good balance between fuel consumption and emissions [7]. It has been investigated that many NG engine technologies could effectively influence the performance of NG engines, such as the adjustment of the substitution rate of NG in the dual-fuel engines [8], the sequential port injection of NG, diesel pilot ignition, and lean combustions, and obtained high thermal efficiency [9,10].
The widely use of NG is expected to accelerate in the coming years due to the stringent regulations on liquid-fuel-based engines and the crisis of the global energy and environment [11]. So natural gas has been playing a significant role in reducing the pressure in recent trends [12].
To investigate the influence of NG injection timing on the combustion and emissions under low-load operating conditions, an HPDI combustion strategy (diesel injected first and then NG) and a PPCI combustion strategy (NG injected first and then diesel) were investigated by a numerical simulation. The aim was to understand in detail the influence of different combustion mode on thermal efficiency and emissions.

2. Materials and Methods

2.1. Model Description

The research prototype is an HPDI dual-fuel engine of Westport New Energy Co. Ltd. Based on the three-dimensional simulation software CONVERGE, the combustion process in the cylinder of a direct injection engine is numerically simulated. This software is developed by American CSI company. Because of the creative innovation in grid technology, it realizes adaptive mesh refinement (AMR) in the process of simulation computing, which greatly improves the computing efficiency. The main parameters of the numerical simulation of the engine combustion process are shown in Table 1. In this model, nine injector orifices are arranged symmetrically, and a 1/9 combustion chamber model was selected as the research object for modeling to improve computational efficiency, since the whole model is symmetrical and can be divided into nine equal parts.
The initial temperature of the NG is 303 K. The NG is composed of methane (CH4, accounting for 91%) and ethane (C2H6, accounting for 9%). The inlet temperature is 363 K and the inlet pressure is 1.6 bar. The fresh air is composed of nitrogen (N2, mass accounting for 76.7%) and oxygen (O2, mass accounting for 23.3%).
The total number of grids in the combustion chamber varies at different times due to the use of adaptive mesh refinement technology. Figure 1 shows the grid division of the NG injection and diesel injection stages. The maximum mesh number of this model is 407485.
In the calculation, n-heptane was used as the surrogate fuel for diesel, and methane and ethane were used as the surrogate fuel for the NG. Table 2 shows the selection of the sub-models for the CFD numerical simulation.
The primary focus of this paper is the influence of fuel injection strategies in HPDI and PPCI combustion modes on the combustion process and emissions under low-load conditions. The load is about 0.25 MPa, represented by gross indicated mean effective pressure (IMEPg, with the pumping loss not involved). The injection strategy in the HPDI combustion mode is to inject diesel first and then NG. The diesel injection timing is 15°CA BTDC, and the NG injection timing is 0°15° CA BTDC. NG is injected before diesel in the PPCI combustion model. The diesel injection timing is 10° CA BTDC, and the NG injection timing is from 10° to 20° CA BTDC. A control group that reduced the NG injection pressure and diesel injection pressure to 10 MPa with other parameters unchanged was established to investigate the influence of injection pressure on the combustion between the HPDI and PPCI. The specific parameters are shown in Table 3.
Generally speaking, the combustion boundary conditions refers to the parameters related to temperature boundary and speed boundary.
During the whole combustion process in the cylinder, the temperature boundary is usually defined as the constant temperature boundary condition, which mainly includes the boundary temperature of the cylinder wall, the bottom of the cylinder head and the top of the piston. The values in this paper are 450, 500 and 500 K respectively. The boundary condition of velocity is generally defined as: the cylinder wall and the cylinder head are stationary during the whole process, so the velocity of both is set at 0, and the moving velocity of the top of the piston is defined as the moving velocity of the piston.
Based on the above information, the boundary conditions of this working point, which are used to verify the validity of the model, are summarized as shown in Table 4.

2.2. Validation of the Model

In order to verify the accuracy of the parameters set in the above model, the jet model, cylinder pressure and heat release rate were calibrated.
In order to verify the accuracy of the gas injection state of the model, the model of free jet and the model of wall-impingement jet of NG injection were firstly calibrated. For the process of free jet, experimental data from Columbia University in Canada were selected to carry out relevant calibration experiments for the penetration distance [22]. Aiming at the process of wall-impingement jet, the subject chose the wall-impingement jet experiment of Aalto University of Finland to calibrate wall-impingement jet process of NG in the cylinder [23]. Then their correctness was validated. Table 5, Figure 2 and Figure 3 respectively show the validation parameters, calibration results of the free jet model and wall-impingement jet model.
At the same time, a six-cylinder HPDI engine from Westport research, Canada was simulated. Under the working condition of 1000 rpm and brake mean effective pressure (BMEP) ≈ 12 bar, fuel injection, fuel mixing with fresh air and the combustion process of mixture was completed, and the obtained numerical simulation results were checked with the experiment data of Westport company. Table 6 and Figure 4 respectively show the experimental data of cylinder pressure and heat release rate, as well as the calibration parameters and calibration results of numerical simulation. It can be seen from the curve that, ignoring some minor differences, the simulation results agree well with the experimental data, and it can be considered that the simulation model has certain reliability.

2.3. Definition of Thermal Efficiency

According to the first law of thermodynamics of an open system, the energy balance on the time interval between the actual closing of the intake valve and the opening of the exhaust valve can be expressed as:
Q comb Q fuel + Q exh Q fuel + Q HT Q fuel + W i - g Q fuel = 100 % .
In the equation, Qcomb is the combustion energy loss (CL) due to the incomplete combustion of CO and unburned hydrocarbons (HCs), Qexh is the exhaust energy loss (EL), QHT is the heat-transfer loss (HTL), Wi–g is the net work during the compression and expansion strokes, and Qfuel is the total energy of the fuel in a cycle, equal to the product of the cycle fuel mass and the lower heat value. The CL is defined as:
CL = Q comb Q fuel ,
where Qcomb equals the unreleased heat value of incomplete combustion of CO and hydrocarbons (HCs). The unreleased reaction heat of HCs can be approximately calculated by the product of the mass of HC and the lower heat value of the diesel fuel. The unreleased reaction heat during CO production is calculated according to the reaction heat difference between CO2 and CO. HC and CO are measured using an exhaust gas analyzer. EL is defined as:
EL = Q exh Q fuel = Q out Q in Q fuel ,
Q out = i n i · H i ,
Q in = j n j · H j ,
and Qin and Qout in the Equation (3) represent the energy inflow and outflow of the system respectively, ni is the intake mass of each component, Hi is the specific enthalpy of each intake component, nj is the exhaust mass of each component and Hj is the specific enthalpy of each exhaust component. The HTL is defined as:
HTL = Q HT Q fuel ,
where QHT is calculated with the Sitkei formula [24]. The gross indicated thermal efficiency (ITEg) is defined as:
ITEg = W i - g Q fuel .

3. Results

3.1. HPDI Combustion Mode

The HPDI combustion mode is achieved by setting the NG injection timing after the pilot ignition diesel injection timing. With this injection strategy, diffusion combustion plays the main role in the cylinder, where the flame is generated at the junction of diesel and NG and then gradually spreads to other parts.

3.1.1. Influence of NG Injection Timing on the Combustion Process

The diesel injection timing is 15° CA BTDC. The NG injection timing varies from 0° to 15° CA BTDC. As shown in 
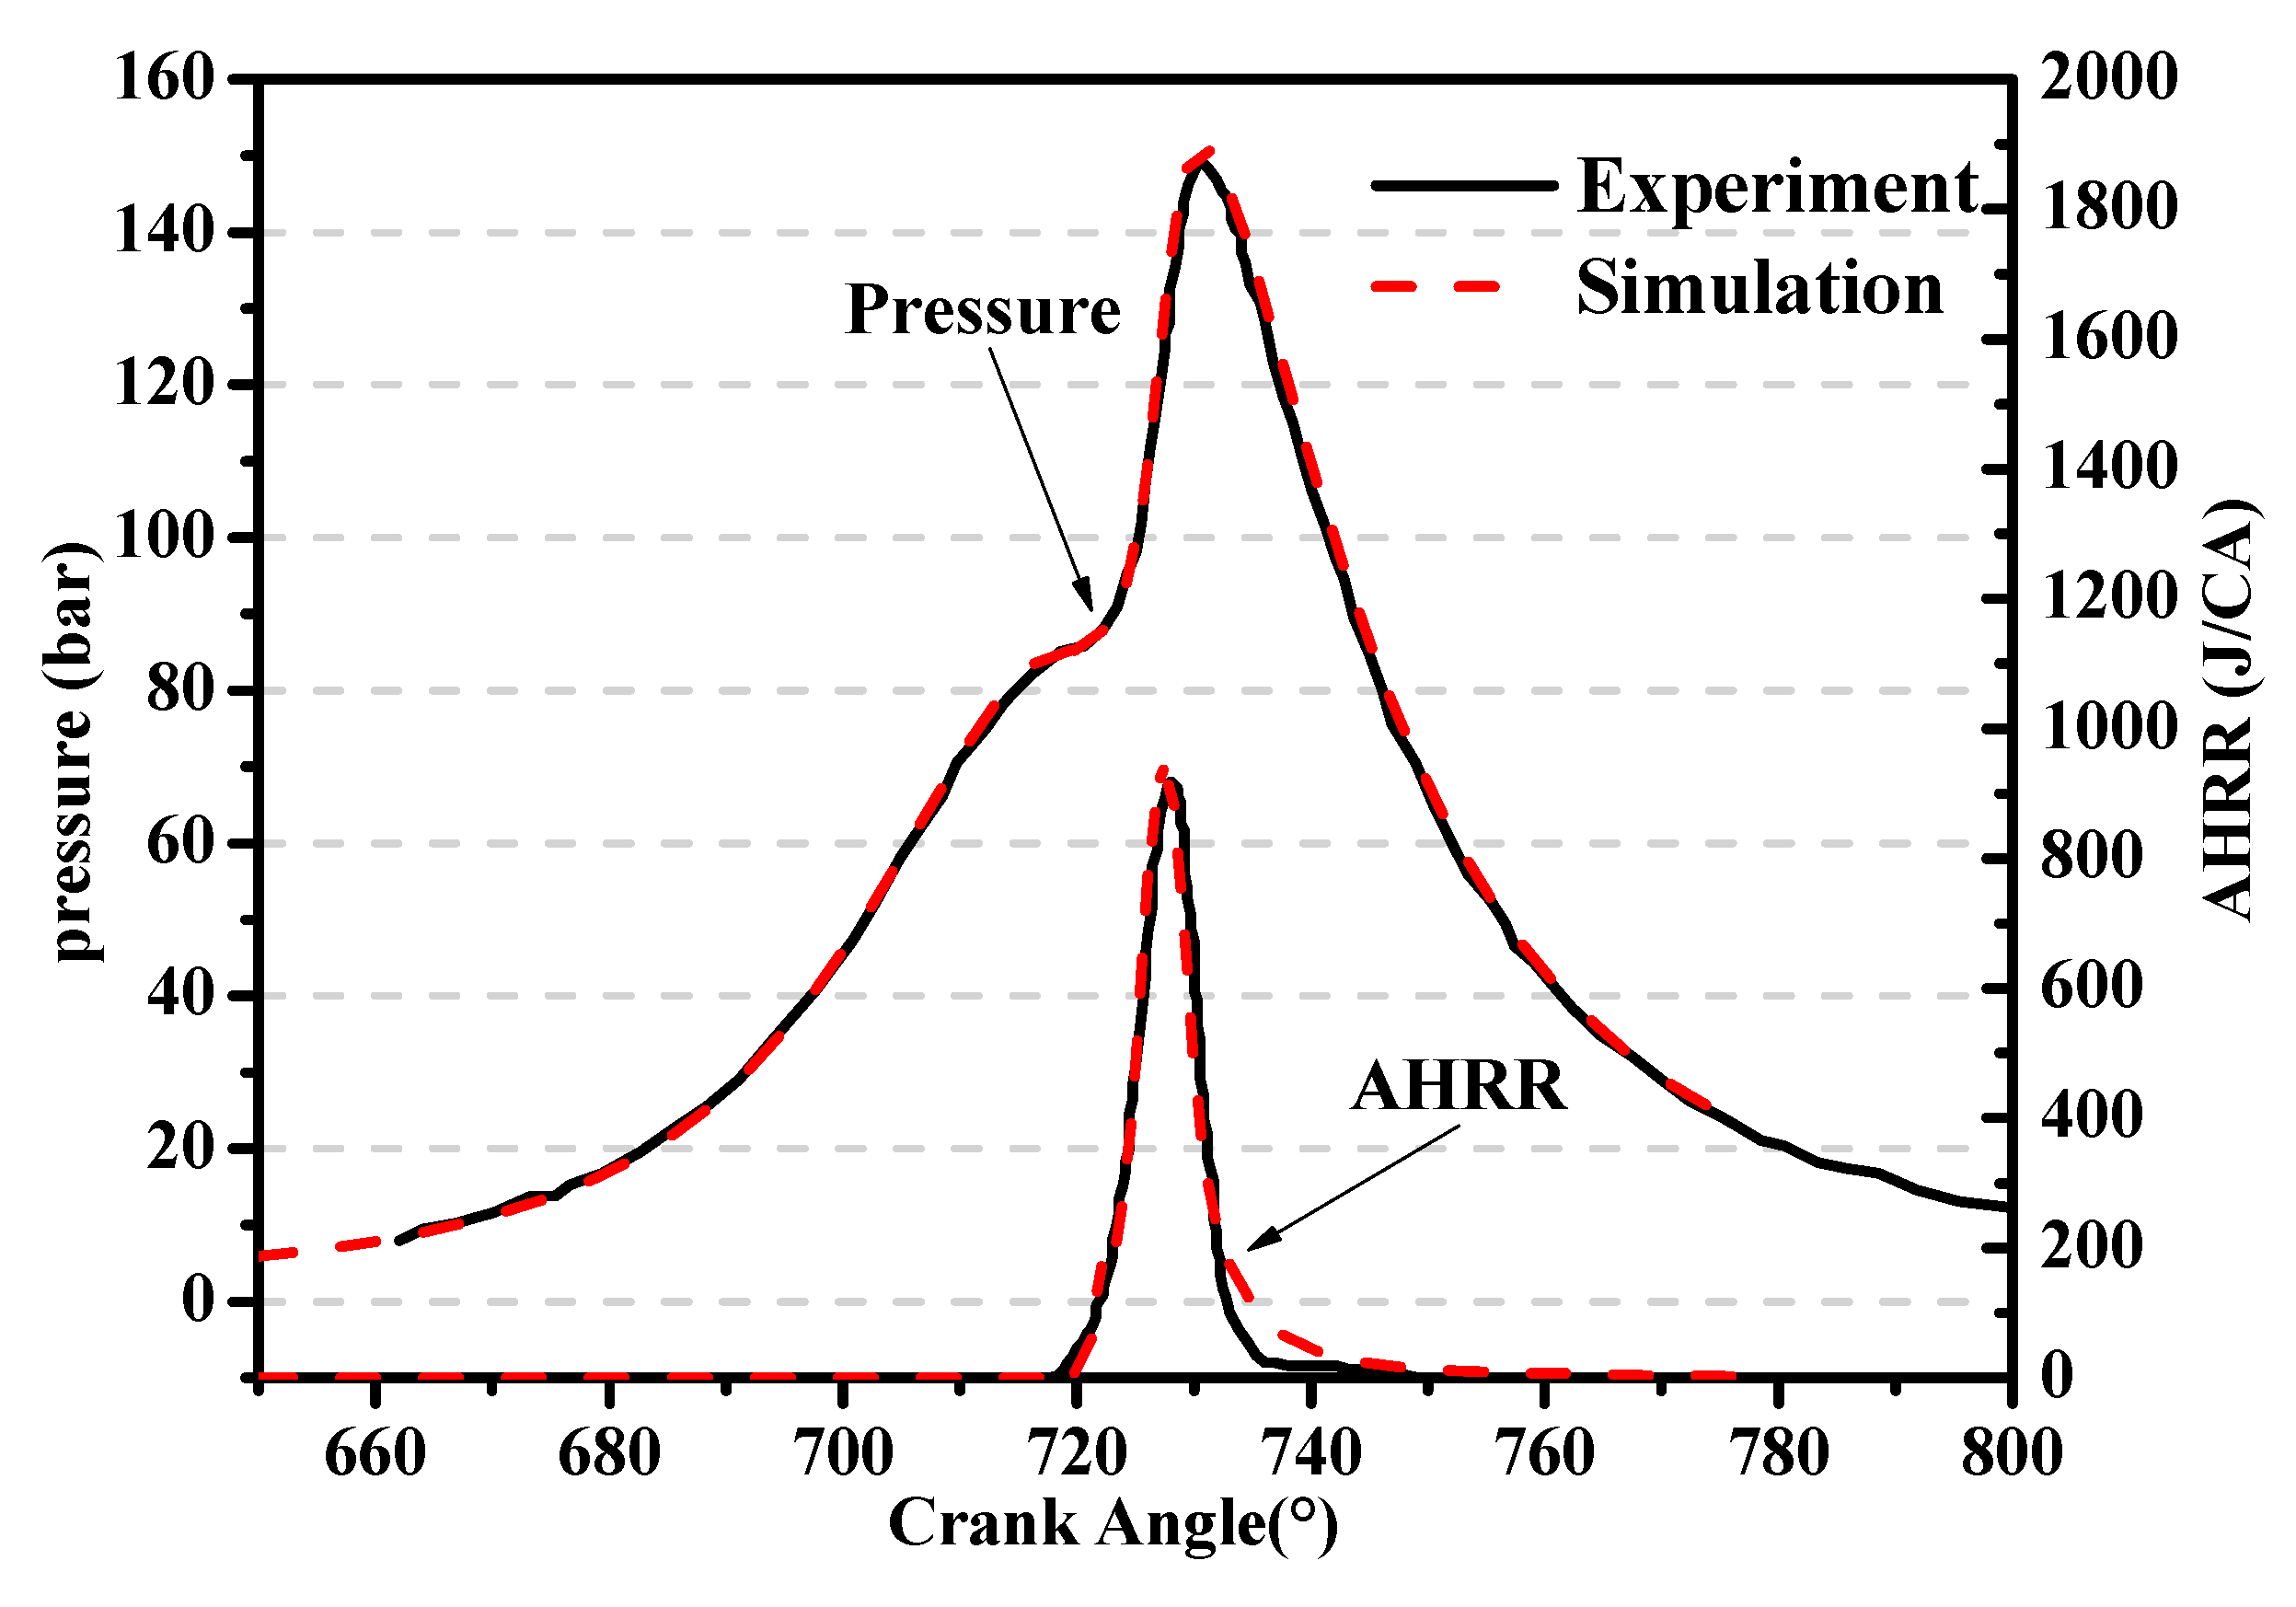
Figure 5, the heat release rate has two peaks, namely, pilot ignition diesel and NG, with the NG injection pressure of 30 MPa. When the NG injection timing is 15° CA BTDC, the ignition timing is delayed and combustion heat release slowed down significantly. When the NG injection timing is 12.5° CA BTDC, only one relatively high peak exists. With the gradual delay in the NG injection timing, the NG heat release peak gradually differs from the diesel heat release peak and delayed, and the peak shows a continuous increase. When the NG injection timing delays to 0° CA BTDC, only the heat release peak of diesel exists.
The premature NG injection obstructs the mixing and spontaneous combustion of diesel and air, delaying the combustion process. When the diesel reaches conditions suitable for a spontaneous combustion, the NG has already diffused in the cylinder, and the equivalent ratio is very thin. The NG near the combustion chamber wall or in the clearance is difficult to ignite, reducing the heat release. When the timing of NG injection is 12.5° CA BTDC, a simultaneous heat release for diesel and NG is realized. At the initial stage of the heat release from diesel, the heat release rate is slightly lower than that caused by the spontaneous combustion of diesel affected by NG, but the heat release rate is greatly increased after the ignition of NG. Because of the delay in the NG injection, the peak moves backward until it is too late to be ignited by diesel. The change in the heat release peak of NG is related to the flame propagation rate of diffusion combustion. The earlier the gas is injected, the higher the degree of diffusion combustion, and the slower the flame propagation.
Figure 6a,b shows the evolution of in-cylinder average pressure and temperature, respectively. The in-cylinder average pressure and temperature of SOIgas ranging from 2.5° to 10° CA BTDC at the initial stage are basically the same as those of SOIgas at 0° CA BTDC. After the NG is ignited, they rise successively and converge again around 15° CA BTDC.
When SOIgas is varied from 0° to 10° CA BTDC, diesel releases heat first, and the in-cylinder average pressure and temperature rise again due to the NG combustion. When SOIgas is 12.5° CA BTDC, diesel and NG are burned simultaneously, and the temperature and pressure rise rapidly. Diesel and NG are injected at the same time when SOIgas is 15° CA BTDC; as the diesel injection duration is 1.64° CA, the NG injection duration is 4° CA. The jet flow of the NG blows and disturbs the mixture of diesel. Thus, the pilot combustion diesel does not burn at once when the two fuels are injected at the same time; the in-cylinder temperature and pressure remain low until they are near the TDC and then slightly increase due to combustion.
Figure 7 shows the in-cylinder equivalent ratio at CA10, CA50, and CA90. CA10 is defined as the crankshaft angle corresponding to the moment that combustion heat release accounts for 10% of the total heat release in a cycle, while CA50 and CA90 are similarly defined as crankshaft angles of 50% and 90%. With the advance of SOIgas, the in-cylinder equivalent ratio first increases and then decreases around CA50. When the NG injection timing is around 7.5° CA BTDC, a significant local concentration area of the mixture will be generated, which could be a major source of soot emission.
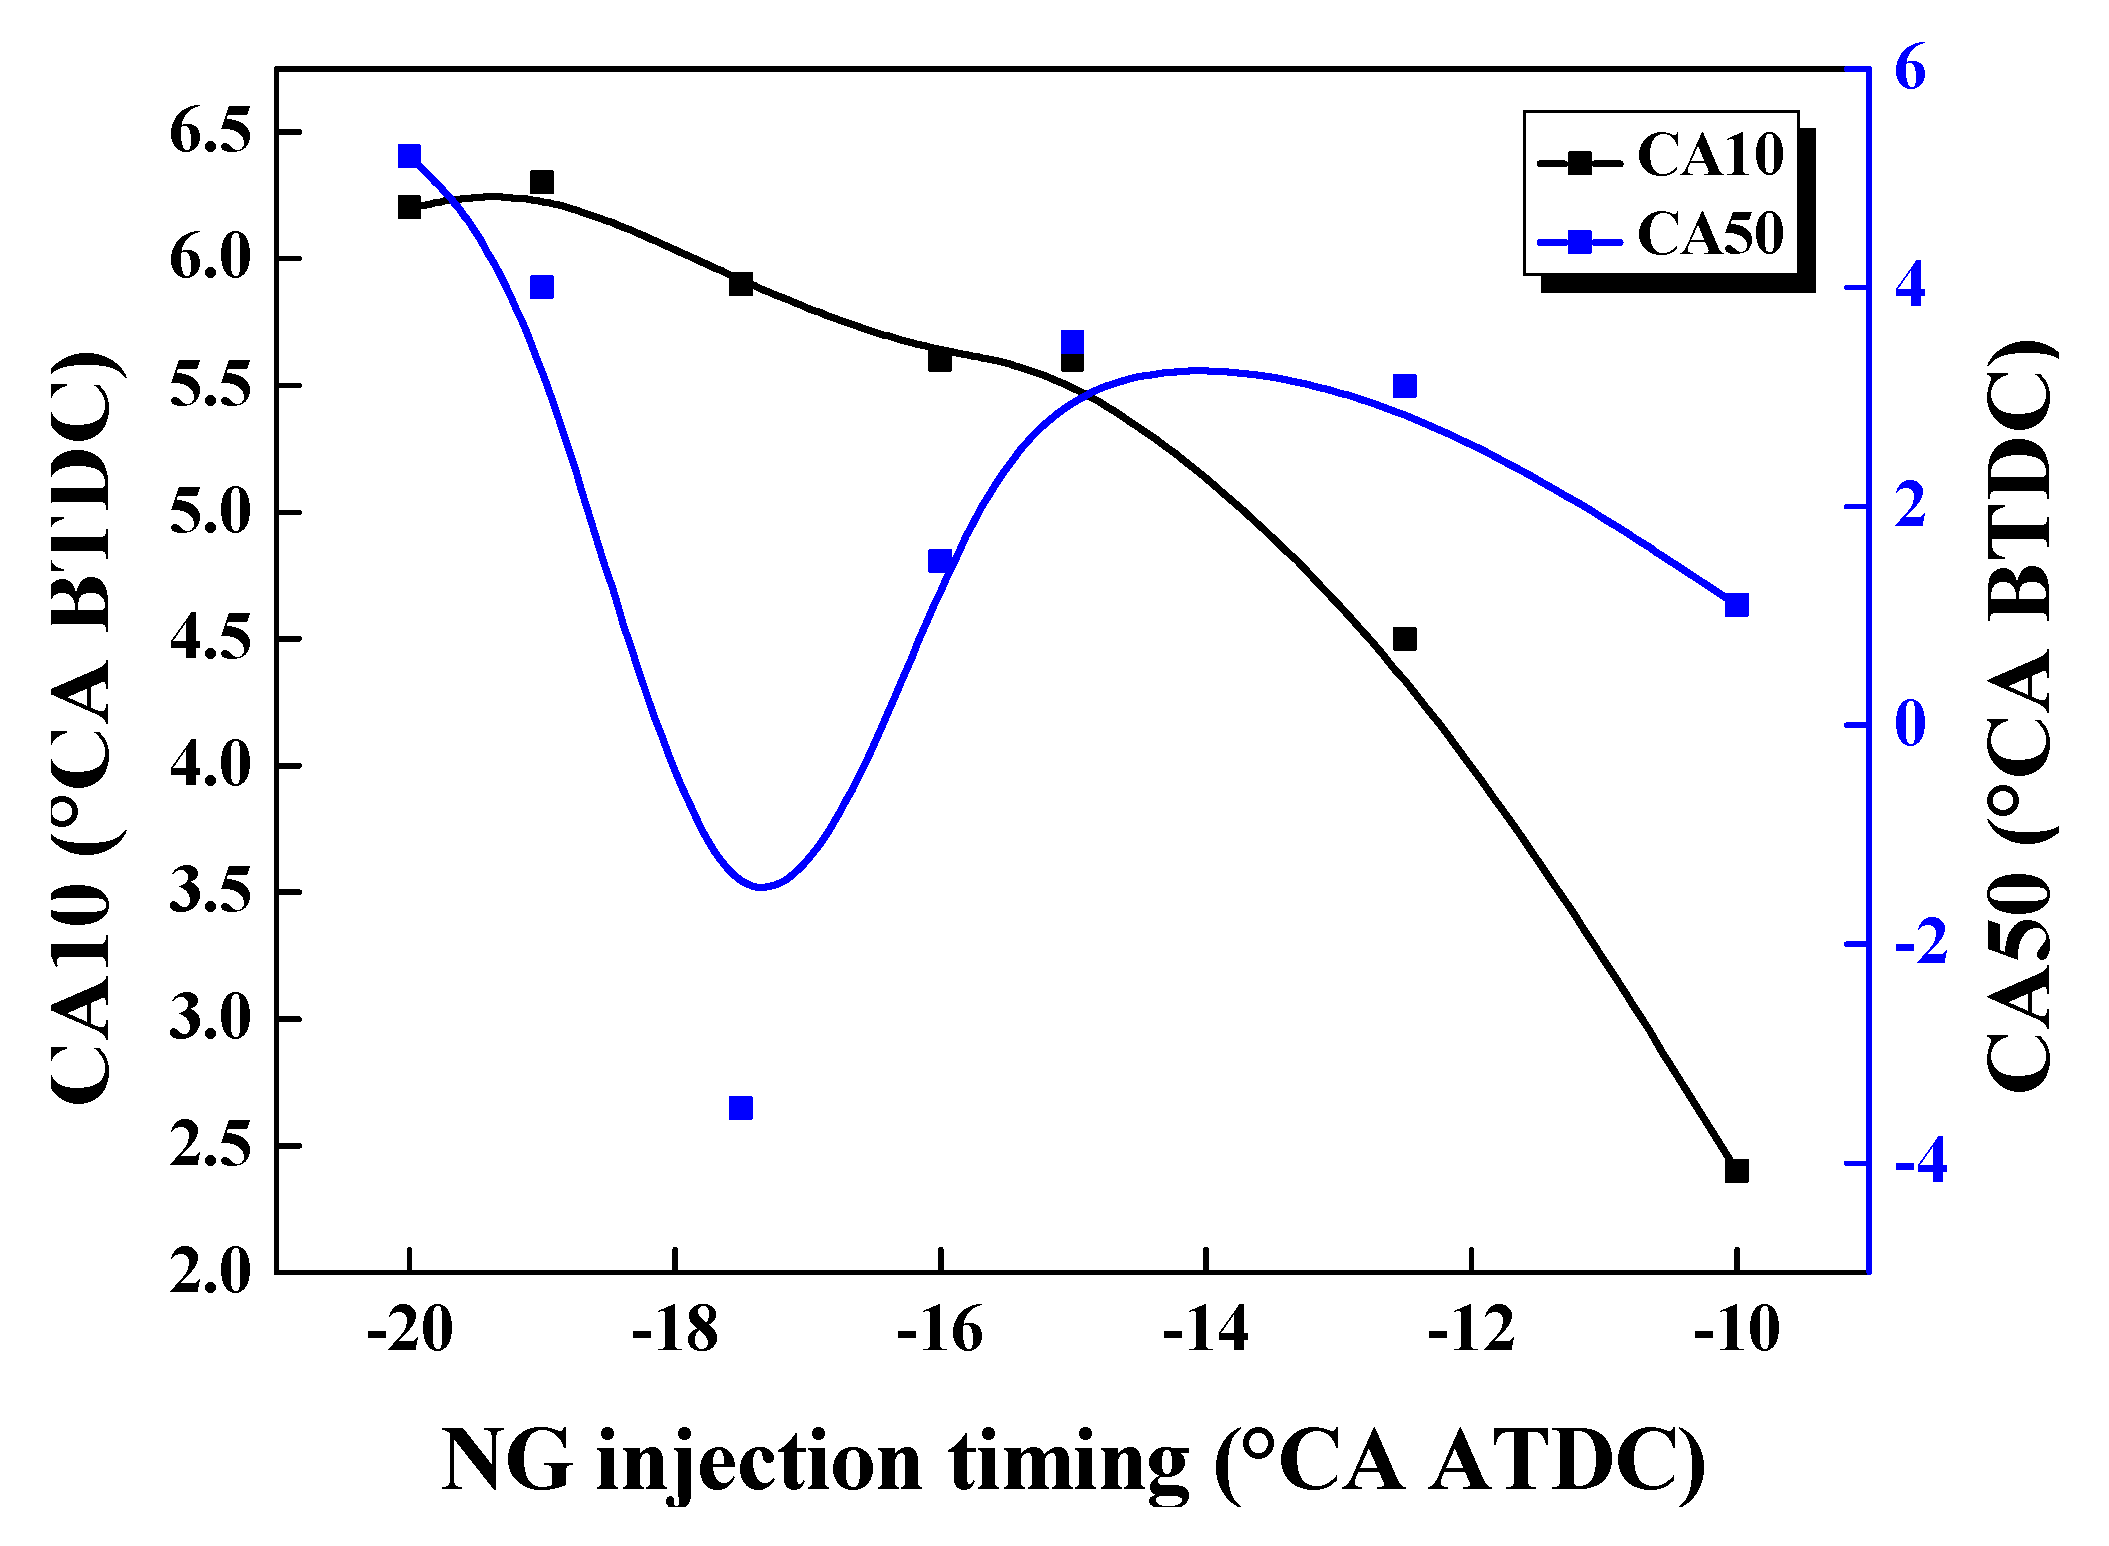
Figure 8 shows the changes in CA10 and CA50 with NG injection timing, the shaded area means that all points in it have a proper combustion. When SOIgas is 15° CA BTDC, CA10 lags significantly, whereas with other in-conditions, CA10 is remains similar. This is because the CA10 in each working condition only uses diesel combustion. CA50 is delayed with the lag of NG injection timing, with the SOIgas varying from 2.5° to12.5° CA BTDC. The change in CA50 is mainly related to the combustion of NG. When SOIgas is 15° CA BTDC, the whole combustion phase is delayed; thus, CA10 and CA50 are also delayed. When SOIgas is 0° CA BTDC, as only diesel is being burned, CA10 and CA50 increase accordingly.
Figure 9 shows that the combustion duration is prolonged with the delay in the timing of NG injection when SOIgas is between 2.5° and 12.5° CA BTDC. This is because, with the delay in the timing of NG injection, the interval between the diesel combustion and NG combustion increases. Although the respective combustion duration of diesel and NG remains similar, the overall combustion duration is prolonged.

3.1.2. Influence of NG Injection Timing on Thermal Efficiency

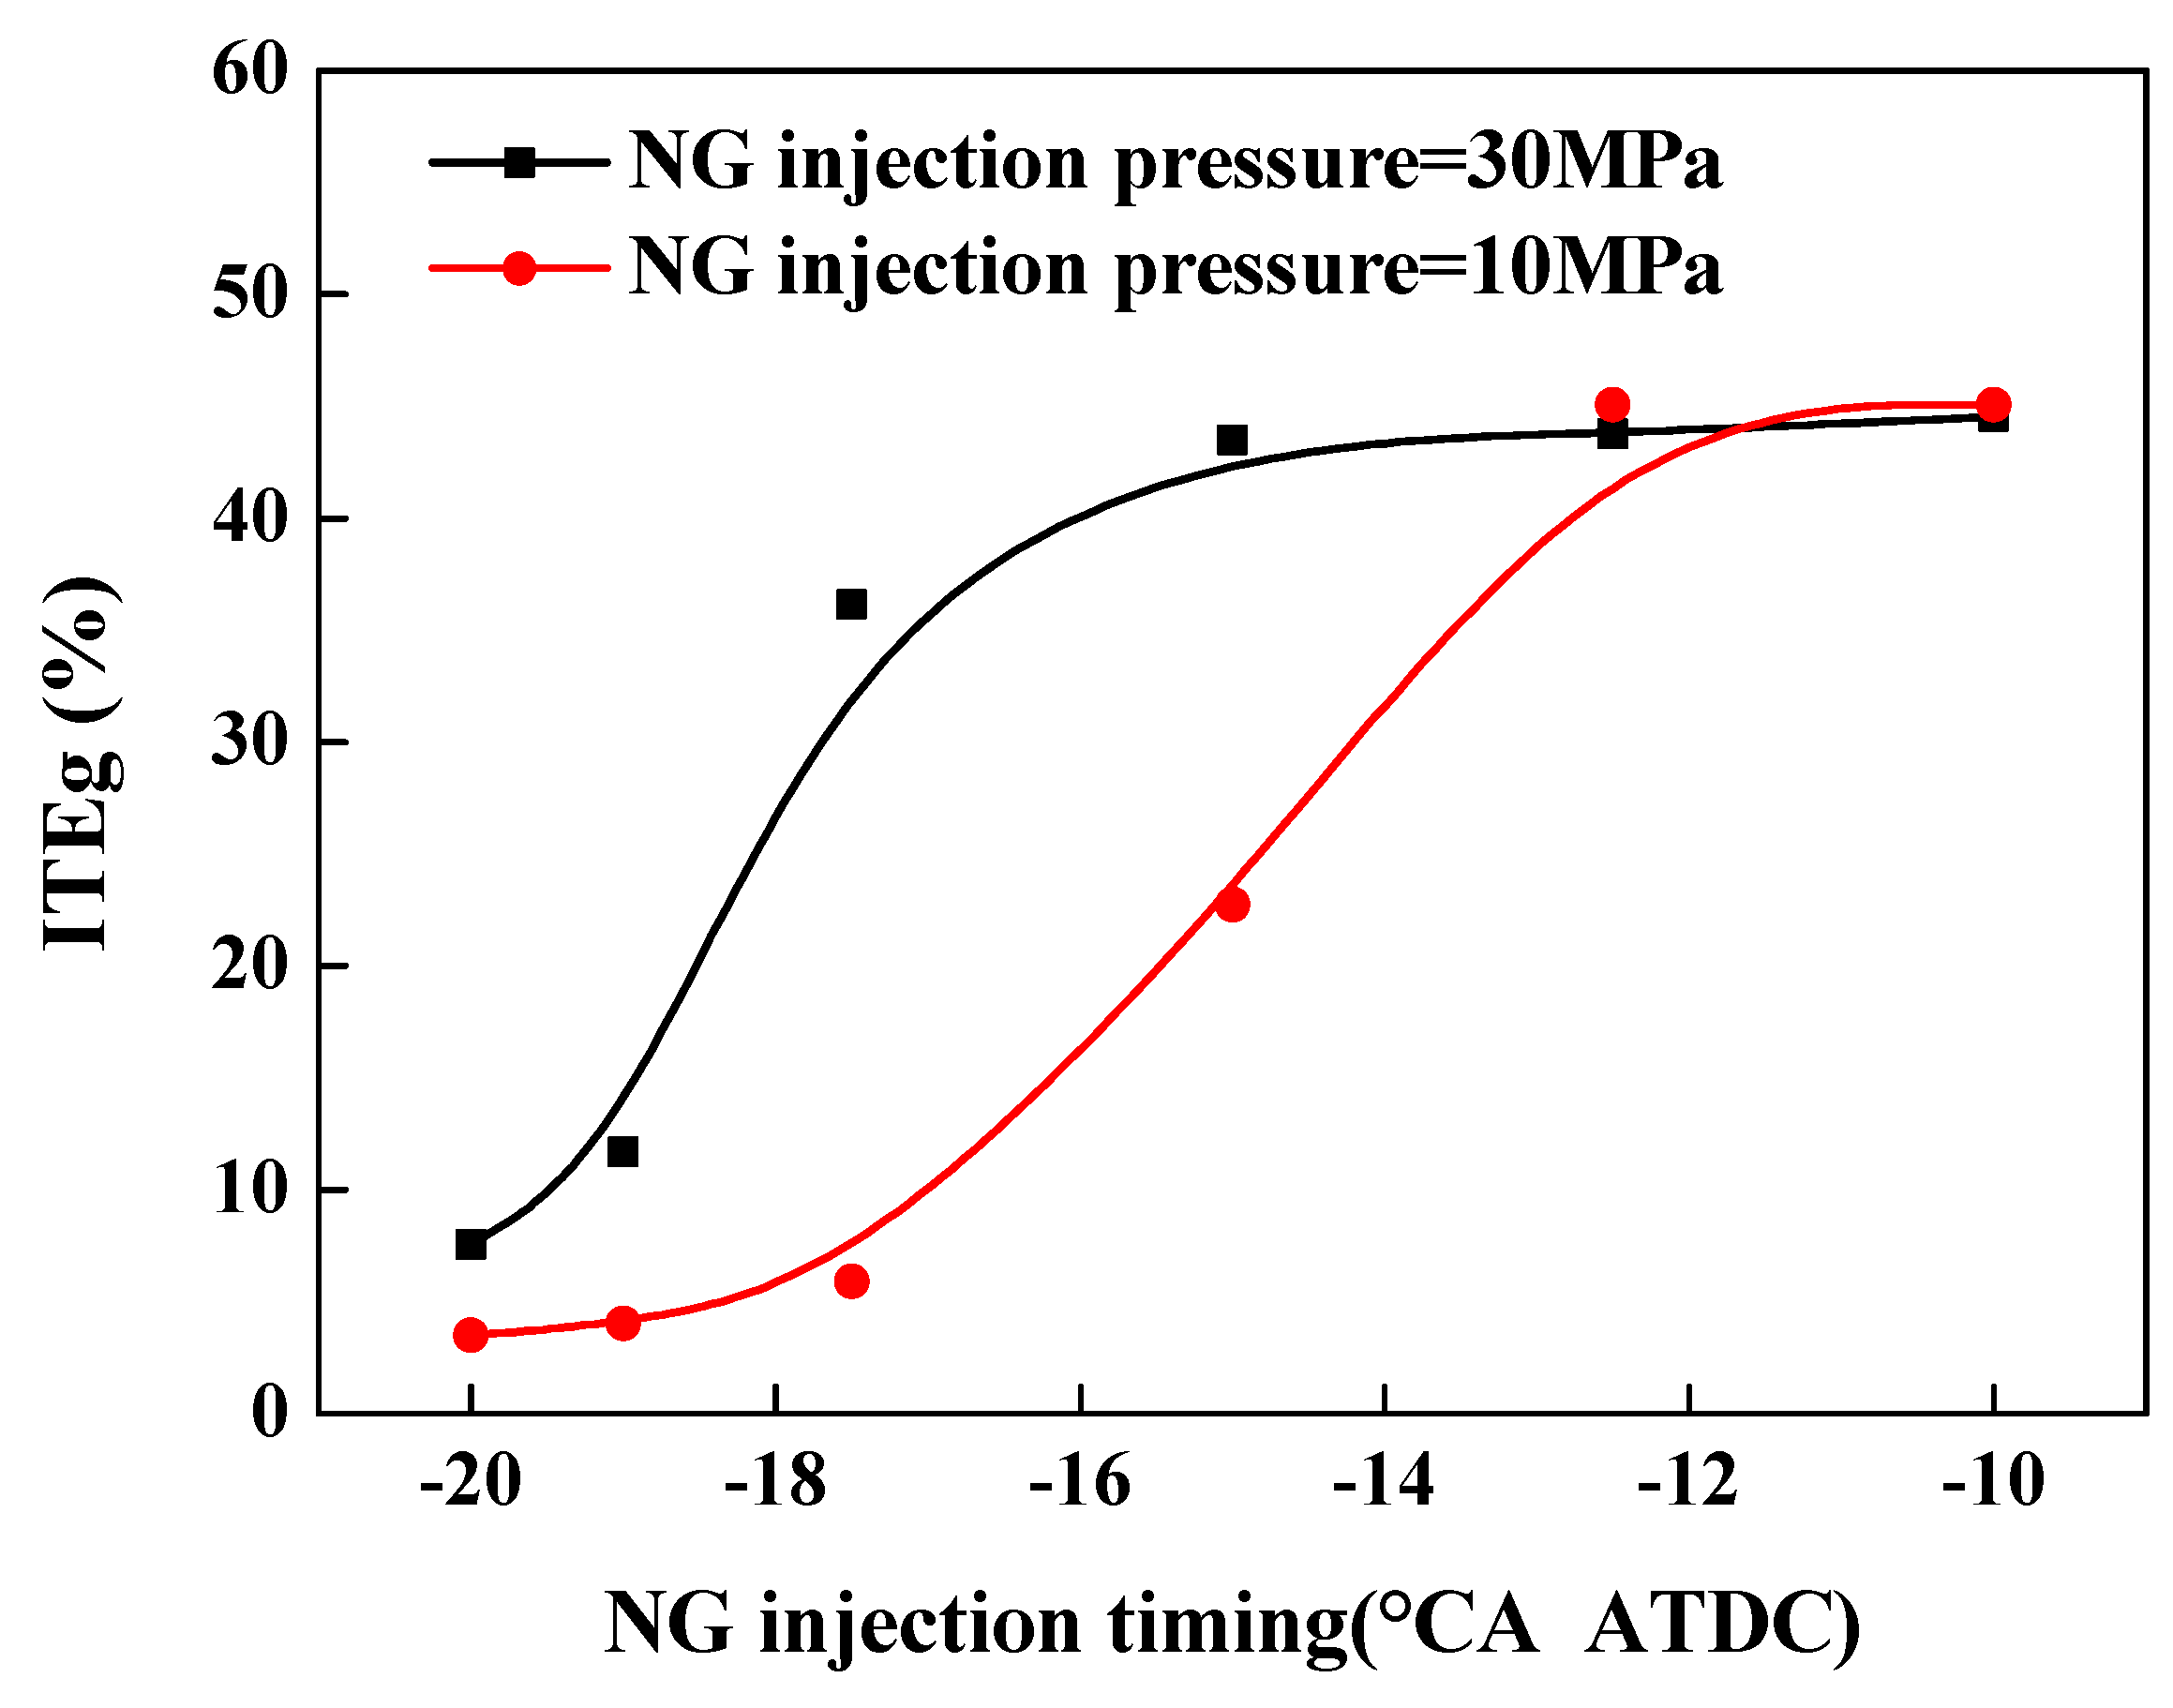
Figure 10 shows the variation in ITEg with different NG injection timing. When the NG injection pressure is 30 MPa, with the continuous delay of NG injection timing, the ITEg of the engine first increases and then decreases. When SOIgas is 5° CA BTDC, the maximum ITEg reaches 46.47%. This is because the heat transfer loss decreases with the delay in the timing of NG injection. When SOIgas is 0° CA BTDC or 15° CA BTDC, a large amount of NG fails to be ignited, and combustion loss is the major loss. In addition, as the injection pressure of NG and diesel changes to 10 MPa, the ITEg is obviously improved, as the maximum ITEg reaches 48.06%. This is due to the lower injection pressure, making the combustion closer to the nozzle and allowing the ignition diesel to burn more NG. Reducing the gas injection pressure also weakens the force of the gas on the diesel, and in this system the fuel injection pressure is 1 MPa higher than natural gas. The diesel can still successfully ignite the NG when SOIgas is 0° CA BTDC, which indicates that the NG can be easily ignited by the pilot ignition diesel.
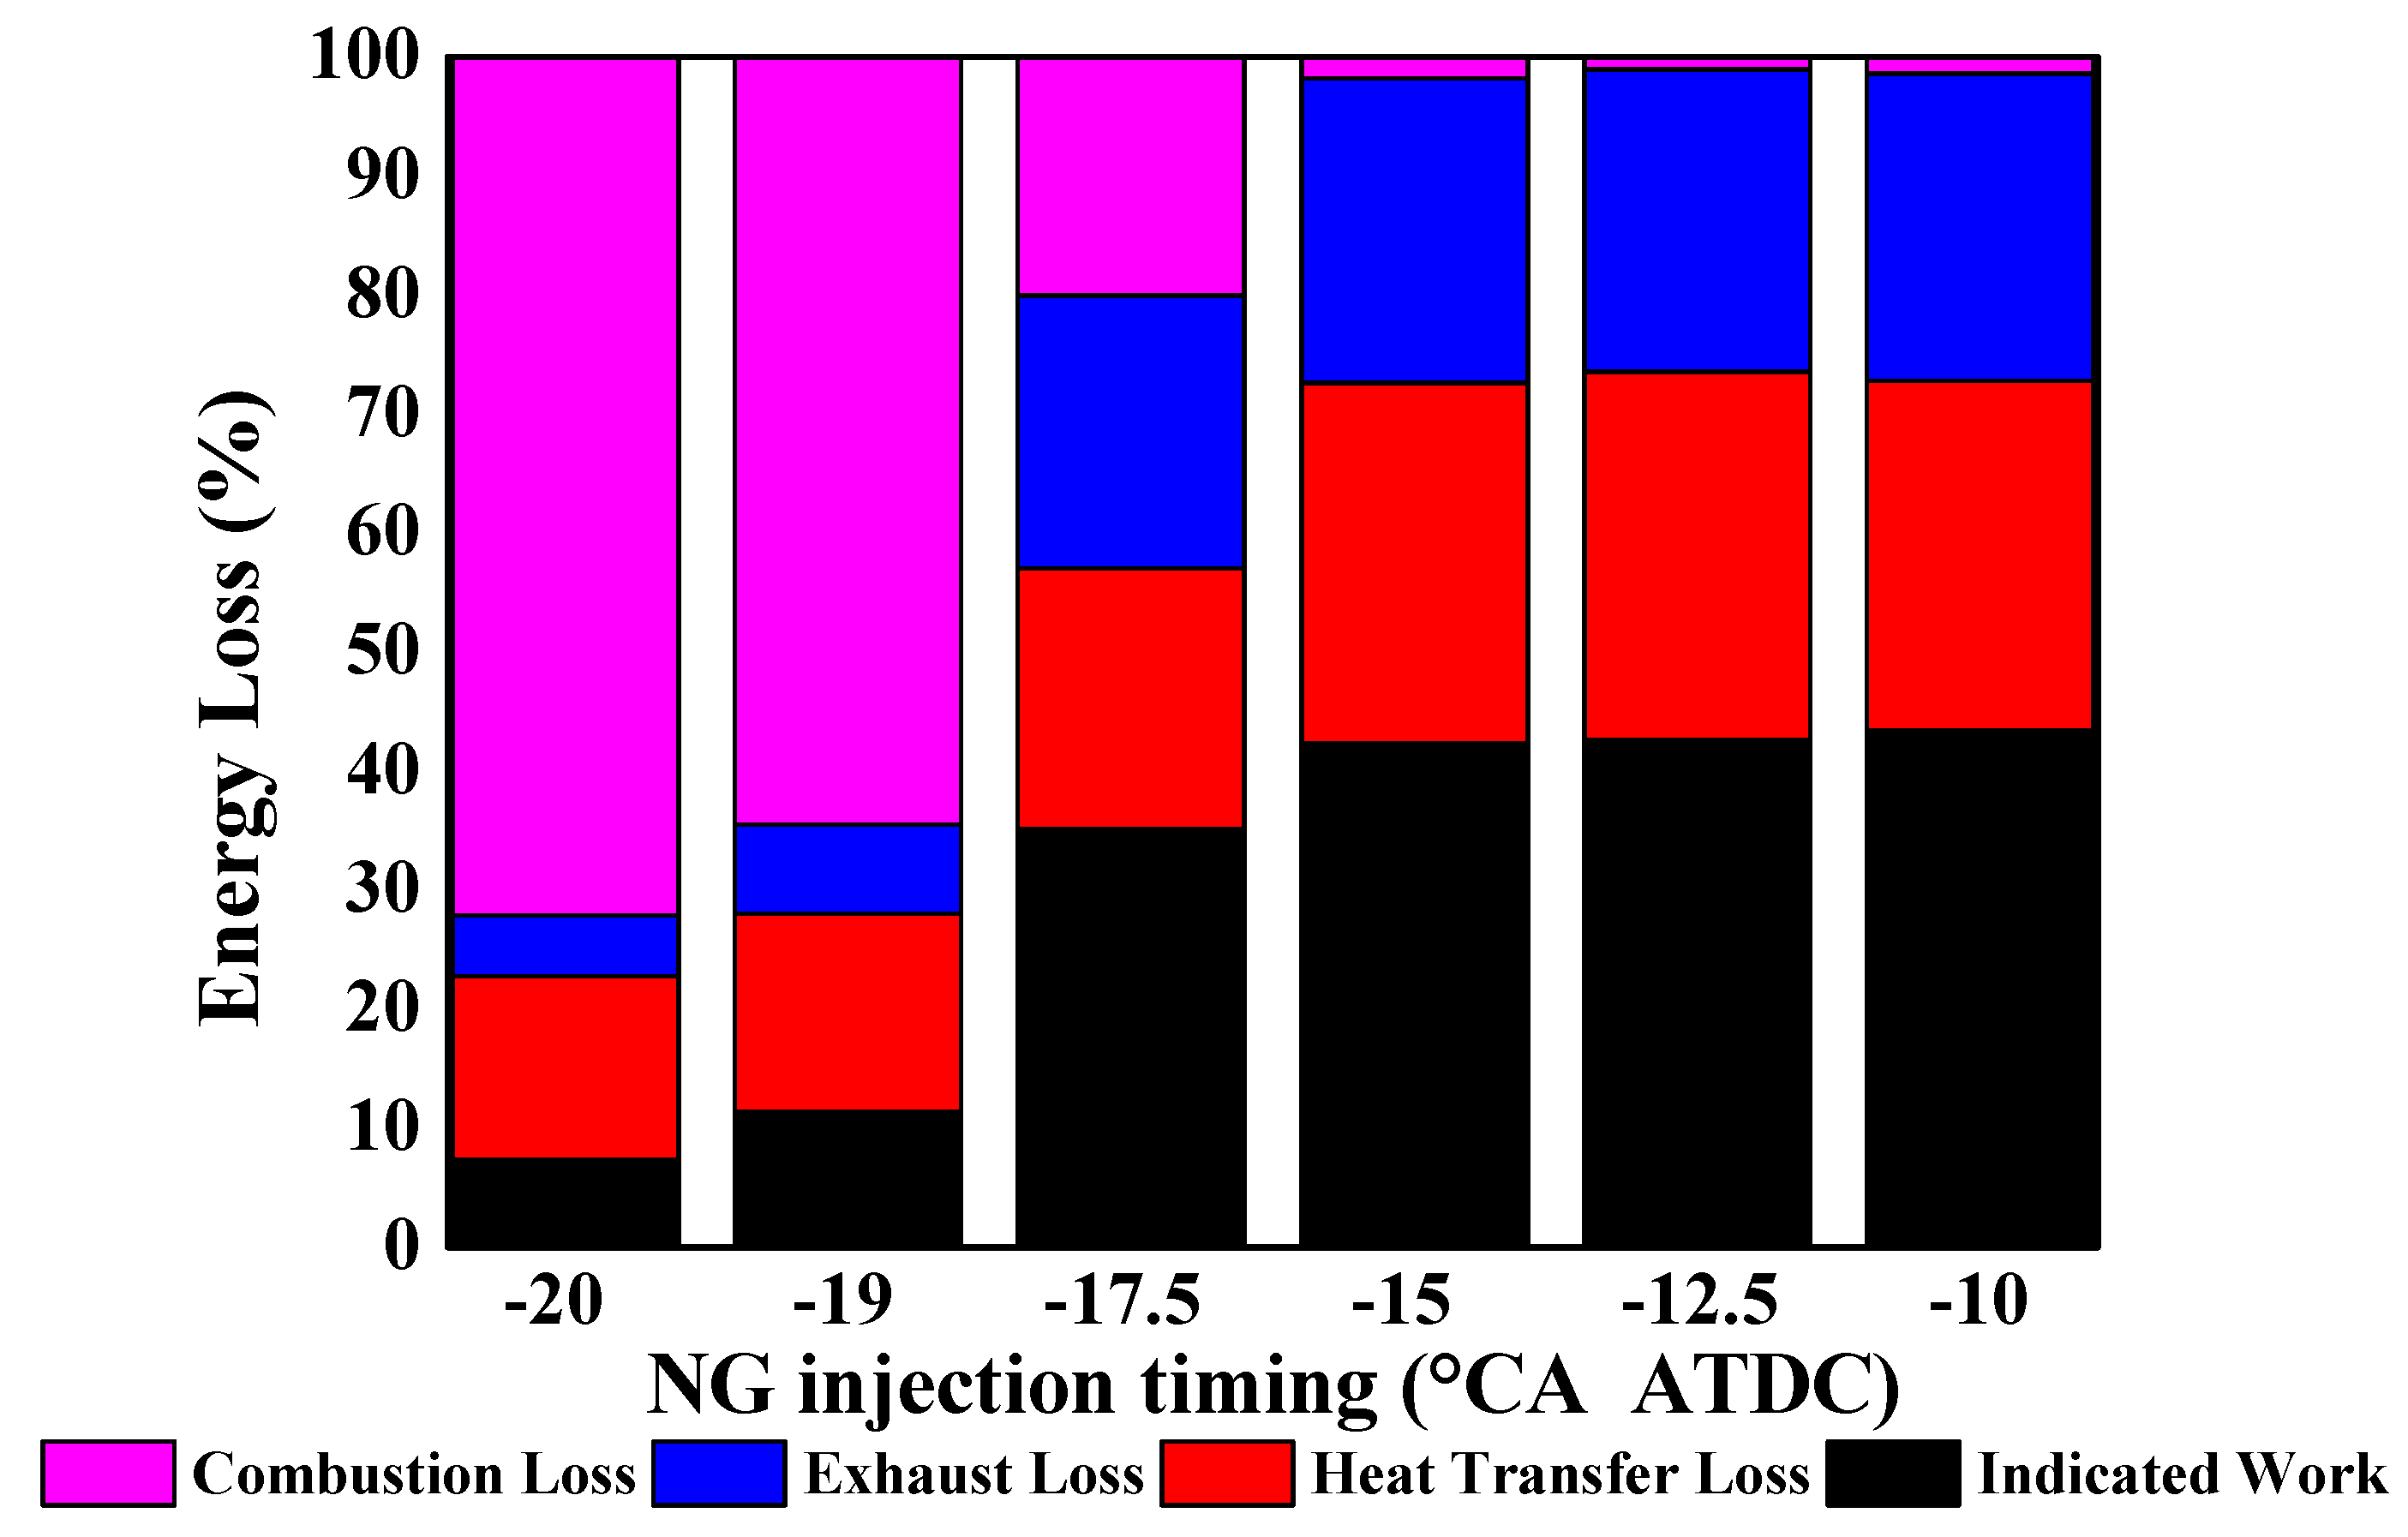
Figure 11 shows the energy loss under different NG injection timing (with the NG injection pressure of 30 MPa). Figure 6 shows that the in-cylinder average temperature increases with the advance of the NG injection timing, that is, the gas temperature in the cylinder as a thermo-atmosphere increases, leading to the continuous increase of heat transfer loss. As shown in Figure 8, CA50 is delayed with the delay in the timing of NG injection. The later the combustion process is finished, the higher the exhaust temperature when the exhaust valve is opened, and the greater the exhaust loss.
When SOIgas is too early, the combustion process is basically completed before TDC, which will generate a negative work in the compression process of the piston, leading to the decrease of ITEg. By contrast, if the combustion process is too late, the ability of the combustion gas to work decreases. In addition, early NG injection can enhance the combustion rate and lower the exhaust loss. Later NG injection reduces heat transfer loss, but exhaust loss increases correspondingly. This can be regarded as the joint effect of the three kinds of losses. As a result, the best NG injection appears near 5~7.5° CA BTDC.

3.1.3. Effect of NG Injection Timing on Emissions

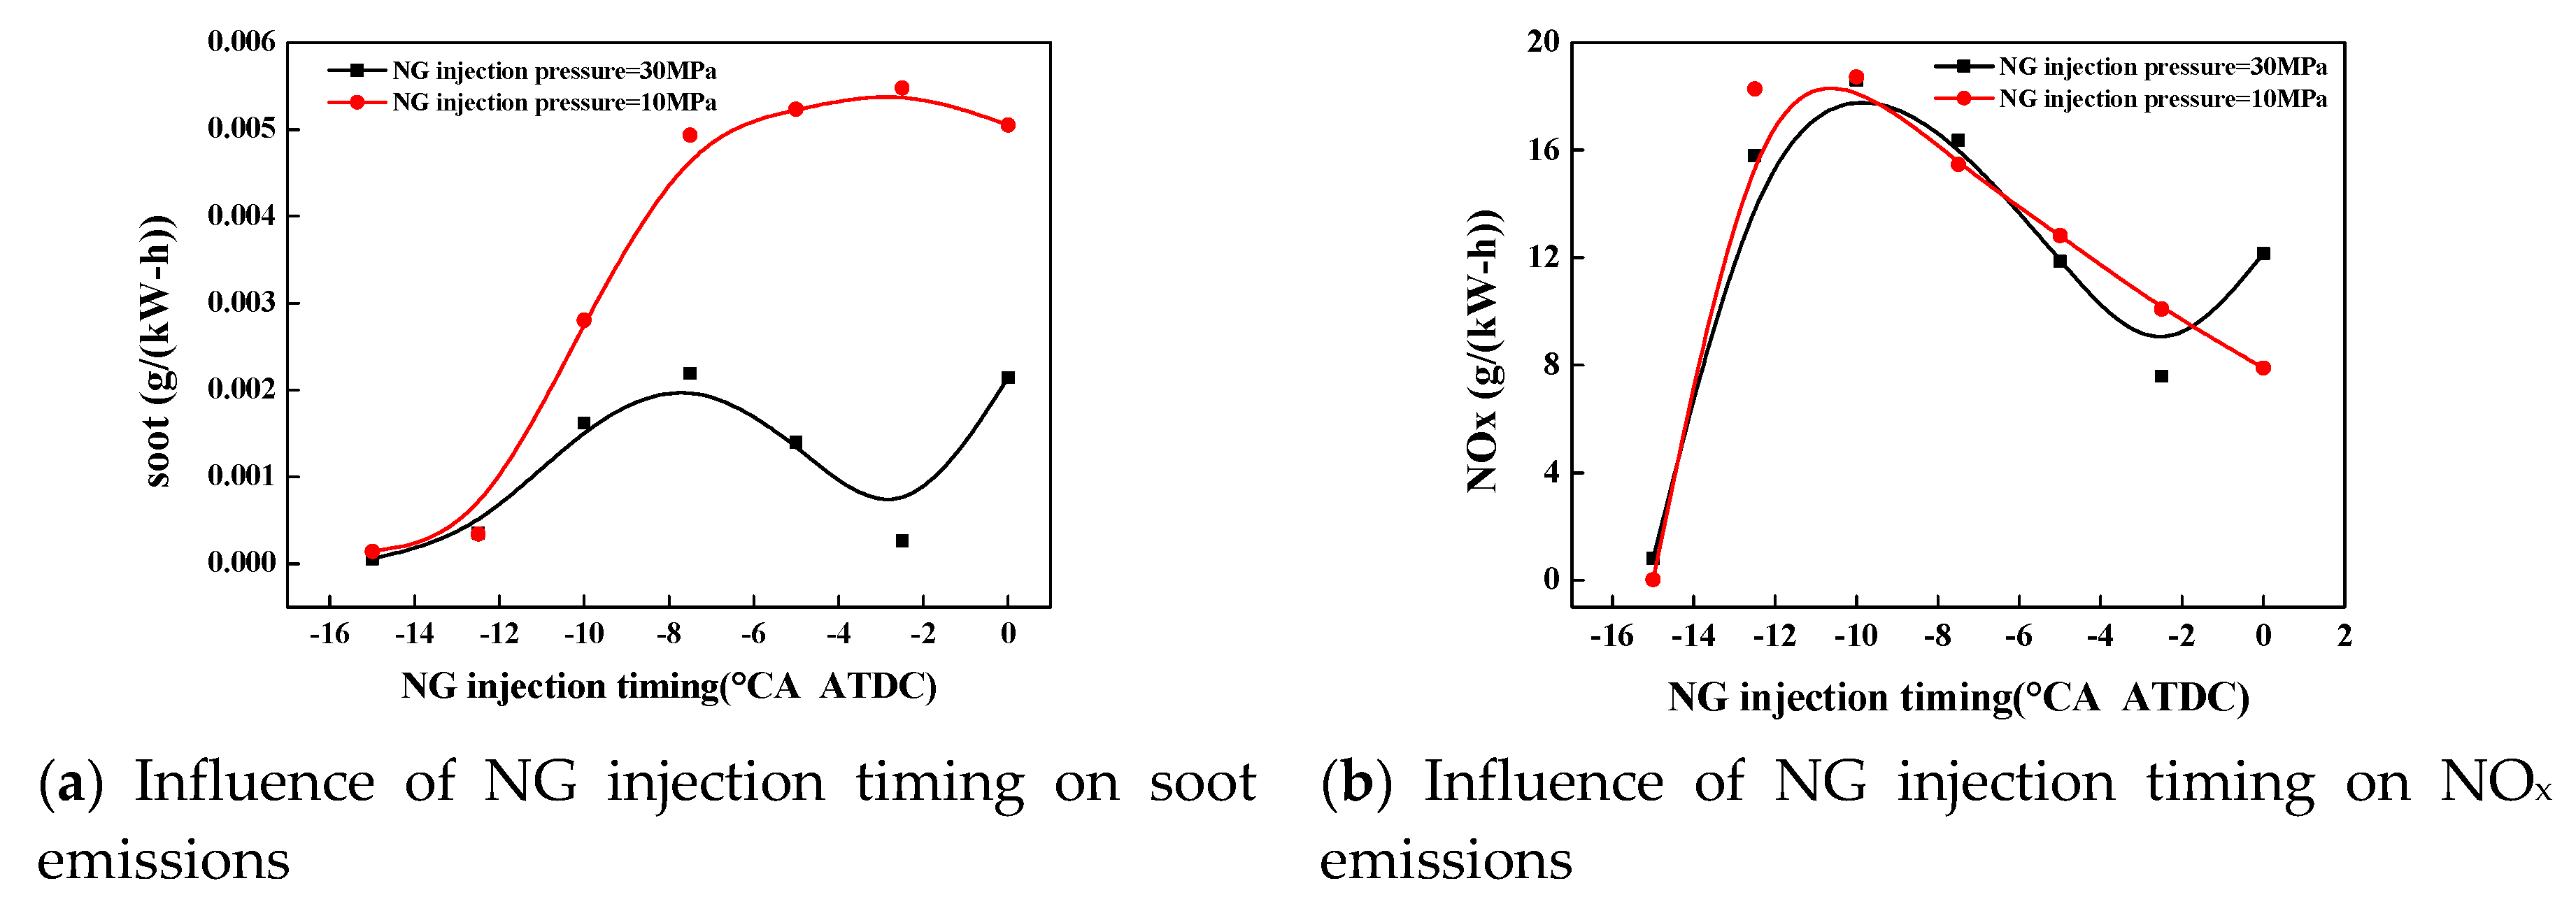
Figure 12 shows the NOx and soot emissions in the HPDI combustion mode. When the NG injection pressure is 30 MPa, similar trends are observed, that is, rising first and then falling with the delay in the timing of NG injection. NOx emissions are determined by high temperature, oxygen-enriched environment and high temperature duration. As shown in Figure 6b, the high temperature duration of the cylinder change has an opposite trend to the NG injection timing. When SOIgas is 10° CA BTDC, the high temperature duration achieves the best compromise effect, so NOx emissions are at their highest. Soot generation mechanism is related to the oxygen-poor environment in the cylinder. When SOIgas is 7.5° CA BTDC, it forms severe local concentration zones, leading to more soot emissions. Under the working condition of 10 MPa, decreasing the NG injection pressure results in higher soot and NOx emissions. Lower NG injection pressure improves combustion, resulting in higher NOx emissions. Diesel atomization, as well as the mixing of the fuel mixture, is weakened by the lower injection pressure, which causes higher soot emissions.
As shown in Figure 13, HC and CO emissions tend to decrease first and then increase with the delay as the timing of NG injection, reaching the bottom when SOIgas is 7.5° A BTDC. This trend is also consistent with the combustion loss trend in Figure 11. The larger the range and the longer the time in the low-temperature and oxygen-poor environment in the cylinder, the higher the CO emissions will be. Compared with the higher injection pressure of, the HC and CO emissions reduce with the lower injection pressure of NG, which makes the combustion efficiency higher.

3.2. PPCI Combustion Mode

The PPCI combustion mode is achieved by setting the NG injection timing before the pilot ignition diesel injection timing. With this injection strategy, premixed combustion plays the main role in the cylinder, where NG spreads in the cylinder with a thin concentration first and then NG that permeates the cylinder is simultaneously ignited by diesel.

3.2.1. Influence of NG Injection Timing on the Combustion Process

Figure 14a,b shows the variation of the in-cylinder average pressure and temperature in PPCI combustion mode, respectively. After the diesel compression ignition, with the NG injection timing of 10° CA BTDC, the increase in average pressure and temperature obviously lags, and the lag gradually disappears with the advance in the timing of NG injection. When the NG injection timing advances before 15° CA BTDC, the in-cylinder average pressure and temperature significantly decrease.
When the injection timing of the NG is delayed, on one hand, the fire core formed by the diesel is small; on the other hand, the jet of NG blows away and disturbs the mixture of diesel and air. As a result, when the injection timing of diesel and NG approaches, the pilot ignition diesel does not burn immediately, resulting in a lag in pressure and temperature. With the further advance of the timing of the air injection, the NG in the cylinder is fully diffused and mixed with air, and the concentration of NG becomes very thin. In addition, some NG enters the clearance and the position near the wall of the combustion chamber. This part of NG fails to burn and is directly discharged with the exhaust.
In Figure 15, the heat release rate generally decreases with the advance in the NG injection timing. It can be found that when the NG injection timing is before 15° CA BTDC, there is only one peak with a low heat release rate caused by the combustion of diesel (and a small amount of thin NG nearby). And with the NG injection timing being delayed until after 15° CA BTDC, the NG begins to be ignited, resulting in a higher heat release peak. The earlier the NG injection is, the more fully the NG is mixed with air before ignition, and the thinner the mixture concentration is. The more NG that reaches the clearance and wall in the cylinder, the less NG is ignited, and the lower the heat release rate.
Figure 16 shows the cloud map of the average temperature distribution in the cylinder. When the NG injection timing is 17.5° CA BTDC, obvious secondary combustion occurs after the TDC. At this time, the NG near the pilot ignition diesel has been ignited in the middle of the combustion chamber, which can also be observed in Figure 14 and Figure 15. Due to the high pressure of the NG injection, the front end of the NG is directly sprayed to the vicinity of the wall of the combustion chamber, and the thin concentration of the NG in the cylinder means that the pilot ignition diesel flame cannot ignite it. This part of the NG eventually burns due to the high temperature and pressure in the cylinder when the piston reaches the TDC. According to the simulation, a similar phenomenon is also found when the NG injection timing is 19° CA BTDC.
Figure 17 shows the changes in CA10 and CA50. It also shows that, with the delay in the NG injection timing, CA10 continues to be delayed. In addition to the situation when the NG injection timing is 17.5° CA and 19° CA BTDC, CA50 in other working conditions also continues to be delayed and the combustion duration continues to be shortened.
When the NG injection timing is 20° CA BTDC, the main heat release process is basically a diesel combustion, so CA10 and CA50 are relatively early. When the NG injection timing is 17.5° and 19° CA BTDC, the heat release from the secondary combustion clearly delays CA10 and CA50. When the NG injection timing is 17.5° CA BTDC, the secondary combustion has already occurred before CA50, and CA50 is late. However, the secondary combustion appears after CA50 when the NG injection timing is 19° CA BTDC, so only CA10 is delayed.

3.2.2. Influence of NG Injection Timing on Thermal Efficiency

As shown in Figure 18, the ITEg increases with the delay in the NG injection timing. In this simulated group, the ITEg is mainly related to the quality of NG involved in combustion. The closer the NG injection timing is to the pilot ignition diesel injection timing, the lower the quantity of difficult-to-ignite NG scatters near the clearance and wall surface, and the higher the ITEg is, up to 43.4%. Clearly, as the NG injection pressure decreases to 10 MPa, when the NG injection timing is before 12.5° CA BTDC, the decrease in injection pressure weakens the combustion and decreases efficiency. This is because the lower diesel injection pressure makes the diesel burn closer to the nozzle, but because of the early injection of the NG, most of the NG spreads out with a very thin concentration near the diesel, so a large part of the NG cannot be ignited. However, when the NG injection timing is later than 12.5° CA BTDC, there is not enough time for the NG to spread, and the lower injection pressure makes the NG easier to ignite. In this case, the ITEg increases.
Figure 19 shows the distribution of energy loss with NG injection pressure 30 MPa. Combustion loss increases with the advance of NG injection timing, and exhaust loss decreases gradually at the same time. This is because, with the advance of the NG injection timing, a large amount of NG is discharged without being ignited by diesel, resulting in a large amount of combustion loss. Due to the advance in the NG injection timing, only a small amount of NG is burned, resulting in low exhaust temperature and exhaust loss. Heat transfer loss is affected by the combustion temperature: the higher the temperature, the more the heat transfer loss.

3.2.3. Influence of NG Injection Timing on the Emissions

In Figure 20, at 30 MPa injection pressure, with the delay in the NG injection timing, the NOx emissions of the engine increase, and soot emissions show a decreasing trend. NOx emissions are very high when the NG injection timing varies from 17.5° to 20° CA BTDC and increase gradually after 15° CA BTDC. This is because the power is too low that even if the NOx emissions are low in kilograms, they are high in grams per kilowatt-hour. Although the degree of mixing of gas and air decreases with the delay in the NG injection timing after 15° CA BTDC, the NOx emissions still increase as more NG is involved in the combustion. When the injection pressure is 10 MPa, the inflection point of NOx emissions appears later because the diesel does not successfully ignite the NG until the NG injection is delayed after 15° CA BTDC. Soot emissions increase due to the weak mixture of fuel and air because of the lower injection pressure. The soot is mainly generated in the oxygen-poor environment in the cylinder, but the soot emissions are not only related to the generation but also influenced by the soot consumption.
Figure 21 shows the emissions of HC and CO. Both emissions decrease gradually with delayed NG injection timing. As stated above, with an advance in the NG injection timing, there will be a large amount of unburned NG in the cylinder, which is directly discharged with the exhaust, greatly increasing HC emissions. HC emissions at NG injection pressure of 10 MPa are obviously higher than those at 30 MPa. This is because the combustion is even worse when the NG injection timing is before 15° CA BTDC with a lower injection pressure because more NG is discharged with the exhaust without being ignited. CO emissions with higher NG injection pressure are low when the NG injection is before 15° CA BTDC because there is too little NG involved in the combustion process.

4. Discussion

In the HPDI combustion mode, the pilot ignition diesel is injected first into the engine cylinder for compression ignition, followed by the NG, first igniting the mixture near the diesel and then gradually spreading to all parts of the cylinder. On the contrary, the PPCI combustion mode gives priority to the injection of NG, which is premixed with air in the cylinder to a certain extent, followed by diesel. When there is appropriate concentration of NG in the cylinder, multiple points are ignited at the same time, and the flame rapidly spreads.
  • As the HPDI group relies on diffusion combustion and the PPCI group uses partial premix combustion, the heat release rate of the PPCI group is significantly higher than that of the HPDI group, with faster flame propagation, faster rises in temperature, and shorter combustion duration.
  • The HPDI combustion mode has a higher ITEg. This is because less NG fails to be ignited by the pilot-ignited diesel in this mode.
  • Emissions in grams per kilowatt-hour should be considered not only by emission mass but also by power (or ITEg). It shows that the ITEg of HPDI combustion mode is much higher that PPCI combustion mode in the cases of this paper. As a result, though the emissions in kilograms is similar (or the soot emissions in kilograms of PPCI is even lower), the result shows that emissions in grams per kilowatt-hour of PPCI combustion mode is higher than HPDI combustion mode (ignoring the cases failed to burn properly).
  • Comparing the two combustion modes, the simultaneous injection of NG and diesel can significantly delay the combustion phase, which is mainly because the injection of NG interferes with the mixing of diesel and air and the compression ignition of diesel. For example, when SOIgas is 15° CA BTDC, it is difficult for the combustion process to operate normally.

5. Conclusions

In the HPDI combustion mode, the premature injection timing under low load will hinder the compression ignition of diesel, and the NG cannot be ignited by the ignition of diesel when the NG injection timing is late. In this mode, the optimal injection time is the moment when the diesel and NG combustion only appears as a single heat release peak and appears near the TDC.
In the PPCI combustion mode, the injection of NG too early causes a considerable portion of NG to be scattered at the edge of the combustion chamber, which cannot be ignited by the pilot ignition diesel, leading to high HC emissions and low ITEg. The late injection of NG will also delay the combustion process and increase exhaust loss. The ideal timing of NG injection was between -10° and 15° CA BTDC.
In relation to injection pressure, the lower injection pressure effectively realizes a higher ITEg in the HPDI combustion mode. In the PPCI combustion mode, the lower injection pressure weakens the combustion further when the NG injection timing is before 15° CA BTDC and has a little positive effect on the ITEg when the injection timing is delayed after 15° CA BTDC. Overall, reducing the injection pressure shows an obvious positive effect on the HPDI combustion mode, but further investigation is required to identify the complete influence of injection pressure on the PPCI combustion mode.

Author Contributions

Conceptualization, B.W. and J.L.; methodology, B.W., L.D. and J.G.; software, J.G. and J.L.; validation, J.L. and M.Z.; formal analysis, J.L. and L.D.; investigation, J.L.; resources, B.W.; data curation, J.Z. and J.L.; writing—original draft preparation, J.L.; writing—review and editing, B.W., L.D. and J.L.; visualization, Z.Z. and J.L.; supervision, B.W.; project administration, J.L. and B.W.; funding acquisition, B.W. All authors have read and agreed to the published version of the manuscript.

Funding

This study was supported by the Natural Science Foundation of Tianjin through its project funding NO.19JCYBJC21200, by China Postdoctoral Science Foundation Grant NO. 2018 M631737, and by National Engineering Laboratory for Mobile Source Emission Control Technology NO. NELMS2018A05.

Conflicts of Interest

The authors declare no conflict of interest.

Glossary

The following abbreviations were used in this manuscript:
AHRRAverage Heat Release Rate
AMRAdaptive Mesh Refinement
ASOIAfter Start of Injection
ATDCAfter Top Dead Center
BMEPBrake Mean Effective Pressure
BSFCBrake Specific Fuel Consumption
BTDCBefore Top Dead Center
CA10The crankshaft angle corresponding to the moment that combustion heat release accounts for 10% of the total heat release in a cycle.
CA50The crankshaft angle corresponding to the moment that combustion heat release accounts for 50% of the total heat release in a cycle
CA90The crankshaft angle corresponding to the moment that combustion heat release accounts for 90% of the total heat release in a cycle
CFDComputational Fluid Dynamics
HCHydrocarbons
HCCIHomogeneous Charge Compression Ignition
HCDIHomogeneous Charge Direct Injection
HPDIHigh Pressure Direct Injection
IMEPgGross Indicated Mean Effective Pressure
ITEgGross Indicated The
NGNatural Gas
PPCIPartially Premixed Compression Ignition
SOIStart of Injection
TDCTop Dead Center
UHCUnburned Hydrocarbons

References

  1. International Energy Agency. CO2 Emissions from Fuel Combustion 2014; International Energy Agency: Paris, French, 2007. [Google Scholar] [CrossRef]
  2. Marc, C.; Joshua, I. Emissions Characterization from Different Technology Heavy-Duty Engines Retrofitted for CNG/Diesel Dual-Fuel Operation. Sae 2015, 8, 1342–1358. [Google Scholar] [CrossRef]
  3. Douville, B.; Ouellette, P. Performance and emissions of a two-stroke engine fueled using high-pressure direct injection of NG. Int. Congress Expos. 1998. [Google Scholar] [CrossRef]
  4. Alberto, A.B.; Harry, C.W. The Lean Burn Direct-Injection Jet-Ignition Flexi Gas Fuel Engine. Sae 2009. [Google Scholar] [CrossRef]
  5. Alberto, A.B.; Harry, C.W. Development of a Direct Injection High Flexibility CNG/LPG Spark Ignition Engine. Sae 2009. [Google Scholar] [CrossRef]
  6. Munshi, S.R.; Mctaggart-Cowan, G.P. Development of a Partially-Premixed Combustion Strategy for a Low-Emission, Direct Injection High Efficiency NG Engine. Am. Soc. Mech. Eng. 2011, 515–528. [Google Scholar] [CrossRef]
  7. Li, J.; Wang, J.; Liu, T.; Dong, J.; Liu, B.; Wu, C.; Ye, Y.; Wang, H.; Liu, H. An Investigation of the Influence of Gas Injection Rate Shape on High-Pressure Direct-Injection Natural Gas Marine Engines. Energies 2019, 12, 2571. [Google Scholar] [CrossRef] [Green Version]
  8. Pablo, G.; Per, T. Experimental Investigation on CNG-Diesel Combustion Modes under Highly Diluted Conditions on a Light Duty Diesel Engine with Focus on Injection Strategy. Sae 2015, 8, 2177–2187. [Google Scholar] [CrossRef]
  9. Su, W.; Lin, Z. Development of a Sequencial Port Injection, Fully Electronically Controlled Gas/Diesel Dual Fuel Engine. Trans. CSICE 2001, 2, 102–108. [Google Scholar] [CrossRef]
  10. Lin, Z.; Su, W. Study on the optimum amount of pilot ignition diesel and excess air coefficient concentration limit and dilute limit for diesel-fired NG engines. J. Intern. Combust. Engine 2002, 20, 505–510. [Google Scholar] [CrossRef]
  11. Chala, G.T.; Abd Aziz, A.R.; Hagos, F.Y. Natural Gas Engine Technologies: Challenges and Energy Sustainability Issue. Energies 2018, 11, 2934. [Google Scholar] [CrossRef] [Green Version]
  12. Thipse, S.S.; Sonawane, S.B.; D’Souza, A.F.; Rairikar, S.D.; Kavathekar, K.K.; Marathe, N.V. Injection Strategies, Optimization and Simulation Techniques on DI CNG Technology; SAE Technical Paper No. 2015-26-0046; SAE International: Warrendale, PA, USA, 2015. [Google Scholar] [CrossRef]
  13. Christo, F.C.; Dally, B.B. Modeling turbulent reacting jets issuing into a hot and diluted coflow. Combust. Flame 2005, 142, 117–129. [Google Scholar] [CrossRef]
  14. Reitz, R.D.; Bracco, F.V. Mechanisms of Breakup of Round Liquid Jets. Encycl. Fluid Mech. 1986, 3, 223–249. [Google Scholar]
  15. Ricart, L.M.; Xin, J. InCylinder Measurement and Modeling of Liquid Fuel Spray Penetration in a Heavy-Duty Diesel Engine. Sae 1997. [Google Scholar] [CrossRef]
  16. Amsden, A.A. KIVA-3V: A Blockstructured KIVA Program for Engines with Vertical or Canted Valves; USDOE Assistant Secretary for Energy Efficiency and Renewable Energy: Washington, DC, USA, 1997. [Google Scholar] [CrossRef] [Green Version]
  17. Schmidt, D.P.; Rutland, C.J. A New Droplet Collision Algorithm. J. Comput. Phys. 2000, 164, 62–80. [Google Scholar] [CrossRef]
  18. O’Rourke, P.J.; Amsden, A.A. A Spray/wall Interaction Submodel for the KIVA-3 Wall Film Model. Sae 2000, 10, 407–422. [Google Scholar] [CrossRef]
  19. Senecal, P.K.; Pomraning, E. Multi-Dimensional Modeling of Direct Injection Diesel Spray Liquid Length and Flame Lift-off Length using CFD and Parallel Detailed Chemistry. Sae 2003, 32, 2727–2742. [Google Scholar] [CrossRef]
  20. Han, Z.; Reitz, R.D. A temperature wall function formulation for variable-density turbulent flows with application to engine convective heat transfer modeling. Int. J. Heat Mass Transf. 1997, 40, 613–625. [Google Scholar] [CrossRef]
  21. Heywood, J.B. Internal Combustion Engine Fundamentals; McGraw-Hill: New York, NY, USA, 1988. [Google Scholar]
  22. Ouellette, P. Direct Injection of Natural Gas for Diesel Engine Fueling. Ph.D. Thesis, University of British Columbia, Vancouver, BC, Canada, 1961. [Google Scholar]
  23. Yu, J.; Vuorinen, V.; Hillamo, H. An experimental investigation on the flow structure and mixture formation of low pressure ratio wall-impinging jets by a natural gas injector. J. Nat. Gas Sci. Eng. 2012, 9, 1–10. [Google Scholar] [CrossRef]
  24. Sitkei, G. Heat Transf. Therm. Load. Intern. Engines; Akademiai Kaido: Budapest, Hungary, 1974. [Google Scholar]
Figure 1. Grid division of natural gas (NG) (a) and diesel (b) injection timing in the combustion chamber.
Energies 13 00990 g001
Figure 2. Verification of free jet model.
Energies 13 00990 g002
Figure 3. Verification of wall-impinging jet model at different moments.
Energies 13 00990 g003
Figure 4. Comparison of simulation results and test data.
Energies 13 00990 g004
Figure 5. Influence of the NG injection timing on the heat release rate.
Energies 13 00990 g005
Figure 6. Variation of in-cylinder average pressure (a) and temperature (b) with NG injection timing.
Energies 13 00990 g006
Figure 7. Distribution cloud diagram of local equivalent ratio in the cylinder.
Energies 13 00990 g007
Figure 8. Changes in CA10 and CA50 and NG injection timing.
Energies 13 00990 g008
Figure 9. Variation of combustion duration and NG injection timing.
Energies 13 00990 g009
Figure 10. Impact of NG injection timing on ITEg.
Energies 13 00990 g010
Figure 11. Distribution of energy loss.
Energies 13 00990 g011
Figure 12. Influence of NG injection timing on soot and NOx emissions.
Energies 13 00990 g012
Figure 13. Influences of NG injection timing on HC and CO emissions.
Energies 13 00990 g013
Figure 14. Variation of in-cylinder average pressure (a) and temperature (b) with NG injection timing.
Energies 13 00990 g014
Figure 15. Variation of in-cylinder heat release rate with air injection timing.
Energies 13 00990 g015
Figure 16. Average temperature cloud chart in the cylinder.
Energies 13 00990 g016
Figure 17. Changes in CA10 and CA50 and NG injection timing.
Energies 13 00990 g017
Figure 18. Variation of ITEg and NG injection timing.
Energies 13 00990 g018
Figure 19. Distribution of energy loss.
Energies 13 00990 g019
Figure 20. Influences of NG injection timing on NOx and soot emissions.
Energies 13 00990 g020
Figure 21. Changes of hydrocarbon (HC) and carbon monoxide (CO) emissions with NG injection timing.
Energies 13 00990 g021
Table 1. Main technical parameters of the engine.
Engine ParameterValue
Bore × stroke (mm)137✕169
Connecting rod length (mm)261
Displacement (L)14.9
Compression ratio17:1
Swirl ratio1.2
Rotation speed (rpm)1300
Shape of combustion chamberω
Diesel injection cone angle (°)72
Nozzle number ✕ diameter (mm)9✕0.17
Inlet valve close (° CA BTDC)150
Exhaust valve open (° CA ATDC)140
Table 2. Selection of sub-models for the CFD numerical simulation.
ModelsSub-Model
Turbulence modelStandard k-ε model [13]
Spray modelCrushing modelKH-RT model [14,15]
Evaporation modelFrossling model [16]
Collision modelNTC [14], Wall film model [17]
Combust-ion modelCombustion modelSAGE chemical reaction solver [18]
Wall heat transfer modelHan & Reitz heat transfer model [19]
Emission modelNOx emissions modelExtended Zel’dovich NOx model [20]
Soot emissions modelHiroy soot model [21]
Table 3. Main simulation parameters of the two combustion modes.
ParametersValue
HPDIPPCI
Rotation speed (rpm)1300
CH4 injection mass (mg)About 27
Diesel injection mass (mg)5.63
Diesel injection timing (° CA BTDC)1510
Diesel injection pressure (MPa)31, 11
NG injection timing (° CA BTDC)0, 2.5, 5, 7.5, 10, 12.5, 1510, 12.5, 15, 17.5, 19, 20
NG injection pressure (MPa)30, 10
EGR rate0%
Swirl ratio1.2
Table 4. Model verification of main boundary conditions at working points.
ParametersValue
Intake Pressure (bar)2
Intake Temperature (K)363
Injection timing of NG (° CA BTDC)30
Injection timing of diesel (° CA BTDC)7
Wall temperature (K)450
Piston head temperature (K)500
Cylinder head temperature (K)500
Table 5. Validation of relevant parameters for jet model.
ParametersValue
The cylinder diameterR ✕ L: 20 ✕ 90 mm
The injection parameters P 0 , inj   = 15 MPa; T 0 , inj   = 350 K
Cylinder environment parameter P 0 , ch   = 5 MPa; T 0 , ch   = 850 K
Cylinder wall temperature T w   = 450 K
The nozzle diameter d N   = 0.5 mm
Turbulent kinetic energy (TKE)1.5 m 2 / s 2
Table 6. Experimental data calibration parameters.
ParametersValue
Engine typeWestport HD 15 L HPDI
Rotate speed1000 rpm
BMEP12 bar
EGR rate31%
SOING30° CA BTDC
SOIDiesel7° CA BTDC
Intake pressure2 bar

