1. Introduction
In recent years, interest in biomass as an alternative to fossil fuels has been steadily increasing. Besides the classical combustion process, which is mostly suitable for wooden residues [
1], several types of thermochemical and biological processes are considered attractive for producing energy and biofuels. Thermochemical processes are based on gasification [
2] or pyrolysis [
3] of biomass to obtain energy and biofuels [
4,
5]. Biological processes are based on bacterial, or in some cases, algal fermentation to obtain ethanol from sugary biomass [
6] or biogas from water-rich organic material [
7]. In particular, the production of biogas from anaerobic digestion has become widespread in Europe. Many European countries are encouraging the development of anaerobic digestion systems since they produce clean energy starting from organic waste [
8] and promote the diffusion of a circular economy [
9]. In addition, anaerobic digestion can also provide sanitation services by using sewage and municipal organic waste as an input [
10]. Biogas produced in an anaerobic digestion system is normally burned in a cogeneration unit to produce heat for the digestion process and electricity [
11]. This approach has been widely investigated in the literature. Whiting et al. [
12] estimated the lifecycle impact of anaerobic digestion operating with agricultural waste to produce electricity and heat as a function of the type of waste fed into the process.
Several authors have focused on improving the efficiency of the cogeneration by recovering the heat from the cogeneration unit. In a previous work, the authors assessed the feasibility of recovering the thermal energy to supply a district heating and cooling system [
13]. They found that trigeneration can be economically feasible (with high payback periods) only under the condition that the final user is located near the plant due to the high cost of the connection. A similar result was obtained by Pöschl et al. [
14], who concluded that cogeneration is profitable only if the final user is located at a relatively short transmission distance. Gebrezgabher et al. [
15] used the heat rejected from the cogenerator to feed a drying system to reduce the moisture content of the digestate, thus reducing the volume and therefore the cost of digestate transportation and disposal. Organic Rankine cycles (ORCs) are another opportunity to improve the efficiency of the cogeneration system by increasing the electric power output. Many authors in the literature have analyzed the feasibility of adopting an ORC in a biogas plant, and have mainly focused on the optimization of the cycle parameters such as expander geometry [
16], type of architecture [
16], and cycle parameters [
17]. In a previous work, the authors showed that simple modifications to the digestion plant can lead to efficiency improvements over one year of operation [
18].
All these technologies are interesting solutions for reducing the amount of thermal energy losses and have been extensively adopted in existing plants. However, many countries are now using governmental subsides to promote the production of biomethane to be injected in the natural gas grid and eventually be used as a fuel for the transportation sector [
19]. Biomethane produced from biogas upgrading is an attractive biofuel as it is mostly made up of methane (more than 97%) [
20,
21]. The adoption of biomethane does not require any conversion of traditional natural gas-fueled engines and can be easily stored on board as compressed gas [
22] or in a liquid state after a liquefaction process [
23,
24]. Many authors have investigated the potential of producing biomethane from anaerobic digestion plants: Salama et al. [
25] focused on maximizing biomethane production by improving the digester diet. De Clercq et al. [
26] built a machine learning algorithm to forecast biomethane production as a function of the digester feed. Cucchiella et al. [
27] analyzed the economic benefits of biomethane production in the Italian context for each type of feeding biomass. None of these or other similar studies has considered the integration of the upgrading systems in the anaerobic digestion plant from an energy balance point of view.
The introduction of a new process in an anaerobic digestion plant may change the overall energy balance and requires careful design. As an example, Yuan et al. [
28] studied the effect of implementing a thermal pre- and post-treatment of the organic wastes in an anaerobic digestion plant. This modification had a positive effect on the performance of the plant, but a detailed energy analysis of the system was necessary. Bohutskyi et al. [
29] developed a numerical model to predict biogas production in an anaerobic digestion plant where the synergic action of micro-algae and bacteria takes place. In the study they also focused on the electric and heat balance of the plant. Sung et al. [
30] considered the average energy balance of an anaerobic digestion plant to assess the optimal design of an organic Rankine cycle unit recovering the cogenerator waste heat.
When producing biomethane, it is important to estimate the impact of the upgrading system on the energy balance of the plant since upgrading and biomethane production impact the optimal size of the cogeneration unit [
31]. Careful choice of the cogeneration unit and of the plant operation is therefore required. This study aims to evaluate the energy balance, CO
2 saving and revenues of a reference plant as a function of the amount of biomethane produced. By varying the fraction of produced biogas sent to the upgrading system, the net balance of electricity and heat was evaluated. The economic and environmental analysis (avoided CO
2 emissions) showed that the biomethane prices encourages interest in operating conditions with no cogeneration (low energy efficiency) and high CO
2 emissions.
2. Case Study
As a reference case study, an anaerobic digestion plant that processes the sludge from a municipality waste-water treatment plant was considered [
32,
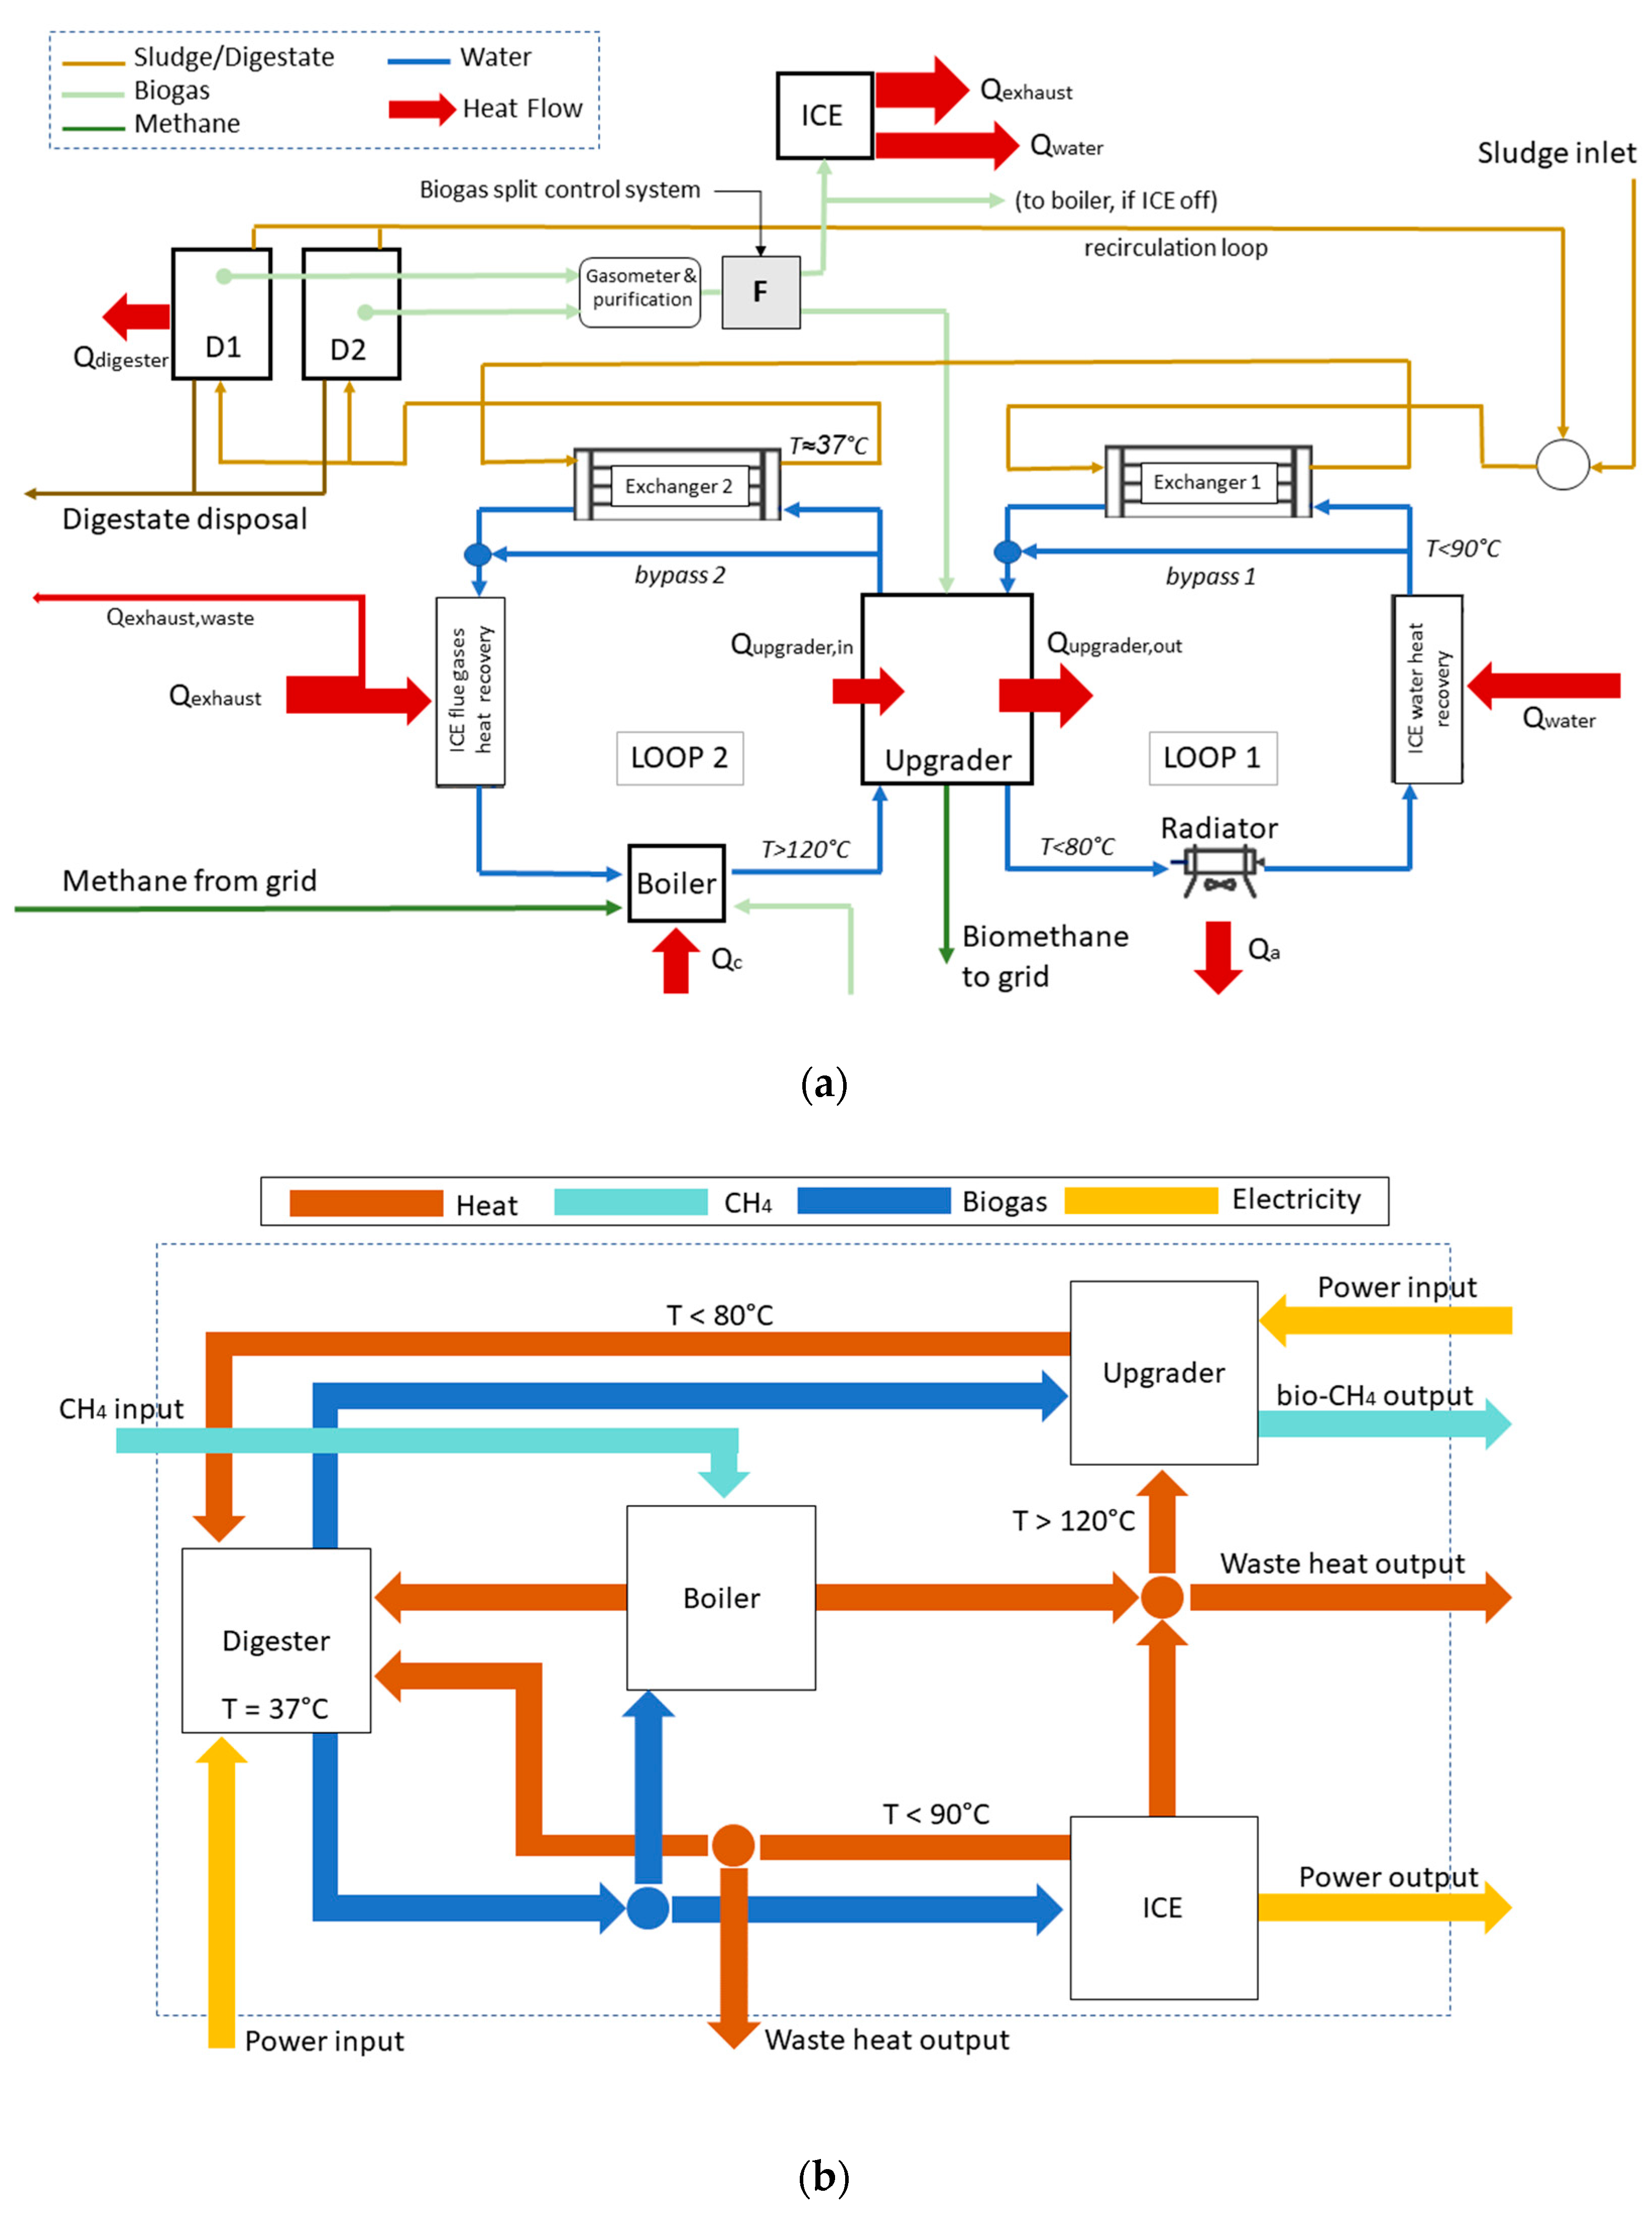
33]. The system is made up of two anaerobic digesters, a biogas/methane fueled boiler, an internal combustion engine (ICE) and a biogas upgrading system. The plant scheme is shown in
Figure 1a. The heat management is performed by means of two heat exchange sections named Loop 1 and Loop 2, which are thermally connected through the upgrader. The mass and energy streams between the components are highlighted in different colors in
Figure 1b. Two digesters (D1 and D2) of 3000 m
3 and 1300 m
3 co-digest sewage and bio-wastes and produce 235 Nm
3/h of biogas with about 65%
vol methane concentration. Sludge recirculation with a 1:23 mass flow ratio value is thought to prevent the achievement of high temperatures during sludge heating. This means that the sludge mass flow circulating in the heat exchangers is much greater than the actual sludge mass flow treated by the plant.
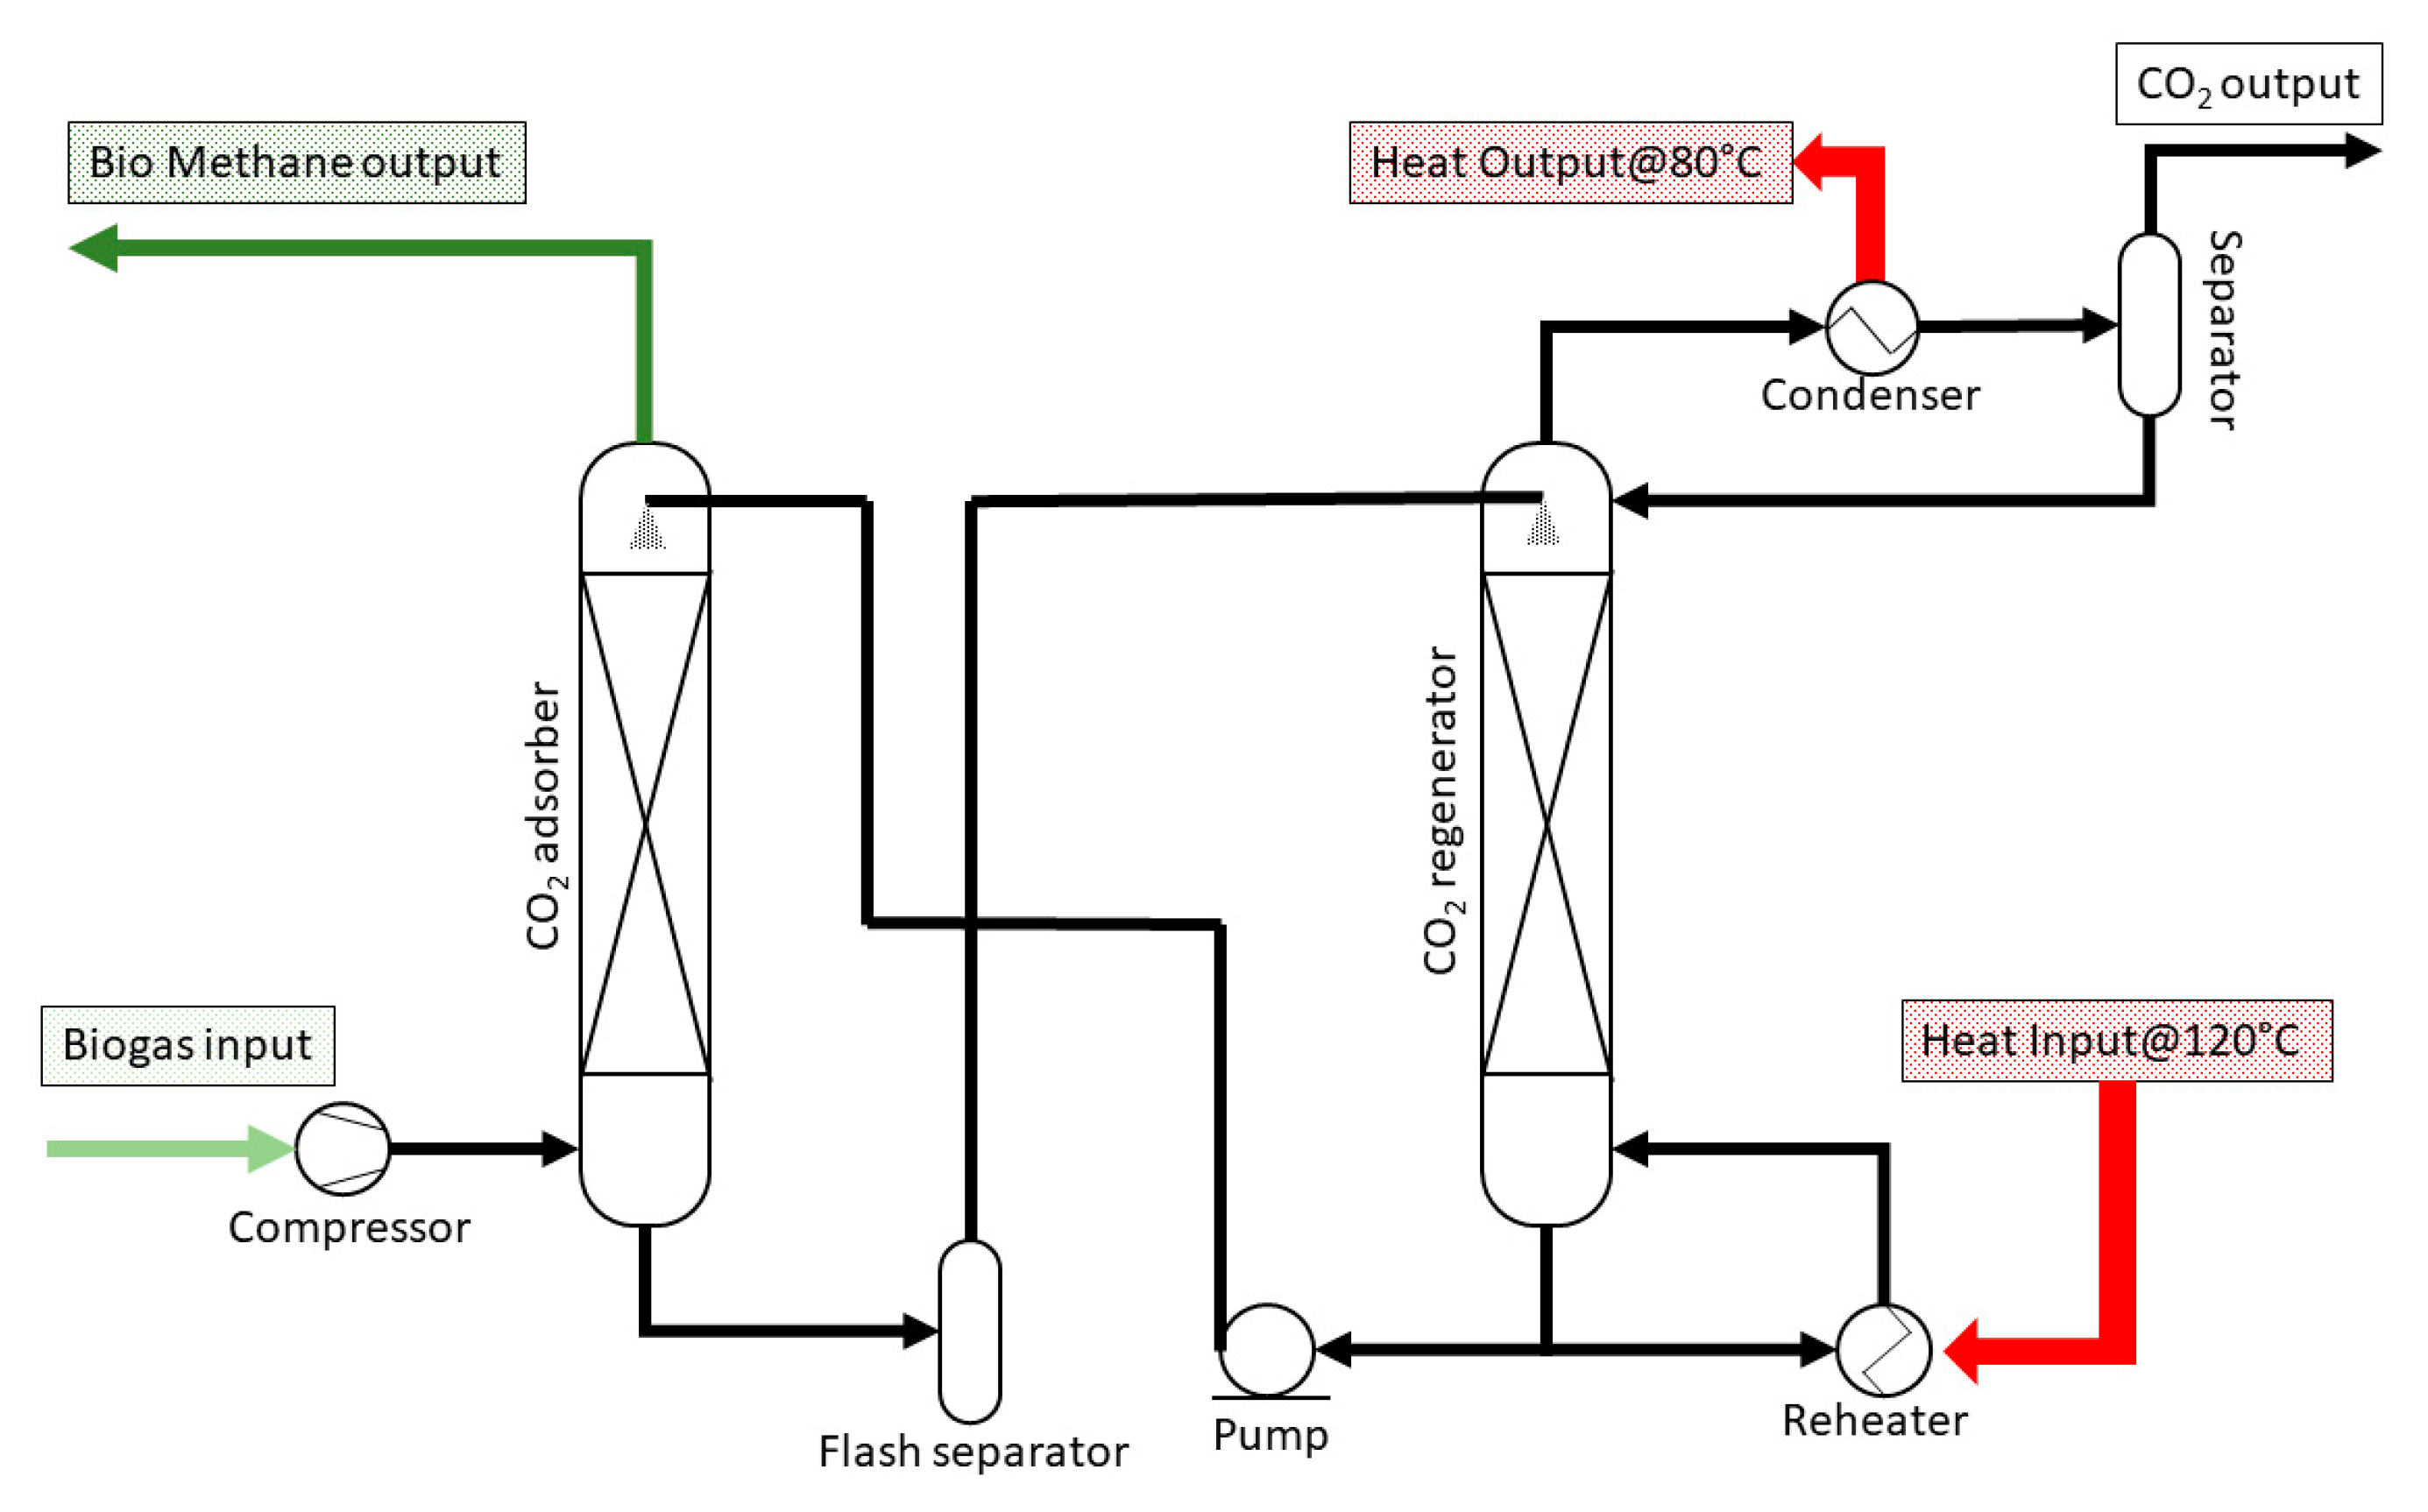
The boiler operates with both natural gas and biogas to produce heat for the digesters and the upgrading system when the cogeneration unit is not sufficient. The upgrading system is assumed to be an absorption unit from Green Methane based on hot potassium carbonate absorption (Green Methane hot potassium carbonate, GM-HPC) [
34]. According to the manufacturer of the system, the unit produces biomethane with a CO
2 content less than 1%
vol. The upgrader requires electricity and thermal energy at a temperature of 120 °C. However, 75% of the thermal energy may be recovered at a temperature of 80 °C and can be used for sludge heating. The upgrader scheme is shown in
Figure 2.
An internal combustion engine (ICE) has been used as a cogeneration unit. In order to perform the analysis of the system as a function of the amount of upgraded biogas, different internal combustion engines (i.e., with different sizes) operating in nominal conditions were considered according to the literature on biogas-fueled ICEs [
35,
36]. The minimum and the maximum size that was considered is 68 kW and 550 kW, respectively. For each size, the flue gases thermal output referred to a temperature of 120 °C (Q
exhaust), the cooling water thermal output (Q
water) and the electric efficiency (
η) at nominal operating conditions were considered [
35,
36]. These quantities linearly fitted as a function (
y =
mx +
q, where m is the angular coefficient of the linear line and q is the intercept) of the electric power Pel (i.e., x is P
el, and y can be Q
exhaust, Q
water or the ICE efficiency
). For a given value of the engine power, the corresponding fitted value of efficiency, heat content in the exhaust and heat dissipated in cooling water could be determined. The results of the fitting are reported in
Table 1, together with the coefficient of determination, R
2.
The cooling circuit of the upgrading system (i.e., water at about 80 °C) provides thermal energy to sludge through the heat exchanger HE-01. The additional thermal energy required to keep the sludge at 37 °C is provided through the heat exchanger HE-02 by a water loop connected to the boiler and the cogeneration system. The cogeneration system provides low temperature heat Qwater (below 90 °C) in the Loop 1 circuit, and high temperature heat Qexhaust (above 120 °C) on the Loop 2 side. Qexhaust may be limited by diverting some of the flue gases to ensure proper temperature control of Loop 2. Similarly, Qa may be removed from Loop 1 through an air cooler to keep the temperatures within the constraint range.
The boiler may also be used to maintain the water temperature at the upgrading system inlet at a minimum of 120 °C as required by the manufacturer’s specifications. Internal electric energy consumption of the plant (i.e., power required by the auxiliary system such as sludge pre-treatment, handling and pumping) is proportional to the sludge mass flow rate and is estimated as 225 kW (constant value). This power is provided by the ICE or by the electric grid when the first one is not enough. In the case of a power surplus, the excess of power may be sold to the grid. From this perspective, the plant produces three main products, that is, power, thermal energy and bio-methane and their amounts are strictly dependent on each other. To assess this nexus, a simulation of the system was carried out. The energy and mass streams between plant components were analyzed as a function of the fraction of the amount of biogas used in the upgrading system. In general terms, biogas can be used in the upgrading system, in the ICE and in the boiler. The mass flow rate of biogas sent to the upgrading system was considered as a variable input. The remaining amount of biogas was used first in the ICE and then in the boiler. Methane from the grid was used only when no biogas was available, and the recovered thermal energy was not enough to keep the sludge at the required temperature. Exhaust gas thermal energy was used first in the upgrading system as a large portion of it is recovered to provide heat to the sludge. If necessary, other thermal surpluses may be used to achieve the target sludge temperature.
3. Material and Methods
Steady-state mass and energy conservation equations were adopted to model the system according to the scheme shown in
Figure 1. The ICE was modeled according to the equations reported in
Table 1. For each operating condition, power output, exhaust gas mass flow rate and temperature were estimated. The total thermal power requested by sludge (
) was the sum of the power requested to heat up sludge from inlet to digestion conditions (37 °C) and of the thermal losses from the digesters (Equation (1)):
where
is the digesters’ loss and
is the thermal power requested to heat the sludge.
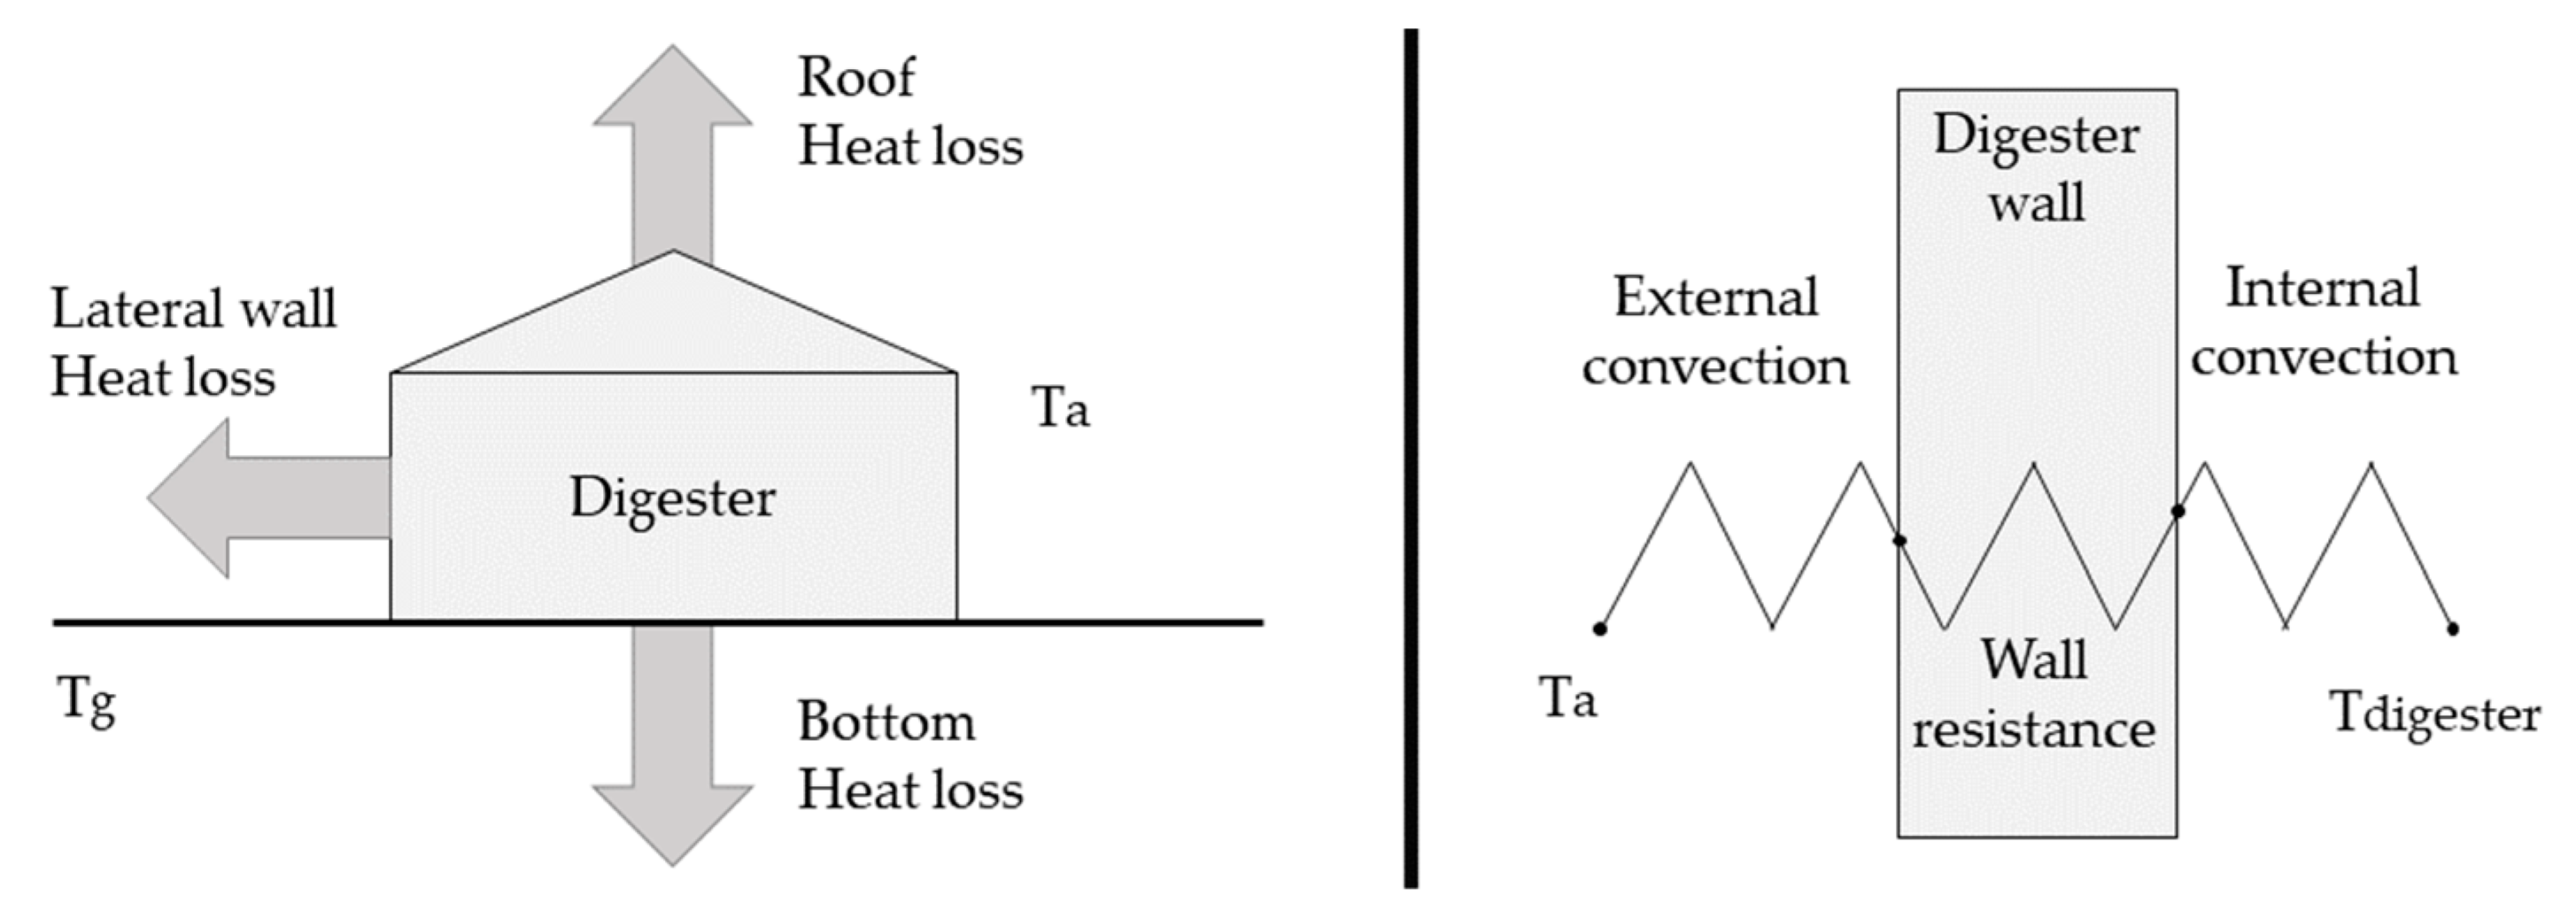
The thermal loss from the digesters was estimated by considering the heat transfer convection from the lateral wall, roof and ground, according to the equivalent electric scheme reported in
Figure 3 (Equation (2)).
where
is the overall heat transfer coefficient,
is the heat transfer surface,
is the digestion temperature,
is the ambient temperature and
is the ground temperature, which is assumed to be 20 °C. The subscript
refers to roof,
to lateral wall and
to the bottom part of the digester exchanging heat with the ground.
Heat exchangers were simulated by considering the constant effectiveness
, as reported in Equations (3) and (4). For HE-01 (
Figure 1) the energy balance equation was expressed as:
and for HE-02 the energy balance was expressed as:
where
is the mass flow rate and the
is the specific heat of the
i-th fluid (i.e., flue gases
f, sludge
s or water
w).
In and
out subscripts indicate the flow direction according to the scheme presented in
Figure 1a. Since the solid portion of the sludge is less than 5%, and the remaining 95% is water, the physical properties of water were assumed for sludge. Obviously, this approximation is a source of error but by considering the small amount of solid in the mixture, the resulting error can be considered negligible for the purpose of the study. This is confirmed by the literature as reported in [
37]. A constant efficiency of 0.85 was assumed for the boiler. The analysis was conducted for a typical day that was considered as representative of the average conditions of the site. In particular, the simulation was made by adopting a daily average value for air temperature (T
a), sludge temperature (
), and sludge and biogas flow rates (m
sludge and V
biogas, respectively). The value of these parameters is reported in
Table 2. The upgrader water inlet temperature in Loop 1 and Loop 2,
and
, the water temperature after the ICE cooling system
, the water temperature after the ICE exhaust gas heat exchanger
and the anaerobic digestion temperature T
digester were assumed as the problem constraints (see
Table 2).
The thermal energy dissipated in the exhaust in Loop 2 () and by the air cooler in Loop 1 () were considered as system losses. The heat contained in the cogenerator exhaust gas is provided by the manufacturer and thus a reference temperature of 120 °C was used.
The percentage of biogas used in the upgrading system was indicated by the variable
F, i.e., the ratio between the mass flow rate of biogas used in the upgrading process and the total biogas production of the plant (Equation (5)).
It is clear, that (1-
F) is the fraction of biogas that is processed by the internal combustion engine or by the boiler. The boiler is assumed to operate with both methane and biogas. However, from an economic point of view, natural gas operation is preferred due to the availability of government subsidies for biomethane production (as shown in the sections below). Therefore, biogas use for heating is only considered when no other choices are available (i.e., when high
F is considered, or when the ICE is shut down). Within this framework,
F has a strong impact on plant operation. A set of non-linear constrained systems from the mass and energy balance is implemented in Matlab
® [
38] and solved separately for each loop. Specifically, two different objective functions were chosen to control the behavior of Loop 1 and 2. For Loop 1, the outlet sludge temperature from HE-01 was maximized, while for Loop 2 the heat provided by the boiler, Q
c, was minimized. As a result, the plant operates according to the provided constraints in a physically consistent way.
In the study, the value of F was varied, and the different operating conditions of the plant were investigated. The size of the cogeneration unit was changed according to the value of F up to a minimum value. After this value, a no-cogeneration condition was considered, and the thermal energy was assumed to be produced by the boiler and the necessary electric energy bought from the electric grid. In addition, as the heat recovered from the ICE is dependent on its size, when F assumes high values, the boiler must provide the necessary heat to the digesters and the upgrader. To investigate the net outputs of the system, the value of F was varied between 0% and 100%. For each value of F, the cogeneration unit size and energy output were determined. As the heat request from the upgrading system is known (and depending on F), both the thermal loop insisting on the upgrading system and the amount of heat transferred to the sludge in HE-01 and HE-02 may be calculated by considering the constraints regarding maximum and minimum temperatures in Loop 1 and 2. Finally, if the thermal energy requested is more than that recovered in the previous stages, the boiler independently provides the remaining heat to the sludge or to the upgrading system.
4. Results and Discussion
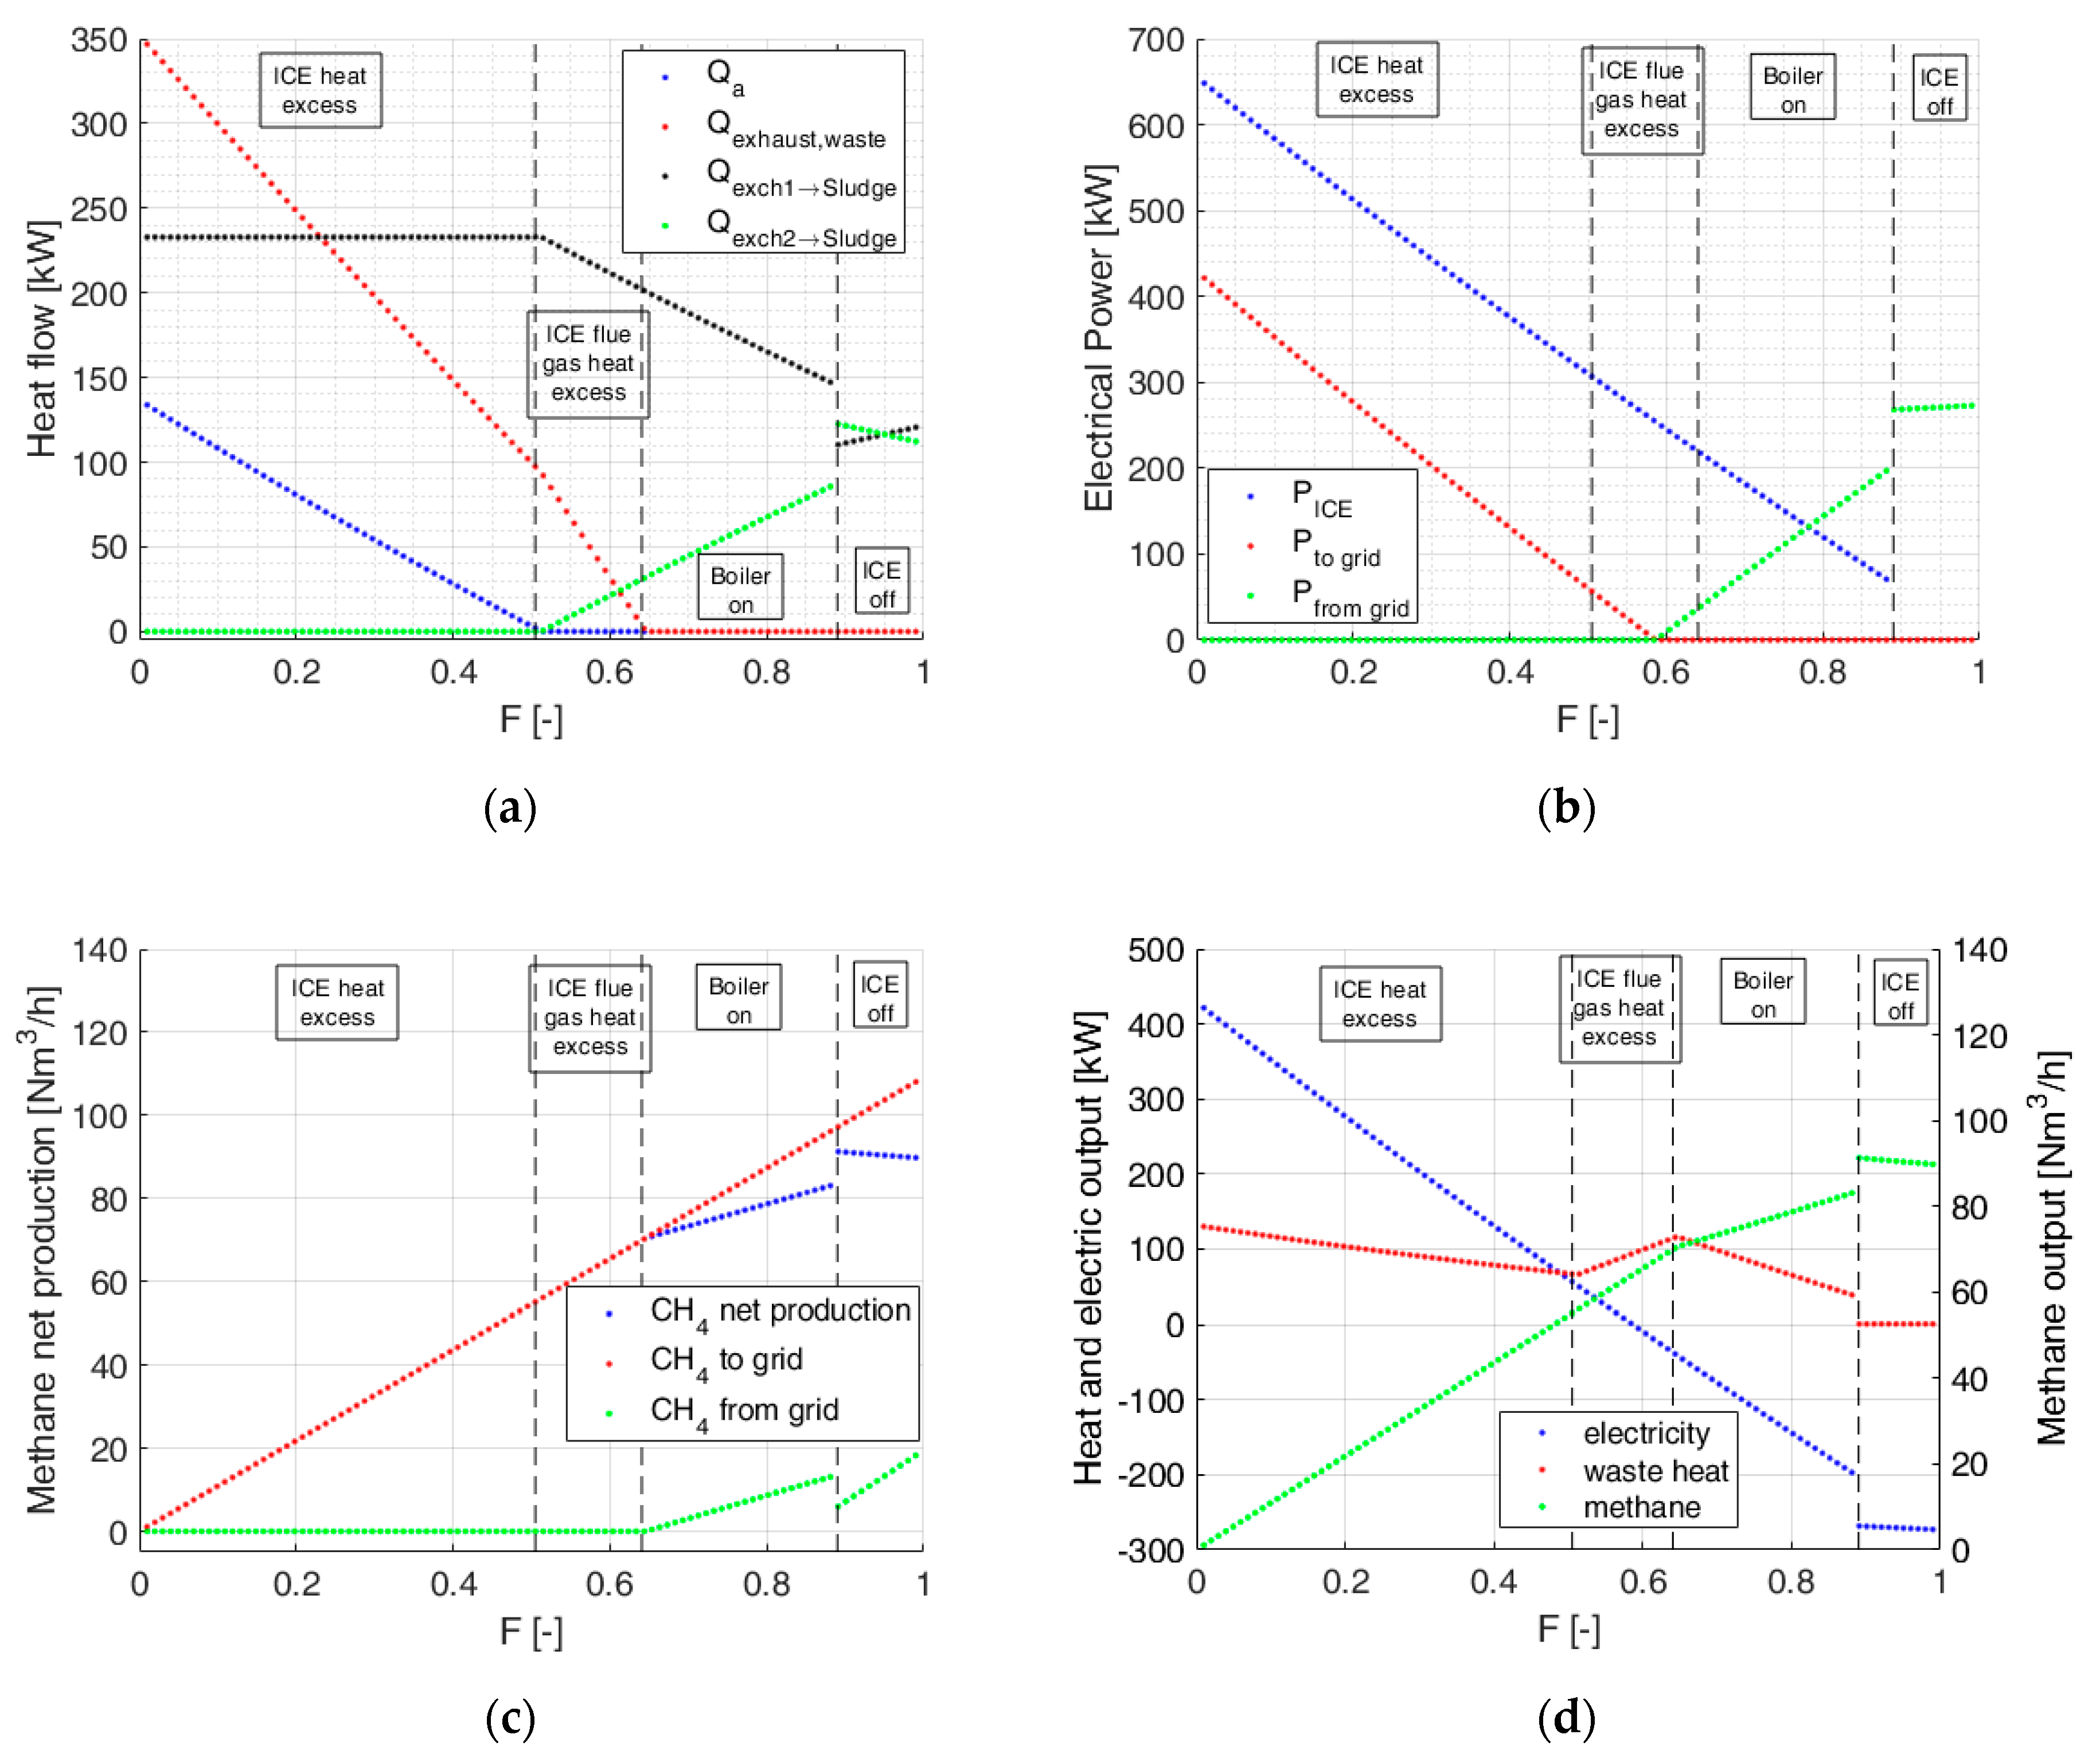
The results of the simulations are presented in
Figure 4a–d as a function of
F. In more detail,
Figure 4a is focused on the thermal energy fluxes through HE-01 and HE-02 or wasted through the radiator or the Q
exhaust bypass (see
Figure 1a).
Figure 4b shows the electric power source and users,
Figure 5c shows the methane production and
Figure 4d the net system outputs.
Figure 5 also reports the main events driving the system behavior, which are deduced from the scheme presented in
Figure 1b, the constraints showed in
Table 2, and the related cogeneration unit and boiler activities. Therefore, four operation patterns were detected according to the
F range (
Figure 4).
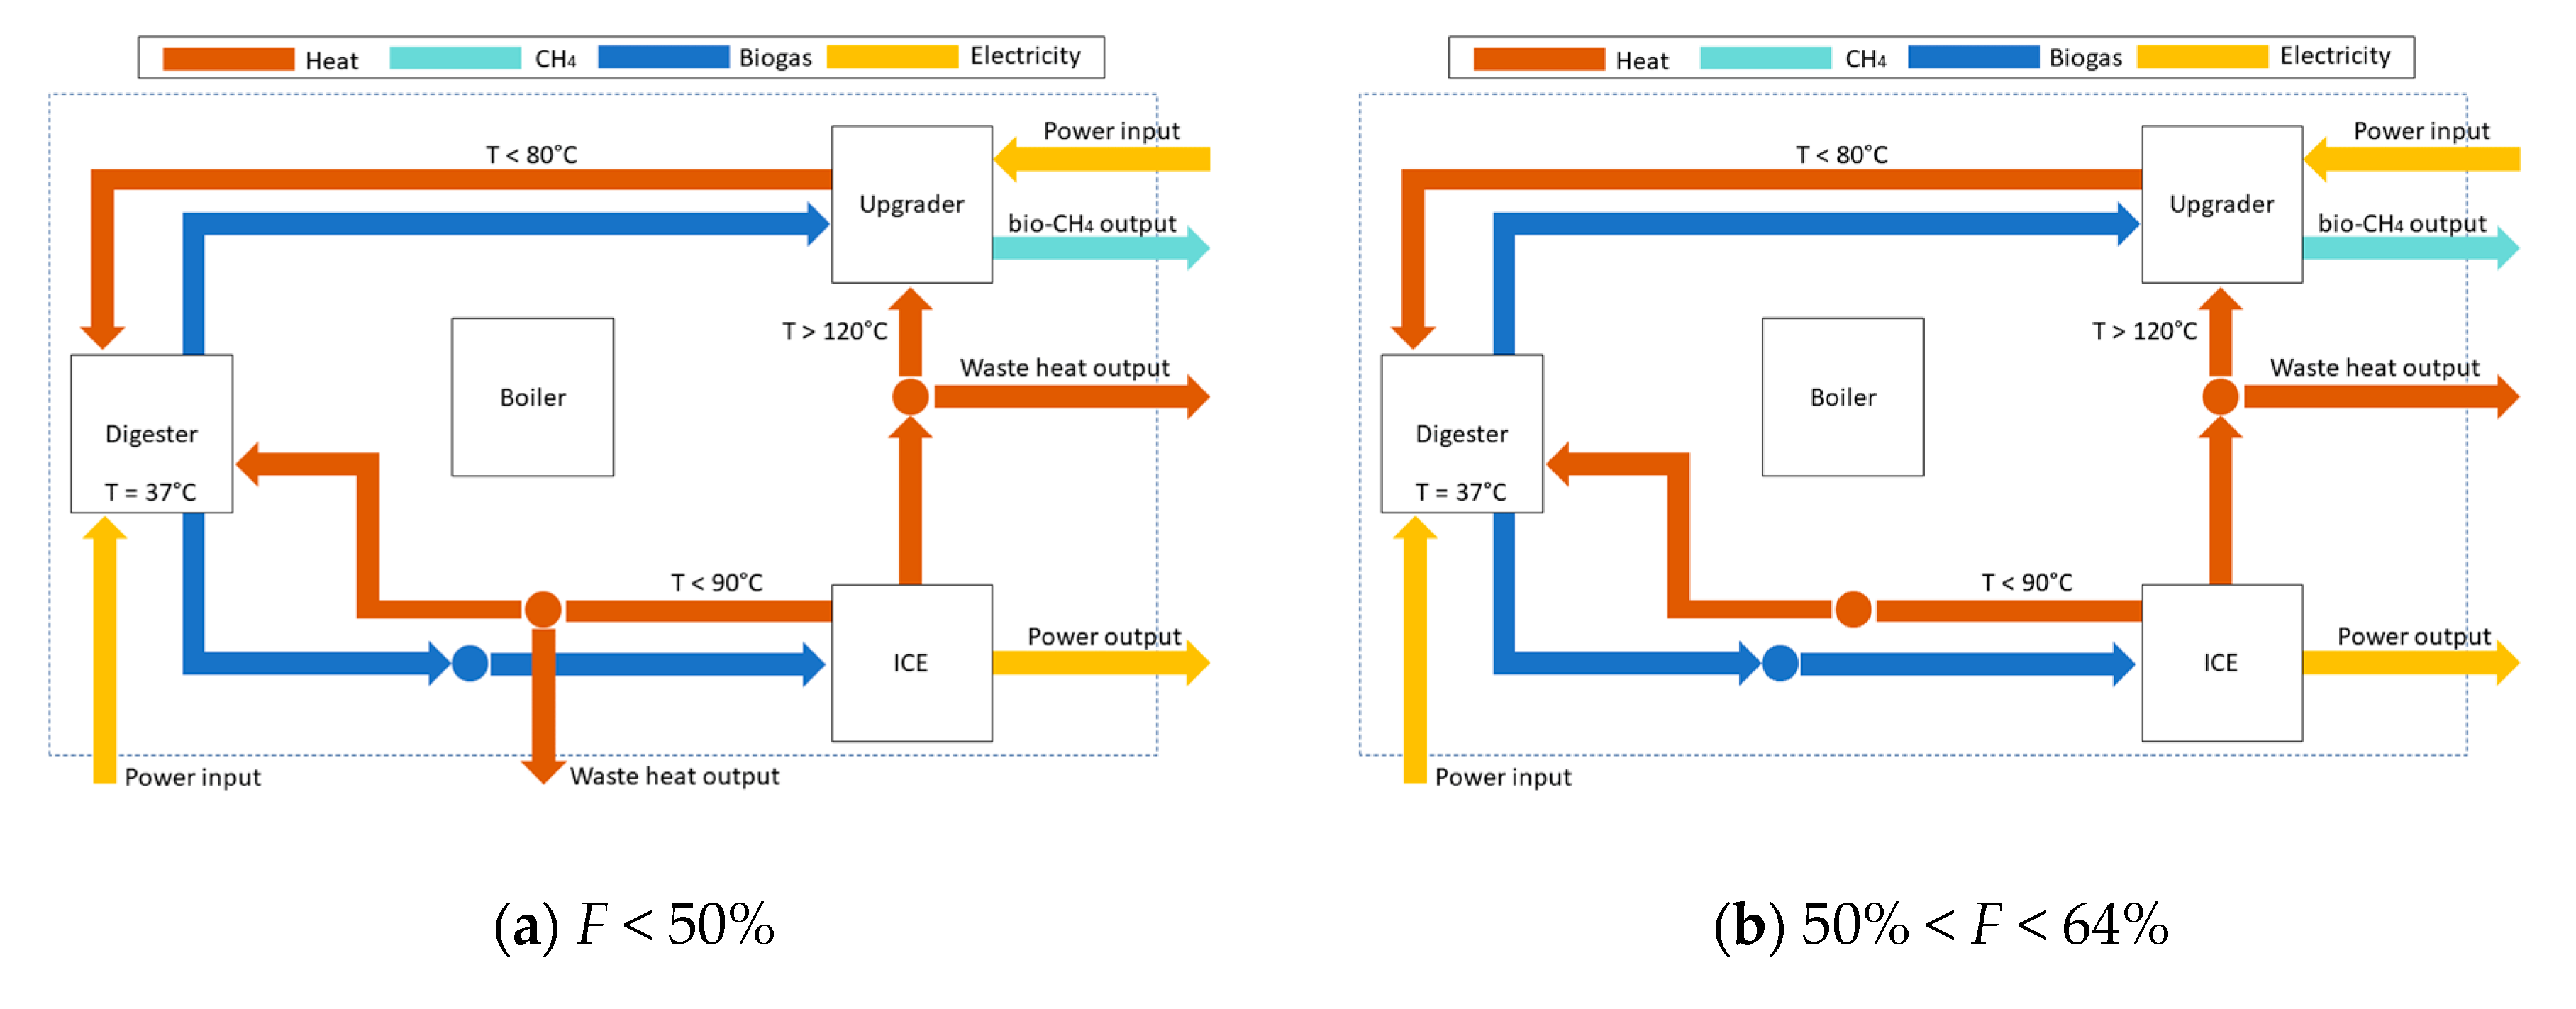
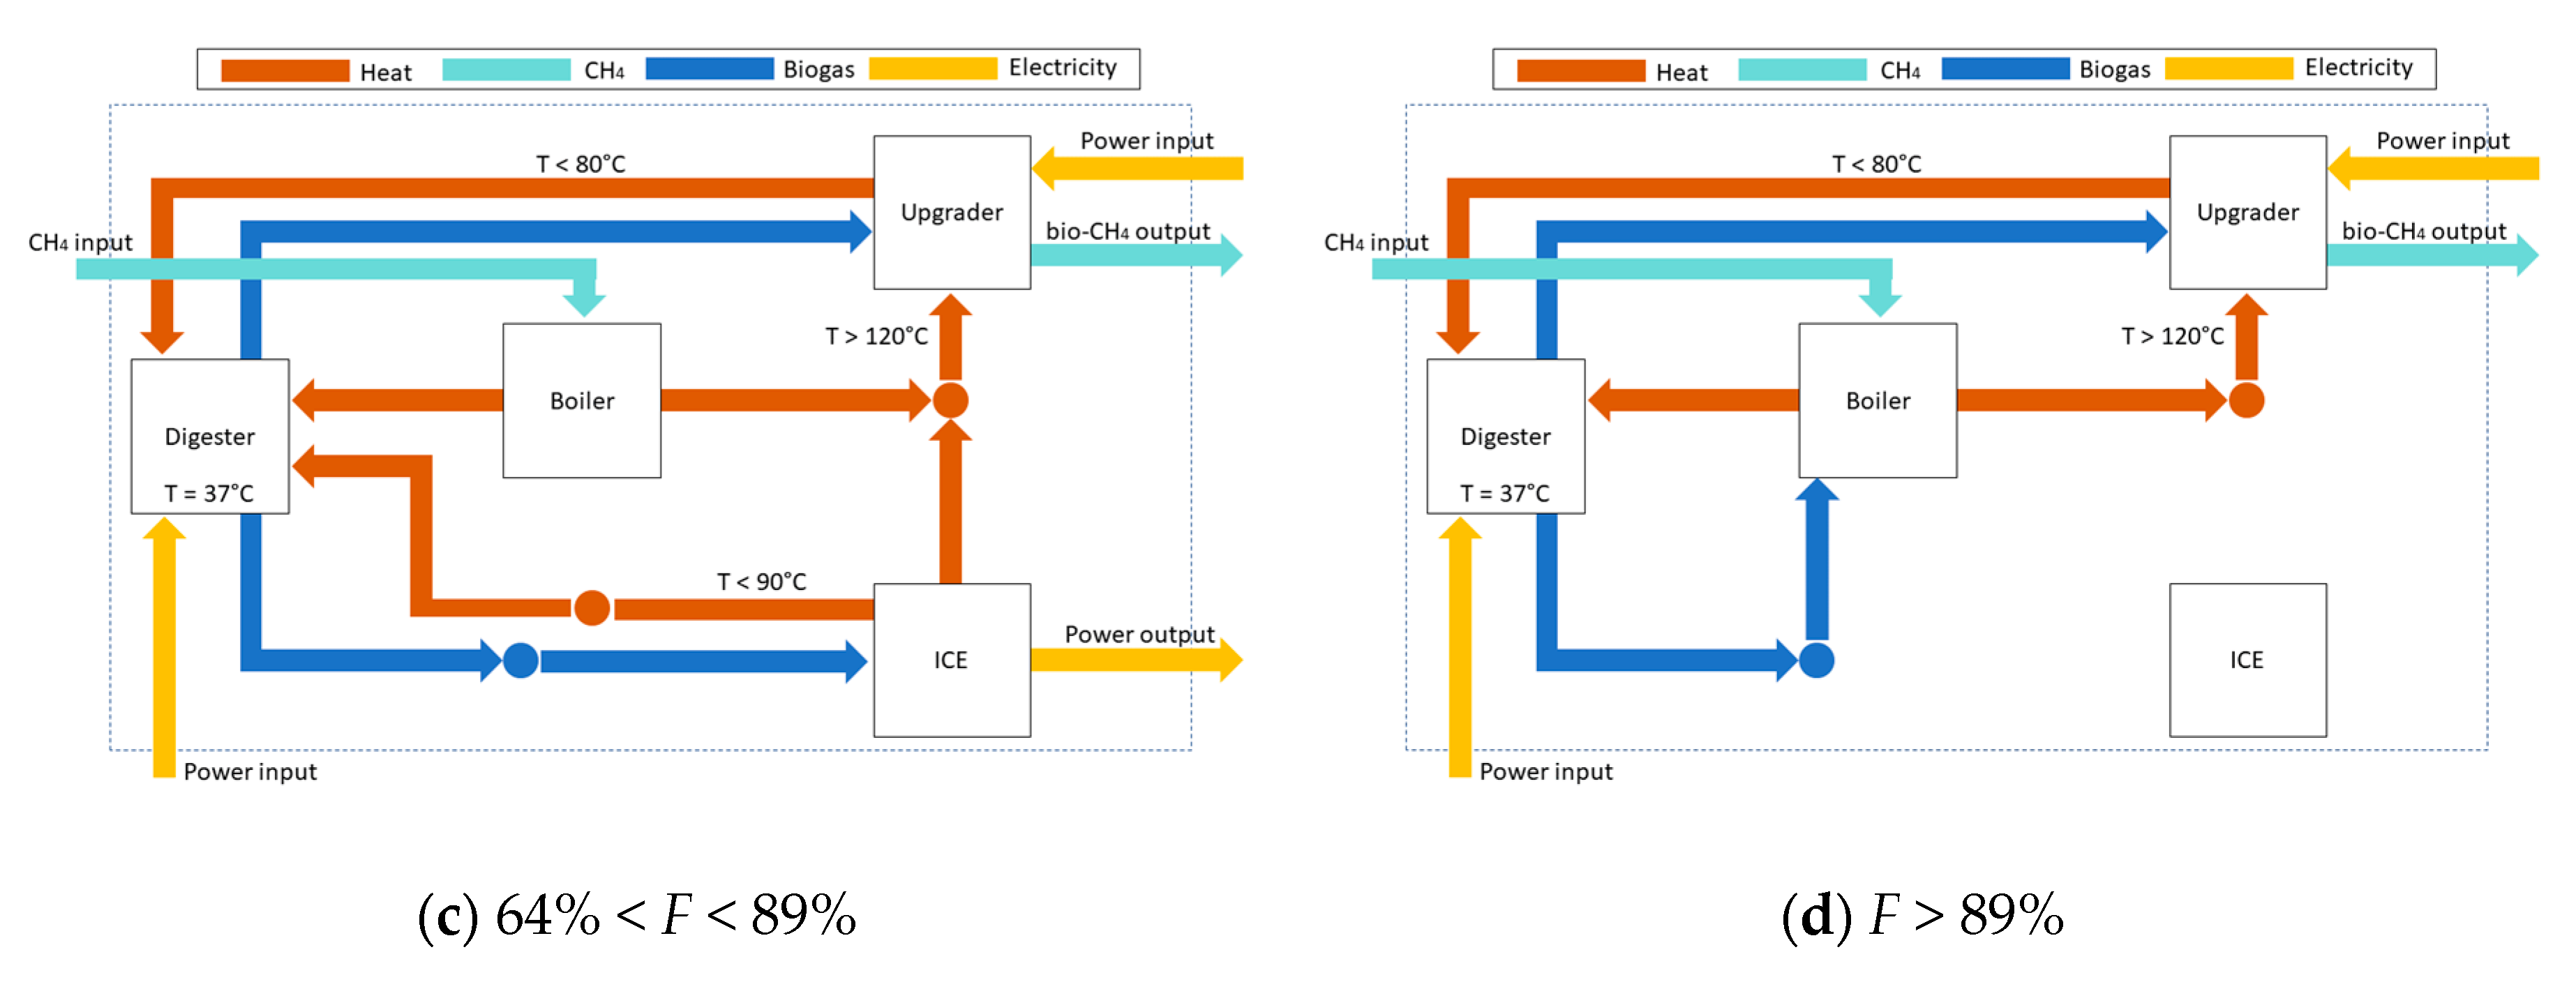
When
F is below 50% the ICE produces a significant heat surplus and both Q
exhaust bypass and Q
a lead to a thermal energy output from the plant, therefore each single term (i.e., biomethane, heat and electricity) has a positive output balance. Above 50%, the heat output from the engine is in excess only in Loop 2 and the ICE power production is reduced. In particular, when
F > 59% the net electric balance became negative (
Figure 4b). When 64 <
F < 89%, the ICE heat production is no longer enough to ensure a proper thermal input to the upgrader on Loop 2, and the boiler starts to operate. Since in the first instance the biogas is fully employed for the ICE operation, natural gas is required for heating purposes as shown on
Figure 4c. Above
F = 89%, not enough biogas input is provided to the engine, according to the minimum power size considered in the simulation (i.e., 68 kW). As shown by
Figure 4c, the methane consumption is significantly reduced due to the major availability of biogas (ICE is switched off) and to the better thermal efficiency of the boiler. In this phase, the heat necessary to the plant is completely produced by the boiler. When
F is lower than 50% the plant produces electricity and biomethane without any external integration (
Figure 5a), but a large amount of heat is wasted. As expected, electric production results are inversely proportional to biomethane production. As can be observed in
Figure 5b–d, when
F is about 59%, the electric power produced is totally self-consumed. For a further increase in biomethane production and therefore of
F, electric energy from the grid is required. For
F higher than 89%, the plant can only produce biomethane, and the ICE is shut down. Therefore, the (1-
F) biogas fraction is burned in the boiler to provide heat to the process. It is obvious that the production of a high amount of bio-methane and electrical power is not currently possible due to internal constraints. It is worth noting that the plant produces biomethane without any integration from external sources as long as
F is below 59%. For higher biomethane production, electric energy from the grid is requested. When
F is higher than 64 %, the heat produced from the biogas-fueled cogenerator is lower than that requested by the plant and an external integration of natural gas to be burned in the auxiliary boiler is necessary.
4.1. Carbon Dioxide Balance
To further investigate the behavior of the plant, the CO
2 emissions for the different operating conditions were estimated. The plant consumes natural gas and electricity from the grid according to the operating condition. Since natural gas was used in the boiler, the amount of CO
2 emitted was assumed as 0.202 kg
CO2/kWh [
39]. Emissions related to power consumption were assumed according to the average CO
2 emissions per kWh for the typical Italian production mix (i.e., 0.325 kg
CO2/kWh [
39]). Biogas was considered as a carbon neutral source. Therefore, self-consumption of electric and thermal energy leads to an emission saving of 0.202 kg
CO2/kWh and 0.325 kg
CO2/kWh, respectively. A saving of 0.202 kg
CO2/kWh was also assumed for the biomethane produced.
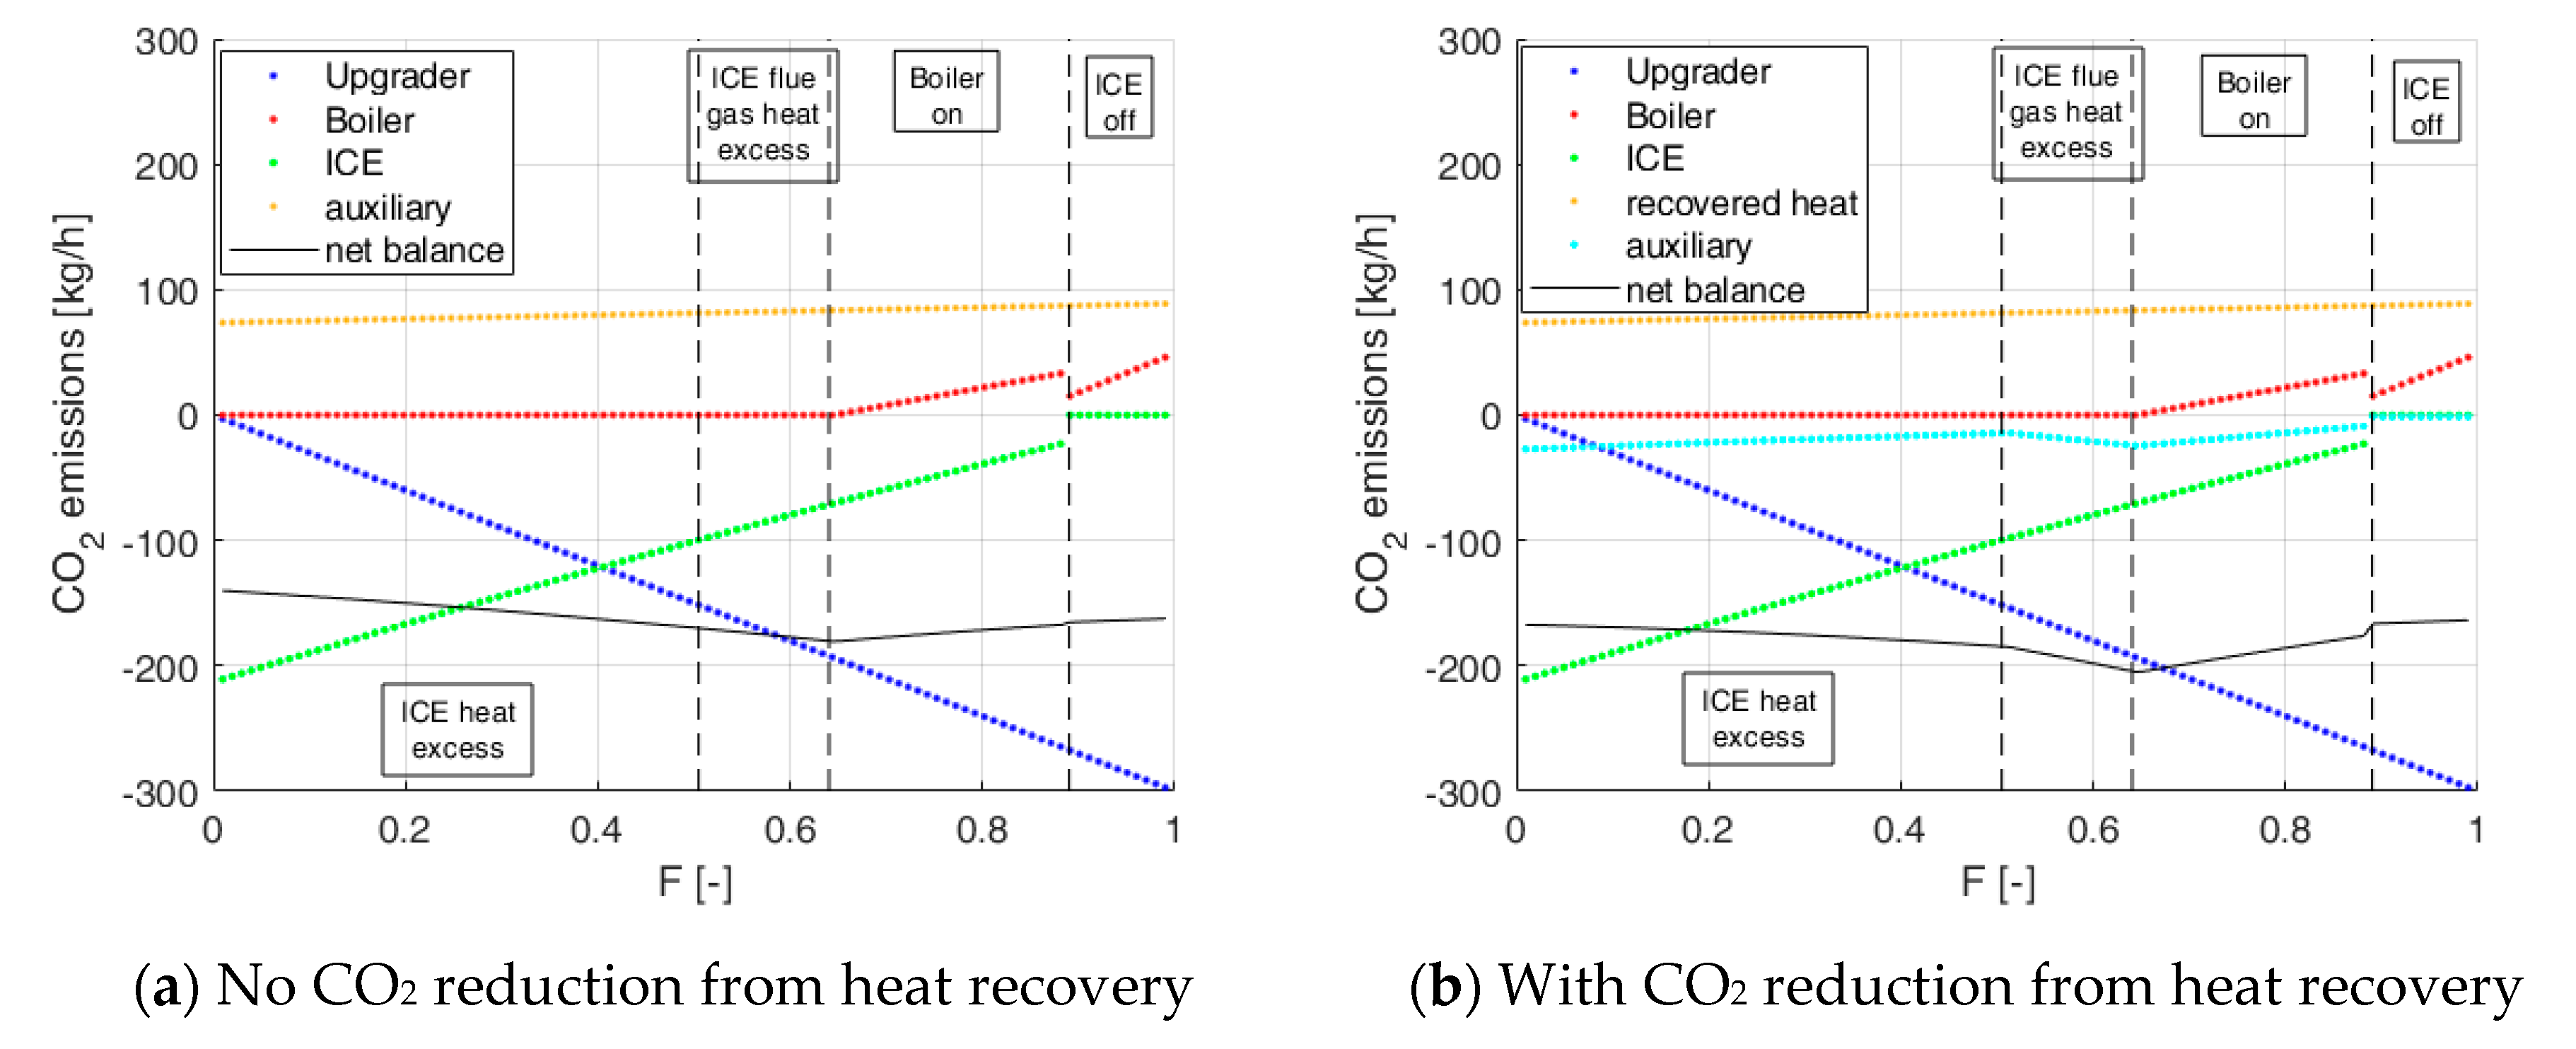
Two scenarios were considered for thermal energy surplus recovery. In a first case, thermal energy surplus (i.e., waste terms in
Figure 1b) was considered as dissipated and hence no CO
2 saving for that component was considered. In the second case, CO
2 saving according to the methane required to produce the same amount of heat was considered. These two scenarios are reported in
Figure 6a,b, respectively.
Biomethane production leads to a negative CO
2 emission profile for all the working conditions considered. As expected, the main reduction comes from the biomethane production due to biogas upgrading, and the ICE operation. In both cases, the minimum carbon dioxide net emissions are obtained when
F = 64%. This condition occurs when the plant is near self-sustaining conditions from an electrical point of view (
Figure 5) and only a small amount of electricity is bought from the grid to drive auxiliary and upgrading systems. From the thermal point of view, the cogenerator unit is sufficient to satisfy the thermal requirements of the plant. Therefore, in this operating condition the boiler is not necessary.
When thermal energy recovery is considered, CO
2 saving is significantly increased. Moreover, no influence of ICE behavior can be detected in the net balance slope in
Figure 6a, while more pronounced variations can be found in
Figure 6b due to the two different contributions of the ICE to heat production (flue gas and cooling water).
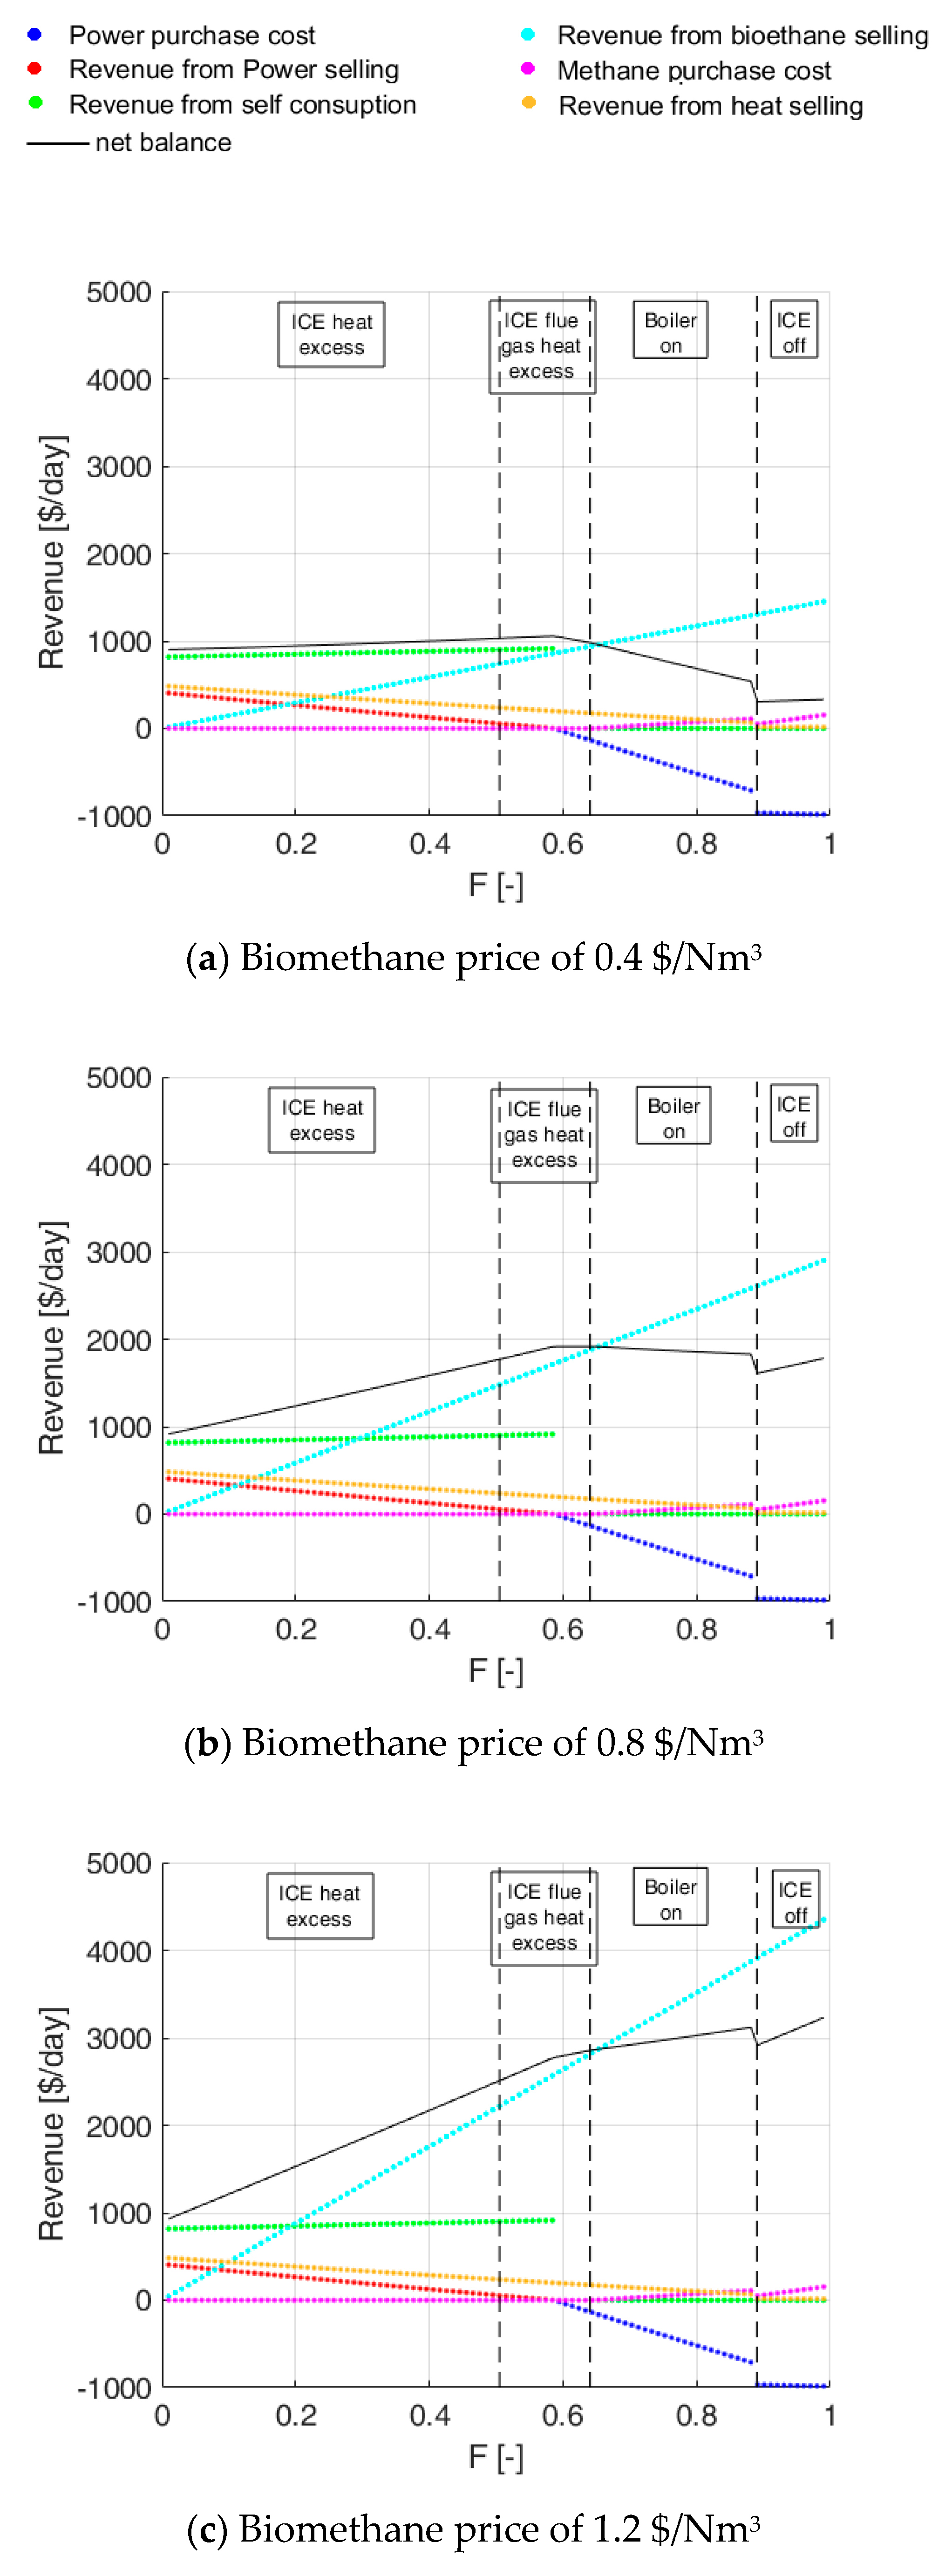
4.2. Revenues
The analysis was further extended to investigate the operative conditions that maximize the economic gain of the plant. In this analysis, the costs of acquired electricity and natural gas were assumed as 0.15
$/kWh and 0.24
$/Nm
3, respectively, as these are typical in the Italian context [
40]. The revenues derived from the self-consumed electric energy were estimated by multiplying the daily production for the same acquiring price of 0.15
$/kWh (avoided cost). The revenues from electric energy production were quantified by considering a selling tariff of 0.04
$/kWh. Finally, the biomethane production was accounted for by considering three different selling prices since governmental subsides are largely dependent on the digesters’ supply. Therefore, three final selling prices considering subsides (0.4, 0.8 and 1.2
$/Nm
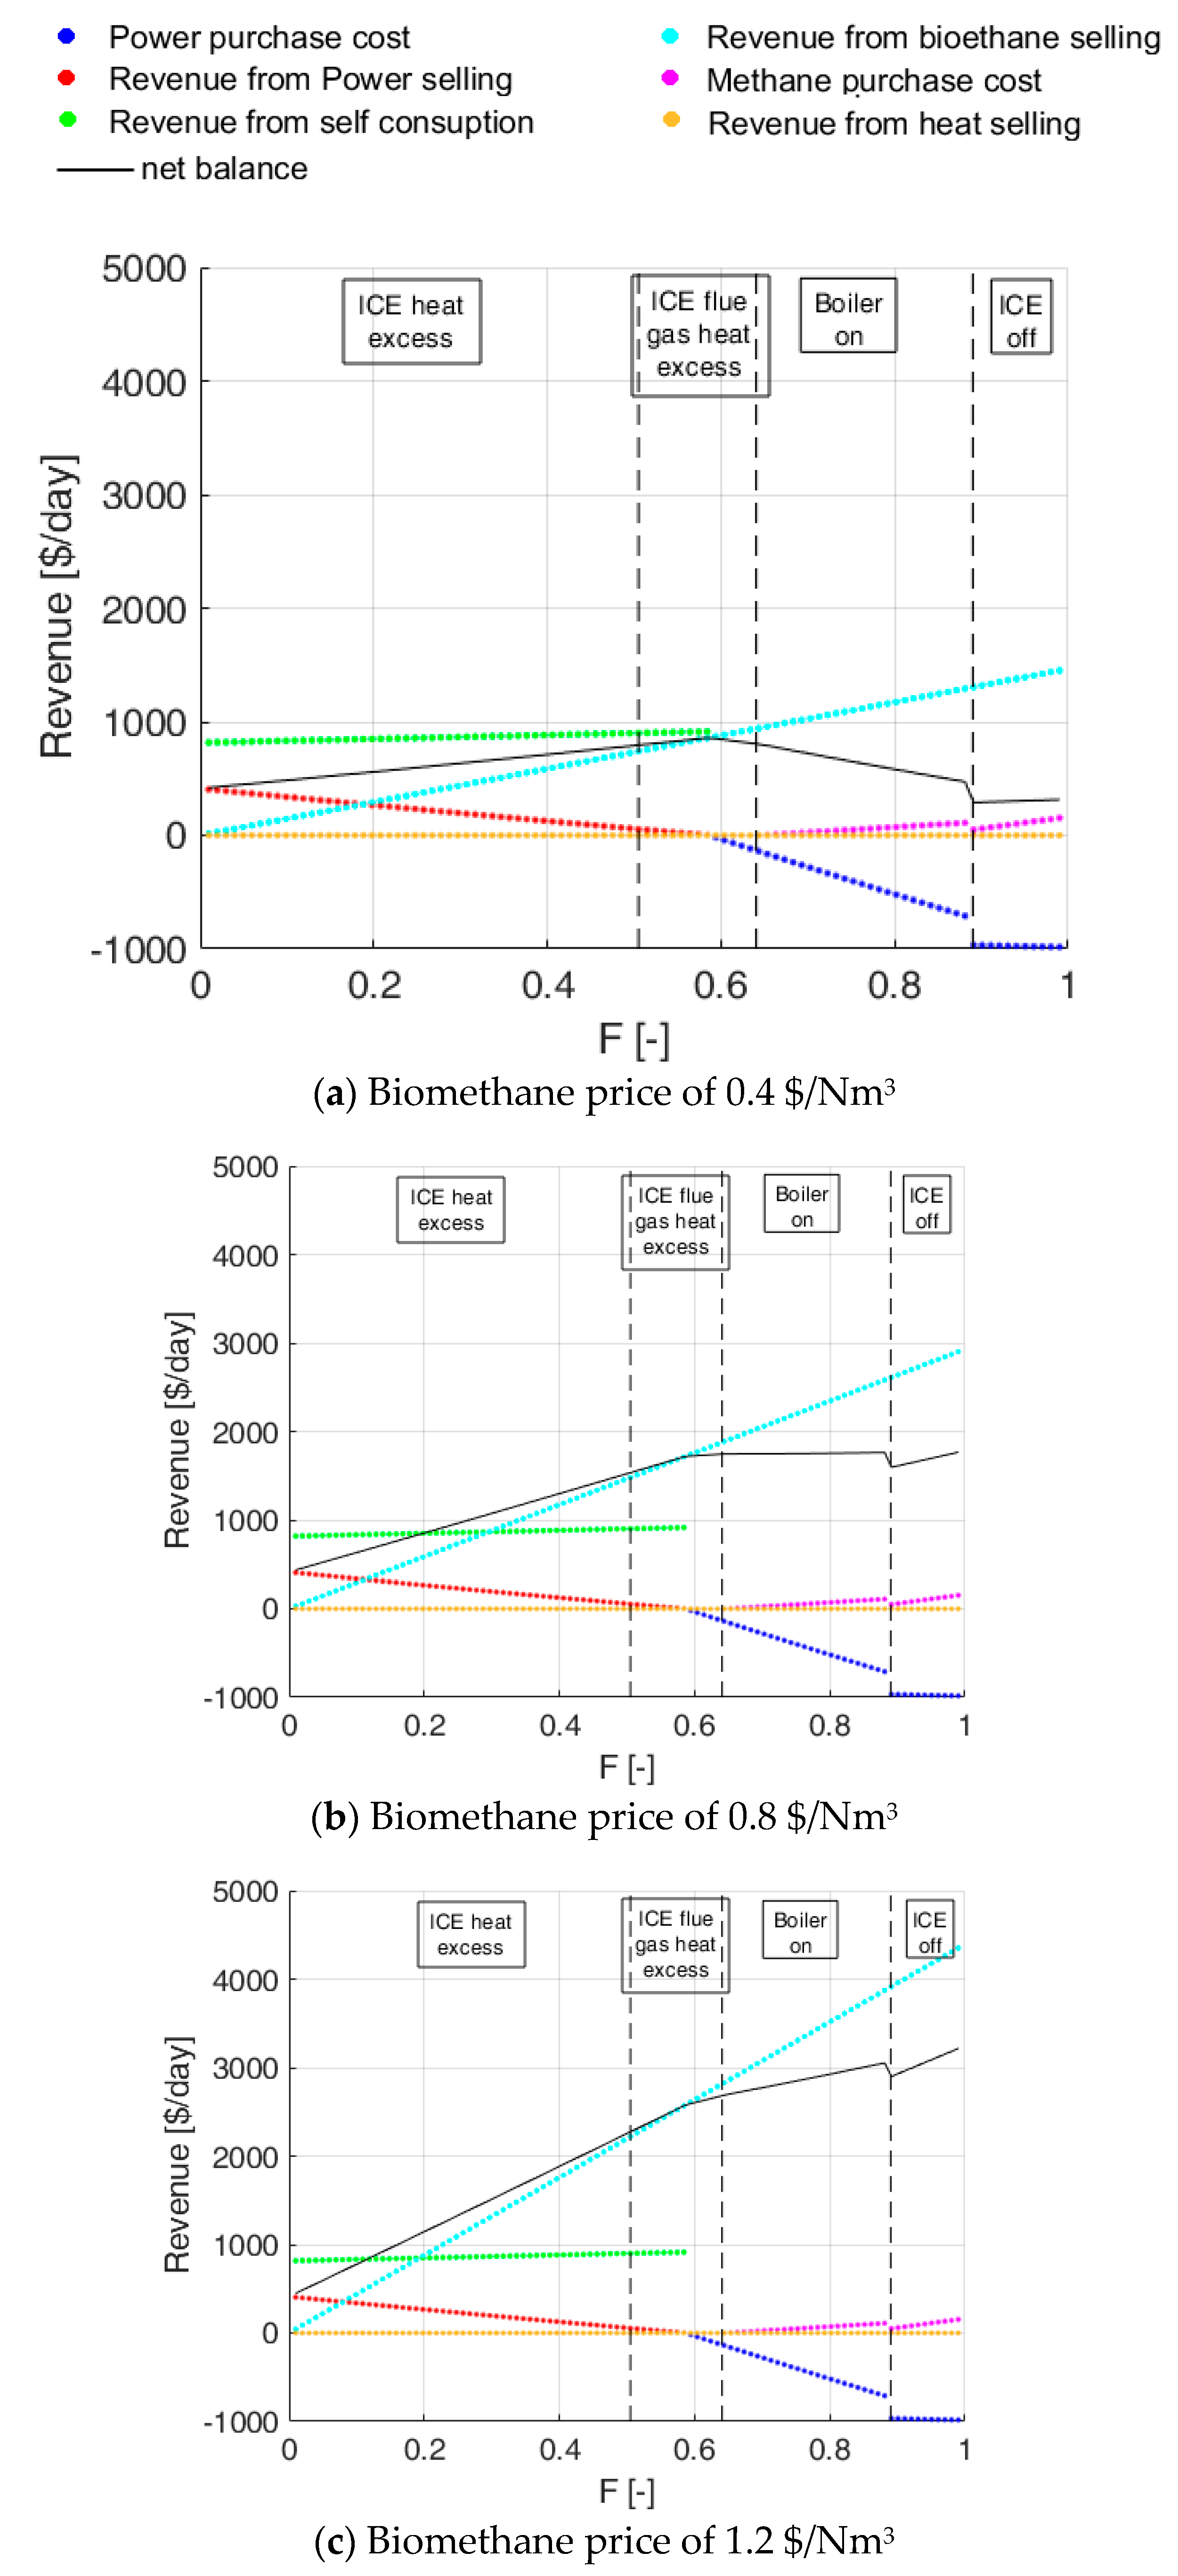
3) were considered for this purpose. For a tariff of 0.4
$/Nm
3, the revenues and costs are reported in
Figure 7a, together with the net gain. The revenues from selling the biomethane are represented by a straight line, which naturally grows with
F. The revenues from selling the electric energy are maximum for low values of
F, when electricity production is the highest contributor. These revenues decrease linearly with
F until the electric production is larger than the sum of the plant and the upgrading system request (internal request). The revenues from the self-consumption of the electric energy are almost constant with
F and start to decrease when the ICE power output is lower than the internal request. This contribution became zero when the engine is shut down at
F = 89%. As expected, the cost of acquired electric energy (represented as a negative value) is zero if the ICE production is higher than the internal request. After that point it increases and becomes constant when ICE is shut down. The cost of acquired natural gas is zero when the boiler is off and begins to grow when the cogeneration unit does not provide enough thermal energy (
F > 64%).
With this biomethane selling tariff, the maximum revenue of the plant was obtained for a
F of about 56%. This value of
F is the same value that minimizes the CO
2 balance. By increasing the biomethane tariff to 0.8
$/Nm
3,
Figure 7b, the revenues and costs contribution are the same but for biomethane revenues. The value of the economic gain increases but the value of
F where the maximum is achieved does not change.
For a further increase in the tariff to 1.2
$/Nm
3,
Figure 7c, biomethane gains are so high that the optimal value of
F becomes 1. This condition of operation is obviously not reasonable as CO
2 would be higher and the cogeneration system would be useless. A boiler fed by methane from the grid would be the best option for the plant. This means that high subsides can lead plant managers to operate according to nonsensical conditions, which decreases the CO
2 savings.
In this first analysis, thermal energy surplus was not considered. If this thermal energy (i.e., previously wasted as shown in
Figure 1b) was sold to a third party, revenue of 0.25
$/Nm
3 could be assumed (natural gas savings) [
40]. In this case, the net gain for each
F value is increased but the optimal values are still achieved for the same
F range (
Figure 8).
In conclusion, from the analysis of the results several optimal values of F were found, depending on the objective of the plant design: self-sustainability of the plant, maximization of CO2 saving or maximization of the revenues. It is clear that in contexts where there are high governmental subsides for biomethane production and the possibility of injecting it into the natural gas grid, the interest could shift to practices that are detrimental to the energy and environmental aspects.


