Article

Optimizing the Analytic Hierarchy Process through a Suitability Evaluation of Underground Space Development in Tonghu District, Huizhou City

1
School of Earth Sciences and Resources, China University of Geoscience (Beijing), Beijing 100083, China
2
Chinese Academy of Geological Science, Beijing 100037, China
3
Institute of Geographic Sciences and Natural Resources Research, Chinese Academy of Sciences, Beijing 100101, China
4
School of Resources and Geoscience, China University of Mining and Technology, Xuzhou 221116, China
*
Authors to whom correspondence should be addressed.
Energies 2020, 13(3), 742; https://doi.org/10.3390/en13030742
Submission received: 26 November 2019 / Revised: 8 January 2020 / Accepted: 21 January 2020 / Published: 8 February 2020

1. Introduction

Underground space has been recognized as one of the few underdeveloped natural resources that humans have owned thus far [1,2,3,4,5,6]. Through rational development and the utilization of underground space resources, various existing urban contradictions can be alleviated [6,7,8,9,10,11,12,13], and can even become an important way to solve urban diseases. This will open up broad prospects for further urbanization and urban modernization [14,15,16]. The development and utilization of urban underground space started from the second industrial revolution, and has been developed for nearly 150 years, accumulating a large number of successful cases of underground space development and utilization [17,18,19,20,21]. Represented by developed countries, such as the United States, Canada, Japan, and Singapore, a relatively complete underground space evaluation method and development system has been formed [22,23,24,25]. These successful cases also prove that it is an effective way to solve the constraint factors of urban development to construct underground space that is orderly, stress efficient, moderate, and uniform. Since underground space itself has the characteristics of irreversibility [26], it must be carefully developed and a great deal of preliminary work needs to be done, including the necessity of project development, development scale, functional layout, and its impact on the social and economic environment. Therefore, it is particularly important to analyze, study, and evaluate underground space. The development of underground space is irreversible [26], and the existence of underground buildings is bound to have a certain impact on above-ground buildings [27]. From the perspective of maintaining the stability of the geological environment, it is necessary to consider the effect of poor geological bodies in the early design and planning of underground space [27,28,29,30,31,32,33]. On the premise of ensuring the safety and durability of underground engineering, we should try our best to reduce the influence of further worsening the geological environment and inducing geological disasters caused by the disturbance of underground engineering. Compared with surface engineering, geological conditions are the physical environment of underground space resources and the decisive factor affecting the difficulty of realizing the ultimate value of resources. Underground space is affected by multiple and complex factors [34,35,36]. These include not only the suitability of engineering geology and hydrogeological conditions for resource development, but also the utilization of urban land resources and urban ecology, which, in turn, reflect the demand for underground space resources and development benefits. The evaluation of the suitability of underground space development based on the suitability of engineering, resource demand and development benefit can provide a theoretical basis for the planning, development, and utilization of underground space.
At present, cities of different sizes and types are attempting to evaluate and comprehensively develop underground space. The evaluation and development of underground space in mega-cities has already begun to develop to the middle and deep layers. The evaluation and development of underground space in small- and medium-sized cities, however, is still in its infancy [37,38]. The lack of clarity with regard to the specifics of underground space resources has largely affected the development, utilization, and planning of underground space resources, as well as the strategic layout of the city.
Tonghu District, Huizhou City, Guangdong Province, as a planned construction area, has fewer existing buildings and lower development intensity than many non-planned construction areas. There is a clear need to avoid the problems of inadequate development space, excessive land development intensity, and unreasonable planning in many cities currently experiencing construction development, population increase, and development intensity that are already in the latter stages of development. As such, the evaluation of underground space resources should be incorporated into the urban strategic planning process as early as possible. The unified planning of underground and above-ground areas and their coordinated development will be beneficial to the long-term development of the city. Therefore, the evaluation of the suitability of the development of underground space resources is extremely urgent. In this paper, the underground space resources in the study area are divided into four levels: shallow (0–15 m), sub-shallow (15–30 m), sub-deep (30–50 m), and deep (50–200 m), according to their depth and use. In this instance, only the shallow layer (0–15 m) underground space resources needed for short- to medium-term development are evaluated and studied.
Huizhou City is located in the south-central part of Guangdong Province, at the northeast end of the Pearl River Delta, with Daya Bay in the south, Heyuan City in the north, Shanwei City in the east, and Dongguan City and Guangzhou City in the west. It is the core city in the east of the Guangdong–Hong Kong–Macao Greater Bay Area (abbreviated as GBA). The study area is located in the west of the hinterland of the core area of the Shenzhen–Dongguan–Huizhou Economic Circle (SEC). Tonghu wetland, the largest inland freshwater wetland in Guangdong Province, is also distributed within the study area (Figure 1). The tectonic unit of the study area is the Tonghu syncline basin in the Huiyang depression. Erosion and denudation hills are located on the east, south, and north sides of the area, with steep mountain faces, strong topographic cutting and large elevation differences. The Piedmont slope and inter-mountain valley are relatively low and gentle, while the wetland of Tonghu Lake in the middle is mainly alluvial plain. Additionally, various landforms (such as a foundation pond, lake, marsh, and grassland) are all present in the wetland. The erosion of residual hills with micro-protrusions can be seen locally. Generally, the area is a narrow inland basin with high north–south and low middle elevations.

2. Research Methods and Basic Data

2.1. Research Methods

In this paper, the analytic hierarchy process (AHP) is used to evaluate underground space resources. The AHP is a decision analysis method which combines qualitative and quantitative methods to solve multi-objective complex problems [39,40,41,42]. This method combines quantitative analysis with qualitative analysis, judges the relative importance of each criterion, and gives the weight of each criterion. The weight is used to rank the advantages and disadvantages of the schemes, so as to assist decision-makers in choosing the most appropriate schemes [43,44,45,46]. The use of AHP to construct a model is roughly divided into four steps: (1) establishing a hierarchical structure model; (2) constructing a judgment matrix; (3) hierarchical single ranking and consistency checking; and (4) hierarchical total ranking and consistency checking.
(1) Establishing a hierarchical structure model involves dividing the decision-making objectives, influencing factors, and decision objects into three layers (the thematic layer, criterion layer, and indicator layer), according to their interrelationship, then drawing the hierarchical structure diagram.
(2) Constructing a judgment matrix involves comparing the influencing factors with each other, using the same criterion in relative scale. The comparison result is essentially the relative importance of each factor under the same criterion. As such, the comparison can reduce the difficulty of comparing the factors with different properties as far as possible, thereby improving the degree of accuracy.
(3) Hierarchical single-ranking and hierarchical total-ranking are essentially the process of solving relative importance, but they contain different elements. Single-ranking calculates the weight of the indicator layer relative to the criterion layer, or the criterion layer relative to the thematic layer. Total-ranking calculates the weight of all elements of the indicator layer and the criterion layer relative to the thematic layer.
(4) The consistency test of hierarchical single-ranking and total-ranking is conducted to test whether the inconsistency of the judgment matrix is within the allowable range [44,45,46,47,48]; that is, whether there is satisfactory consistency. Generally, the consistency ratio CR < 0.1 is used as the criterion required to pass the consistency test.
Based on the AHP optimization method, synthesizing the experts’ evaluation of the criterion layer and the indicator layer, this paper scores the hierarchical model established by this analysis and evaluation. The suitability of underground space development and utilization in the Tonghu research area is also comprehensively evaluated from three aspects: regional geological conditions, hydrogeological conditions, and engineering geological conditions. After the evaluation, this paper puts forward suggestions for development and utilization.

2.2. Basic Data

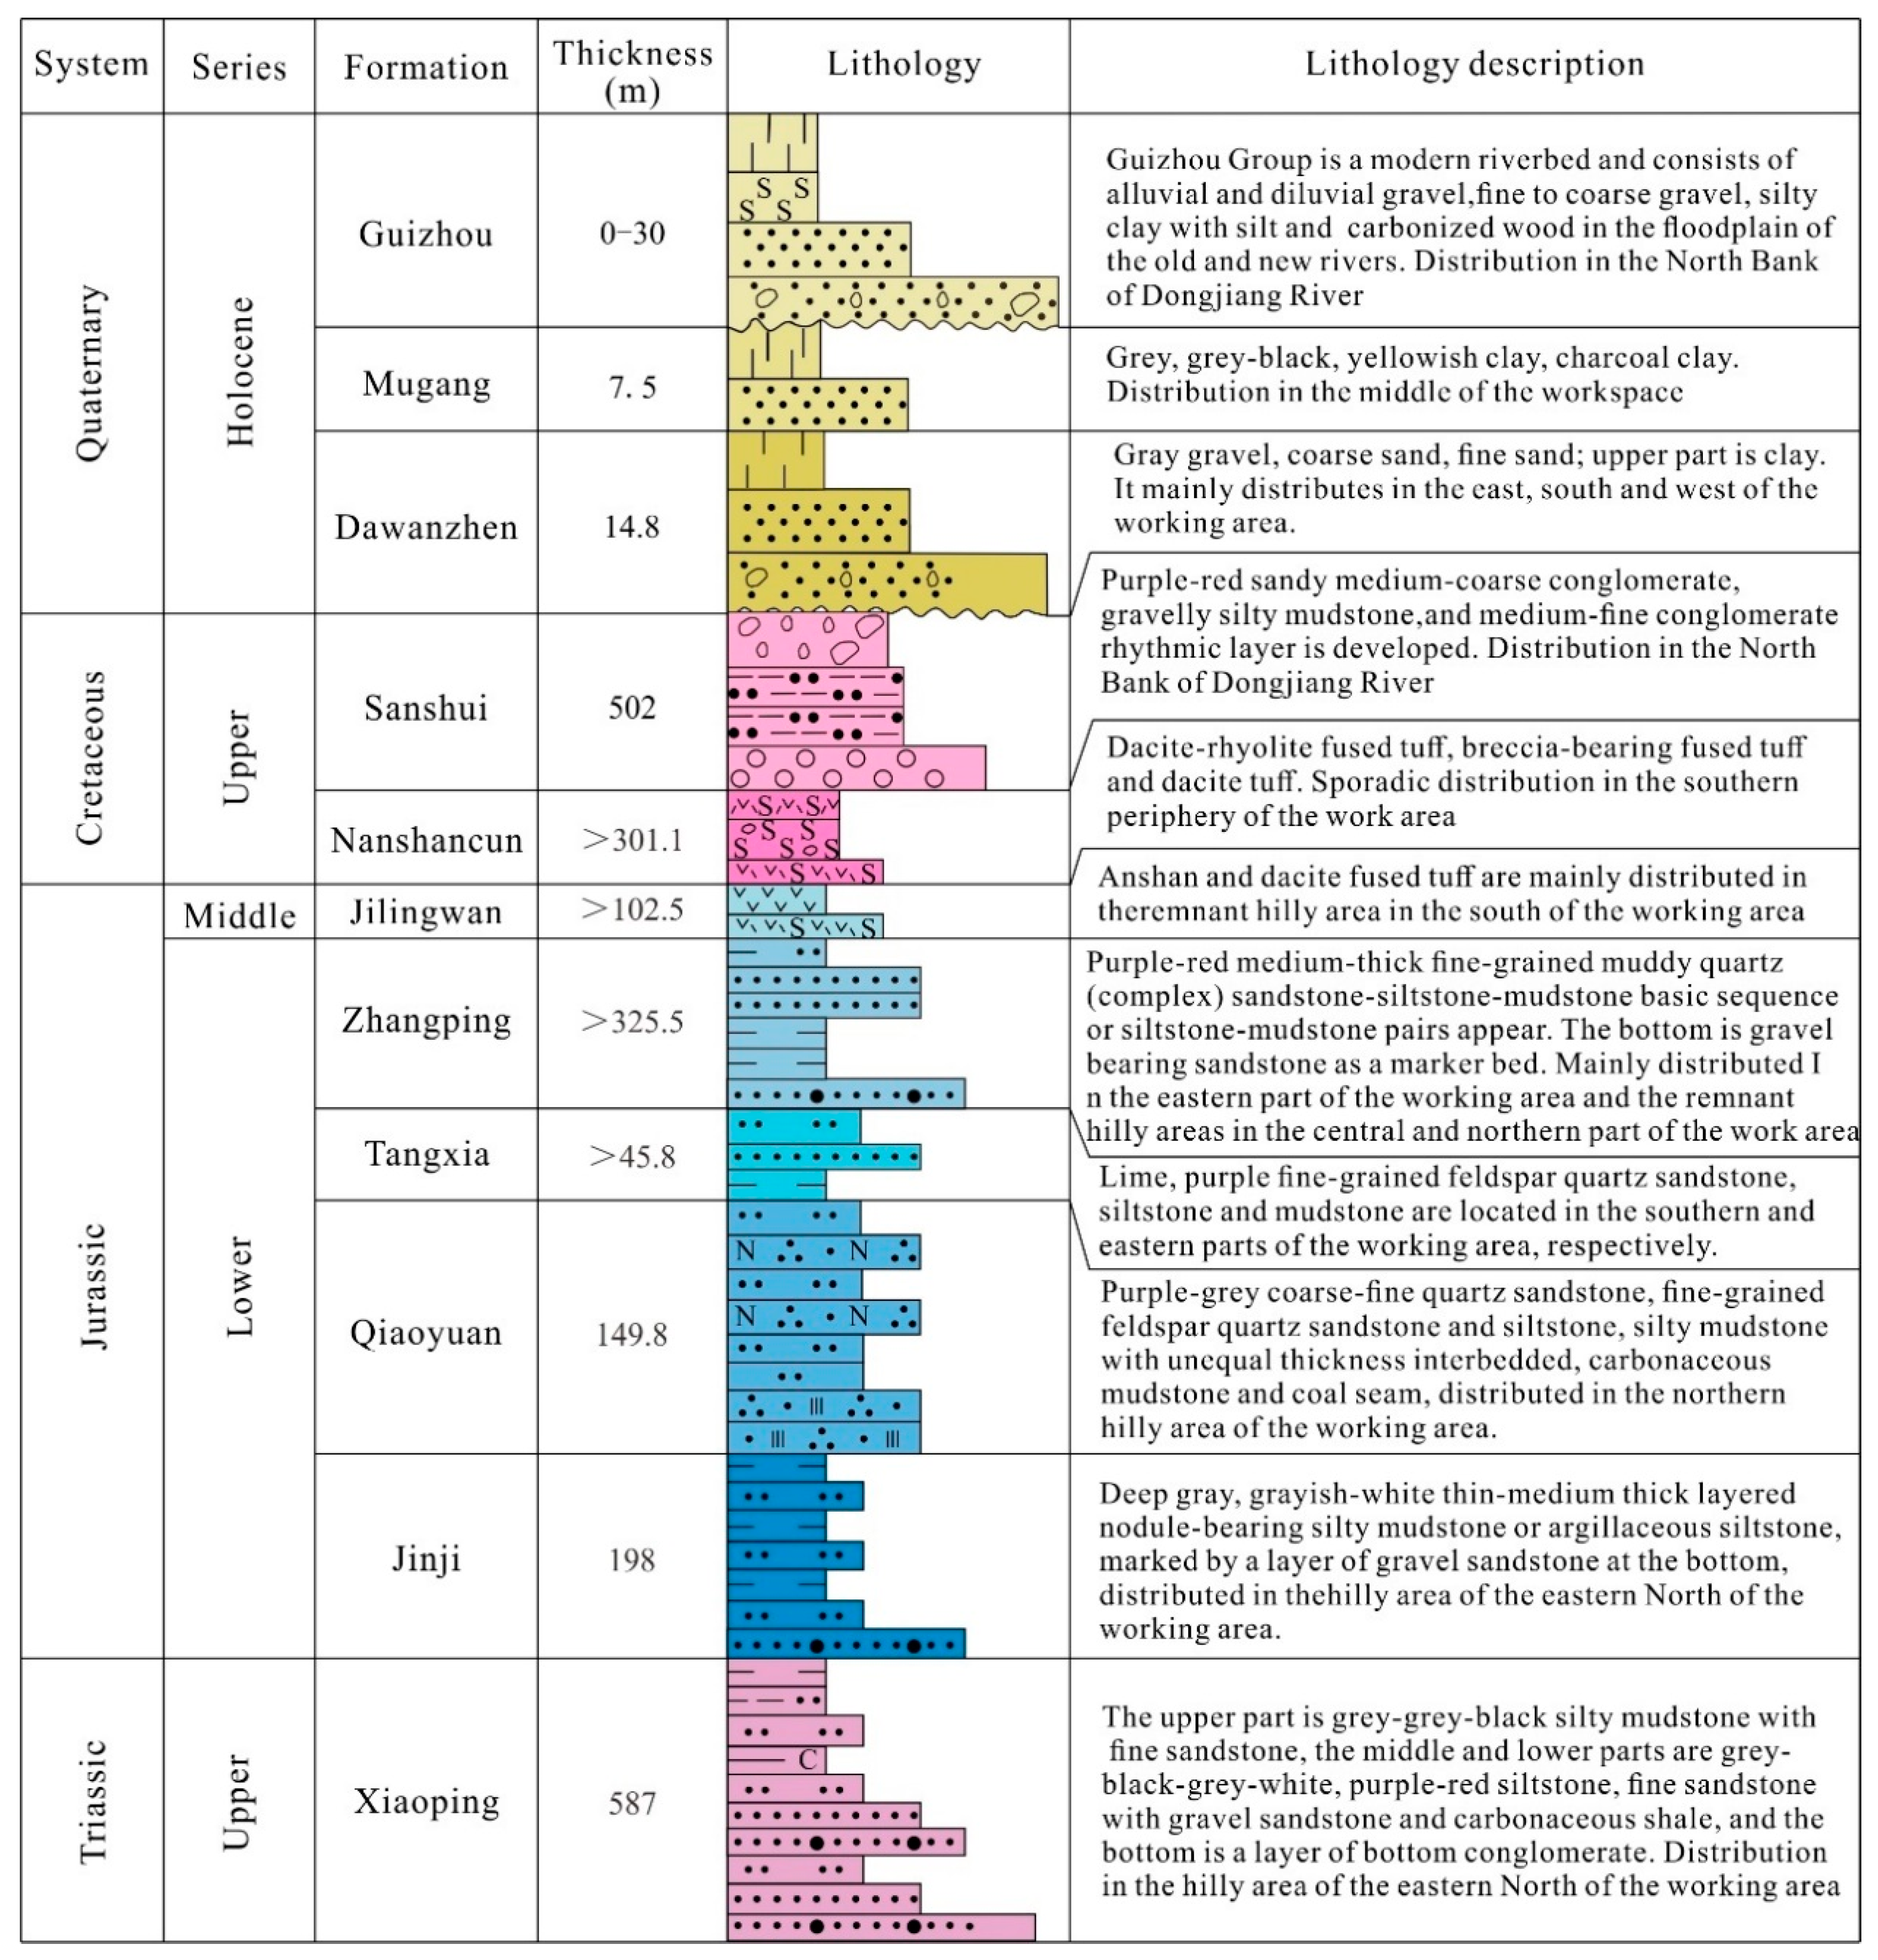
2.2.1. Regional Geological Conditions

(1) Lithology and intrusive rocks

The main outcropping strata in this area are the Triassic Xiaoping formation to Quaternary Guizhou Group (Figure 2 and Figure 3). The lithology is mostly sandstone and mudstone. In addition to the Jurassic Zhangping formation in the north and northeast of the study area, the Quaternary Mugang formation comprises the main outcropping strata in the rest of the area, with sporadic outcropping of the Jurassic Tangxia formation, Qiaoyuan formation, Jinji formation and Quaternary Dawanzhen formation. Most of the magmatic rocks in the study area occur in the form of granite dikes and diorite dikes in the northeast and east of the study area; rhyolite porphyry dikes and granite dikes occur in the north and northwest of the region, outside the scope of the study area.

(2) Fractures, folds, and geological disasters

The study area is located in the Tonghu syncline basin of the Huiyang depression. The core of the syncline is the Jurassic Zhangping formation. The two-wing strata are the Jurassic Qiaoyuan group and the Tangxia group, and there are also secondary folds. The weathering bedrock crust in the continuous fold distribution zone is thicker, and the degrees of weathering fall mainly into the categories of full weathering and strong weathering. In the weathering zone, because of the development of joints and fissures in the rock mass, as well as the strong weathering, the ability of the surrounding rock to self-stabilize is poor, which in turn easily leads to the deformation of surrounding rock in the chamber. On the north side of the syncline, there is a northeast-trending Tonghu fault and several smaller east-west faults. The Tonghu fault in the study area extends approximately 10 km in length and 6–24 m in width. Later, it transforms into a tensional fault (Figure 4). On the south side of the slope, there is a large-scale Zhangmutou fault and a Tanglianpu fault group consisting of many small faults. The faults in the study area are relatively developed and mainly reverse faults. These faults are mostly associated with the Tonghu faults. The dip of the strata on both sides of the fault is inconsistent; the difference between the upper and lower faults is obvious. In the fault zone, breccia, silicified breccia schist, and schistosomiasis are common. In the later stage, the fault turned into a tensional fracture.
The number of earthquakes in the study area is small, and the magnitude of the quakes is low, at generally 2 to 2.5 on the Richter scale, with the highest being 3. According to the “China Earthquake Parameter Zoning Map” (GB18306-2015) and “Architectural Seismic Design Code” (GB50011-2010 (2016 Edition)), the seismic fortification intensity of the study area is VI degree. The design of the seismic grouping falls in the first group, and the basic seismic acceleration is 0.05 g. According to the empirical formula in the “China Earthquake Catalogue”, and combined with the calculation principle of sand liquefaction proposed by Seed and Idriss (1971) [37], it is known that the liquefaction degree of sandy soil in the study area is slight—non-liquefaction. The north and east hilly areas outside the study area are located in the areas prone to geological disasters like collapse and landslides. The central basin is not prone to geological disasters. In the study area, there are three micro-small collapse geological hazard points (or hidden danger points), one small landslide geological hazard point, and no ground fissures or other phenomena. The geological hazards are at the stage of weak development.

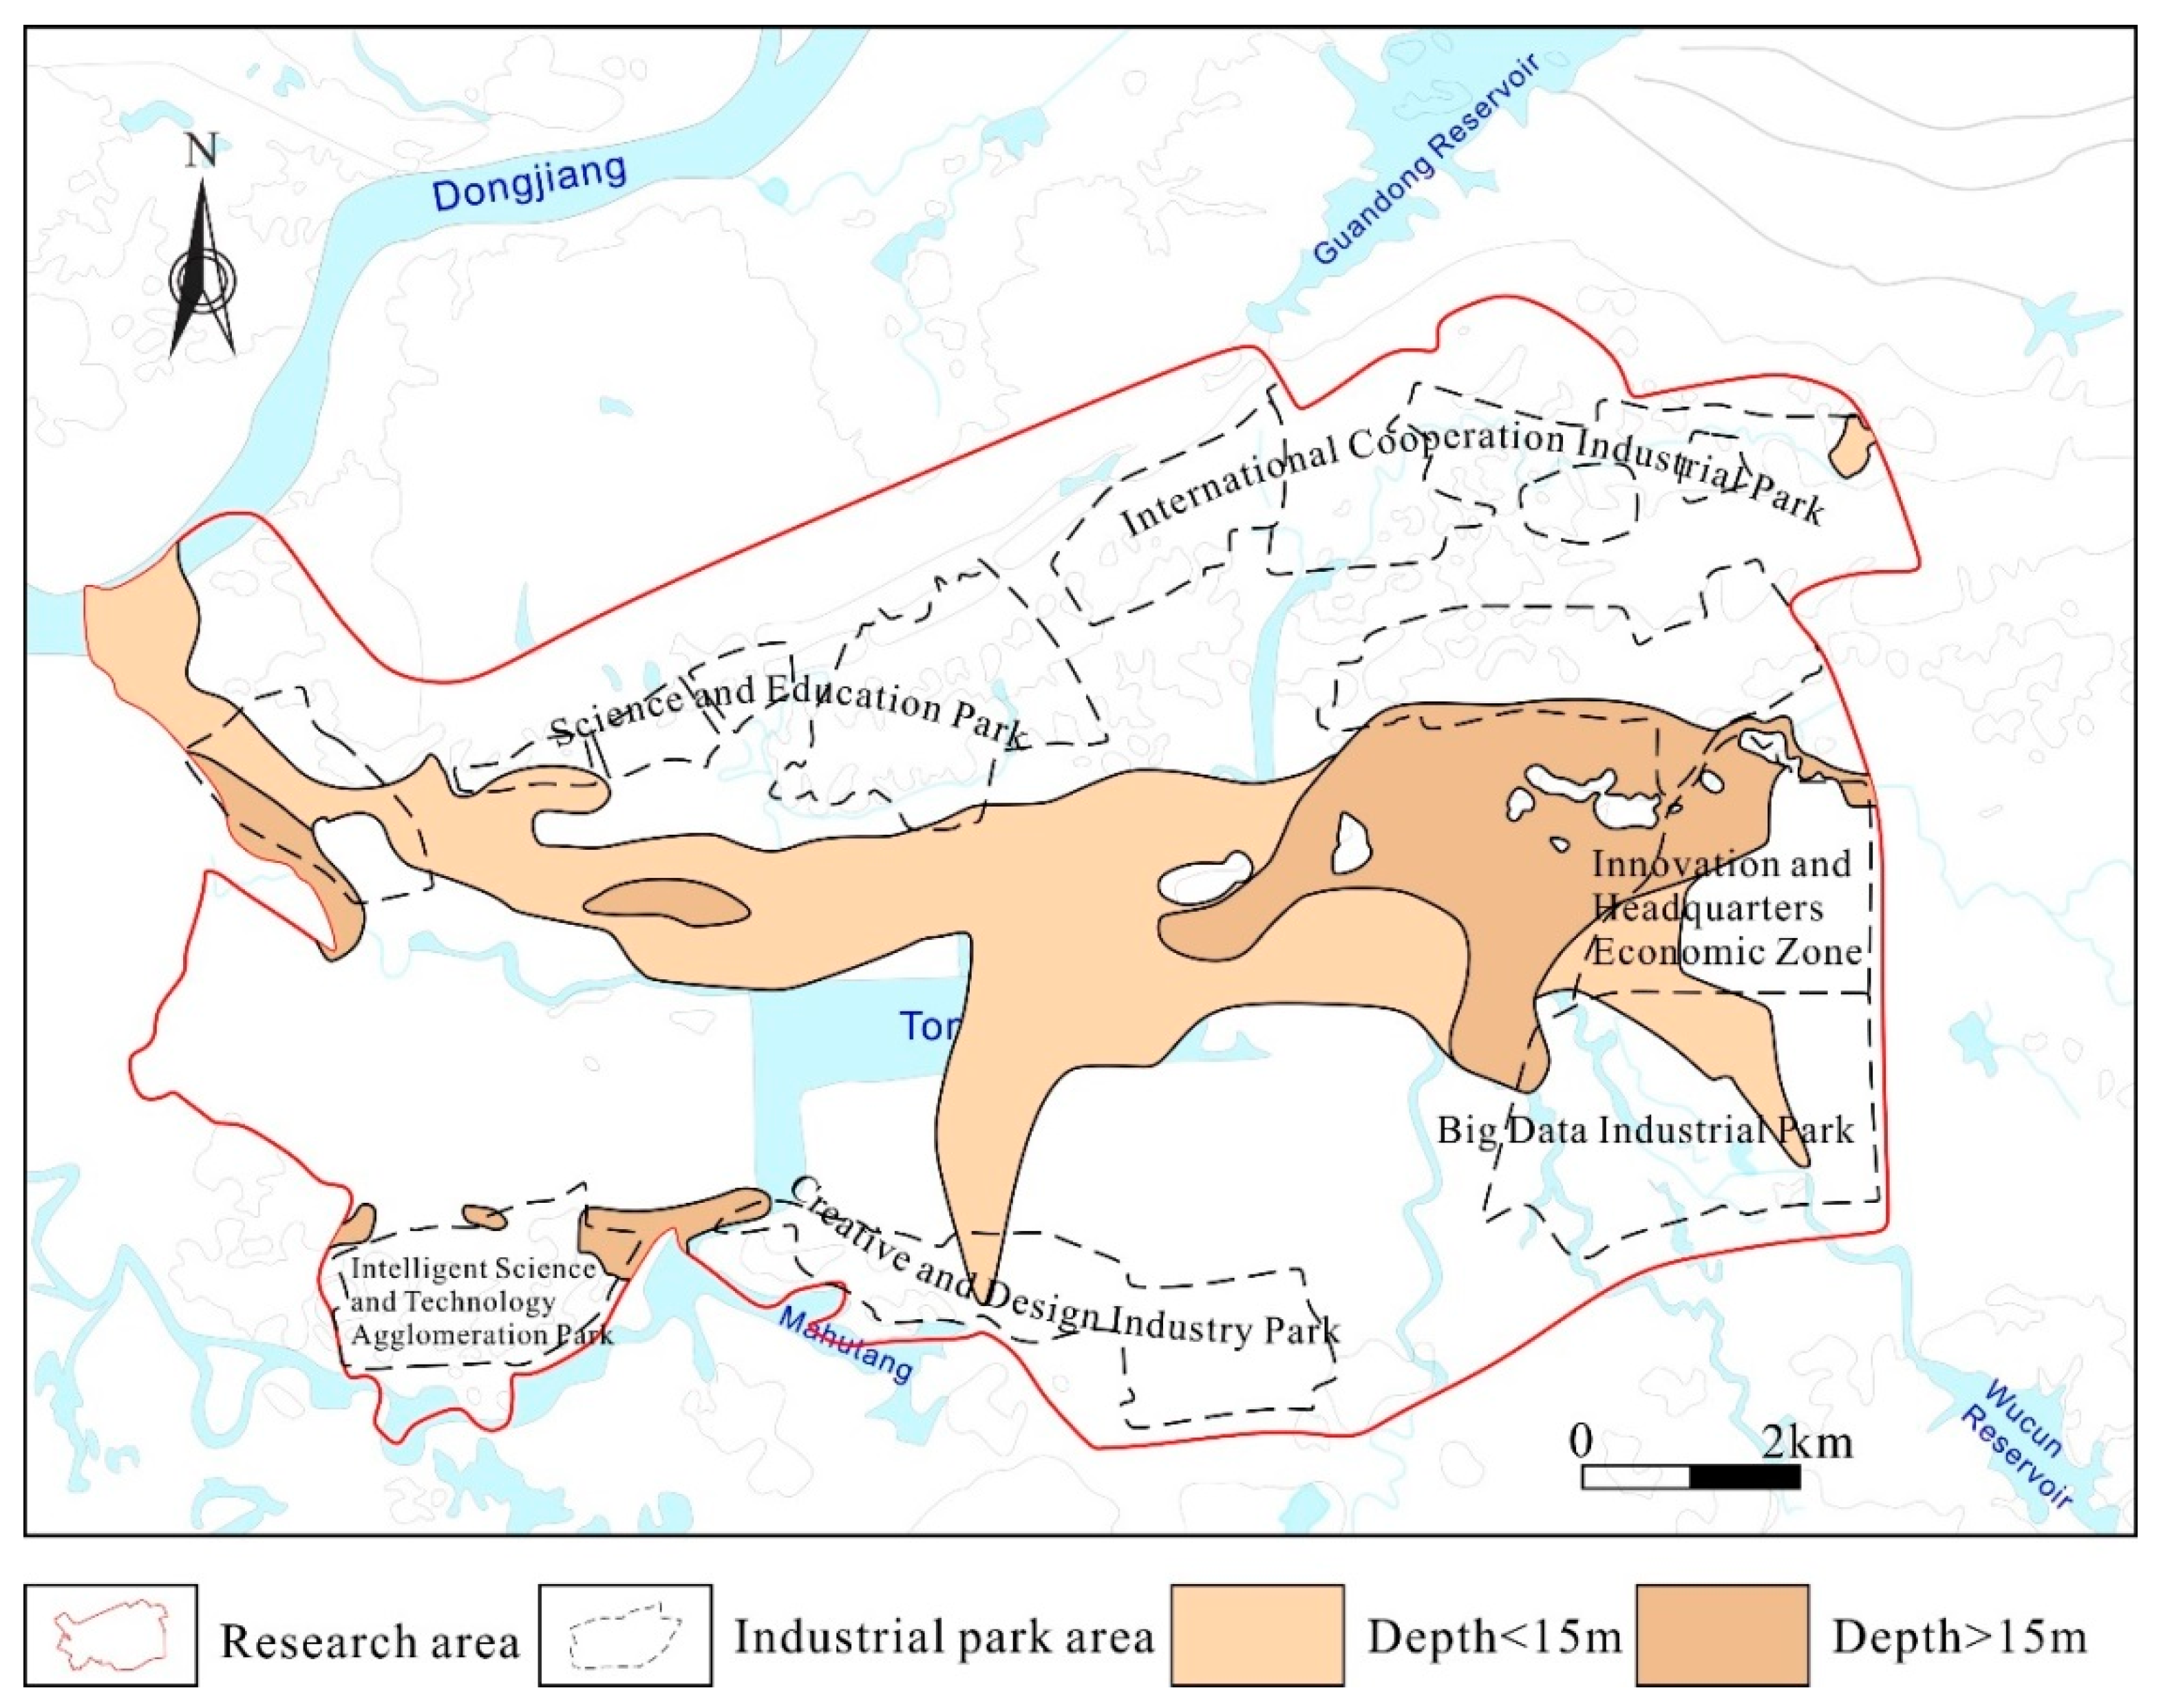
(3) Ancient river channel (valley)

In the central part of Tonghu Basin, there is a narrow strip-shaped banded palaeochannel (Figure 5), which is about 16 km in length. The channel narrows from west to east. The widest part of the palaeochannel is approximately 2.8 km, and its general width is 400–800 m. The alluvial silt, muddy soil, and sand are produced concomitantly in the palaeochannel distribution area. The sandy soil layer is the main reservoir of micro-confined water, with a classification of being medium water-rich. Some sections of ancient rivers are planned as wetland parks, which are part of the core ecological resources. These have been designated as prohibited construction areas.

2.2.2. Hydrogeological Conditions

Surface water in the study area is distributed in the Tonghu Basin in the form of rivers, reservoirs, fish ponds, etc. The water network in the Tonghu Basin is dense, and the flow direction is changeable. Several tributaries converge into Tonghu’s main stream and are discharged into the Shima River through Xiegangyong, or into the Pearl River and East River by the east bank. The groundwater can be divided into two types: pore water (of loose rocks), and fissure water (of bedrock). The middle pore water content of loose rocks is basically the same as that of sands. This pore water is distributed in the middle of the basin in a strip form in a near east–west direction, extending westwards to the outside of the study area. The poor pore water distributes in a large area in a sand-less plain area in Tonghu Basin. The pore water aquifer of the loose rock is mainly medium-coarse sandy soil. The permeability coefficient of the medium–coarse sandy layer is approximately 5.80 × 10⁻⁴ cm/s. There is a weak permeability clay layer on the sandy soil layer, acting as the upper relative water-proof layer. The alluvial–diluvia, residual clay layer, and weathered bedrock under the sandy soil layer make up the lower relative water-proof layer. The pore water in sandy soil is in a micro-confined state, which is medium water-rich. However, the overall water is poor, so it has little impact on the construction of underground space projects.
The bedrock fissure water occurs in the bedrock weathering fissures and tectonic fissures. This water is mainly distributed in the hills of the north and south sides of the Tonghu Basin, as well as the residual hills sporadically exposed in the basin. Influenced by tectonic compressive stress, the rock fissures in the aquifer are well developed, but the continuity and connectivity are poor, and the permeability is poor. The permeability coefficient is generally 3.90 × 10⁻⁶–2.30 × 10⁻⁷ cm/s. Bedrock fissure water is generally less or medium. Locally affected by tension stress, tensional fracture zones are developed. These zones have good connectivity and permeability and large water volume. The disadvantageous effects of bedrock fissure water on the development and utilization of underground space are mainly as follows: it can easily cause engineering disasters, such as quicksand, piping, water inrush, mud inrush, a reduction in the bearing capacity of rock and soil, and bedrock fissure water can also produce a buoyancy effect on underground structures.
The main source of groundwater recharge in the study area is atmospheric precipitation. The water flows from both sides of the north and south, converging in the direction of the Lake Basin wetlands. After the convergence of Tonghu Lake, the groundwater runs from east to west and eventually discharges into the Dongjiang River. The central part of Tonghu Basin has gentle terrain and a small hydraulic gradient of groundwater. In the alluvial clay distribution area, some phenomena remain, such as poor permeability of strata, slow runoff, and a slow groundwater flow rate. In the hilly area, the runoff and discharge conditions of groundwater are better; the alternative circulation is faster, the degree of the groundwater mineralization is low, and the hydro chemical type is simple. The adverse effects of groundwater on underground space are mainly manifested as follows: When the foundation pit, foundation trench excavation, caisson construction, and tunnel excavation reaches the saturated layer, there is a possibility that quicksand, piping, water inrush, and mud inrush may occur, due to the large amount of water and strong permeability. These events can easily lead to engineering safety accidents, such as side slope instability or collapse of the foundation pit, and even to geological disasters, such as ground subsidence.

2.2.3. Engineering Geological Conditions

(1) Characteristics of bedrock

The bedrock in the study area is mainly the second member of the Jurassic Jilingwan formation, the Jurassic Zhangping formation, Tangxia formation, Qiaoyuan formation, and the Upper Jurassic intrusive Gongcun unit granite (Table 1). The degrees of weathering are divided into the categories of complete weathering, strong weathering, moderate weathering and gentle weathering.

(2) Weak interlayer and its thickness and heterogeneity

The weak interlayer is a thin layer of rock mass that is low in strength or is muddy, softened, and broken. The weak interlayer of the study area is mainly found in the sedimentary rocks and tectonic fracture zones of the Jurassic Qiaoyuan formation, Tangxia formation, and Zhangping formation. This weaker interlayer is mainly comprised of mudstone, shale and coal seams. Generally, the thickness is not more than 10 cm, and the local thickness is up to 30 cm. The influence of the weak interlayer on the development of underground space is mainly manifested in that the existence of the weak interlayer easily enlarges the plastic zone and loosening zone of surrounding rock. The weak interlayer also affects the stability of surrounding rock. Due to the existence of weak interbeds, the surrounding rock is liable to shear creep failure along the weak interbeds and fractured zones.
The influence of rock and soil mass on the development and utilization of underground space is mainly embodied in the rock and soil mass’s engineering geological properties, bearing capacity, thickness, and uniformity. The types of rocks and soils distributed in the study area include artificial fill, alluvial silty clay from rivers and lakes, alluvial silt from rivers and lakes, silty soil, sandy soil, clay-based soil, residual silty clay, silt, and weathered bedrock. Of all these rocks and soils, artificial fill, the alluvial silt from rivers and lakes, silty soil and sandy soil all have adverse effects on the development and utilization of underground space.
Artificial fill in the study area is mainly distributed in villages, industrial development zones, roads in the reclamation area, ponds and embankments. The artificial fill in reclamation areas, villages and towns mainly consists of silty clay and weathered fragments. The fill is partially comprised of construction waste, which is in a loose to slightly dense state. Due to the low strength, poor uniformity, and poor self-stabilization abilities of artificial fill, slope instability of the foundation pit can easily occur.
The distribution of alluvial silt and silty soil in rivers and lakes in the study area is shown in Figure 6. The eastern part of the planned Intelligent Science and Technology Gathering Park, and the western part of the Creative and Design Industrial Park, are thicker. According to the geotechnical test, the alluvial silt and muddy soil in the study area have poor engineering characteristics, such as low strength, high water content, and high compression. These factors can easily lead to uneven ground settlement and the pile foundation inclination of buildings. In addition, the silty soil exhibits significant thixotropic and creep properties under vibration loading. This is manifested by a significant decrease in strength, resulting in possible deformation of the foundation.
The sand layers in the study area mainly consist of fine sand, medium-coarse sand and gravel sand. These layers are distributed in strips in the northwest, middle and east of the study area. The sand layers in the northwest and middle of the study area are all shallower than 15 m, except for a portion of the buried depth (15–30 m). The reverse is true in the east (Figure 7). The sand in the middle part of the Wuhu Basin is coarse-grained soil, with small cohesive force and strong permeability. It is the main aquifer of the Quaternary in the study area. Due to its poor engineering characteristics (such as low shear strength, poor stability, and easy strain and deformation), sand is prone to problems such as the formation of quicksand, piping, collapse, slope instability of the foundation pit, and strain softening. These are the main geological factors affecting the development of underground engineering.

(3) Bearing capacity of the foundation

The greater the bearing capacity of soil is, the more favorable the stability of underground space will be. Due to the differences in mineral composition, structure and sedimentary environment, the rock and soil in the study area have some differences in terms of their mechanical engineering properties. As can be seen from Table 2, the compressibility of the soil in the study area is medium and medium-to-high, with certain self-stability. The distribution range of the bearing capacity characteristic values is approximately 120–200 kPa; that of cultivated soils, artificial fill soils, the alluvial silt of rivers and lakes and muddy soils is 60–80 kPa.
The higher the quality the grade of rock mass is, the greater the bearing capacity and the stronger the self-stabilization ability will be. The rock mass quality grade of fully-weathered to strongly-weathered bedrock in the study area is V grade, which belongs to the category of low- to medium-compressive soil and has certain self-stabilization ability. The medium- to slightly-weathered bedrock is greatly affected by lithology and integrity, and the quality of the granite rock mass distributed in the northwest part of the study area is grade II–III. The degree of the development of joints and fissures in the medium- to slightly-weathered rock mass is relatively low. The higher the rock mass quality grade is, the better the self-stabilization ability will be. The quality grade of an argillaceous siltstone rock mass is related to its argillaceous content. The quality of the argillaceous siltstone rock mass in the study area is from grade III–V. The surrounding rock (of rock mass grade II) in the study area has good self-stabilization ability. Grade III–IV rock mass has a certain amount of self-stabilization ability, and grade V rock mass has poor self-stabilization ability. In the latter case, support work should be carried out in advance.

3. Evaluation Process and Results

3.1. Establishing a Hierarchical Structure Model

This paper takes the evaluation components of the suitability of underground space development in Tonghu District of Huizhou City as the theme layer. The regional geological conditions, hydrogeological conditions, and engineering geological conditions make up the criterion layer, and the control factors in the criterion layer comprise the index layer. The suitability evaluation results of underground space development are divided into three types: suitable, less suitable, and unsuitable. The hierarchical structure model is shown in Figure 8.
The planning depth of development and utilization of the study area is mainly within 15 m. The main controlling factor of the geological environment of the stratum is the geotechnical engineering geological conditions. According to the relative importance of engineering geological conditions relative to hydrogeological and regional geological conditions, the scores are 3 and 9, respectively. The corresponding evaluations are slightly important and absolutely important, respectively. The criteria layer is scored according to the relative importance of each index. Table 3 compares the relative importance of each index in the theme layer.

3.2. Constructing Judgment Matrix

The relative importance of the indicators in the same level is divided by the “1–9 scale method”. When comparing the relative importance of each indicator, they are divided into the following categories: equally important, slightly important, relatively important, very important, and absolutely important. The corresponding value of the different categories is 1, 3, 5, 7, and 9, in turn. For example, the distribution of surface water relative to the lithology of an aquifer can be judged as more important, with a score of 1/5, contrarily with a score of 5. The judgement matrix is formed by scoring all indicators in pairs.
According to the judgment matrix constructed by expert scoring, the corresponding anti-symmetric matrix is calculated; the optimal transfer matrix corresponding to the anti-symmetric matrix is also obtained. The optimal transfer matrix of the derived judgment matrix is a consistency matrix without consistency checking, which, in turn, simplifies the calculation process. Since there is a certain error range within the determination of elements in the judgment matrix, it is not necessary to pursue a higher degree of accuracy. In addition, the square root method uses the hypergeometric average method to obtain the weight value. In a certain range, the eigenvalues of the quasi-optimal matrix can be approximated to the eigenvalues of the optimal matrix. Combining the above advantages, this paper chooses the square root method in the calculation of matrix weights, first calculating the product of each row of elements, then opening the product of nth power. Here, n is the order of the matrix. Finally, the obtained vector is normalized. The resulting weight vector is finally available.

3.3. Hierarchical Single Ranking and Consistency Test

Hierarchical single ranking is used to rank the relative importance of each element in the index layer to the upper level. In addition, a consistency test is conducted to check the allowable range of inconsistencies determined by the judgment matrix. In this paper, the square root method is used to obtain the maximum eigenvalue. The elements in each row of the judgment matrix constructed by the index layer are multiplied. The product is opened n times and then summed. The square root of each row is divided by the sum of the root of each row, that is, the weight value of each element Wi. The result of dividing the row element by the weight of the row is summed to AWi, and the maximum eigenvalue λmax = AWi/Wi. In the consistency index, CI = (lambda − n)/(n − 1), where n is the order of the judgment matrix, λ is the average value of the maximum eigenvalue, consistency ratio CR = CI/RI, and RI is a fixed value, which is available in Table 4. When CR < 0.1, the inconsistency of the judgment matrix is considered to be within an acceptable range. The results of the single ranking and consistency test for the study area are shown in Table 5, Table 6 and Table 7.

3.4. Hierarchical Total Sorting and Consistency Test

Hierarchical total ranking refers to the ranking of the weights of all the elements of the index layer for the relative importance of the topic layer. In the hierarchical total ranking consistency test, CI is derived from the multiplication and summation of the consistency index CIi of each criterion layer in the single ranking, in addition to the weight of the criterion layer in the theme layer. Additionally, CR is the multiplication and summation of the consistency index RIi of each criterion layer in the single ranking, in addition to the weight of the criterion layer in the theme layer. The consistency ratio of the total ranking is CR = CI/RI, and when CR < 0.1, it is considered that the hierarchical total ranking passes the consistency test (Table 8).
From the hierarchical single ranking and total ranking table, we can see that the ranking weights of each level, and the judgment matrices constructed by them, all meet the consistency test requirements. From the weights of all evaluation elements and their comprehensive weights in the index layer, it can be concluded that soft layer features have the lowest impact on the theme layer (that is, the suitability for underground space development and utilization). Meanwhile, the bearing capacity of the foundation has the most significant impact on the theme layer.

3.5. Suitability Classification of Underground Space

In order to compare the indicators of the index layer, the evaluation indicators are respectively assigned. The suitable value is 3 points; the more suitable value is 2 points, and the less suitable value is 1 point. Combining the weights of each index, obtained by the analytic hierarchy process, the comprehensive score is calculated:
PI = i = 1 n W i P i  
Here, PI is the suitability evaluation score, Wi is the weight value of the secondary indicators, Pi is the score value of the secondary indicators, and n is the number of indicators at the index level. A PI score of 0–1 is less suitable, 1–2 is more suitable, and 2–3 is the most suitable. According to the evaluation index system of underground space development suitability, combined with the weight of each index obtained by the analytic hierarchy process, through analysis and calculation, a grade table value of 9 is obtained for underground space development suitability (Table 9).

3.6. Suitability Division of Underground Space

According to the geological engineering data, the main controlling factors for the main development horizon of the study area are the geotechnical engineering properties. Additionally, the underground space suitability division is carried out in consideration of the protection of the core ecological resources. Firstly, because of the influence of shallow underground space on surface vegetation and topography, according to the distribution of core ecological resources, the planned prohibited construction areas are delineated. Secondly, the areas where the distribution of alluvial silt, silty soil and sandy soil in rivers and lakes alternately infers that the distribution areas of ancient rivers (valleys) will have a more significant adverse impact on underground space development are also delineated. Finally, the two are superimposed, and the distribution of core ecological resources is given priority. The level of suitability is then divided. The area with poor suitability for the development of 0–15 m underground spaces in the study area covers a total of 68.506 km2, or 53.24% of the total area. The main areas are the speculated palaeochannel distribution area (valley), alternately distributed with alluvial silt, silty soil, and sandy soil in rivers and lakes, along with the prohibited planned construction area. The basic suitable area covers 39.820 km2, or 30.95% of the total area. This area mainly consists of alluvial plain area, locally distributed artificial fill, sandy soil, alluvial silt, and the muddy soil of rivers and lakes, areas with general geological engineering conditions, and restricted planned construction areas. The suitable area covers 20.337 km2, or 15.81% of the total area. This area is mainly evaluated (based on the geological engineering conditions) as the generally better site. This area is distributed with alluvial silty clay, residual silty clay, clay, and a bedrock outcropping area. The distribution of shallow underground space suitability zoning within 15 m of the study area is shown in Figure 9.

4. Discussion

4.1. Expected Urban Development and Demand for Underground Space

4.1.1. Expected Urban Development Scale

Tonghu District of Huizhou City, as the hinterland of the Hong Kong–Shenzhen metropolitan area, is directly exposed to the exogenous economy. At the same time, the Daya Bay area of Huizhou City provide a good foundation for the development of the port city. Thanks to the industrial transfer of Hong Kong and Shenzhen, the metropolitan pattern of “one city, three groups” is gradually forming. At present, relying on Zhongkai National High-Tech Development Zone, Tonghu District has formed a “4 + 2 strategic emerging industry cluster”. With LED, mobile Internet, flat panel displays, new energy, cloud computing, and new equipment manufacturing emerging as the leading industries, Tonghu District has become an important domestic electronic information industry base. In the future, the advantages provided by the Zhongkai National High- and New-Technology Development Zone, the Pearl River Delta National Independent Innovation Demonstration Zone, and the China–South Korea (Huizhou) Industrial Park will be used to build a perfect regional innovation system. This will accelerate the transformation from manufacturing to creation.
It is estimated that, by 2020, the first and second phases of the national wetland park will be completed. The population will reach 100,000, and the scale of construction land will increase to 15 km2. By 2025, the functions of industry and city will have gradually improved. The population will reach 150,000, and the scale of construction land will increase to 25 km2. By 2030, the distinctive Tonghu Ecological Wisdom Zone will be built, with a population of 250,000; the amount of construction land will increase to 38 km2.

4.1.2. Demand for Underground Space

In Huizhou, as an emerging medium-sized city (the urban non-agricultural population is between 200,000 and 500,000), the demand for underground space in the near to mid-term (2018–2025) is mainly of the shallow surface (0–15 m) variety. This type of space is mainly used for underground rail transit lines, underground garages, comprehensive pipe galleries, and the construction of sponge cities. Considering the long-term development expectations for Huizhou and the trend of urbanization development, the demand for underground space resources will increase sharply in the future. In this paper, the per capita demand method is used to forecast the demand for underground space in the study area (Table 10).
Of the above, the per capita residential land S(t) = B/(M × N × R), where B is the per capita residential area, M is the residential plane coefficient, N is the average floor number, and R is the average residential building density; per capita construction land scale G(t) = g × S(t), where g is the proportional coefficient; per capita park green space area L(t) = l × S(t), where l is the proportional coefficient. The total demand for underground space in the study area will reach 13.56 km2 in 2025, and 21.81 km2 in 2030. The demand for underground space resources in the Tonghu District will increase dramatically.

4.2. Liveability of Cities

This paper takes the living degree of safety, convenience of travel, and beautiful environment as the standards by which to measure the livability of Tonghu District. Huizhou follows the layout principle of “the core is high, the outward is gradually reduced, and the waterfront is the lowest”. The heights of the buildings in the district are divided into five grades (Table 11), with the area’s architecture forming a high-low-lying, high-level urban form. Within this area, Tonghu District is mainly responsible for industrial groups and planning new industrial land. The building heights should be controlled to between 24 m and 45 m, which falls within the fourth-level building height. According to the Technical Regulations for Concrete Structures of High-rise Buildings (JGJ3-2010), any building height above 24 m is a high-rise building. Additionally, the foundation depth of a building within 150 m is 1/18–1/12 of the above-ground height; 1/12 is generally taken as the standard. However, this paper considers the foundation’s influence range, which is determined to be from 4–7.5 m (Table 11). Due to the differences in the bearing capacity of artificial foundation soil and natural foundation soil, it is considered that the distribution area of natural foundation soil is more suitable for the construction of the large underground spaces of high-rise buildings than artificial foundation soil. Meanwhile, the distribution area of artificial foundation soil is more suitable for the construction of low-rise buildings or public greening areas, as well as the development and construction of underground spaces under such soil.
Huizhou City relies on the east-west regional transportation channels, such as the Shenzhen–Shantou Expressway, Shaqing Expressway, and Chaoguan Expressway. Huizhou City can also establish industrial links with cities, such as Shenzhen, Dongguan, and Shanwei. Relying on the north–south regional traffic corridors, such as Hui Ao Avenue, Shu Gang Avenue, and Hui Da railway, the upstream and downstream cooperation between the regional industries can be strengthened. The main road system, with the framework of West Avenue, Industrial Avenue, Coastal Avenue, Zishan Avenue, and Guangshan Highway, is also being promoted in the region.
In terms of the environment, the core abdomen of the study area is the Tonghu wetland, which is already directly designated as a prohibited construction area, for the protection of the core ecological resources. At the same time, following the principles of “fortress besieged by the city”, “leading the mountain into the city”, and “entering the city into the city”, we should improve the construction of wetland parks and ecological corridors, set up green open spaces, reserve ecological landscape corridors, and combine the Hakka culture and marine culture to create a beautiful landscaped area.
In the planning of the Tonghu Lake District, we vigorously protect the core ecological environment, thus ensuring the rate of public green space in the region and improving the quality of life by providing greater comforts. The extensive transportation system in the region has provided a main artery for the development of the industry. The hierarchical design of the city has allowed for the reasonable planning of the city’s skyline. Reasonable planning promotes the urban suitability of Tonghu District from the three key aspects of transportation, construction and ecology.

4.3. Problems and Suggestions of Comprehensive Evaluation

4.3.1. Problems of Comprehensive Evaluation

In this paper, an improved analytic hierarchy process (AHP) model is established, based on the optimal transfer matrix and square root method. The model reduces the requirement for a large number of repeated evaluations by experts and improves the computational efficiency of the analytic hierarchy process. Moreover, compared with the traditional analytic hierarchy process model, the proposed model has a global adjustment feature. When adjusting an indicator in the indicator layer, the other indicators will be comprehensively considered; the final adjustment result is a comprehensive adjustment of the whole. This is equivalent to adding an intelligent overall regulator to the analytic hierarchy process.
The exposed lithology in the study area is mainly composed of the meso-thick quartz (hetero) sandstone of the Jurassic Zhangping formation and the viscous soil of the Quaternary Mugang formation. Meanwhile, the sandstone and cohesive soil are natural foundations with good properties. For underground space development, the better the foundation conditions are, the less will be the influence of any underground space development on the surface buildings. The large regional structures in the study area have simple control over the study area and are mostly distributed outside the area. Very few faults and ground fissures are located in the area, and these are easy to connect aquifers. The unfavorable factors of hydrogeological conditions are that they can easily cause engineering disasters. They can also reduce the bearing capacity of rock and soil and the buoyancy effect on underground buildings. However, the densely distributed water network in Tonghu District provides the perfect congenital conditions for improving the livability of the city. The influence of hydrogeological conditions on underground space development can be solved with engineering solutions. From the economic point of view, mitigating the impact of hydrogeological conditions on the development of underground space may cost much less than a landscape renovation project as a means to enhance the area’s livability. The geological engineering conditions in the study area are relatively good. However, during the development process, we should also pay attention to the destruction of topography and landform. Any occurrence of topography and landform deformation caused by engineering excavation or shield structure should also be avoided.

4.3.2. Relevant Recommendations

(1) Weathering and hydrogeological problems are the main unfavorable factors in the development and utilization of underground space in the study area. In this paper, it is suggested that, in the development and utilization of underground space in suitable areas, attention should be paid to the problems of land subsidence, slope instability, and the potential for collapse caused by soft soil.
(2) During the development of basic suitable areas, attention should be paid to the uneven weathering of rock and soil, the uneven hardness and softness caused by weak inter-beds and intrusive rocks. These factors may cause chamber inrush, shear creep failure and surrounding rock failure.
(3) During the process of developing poor suitability areas, attention should be paid to the protection of the surface landscape and water resources, thus avoiding problems such as the decline of groundwater levels, the drying up of wetlands, and the destruction of surface landscape that can otherwise be caused by the development of underground space.
(4) Based on the above-ground building planning and the constraints of underground geological conditions in the study area, it is suggested that high-rise buildings should be constructed in the areas where rocks, gravel, sand, and clay are distributed. Low-rise buildings should be constructed in the areas where slopes, sandy land, and silty soil are distributed. Any damage to the original green space should be reduced as much as possible, so as to reduce the cost of surface landscape reconstruction.

5. Conclusions

This paper is based on underground geological conditions, such as the regional geology, engineering geology, and hydrogeology, in the Tonghu District of Huizhou, combined with the above-ground natural and architectural conditions, such as topography, urban expected development scale, and urban livability. This paper studies the suitability of development and utilization, makes a comprehensive evaluation of the underground space resources in the study area, and draws the following conclusions:
(1) Huizhou follows the layout principle of “the core is high, the outward is gradually reduced, and the waterfront is the lowest”. The heights of the buildings in the district are divided into five grades, with the area’s architecture forming a high-low-lying, high-level urban form. By 2020 Huizhou City’s population will reach 100,000, and the scale of construction land will increase to 15 km2. By 2025, the population will reach 150,000, and the scale of construction land will increase to 25 km2. By 2030, the population will reach 250,000; the amount of construction land will increase to 38 km2. The total demand for underground space in the study area will reach 13.56 km2 in 2025, and 21.81 km2 in 2030.
(2) The area with poor suitability for the development of 0-15 m underground spaces in the study area covers a total of 68.506 km2, or 53.24% of the total area. The basic suitable area covers 39.820 km2, or 30.95% of the total area. The suitable area covers 20.337 km2, or 15.81% of the total area. The suitable areas for underground space development in the study area are mainly distributed in such industrial parks as the Intelligent Science and Technology Gathering Park, the Creative and Design Industrial Park, Big Data Industrial Park, and the Innovation and Headquarters Economic Zone. The poor suitability areas are mainly distributed in the north, middle, south, and southwest of the study area. In the central region, there are the Tonghu wetlands on the ground, underground rivers, and poor hydrogeological conditions. In the north, the zoning of middle grain granites in the Qiaoyuan formation (Jqy) and three late Jurassic Gong Cun units is divided into poor suitability areas. Poor suitability areas in the south and southwest of the study area are the areas with dense river networks.
(3) In this paper, it is suggested that, in the development and utilization of underground space in suitable areas, attention should be paid to the problems of land subsidence, slope instability, and the potential for collapse caused by soft soil. During the development of basic suitable areas, attention should be paid to the uneven weathering of rock and soil, the uneven hardness and softness caused by weak inter-beds and intrusive rocks. During the process of developing poor suitability areas, attention should be paid to the protection of the surface landscape and water resources, thus avoiding problems such as the decline of groundwater levels, the drying up of wetlands, and the destruction of surface landscape.

Author Contributions

X.Z. and C.W. designed the project; X.Z. wrote the paper; J.F. and H.W. corrected it. X.Z. modified the formats. Visualization: H.L. All authors have read and agreed to the published version of the manuscript.

Funding

The authors would like to give sincere thanks to the funding agencies that supported this research. This work was supported by the Huizhou Multi-factors Urban Geological Survey Project (no. DD20190287) and the Fundamental Research Funds for the Central Universities (no. 2017 CXNL03).

Conflicts of Interest

The authors declare no conflict of interest.

References

  1. Tong, L.X. Sufficient Resource of Underground Space—for the City Development in 2lst Century. Undergr. Space 2000, 20, 1–5. [Google Scholar]
  2. Tong, L.X. Underground Space and Urban Modernization Development; Architecture & Building Press: Beijing, China, 2005. [Google Scholar]
  3. Tong, L.X. An Introduction to Underground Space (P.1). Undergr. Space 2004, 24, 133–136. [Google Scholar]
  4. Saaty, T.L. Relative measurement and its generalization in decision making why pairwise comparisons are central in mathematics for the measurement of intangible factors the analytic hierarchy/network process. Racsam Revista Real Acad. Cienc. Exactas Fisicas Nat. Serie A. Mat. 2008, 102, 251–318. [Google Scholar] [CrossRef]
  5. Jia, S.P.; Li, W.P. Review of Assessment of Urban Underground Space Resource. Chin. J. Undergr. Space Eng. 2008, 4, 397–401. [Google Scholar]
  6. Peng, J.; Peng, F. A GIS-based evaluation method of underground space resources for urban spatial planning: Part 1 methodology. Tunn. Undergr. Sp. Tech. 2018, 74, 82–95. [Google Scholar] [CrossRef]
  7. Sun, P.S. Introduction to Urban Geological Work; Geological Publishing House: Beijing, China, 2004. [Google Scholar]
  8. Cheng, G.H.; Zhai, G.Y. Guide to Urban Geological Survey in China; Science Press: Beijing, China, 2013. [Google Scholar]
  9. Zheng, G.S.; Wei, W.S.; Liu, Z.M.; Wang, J.M.; Yu, C.L.; Xu, J.X.; Li, X.L. Study on Theory of Urban Geology. Urban Geol. 2018, 13, 1–12. [Google Scholar]
  10. Zhuang, Y.X.; Cheng, G.H.; Zhai, G.Y. China’s urban geological work-protection of urban sustainable development. In Proceedings of the International Symposium on Urban Geology, Shanghai, China, 6–10 October 2010. [Google Scholar]
  11. Admiraal, H.; Cornaro, A. Why underground space should be included in urban planning policy—And how this will enhance an urban underground future. Tunn. Undergr. Sp. Tech. 2016, 55, 214–220. [Google Scholar] [CrossRef]
  12. Li, X.Z.; Li, C.C.; Parriaux, A.; Wu, W.B.; Li, H.Q.; Sun, L.P.; Liu, C. Multiple resources and their sustainable development in Urban Underground Space. Tunn. Undergr. Sp. Tech. 2016, 55, 59–66. [Google Scholar] [CrossRef]
  13. Peng, J.; Peng, F.L. A GIS-based evaluation method of underground space resources for urban spatial planning: Part 2 application. Tunn. Undergr. Sp. Tech. 2018, 77, 142–165. [Google Scholar] [CrossRef]
  14. Tong, L.X. A New Phase of Underground Space Development in China. Urban Stud. 2002, 9, 18–21. [Google Scholar]
  15. Zeng, W.T. A Review on the New Urbanization Studies. J. Hunan Univ. Arts Sci. Soc. Sci. Ed. 2008, 33, 48–51. [Google Scholar]
  16. Cheng, G.H.; Yang, Y.; Zhao, M.H.; Sun, J.W.; Li, Y.F. Strategic Thinking of Urban Geological Work in the New Era. Geol. Rev. 2018, 64, 1438–1446. [Google Scholar]
  17. Li, X.H.; Wang, H.T.; Yang, C.H.; Jia, J.Q.; Hu, G.Z. Discussion about Development and Utilization of Underground Space in Mountain City. Chin. J. Undergr. Sp. Eng. 2005, 1, 319–322. [Google Scholar]
  18. Admiraal, J.B.M. Think Deep: Planning, Development and Use of Underground Space in Cities; ISOCARP: The Hague, The Netherlands, 2015. [Google Scholar]
  19. Tengborg, P.; Sturk, R. Development of the use of underground space in Sweden. Tunn. Undergr. Sp. Tech. 2016, 55, 339–341. [Google Scholar] [CrossRef]
  20. Zhou, Y.; Zhao, J. Assessment and planning of underground space use in Singapore. Tunn. Undergr. Sp. Tech. 2016, 55, 249–256. [Google Scholar] [CrossRef]
  21. Hao, A.B.; Wu, A.M.; Ma, Z.; Liu, F.T.; Xia, Y.B.; Xie, H.L.; Lin, L.J.; Wang, T.; Bai, Y.N.; Zhang, J.; et al. A Study of Engineering Construction Suitability Integrated Evaluation of Surface-underground Space in Xiongan New Area. Acta. Geosci. Sin. 2018, 39, 513–522. [Google Scholar]
  22. Working Group No.4, International Tunnelling Association. Planning and mapping of underground space—An overview. Tunn. Undergr. Sp. Tech. 2000, 15, 271–286. [Google Scholar]
  23. Hou, X.Y.; Liu, K. Theory and Applications of Modern Urban Underground Space Planning. Chin. J. Undergr. Sp. Eng. 2005, 1, 7–10. [Google Scholar]
  24. ENAA, GEC. A Guide to Underground Space Utilization and Planning 2015; Asia Printing Office Co.,Ltd., Engineering Advancement Association of Japan: Tokio, Japan, 2016. [Google Scholar]
  25. Wallace, M.I.; Ng, K.C. Development and application of underground space use in Hong Kong. Tunn. Undergr. Sp. Tech. 2016, 55, 257–279. [Google Scholar] [CrossRef]
  26. Zhu, H.H.; Huang, X.B.; Li, X.J.; Zhang, L.Y.; Liu, X.Z. Evaluation of urban underground space resources using digitalization technologies. Undergr. Sp. 2016, 1, 124–136. [Google Scholar] [CrossRef]
  27. Shen, X.K.; Wang, J.H.; Han, X.; Zhou, H.L. The main geological risk and control countermeasures in underground space development of Beijing. In Proceedings of the National Security and Protection Engineering Conference, Beijing, China, 29 October 2010; pp. 137–145. [Google Scholar]
  28. Boivin, D.J. Underground space use and planning in the Quebec City area. Tunn. Undergr. Sp. Tech. 1990, 5, 69–83. [Google Scholar] [CrossRef]
  29. Ronka, K.; Ritola, J.; Rarhala, K. Underground space in land use planning. Tunn. Undergr. Sp. Tech. 1998, 13, 39–49. [Google Scholar] [CrossRef]
  30. Guan, S.Y.; Zhu, R.; Gao, Z.Y. Influence of geological conditions to the development and utilization of underground space in Wuhan and the subarea evaluation. Geotec. Invest. Surv. 2008, 9, 6–10. [Google Scholar]
  31. Ou, X.D.; Yang, R.C.; Zhou, D.; Ou, G. Application of AHP to Geological Environment Suitability Assessment in Nanning Underground Development. J. Guilin Uni. Tech. 2009, 29, 474–480. [Google Scholar]
  32. Liu, K.; Peng, J.; Peng, F.L. Evaluation model for the suitability of underground space resources exploitation and utilization. Chin. J. Undergr. Sp. Eng. 2011, 7, 219–231. [Google Scholar]
  33. Peng, J.; Liu, K.; Zhen, F.T.; Li, X.J.; Peng, F.L. Evaluation for the suitability of underground space exploitation and utilization based on AHP. Chin. J. Undergr. Sp. Eng. 2010, 6, 688–694. [Google Scholar]
  34. Chen, X.S. Research on Combined Construction Technology for Cross-Subway Tunnels in Underground Spaces. Engineering 2018, 4, 103–111. [Google Scholar] [CrossRef]
  35. Doyle, M.R. From hydro/geology to the streetscape: Evaluating urban underground resource potential. Tunn. Undergr. Sp. Tech. 2016, 55, 83–95. [Google Scholar] [CrossRef] [Green Version]
  36. Wilson, J.S.; Clay, M.; Martin, E.; Stuckey, D.; Vedder-Risch, K. Evaluating environmental influences of zoning in urban ecosystems with remote sensing. Remote Sens. Environ. 2003, 86, 303–321. [Google Scholar] [CrossRef]
  37. Zou, L.; Hu, Y.J.; Chen, Z.F.; Xie, Y.X. Underground Space Plan of Small and Medium-Sized City Based on Demand Oriented. Chin. J. Undergr. Space Eng. 2017, 13, 7–13. [Google Scholar]
  38. Seed, H.B.I.; Idriss, B.D.I. Simplified Procedure for Evaluating Soil Liquefaction Potential. J. Soil Mech. Found. Div. 1971, 97, 1249–1273. [Google Scholar]
  39. Saaty, T.L.; Vargas, L.G. Models, Methods, Concepts & Applications of the Analytic Hierarchy Process; Springer Science & Business Media: Berlin, Germany, 2012. [Google Scholar]
  40. Saaty, T.L. What is AHP/ANP. In Proceedings of the First Japanese Symposium on the Analytic Hierarchy Process, Meijo University, Nagoya, Japan, 5–8 December 2006. [Google Scholar]
  41. Saaty, T. L. Decision making with the analytic hierarchy process. Int. J. Serv. Sci. 2008, 1, 83–98. [Google Scholar]
  42. Saaty, T.L. How to make and justify a decision: The analytic hierarchy process. Part 1. Examples and Applications. Системні Дoслідження та Інфoрмаційні Технoлoгії 2002, 1, 95–108. [Google Scholar]
  43. Zhou, X.; Hu, Y.; Deng, Y.; Chan, F.T.S.; Ishizaka, A. A Dematel-based completion method for incomplete pairwise comparison matrix in AHP. Ann. Oper. Res. 2018, 271, 1045–1066. [Google Scholar] [CrossRef] [Green Version]
  44. Ishizaka, A.; Labib, A. Review of the main developments in the analytic hierarchy process. Expert Syst. Appl. 2011, 38, 14336–14345. [Google Scholar] [CrossRef] [Green Version]
  45. Gomez-Ruiz, J.A.; Karanik, M.; Pelaez, J.I. Estimation of missing judgments in AHP pairwise matrices using a neural network-based model. Appli. Math. Comput. 2010, 216, 2959–2975. [Google Scholar] [CrossRef]
  46. Saaty, T.L. Decision-making with the AHP: Why is the principal eigenvector necessary. Eur. J. Oper. Res. 2003, 145, 85–91. [Google Scholar] [CrossRef]
  47. Bruelli, M.; Canal, L.; Fedrizzi, M. Inconsistency indices for pairwise comparison matrices: A numerical study. Ann. Oper. Res. 2013, 211, 493–509. [Google Scholar] [CrossRef]
  48. Saaty, T.L.; Tran, L.T. On the invalidity of fuzzifying numerical judgments in the Analytic Hierarchy Process. Math. Comput. Model. 2007, 46, 962–975. [Google Scholar] [CrossRef]
  49. Hong, Z.G.; Li, Y.; Fan, Z.H.; Wang, Y. Caculation on High-ranked R.I. of Analytic Hierarchy Process. Comput. Eng. Appl. 2002, 38, 45–47. [Google Scholar]
Figure 1. Location map of the study area.
Energies 13 00742 g001
Figure 2. Distribution map of stratum exposure in research area.
Energies 13 00742 g002
Figure 3. Main strata and lithologic histograms in the study area.
Energies 13 00742 g003
Figure 4. Distribution of faults in the study area.
Energies 13 00742 g004
Figure 5. Distribution of ancient rivers in the study area.
Energies 13 00742 g005
Figure 6. Diagram of the distribution of the soft soil in the study area.
Energies 13 00742 g006
Figure 7. Distribution of sand in the study area.
Energies 13 00742 g007
Figure 8. Hierarchical structure model.
Energies 13 00742 g008
Figure 9. Suitability for zoning of the shallow underground space within 15 m.
Energies 13 00742 g009
Table 1. Characteristics of the bedrock in the study area.
FormationLithologyBuried Depth of Roof/mThicknes
s/m
Weathering DegreeEigenvalue of Bearing Capacity fak/kPaDistribution
Jilingwan FormationIgnimbrite16.51.5Complete weathering-South and southeast of Lilin Town
11.5–18.04.2–11.5Strong weathering-
15.7–29.57.2–7.5Moderate weathering-
Zhangping FormationQuartz sandstone, siltstone, occasional mudstone, and glutenite0.5–38.50.9–27.25Complete weathering200–250Denudation dunes, medium-thick structure and sandy structure are mainly found in the central part of the basin.
3.0–59.61.9–23.9Strong weathering300–350
9.7–79.11.7–50.5Moderate weathering500–600
23.1–153.41.0–71.1Gentle weatheringMuddy siltstone/siltstone
1500–2000
Glutenite
2500–3000
Tangxia FormationSiltstone and argillaceous siltstone8.1–25.02.0–9.5Complete weathering200–250Most of the denudation mounds exposed in the south of the basin are independent, low-gentle mounds with medium-thick structure and sandy structure.
12.0–34.52.3–26.5Strong weathering300–350
15.1–42.32.7–47.6Moderate weathering500–600
24.1–62.93.9–8.8Gentle weathering1500–2000
Qiaoyuan FormationSiltstone, argillaceous siltstone, local shale4.0–7.21.8–2.7Complete weathering200–250Hills on the north side of the basin with steep terrain
5.8–40.02.0–18.5Strong weathering300–350
8.0–32.51.5–15.8Moderate weathering500–600
34.0–44.13.8–8.3Gentle weathering1500–2000
GongcunGranite--Gentle weathering4500–5000Northwest of the study area
Table 2. Differences in the mechanical properties of soils in the study area.
Types of SoilEigenvalue of Bearing Capacity
fak (kPa)
Compressibility and Self-Stabilization
Artificial filling, cultivation, alluvial silt and silty soil in rivers and lakes60–80Highly compressible soil
Silty clay, clay, silt100–120Lower bearing capacity
Sand120–150Medium compressible soil, poor self-stability
Pebble150–180Medium compressible soil
Silty clay, silt (Piedmont zone)120–150Medium to highly compressible soil, poor self-stability
Residual silty clay180–200Medium compressible soil with a certain degree of self-stabilization
Table 3. Single ranking and consistency test of the criteria level judgment matrix.
Suitability EvaluationEngineering GeologyHydrogeologyRegional GeologyWeight WiCharacteristic Value λmax
Engineering geology1390.62445.0774
Hydrogeology1/311/50.13922.8352
Regional geology1/9510.23654.2362
CI = (λ − n)/(n − 1)0.0165CR = CI/RI0.0131RI = 1.26
Table 4. Reference table for the RI value of the average random consistency index [49].
Orders1234567891011
RI000.520.891.121.261.361.411.461.491.52
Table 5. A single sequence of the regional geology and consistency test.
Regional GeologyA1A2A3A4A5Weight WiEigenvalue λmax
A1113150.31275.4533
A2112120.24005.0854
A31/31/211/31/20.08885.1165
A4113110.22665.1968
A51/51/22110.13185.4509
CI = (λ − n)/(n − 1)0.0652CR = CI/RI0.0582RI = 1.12
Table 6. A single sequence of the hydrogeology and consistency test.
HydrogeologyB1B2B3B4B5Weight WiEigenvalue λmax
B1111/31/61/20.09195.7146
B2111120.18755.4964
B3511110.23495.0496
B4611110.29455.4198
B521/21110.16215.2278
CI = (λ − n)/(n − 1)0.0954CR = CI/RI0.0852RI = 1.12
Table 7. A single sequence of the engineering geology and consistency test.
Engineering GeologyC1C2C3C4C5Weight WiEigenvalue λmax
C1111450.29225.1859
C2112650.36415.0386
C311/21230.20005.2310
C41/41/61/211/30.05945.4071
C51/51/51/3310.08435.4608
CI = (λ − n)/(n − 1)0.0662CR = CI/RI0.0591RI = 1.12
Table 8. Hierarchical total sorting and consistency test.
First grade Index aiRegional GeologyHydrogeologyEngineering GeologyGeneral Ranking
0.19450.09590.7096∑aibin
Second index bin0.31270.09190.29220.2770
0.24000.21620.36410.3258
0.08880.23440.20000.1817
0.22660.26930.05940.1121
0.13180.18820.08430.1035
CIi0.06520.09540.0662CI = ∑aiCIi = 0.0688
RIi1.121.121.12CI = ∑aiRIi = 1.12
CRi0.05820.08520.0591CR = CI/RI = 0.0614
Table 9. Suitability assignment and classification table for underground space development.
First Grade IndexSecond IndexMost SuitableMore SuitableLess SuitableEvaluation ScoreEvaluation Level
Regional geologyLithology 2.58Most suitable
Faults and folds
Palaeochannels
Geological hazard
Ground fissure
Engineering geologyBedrock features 3 Most suitable
Bearing capacity of foundation
Sand liquefaction
Soft layer features
Land subsidence
HydrogeologySurface water distribution 1.74More suitable
Groundwater distribution
Aquifer lithology
Aquifer permeability
Characteristic of supplementary drainage
Table 10. Table forecasting the underground space demand in the research area.
Index2025 Year2030 Year
Permanent population (10,000 people)1525
Per capita residential land (m2/person)20.2418.86
Per capita scale of construction land (km2/10,000)1.672
Per capita park green space area (m2/person)2025
Percentage of forest cover (%)6565
Total land use (km2)141.56149.81
Intelligent area of Tonghu (km2)128
Demand for underground space resources (km2)13.5621.81
Table 11. Height division and influence range of buildings with different grade natural foundation.
Building GradeHeight/mPredicting the Depth of Foundation
/m
Predicting the Influence Depth of Foundation
/m
Architectural Uses
First level>100>8.3>10Station, TOD plot, landmark building
Second level75–1006.25–8.38.25–10.3Grouped plots, land for public facilities and residential land
Level three45–753.75–6.255.75–11.25Industrial and service life groups and construction land of villages and towns
Level four24–452–3.754–5.75Industrial groups and planning for additional industrial land
Level five9–240.75–22.75–4Scenic spots, villas, municipal utilities, schools

