1. Introduction
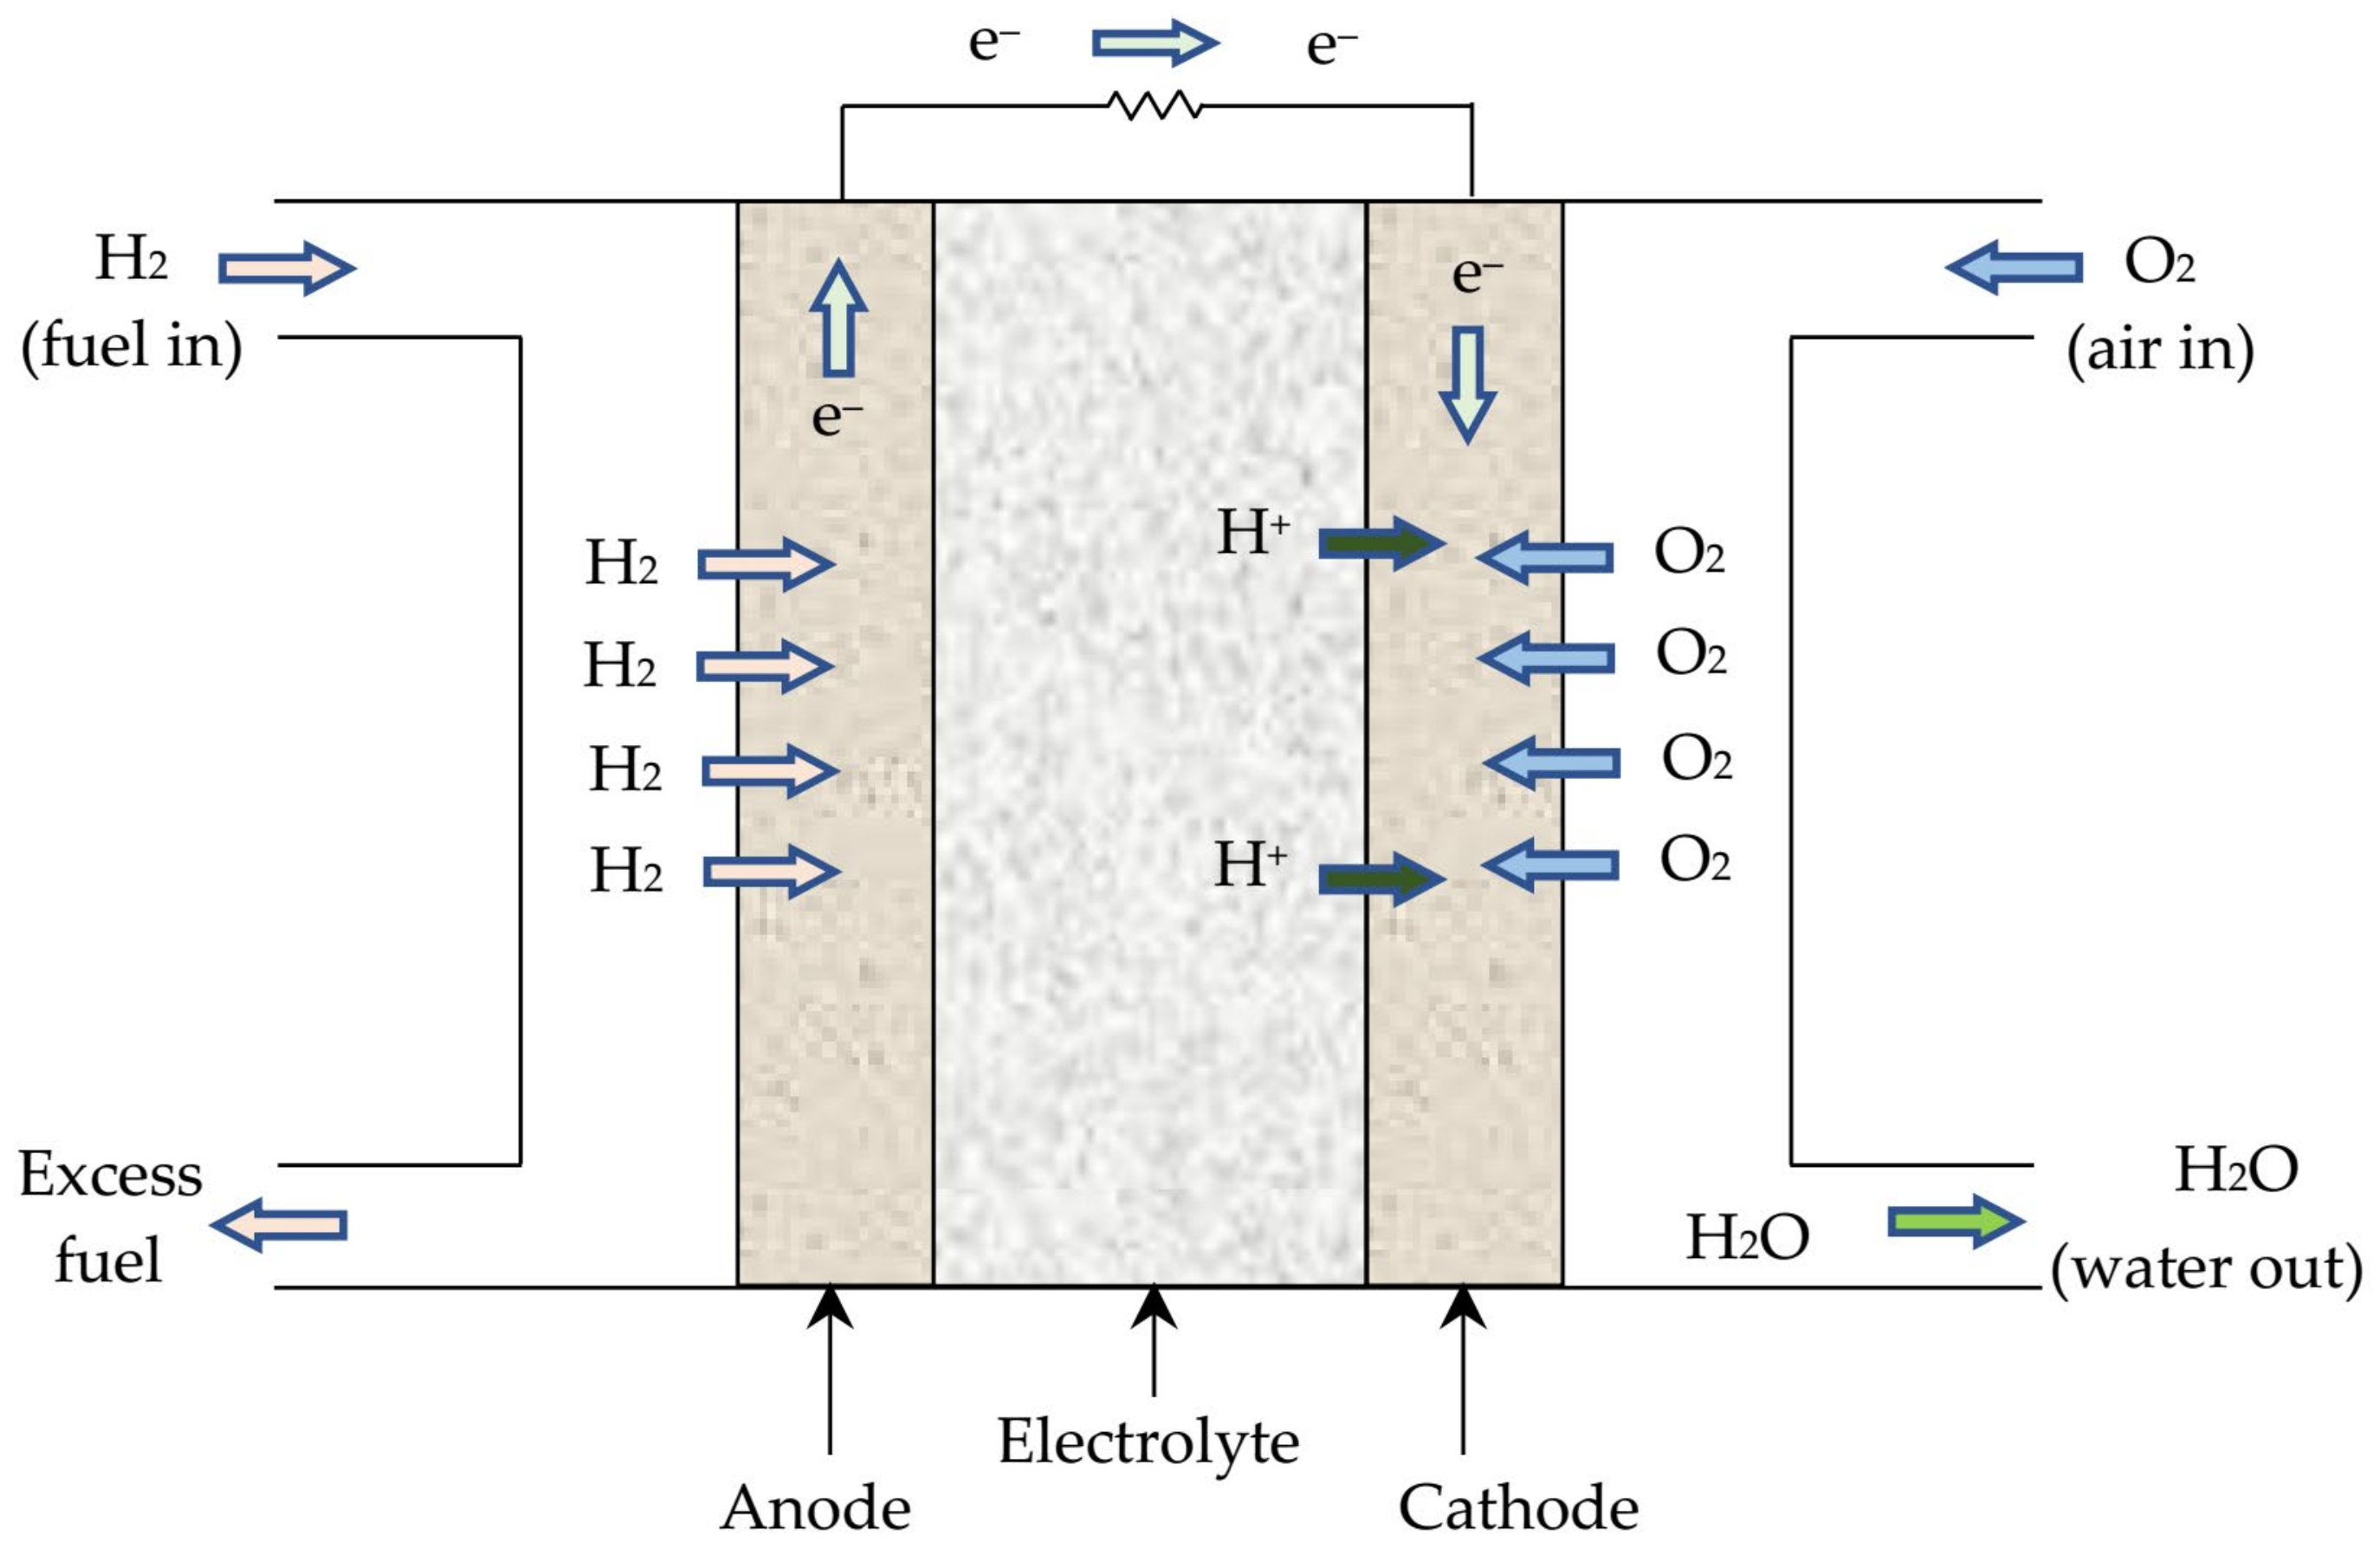
Developments of substitute green power sources are essential to minimise the growing need for fossil fuel due to the betterment of the environment and health. Fuel cell technology is considered a promising alternative power converter for sustainable development. Conventional fuels have limited availability and are responsible for climate change as well as being harmful to the ozone layer. On the other hand, fuel cells generate electricity through electrochemical reactions without emitting any harmful substances, such as carbon dioxide. Fuel cells provide a unique one-step energy conversion process (chemical energy—electricity) compared to the heat engine based on combustion, which requires a four-step energy conversion process (chemical–thermal–mechanical–electrical energy).
Among various types of fuel cells, proton exchange membrane fuel cell (PEMFC) is widely used because of its high efficiency, fast startup and ability to perform at low temperatures. Having a lifespan of 5000 h and a high-power density (0.3–0.8 W/cm
2), PEMFC is perfectly suited for electric vehicles. However, the PEMFC has the limitations of having sensitivity to carbon monoxide (CO) and the use of costly platinum catalyst [
1]. Distributed power generation, emergency back-up power supply and remote-area power supply are some applications of stationary fuel cells. However, fuel cells can be used in both stand-alone and grid-connected power systems [
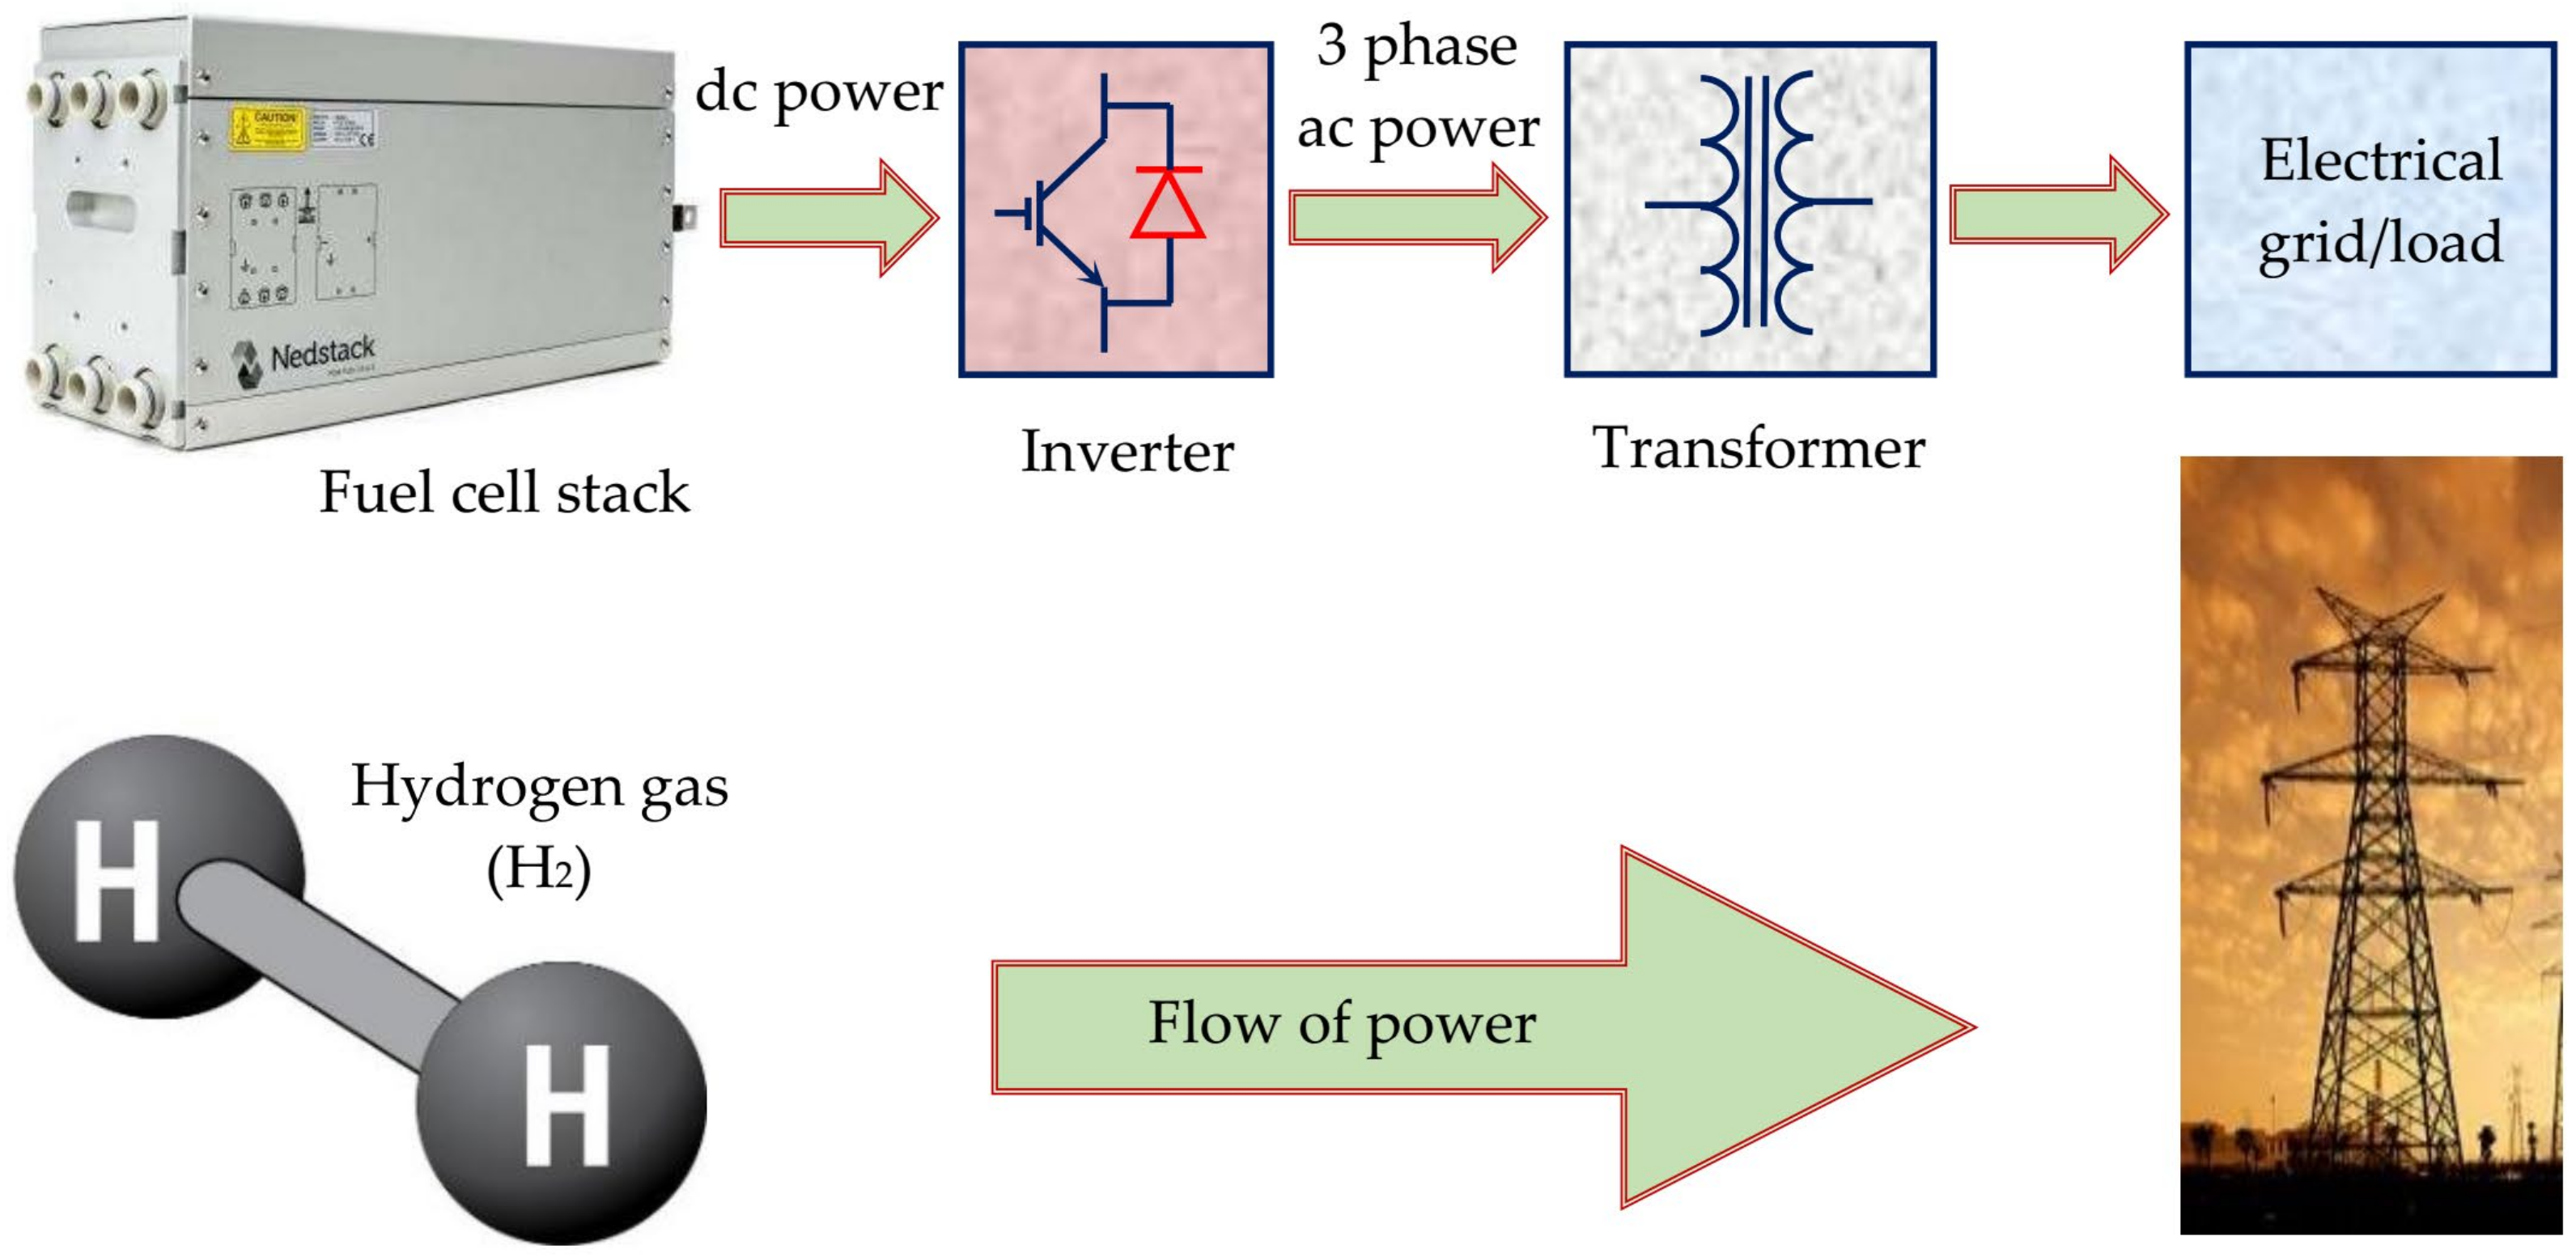
2]. In reality, a single fuel cell can produce less than 1 volt. Therefore, a fuel cell stack, a combination of several fuel cells, is required to produce sufficient potential difference.
Some properties of a fuel cell are considered critical, such as flow rate, and pressure of air and fuel, since the performance of a fuel cell directly depends on these properties. A simplified model of a specific type of PEMFC was analysed for simulation setup by Ahmed et al. [
1]. Pressure and flow rate of a PEMFC were measured by Lee et al. [
3] using micro-sensors, whereas a fuel and air supply pressure were varied in [
1] to observe the behavior of the PEMFC. A micro-electromechanical system was applied to combine micro pressure and flow sensors [
3]. A fuzzy set theory-based oxygen flow control method of a PEMFC was proposed by Polak et al. [
4]. Simulation results showed that the proposed method improves oxygen utilisation. There was a risk of CO poisoning on the anode since PEMFC is sensitive to CO. An algorithm based on air bleed was presented for CO poisoning detection and regeneration [
5]. The results showed that it is possible to regenerate all voltage losses due to CO poisoning. A fuzzy proportional-integral (PI) controller based PEMFC power plant was designed by Ashitha et al. [
6] where the controller was capable of regulating both active and reactive power flow. The controller was able to maintain a stable power factor where the system was connected to the grid. The active power demand of the load was distributed between the two sources as well.
A PEMFC distributed generation system was designed by Wang et al. [
7] where the connection between the fuel cell power plant and the grid was established by using dc/dc converters and a pulse-width modulated inverter. A controller was used in the system to control the power flow. Ten fuel cell arrays with parallel connections were used to design the proposed 480 kW PEMFC based power plant. Each array consisted of 96 stacks where 8 stacks were connected in series, and 12 were in parallel. Each fuel cell stack was rated at 500 W. The nominal operating current was 20 A, and the output voltage was almost 27 V for the proposed fuel cell. Ten parallel-connected dc-dc boost converters were utilised to provide high-quality dc power. A duty ratio of almost 55% was maintained by the authors for a dc-dc converter. A 500 kW three-phase inverter was used here, which was rated at 480 V dc and 208 V ac. An LC filter with a 0.15 mH inductance and 306.5 µF capacitance were introduced to determine the output of the dc-dc converter and to minimise the harmonics of the inverter. Supercapacitors were used to increase the storage facility, whereas a coupling inductor was connected to the system to regulate the real and reactive power.
A PEMFC based power plant was presented by El-sharkh et al. [
8] for residential usages where the system was designed with fuel cell stack, methanol reformer, and power conditioning unit. Reformer was used to make separation of hydrogen from hydrocarbon fuel where its flow was regulated by a PI controller. A dc-dc boost converter was connected to the dc bus. An inverter was used to convert dc power into ac power. Modulation index and phase angle were controlled with PI controller that further regulated the reactive and real powers, respectively. A 60-kW power plant based on PEMFC was designed by Zhang et al. [
9] for residential power supply. Three hundred series-connected cells were used to build the Nafion 117 membrane-based fuel cell stack. A humidifier was used to humidify the air and maintained the water management of the system. The rated stack temperature, humidity, and cathode pressure of the system were 75 °C, 100%, and 0.3 MPa, respectively. Ideal gas equation, physical chemistry law, and matter energy conservation were considered for designing the proposed system.
The control system of a 25-kW grid connected PEMFC based power plant was proposed in [
10], which had the ability to handle both the
dq axis current components. The design and simulation of a shunt controller were implemented in [
11] to control the transmission line voltage through a 3-phase voltage source inverter. A PI controller was applied to control the modulation index of the inverter. The control methodology of a 1 kW stand-alone PEMFC stack-based power plant was described by Choudhury et al. [
12] where valves, coolant pump, gas heater, and blower in combination kept the balance of the plant. Results showed that gas flow regulation and load switching had been successfully made. A PEMFC based distributed generation system was designed with the control of real and reactive power [
13]. Phase angle and magnitude were utilised to regulate the active power transfer and reactive power management, respectively. The MATLAB software was used for simulation where active and reactive powers were varied. Results showed that the PI controller functioned appropriately according to the variations. An integrated dynamic model was used to analyse the control of active and reactive power output of a stand-alone PEMFC based power plant [
14]. The proposed model consisted of a fuel cell, gas reformer and a power conditioning unit. The analysis was based on both simulation and experimental results. The PI and flatness-based controllers were compared for the power plant’s dc bus stabilisation, although a fuzzy logic controller can also be used for the same purpose. The ac voltage control of an electrical generator was performed with the fuzzy logic controller, where it controlled the modulation index of the 3-phase voltage source inverter [
15]. The effect of change in the switching frequency for pulse width modulation was analysed [
16].
A 25 kW PEMFC was developed by Hoeflinger et al. [
17], which was operated at steady-state conditions to measure the system efficiency and stack voltage by varying air compressor pressure ratio, stack temperature, load point and air excess ratio. Air compressor pressure ratio variation was set to a limit of 1.67, whereas air excess ratio was varied between 1.3 to 1.7. Results showed that at high load, system efficiency was proportional to air pressure but inversely proportional to mass flow. On the other hand, the result was the opposite at low loads. Air management system for a fuel cell was studied by Blunier et al. [
18], and it was recommended that the system showed a stable operation and provided higher efficiency between 1.5–2.5 bar. It was also recommended to keep the stack size smaller. To achieve high efficiency, centrifugal compressors provided better performance for high pressure fuel cells. The influence of operating pressure on a 20 kW PEMFC system was presented by Qin et al. [
19], where the operating pressure at the cathode was considered only. Both experimental and simulation were carried out to investigate the air compressor properties and fuel cell stack, respectively. System efficiency and energy consumption of the compressor were maximised with the increase of operating pressure. Operating pressure (critical) of 1.2 atm was mentioned, which varied with the compressor efficiency.
PEMFC based power generation systems along with their control methodology, were discussed [
6,
7,
10,
13,
14,
20,
21]. The electrical power generation systems based on PEMFCs with controlled power conditioning units were presented in [
6,
7,
10,
21], whereas active and reactive power control was presented in [
13,
14]. However, analysis of characterisation or performance evaluation of the PEMFCs was not discussed in [
6,
7,
10,
13,
14,
21]. On the other hand, storage systems were used along with the fuel cells; however, the storage systems could be avoided for cost minimisation [
20,
21]. A study on the pressure drop and flow rate of the PEMFC was described by Lee et al. [
3] without connecting it to an ac power system. No article, as reported in this paper, presented the complete electrical power generation system starting from performance analysis of the PEMFC to the grid connection with a controller.
In this paper, the behavior of the PEMFC is analysed under different operating conditions, including critical pressures. Characteristics of the fuel cell for operation below and above the critical air and fuel supply pressures are also presented. Simulations are carried out to find the optimal values and observe the changes in the efficiency and the consumption of air and fuel by the system. Performance analysis of the PEMFC based on fuel and air supply pressures is crucial because a small misbalance of these parameters can affect the power generation significantly. Then the dc electrical energy produced by the PEMFC is converted to ac power by using a 3-phase pulse width modulated inverter and is supplied to the local grid through a transformer. No energy storage system is used in the proposed system. The reason is that storage is not necessary because the controller successfully produces electrical power continuously. It also avoids the unnecessary complexity of the system. The current control strategy is discussed explicitly. The controller performance, as well as the electrical properties of the system, are analysed and presented. The MATLAB-Simulink software is used for simulation.
2. Prospects of the Fuel Cell
The initial prototype of a fuel cell was developed in 1839 based on an electrolysis experiment. A variety of fuel cells are available based on the type of electrolyte, such as the proton exchange membrane fuel cell (PEMFC), phosphoric acid fuel cell (PAFC), solid oxide fuel cell (SOFC), alkaline fuel cell (AFC), molten carbonate fuel cell (MCFC), etc. The fuel cell is one of the cleanest devices for electrical power generation. The efficiency of fuel cells is relatively high, and they can be used in a wide range of temperatures. Among them, the PEMFC, AFC and PAFC can be operated at low temperatures (50–250 °C), whereas the SOFC and MCFC are high-temperature fuel cells (650–1000 °C). A high-temperature PEMFC has recently been developed with the combination of polybenzimidazole membrane and phosphoric acid through doping. This unique feature allows the high-temperature PEMFC to perform its operation at a temperature of 200 °C. The efficiency of fuel cells lies between 40–60% depending on types, but it can be achieved up to 85% through cogeneration. Due to the low operating temperature, PEMFCs are not suitable for cogeneration cycles [
22]. Cogeneration is an approach for electricity production by combining heat and power. The static operating nature of a fuel cell has made it quiet and vibrationless. The fuel cell is a suitable device due to its various amenities, such as high efficiency, zero emissions, simplicity, modularity and static nature. The fuel (input) of a fuel cell is not considered a renewable energy source. But hydrogen is universally available, which is used as fuel in a hydrogen fuel cell. Therefore, its popularity is increasing daily.
PEMFC is one of the most promising types of fuel cells in automobiles since it can be operated at low temperatures (60–80 °C) with an efficiency of around 60%. Almost all leading automobile companies are doing research for the advancement of fuel cells. The highest fuel efficiency is found in the recently developed PEMFC based Honda Clarity car compared to other American emission-less vehicles [
23]. Nikola One, a fuel-cell-powered vehicle manufactured by Nikola Motor Co., can travel more than 1200 km with a one-time hydrogen fill-up. Toyota’s introductory Mirai commercial fuel cell vehicle (FCV) with a comparatively smaller fuel cell stack became available in 2017. The Chevrolet Colorado ZH2 is designed for military use and has a 94 kW (126 HP) fuel cell stack. With a vision of having at least 800,000 FCVs in the streets by 2030, Japan introduced its first commercial hydrogen filling station in 2014, and the number reached 80 by mid-2016. Following a similar trajectory, the number of such stations in the U.S.A. and Germany is growing faster day by day. Along with the development of FCVs, safety issues are mitigated because hydrogen is safer than existing fuels due to its evaporation nature. In 2009, a fuel cell bus was launched in Hamburg, Germany, which can travel up to 250 km with an efficiency of 50% [
24,
25].
Another city bus has been developed with a combination of hydrogen fuel cells and a flywheel energy storage device. In comparison between flywheel and supercapacitor, the flywheel shows significant advantages over the other with an economically higher lifetime and power density. Therefore, the flywheel is used along with fuel cells [
26]. Asia accounts for almost 83% of globally used motorcycles. Therefore, the motorcycle needs to be modified in such a way that it can be efficient and noiseless with zero emissions. A prototype of a hydrogen fuel cell-based motorcycle has been designed that provides no emissions and low noise compared to existing motorcycles [
27]. The application of PEMFCs can also be noticed in marine sectors. A combined energy converter system was presented in [
28] where fuel cells, solar photovoltaic and a diesel generator were used. Though the system increased the cost, it reduced the level of CO
2 emissions significantly. In marine applications, the fuel cell is mainly used as an auxiliary power unit.
Power ratings of the PEMFC typically range from 1–250 kW. Besides automobiles, the PEMFC also plays a competitive role in portable and stationary power applications. A PEMFC can also be utilised as a back-up power unit. The PEMFC having power ratings of 3–7 kW is used for residential applications, whereas 50 kW electrical power is required in a typical building. Recently, Plug Power has developed a 7 kW PEMFC for residential usage. In Canada, Ballard power systems have invented a PEMFC with a 250-kW power rating for distributed power generation. On the other hand, a PEMFC based secondary power source of 2 kW is designed and expected to be used in manned lunar exploration missions. PEMFCs can also perform as auxiliary power sources [
29].
A combination of battery energy storage systems (BESSs) and energy conversion equipment can increase the grid reliability and the transfer of energy through transmission and distribution lines. A BESS with PEMFC was proposed by Knaggs et al. [
30] to improve the capacity of the BESS, which makes it economical. An energy management strategy of a fuel cell power plant was proposed in [
20], where both Li-ion batteries and supercapacitors are used as the storage system. A power management system consisting of a hybrid PEMFC-photovoltaic and ultracapacitor was developed by Naik et al. [
21], where the fuel cell was utilised as the primary power source.
Thus, fuel cells have various applications, including electrical power generation, road transportation, laboratory experiments. They can be implemented as a secondary power source or can be connected to a hybrid system. Therefore, the growing applications of fuel cells in different aspects are stunning.
4. Mathematical Model
In this section, the mathematical model of the PEMFC is adopted from Ural and Gencoglu [
32]. A specific stack of fuel cells is presented mathematically where it operates under optimal conditions of pressures and temperature. The simplified mathematical model is not applicable for the fuel cell under critical point. Therefore, the detailed model, as shown in
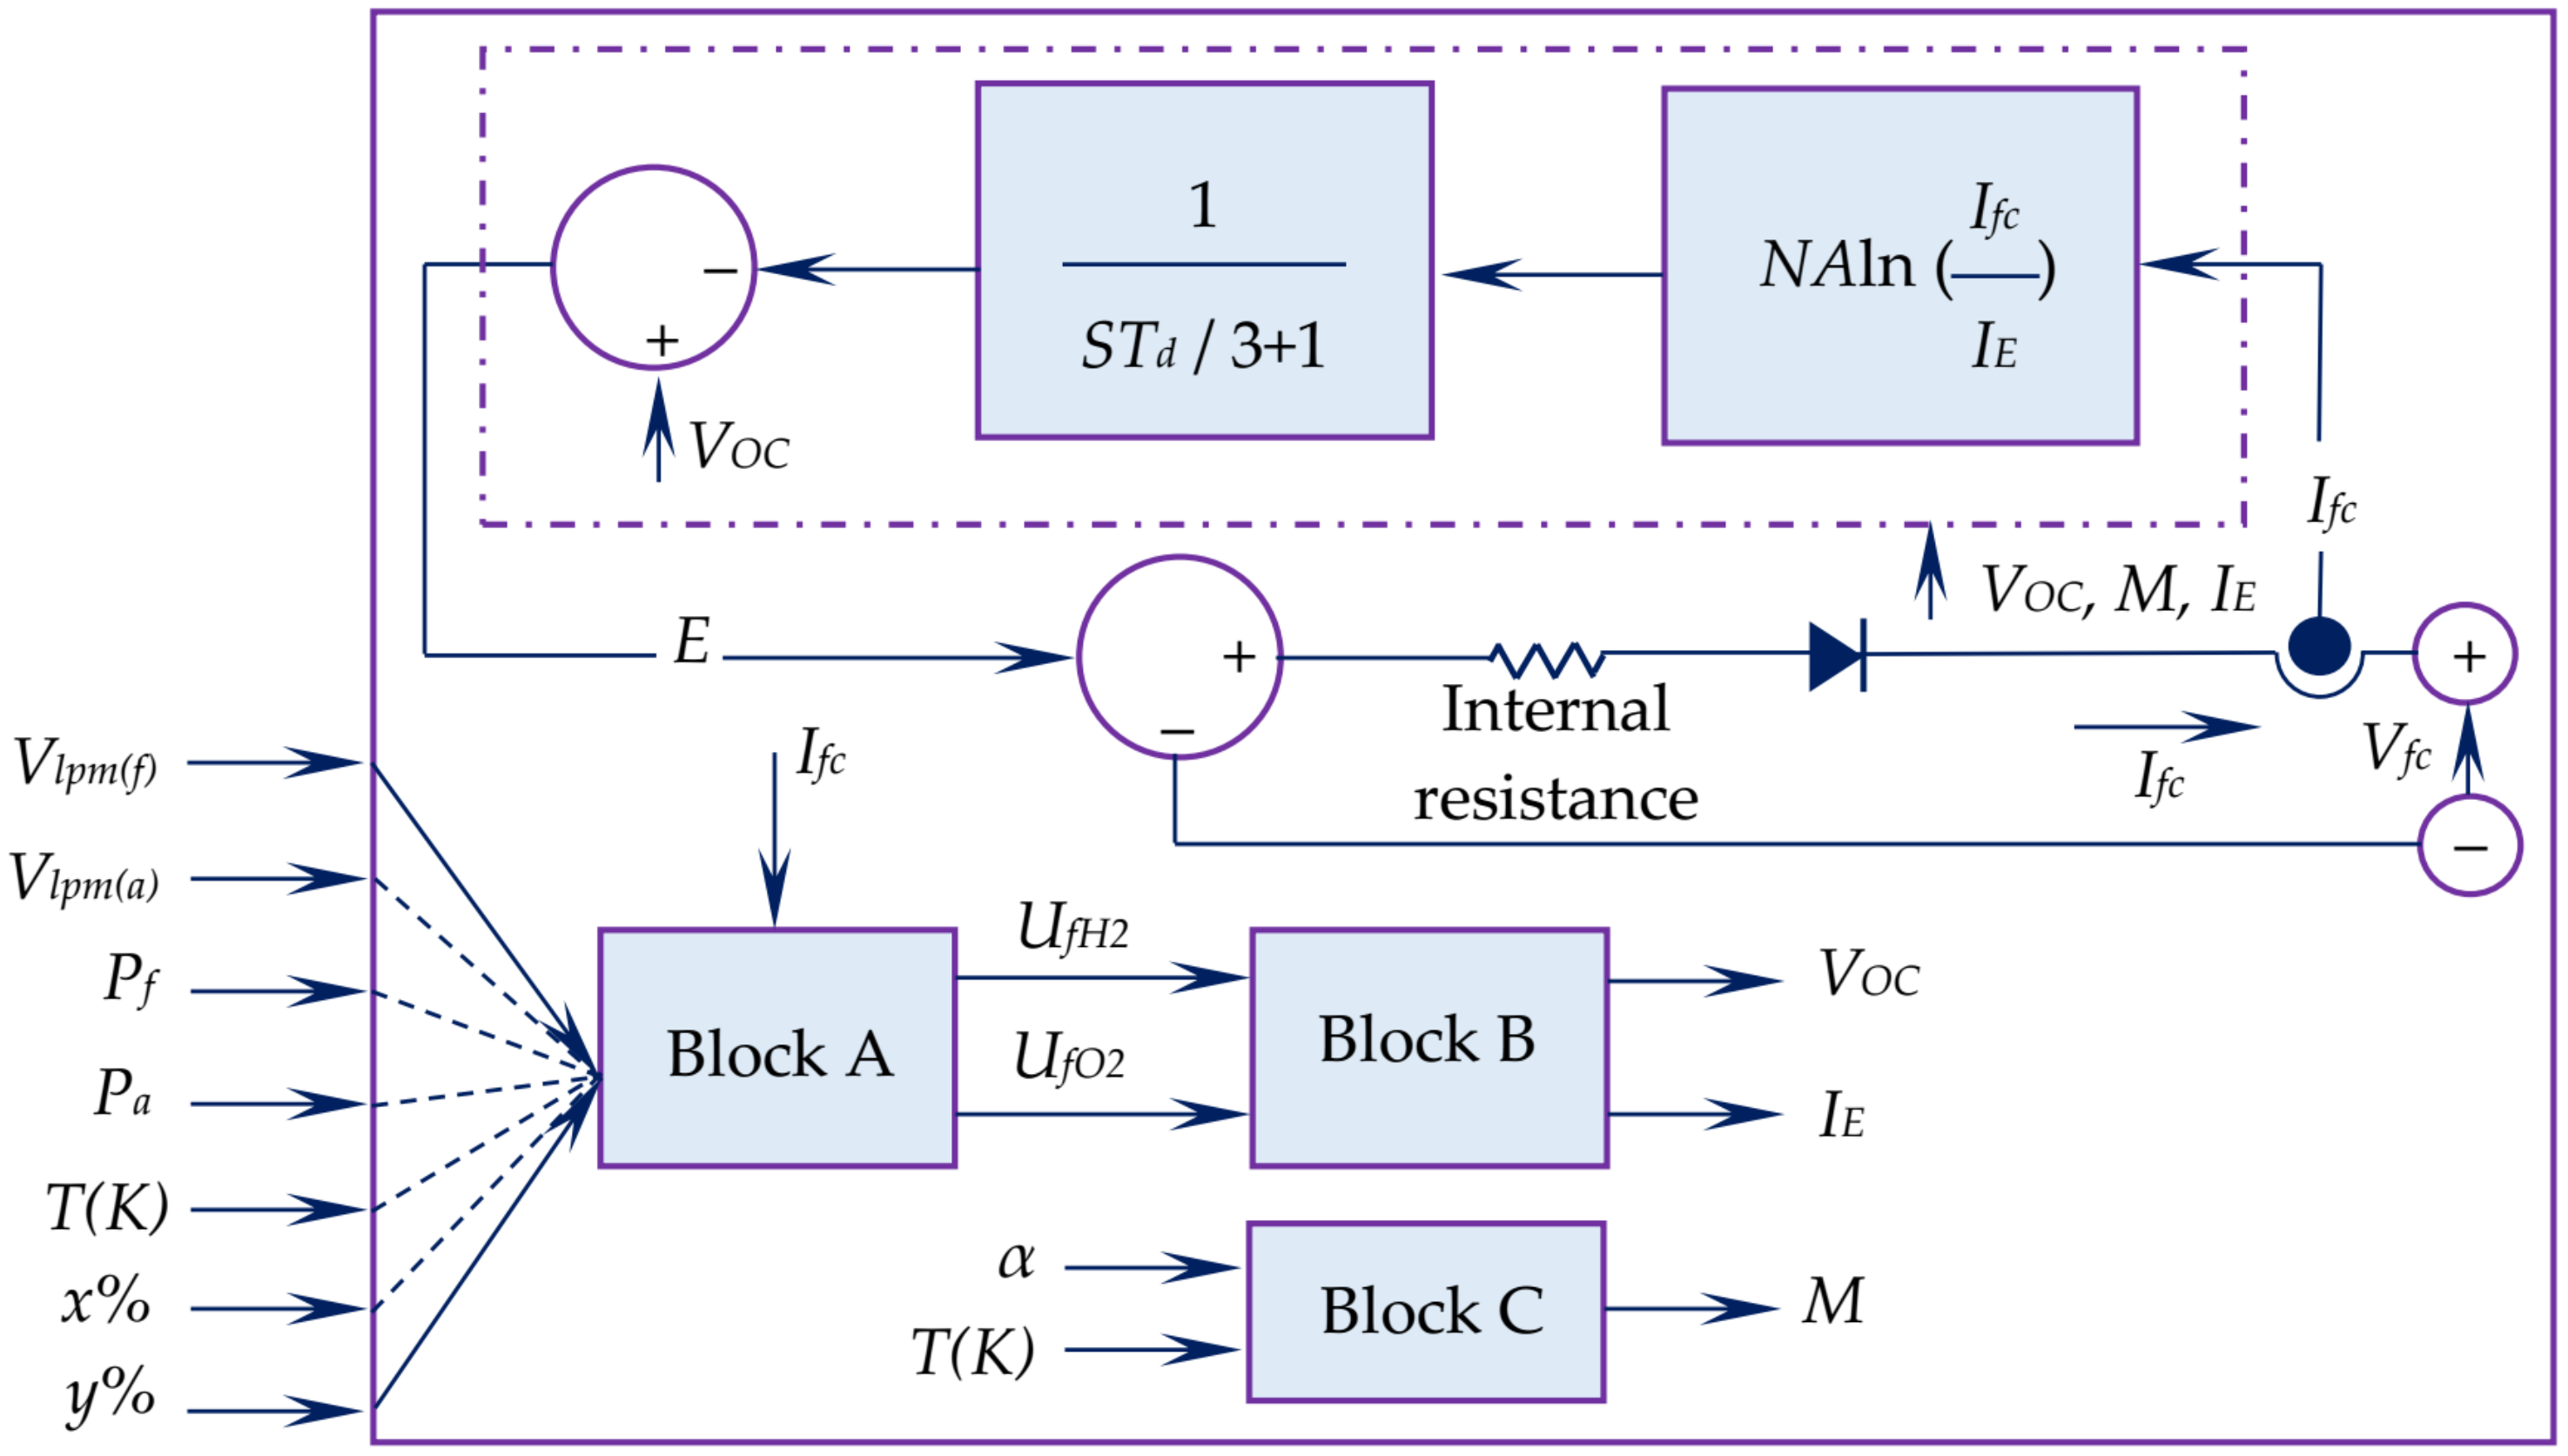
Figure 5, is considered for the PEMFC stack where some properties, including pressures, temperature, flow rates and composition of both the air and fuel, are varied. Variation in the properties have effects on
V0C,
IE and
M.
V0C,
IE and
M can be expressed as:
where
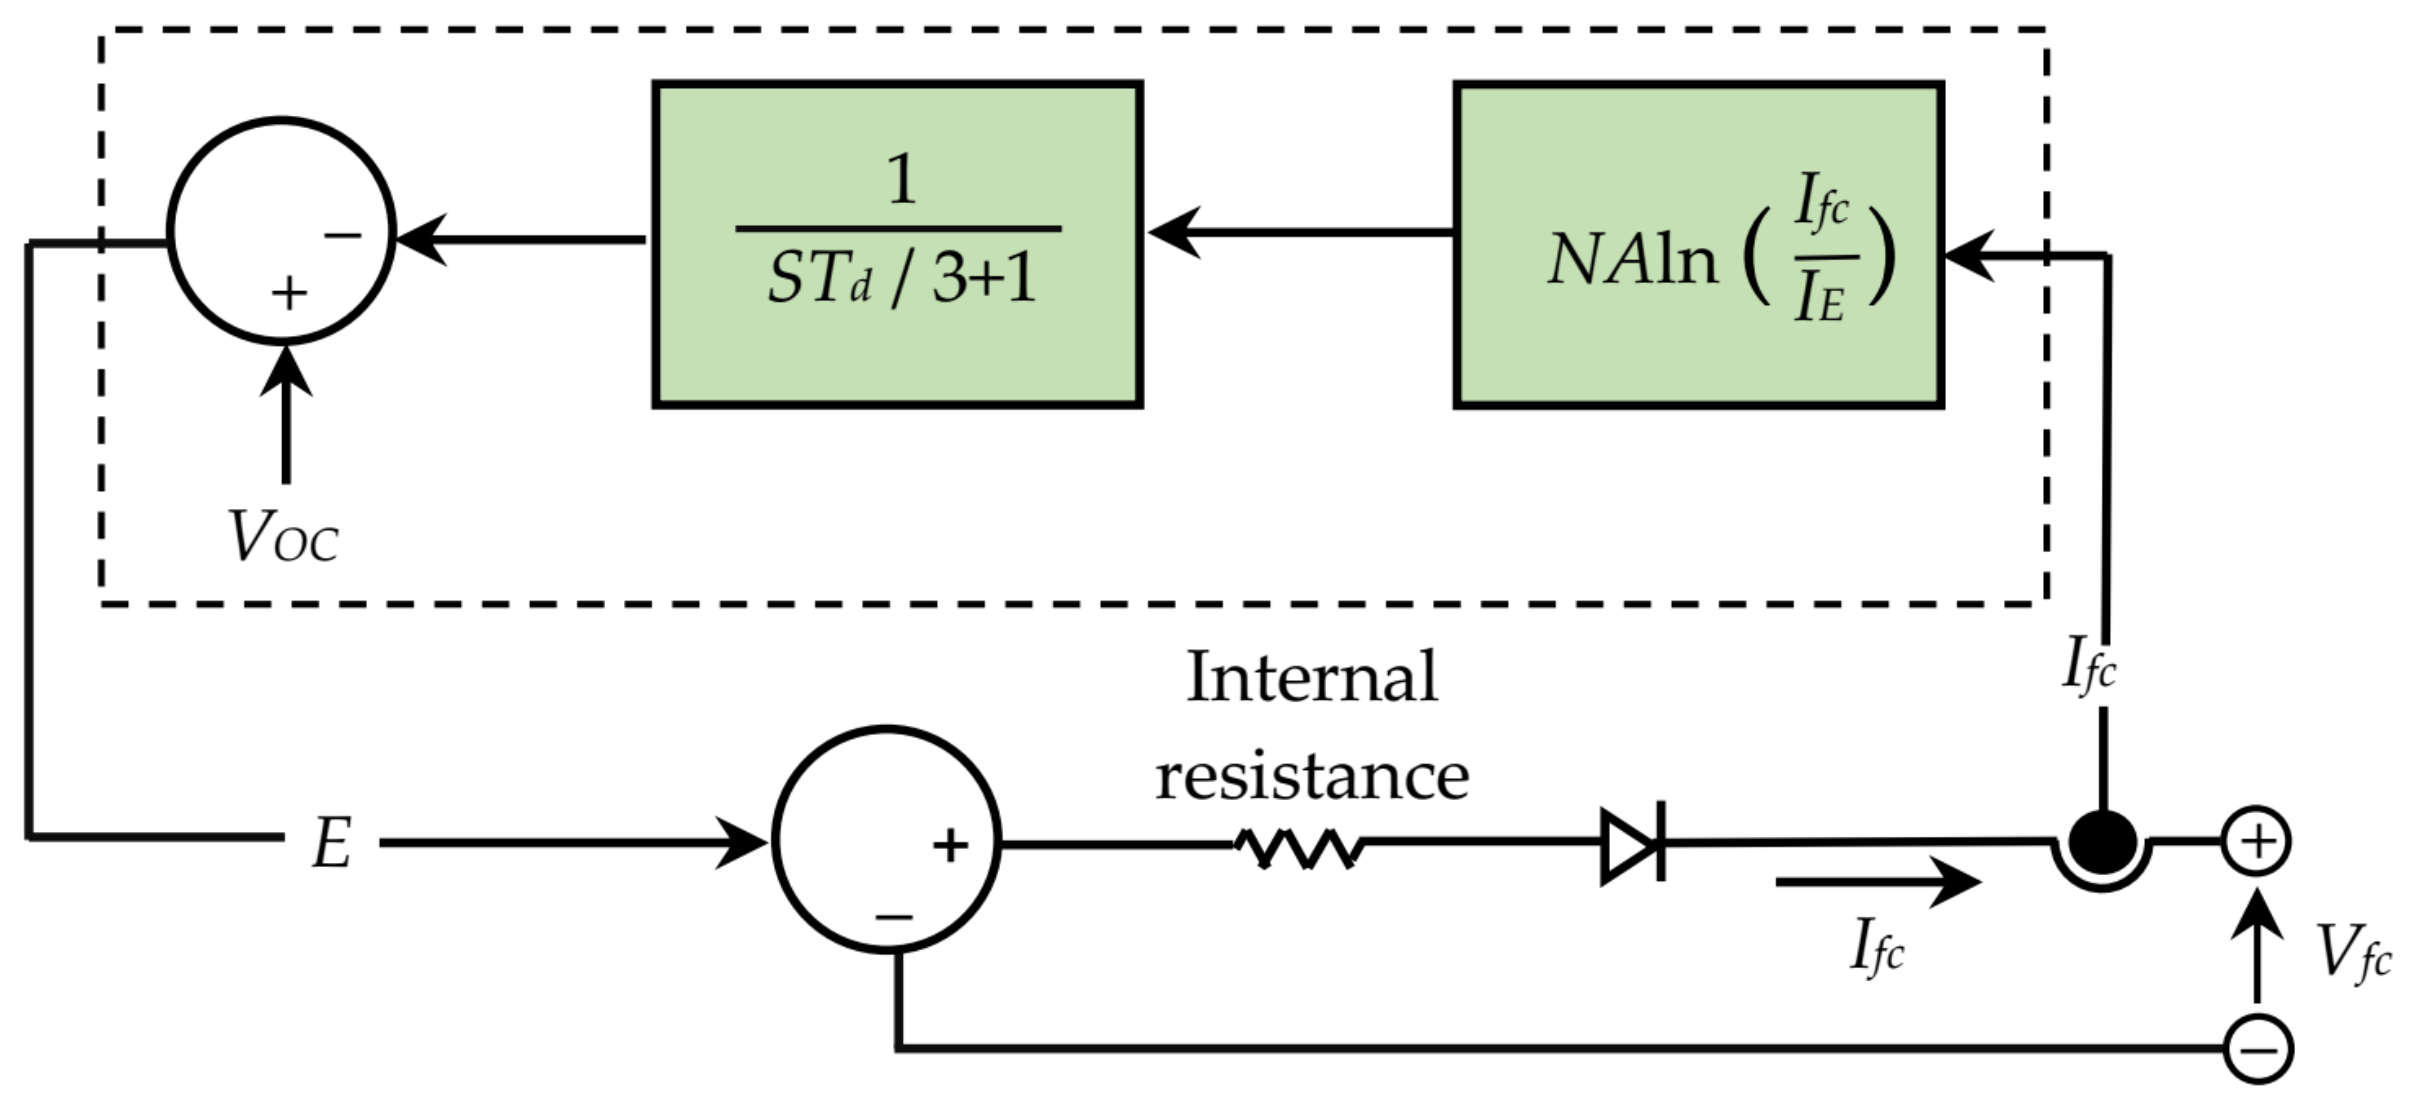
En depends on system temperature and the reactant’s partial pressures. A portion of the detailed model is similar to the simplified model shown in
Figure 3, but there are some differences for the varying parameters. The value of
V0C,
IE and
M are additionally considered in the detailed model.
Hydrogen and oxygen conversion rates in Block A can be determined as follows.
The partial pressures and the Nernst voltage can be expressed in the following.
The value of
V0C and
IE can be modified by using the partial pressures of the gases and the Nernst voltage. Block C measures the latest value of
M, whereas
V0C and
IE can be computed by Block B. The value of
α, Δ
G and
Kc depend on the polarisation curve at rated operating conditions, but some other parameters also play a vital role, for example, low heating value efficiency of the stack and variation of fuel (hydrogen) and air (oxygen) pressures with temperature. The nominal rates of conversion of gases are calculated as follows.
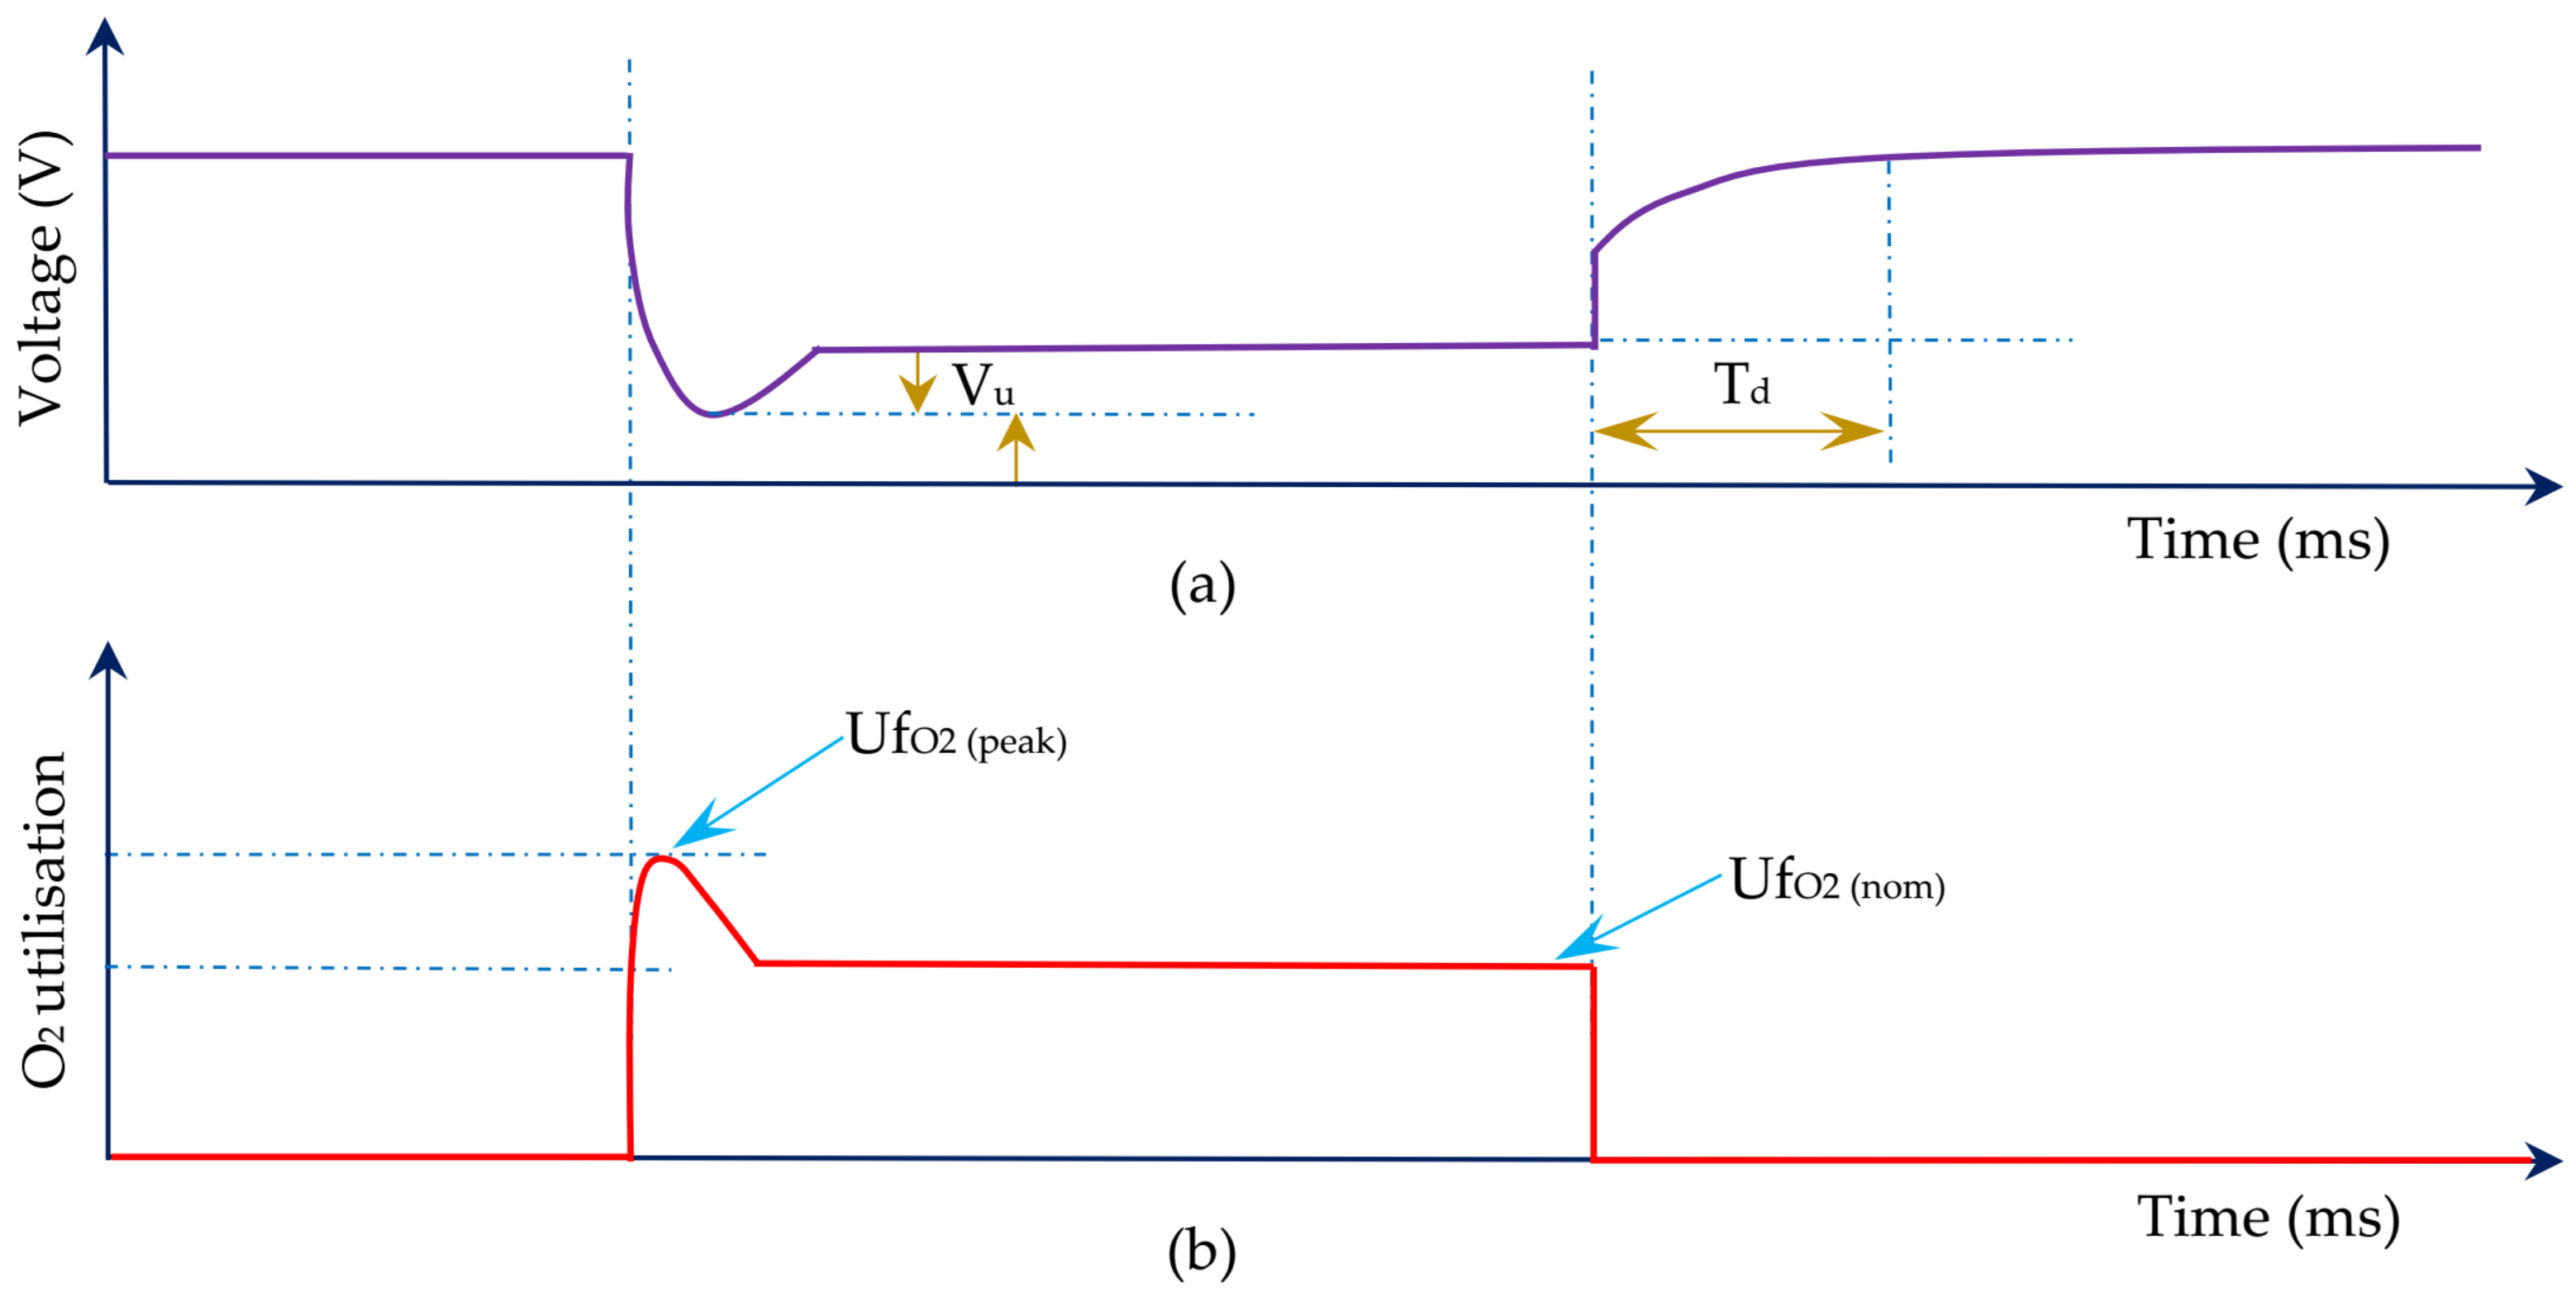
The rated partial pressures of gases and the Nernst voltage can be derived with the equations. It can be considered that the stack is operating at nominal rates of conversion when there is no fuel or air at the stack input. The stack’s current delivery depends on the flow rate of fuel. Voltage output decreases with the increase in load current due to the internal resistance. For modelling the ‘charge double layer’,
Td = 95% is used. The effect of oxygen depletion on the cell output voltage can be modelled by using the peak utilisation
(peak) and the corresponding
Vu. The maximum current production of the stack depends on the fuel and airflow rates. Due to this effect, the Nernst voltage can be modified as follows.
If the number of cells is not specified, it can be determined from (16).
If the oxygen conversion rate is 50% (as is usually the case for most fuel cell stacks), then the nominal air flow rate can be determined as follows.
Figure 6 depicts the characteristics of the PEMFC at the starting and running conditions. At the starting point, voltage sag occurs for a while, and an overshoot in the oxygen (O
2) utilisation is found. During running conditions, no significant variation in the voltage and O
2 utilisation are observed. At the endpoint, the voltage reaches to its initial value after a time delay
Td.
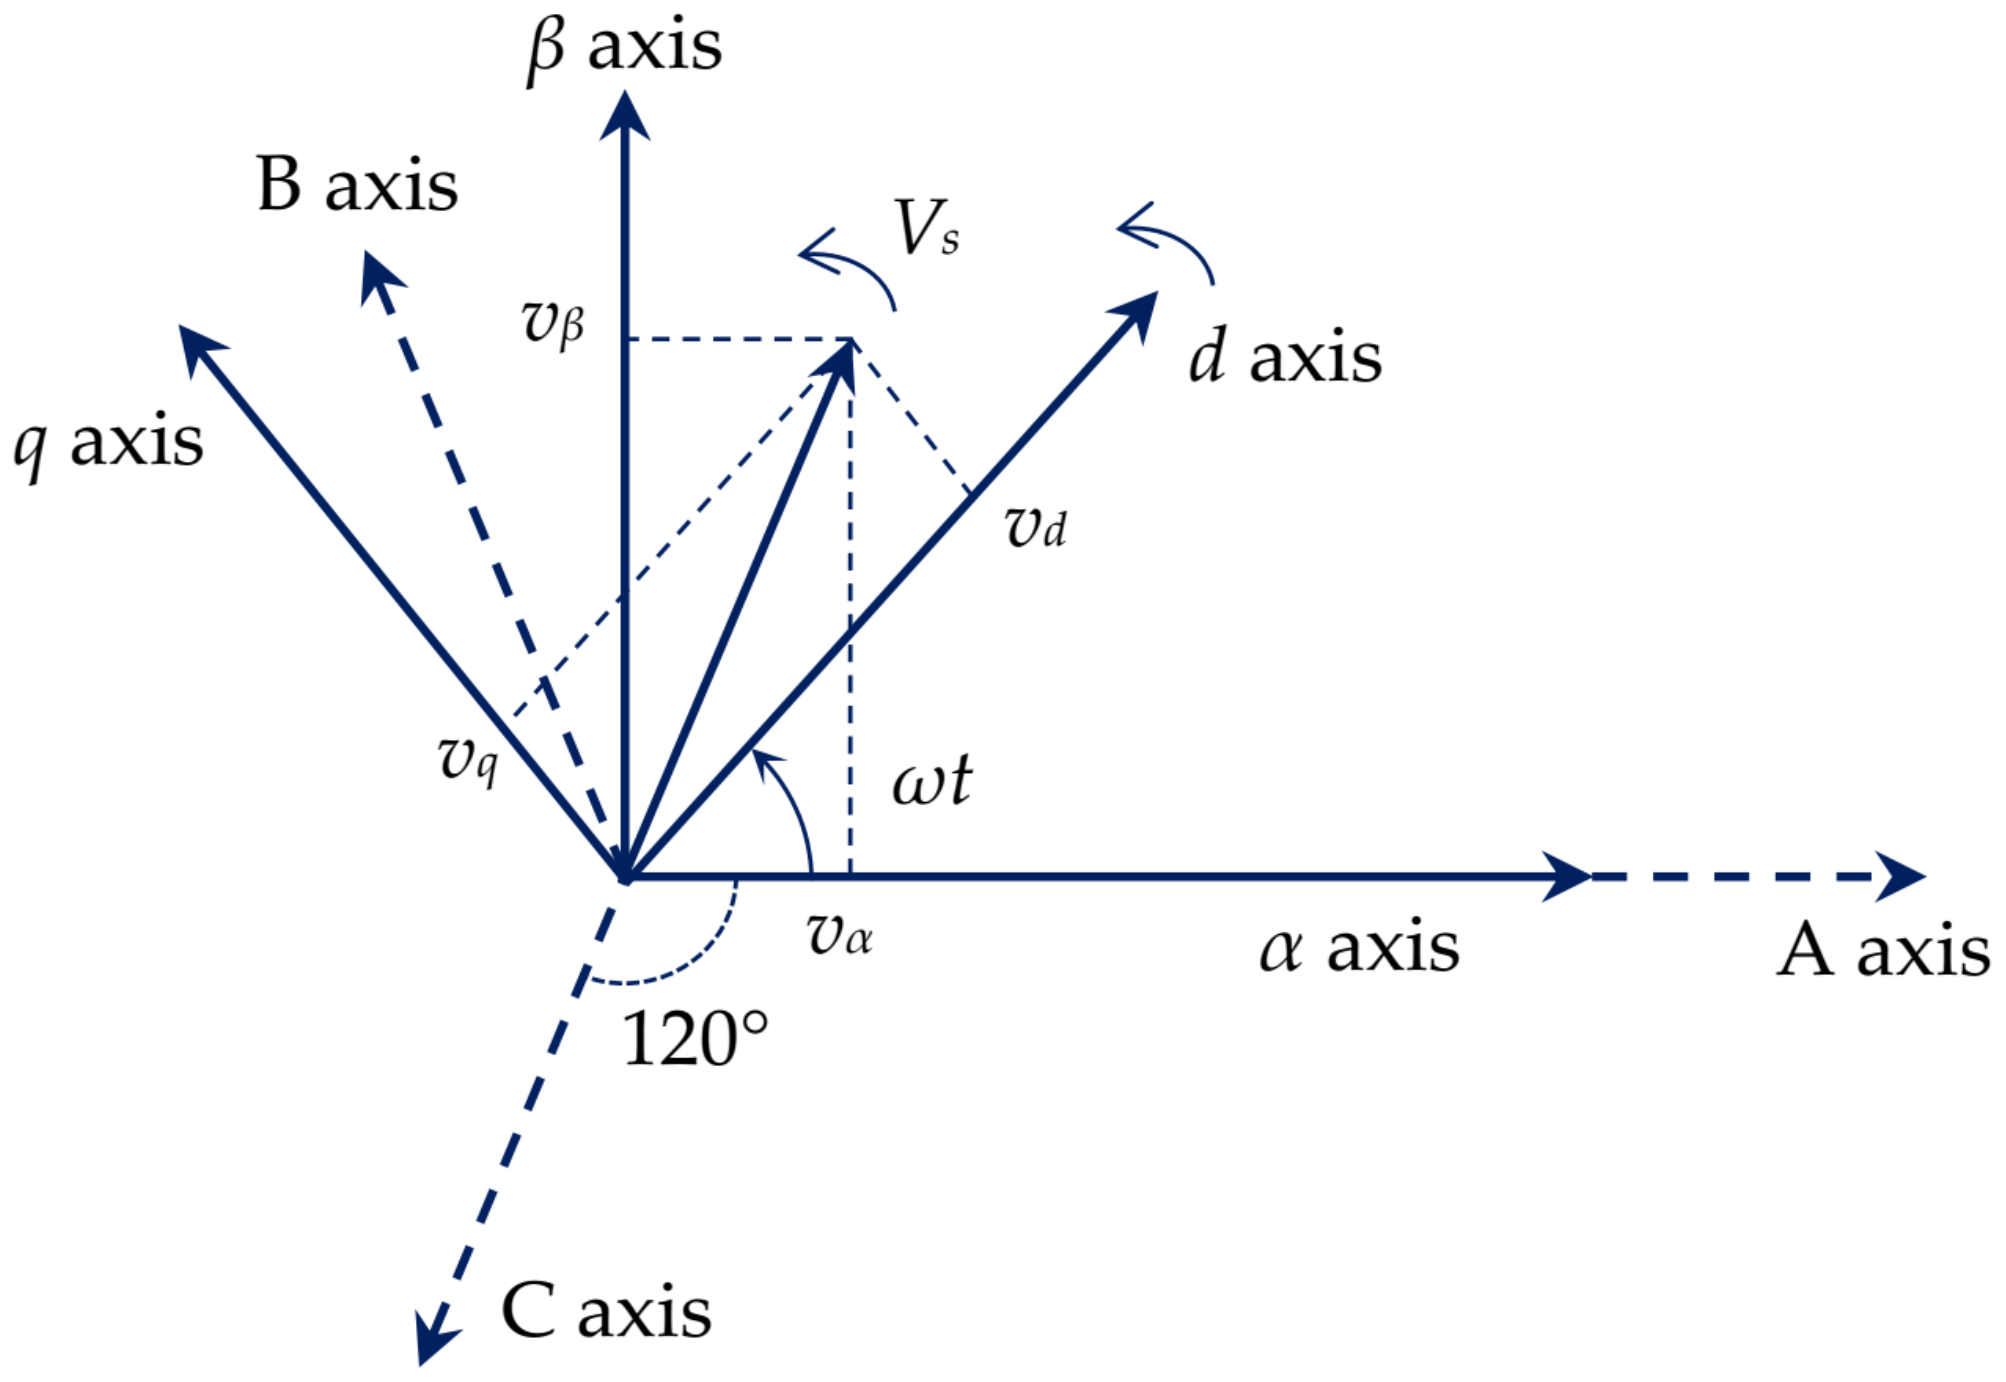
The conventional Park transformation is applied for control where the rotating frame is aligned 90° behind the A axis, as shown in
Figure 7. In other words, at
t = 0, the
q-axis is aligned with the A-axis. The transformation is described in the following.
In
Figure 7, 3-phase A, B, C voltage vectors in abc reference frame are transformed into the
d-q-0 stationary reference frame system. The A, B and C represent three-phase voltage vectors where each voltage vector is electrically shifted by 120°. The abc-to-dq0 transformation depends on the
d-q frame alignment at
t = 0. The angular position of the rotating frame is presented by
ωt.
5. Description of the Proposed System with Simulation Setup
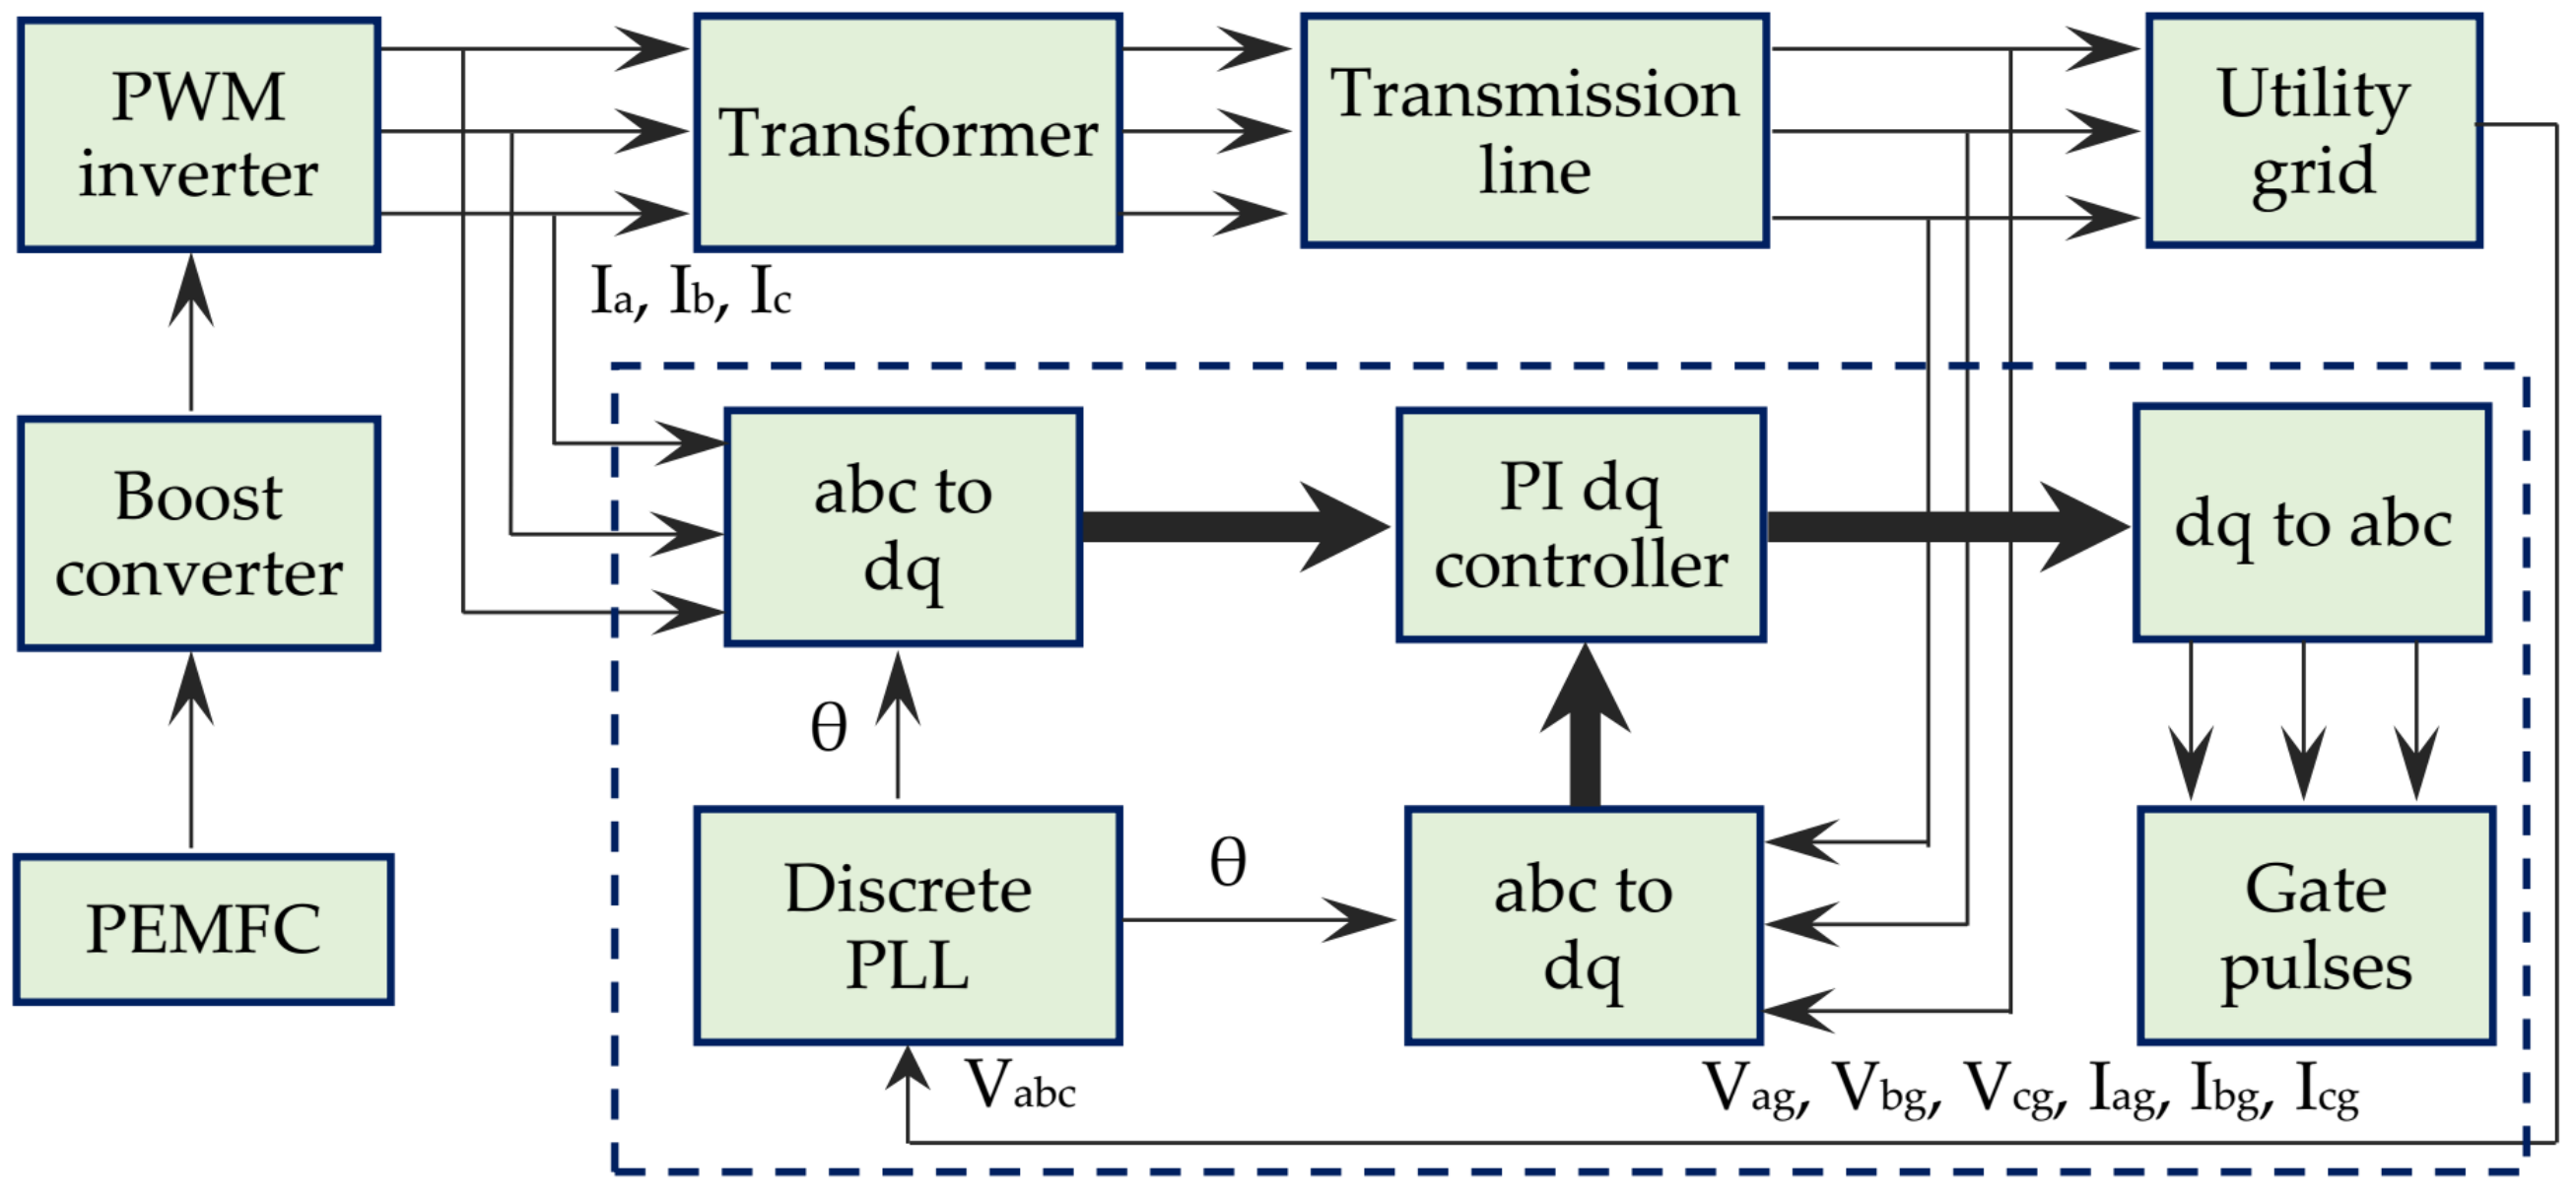
In this section, the functional block diagram of the complete PEMFC based power generation system is described with the simulation setup. In
Figure 8, PEMFC was a proton exchange membrane fuel cell stack, which produced unregulated dc power. A boost converter raised the voltage level and supplies dc power to the PWM inverter. The inverter produced three phase-controlled ac power. A step-up transformer was used to step up the voltage, as required by the utility grid. The connection between transformer and grid is shown in
Figure 8, where the dotted area presents the control block of the system. Load current and voltage were measured first. Then, by utilizing the Parks transformation, the abc-to-dq frame was determined. A three-phase discrete phase locked loop (PLL) was used to find the required phase angle (
θ) of the grid voltage and synchronises the inverter’s output voltage with the grid voltage. Because the 60 Hz voltage frequency of the inverter and grid needed to be synchronised with maintaining
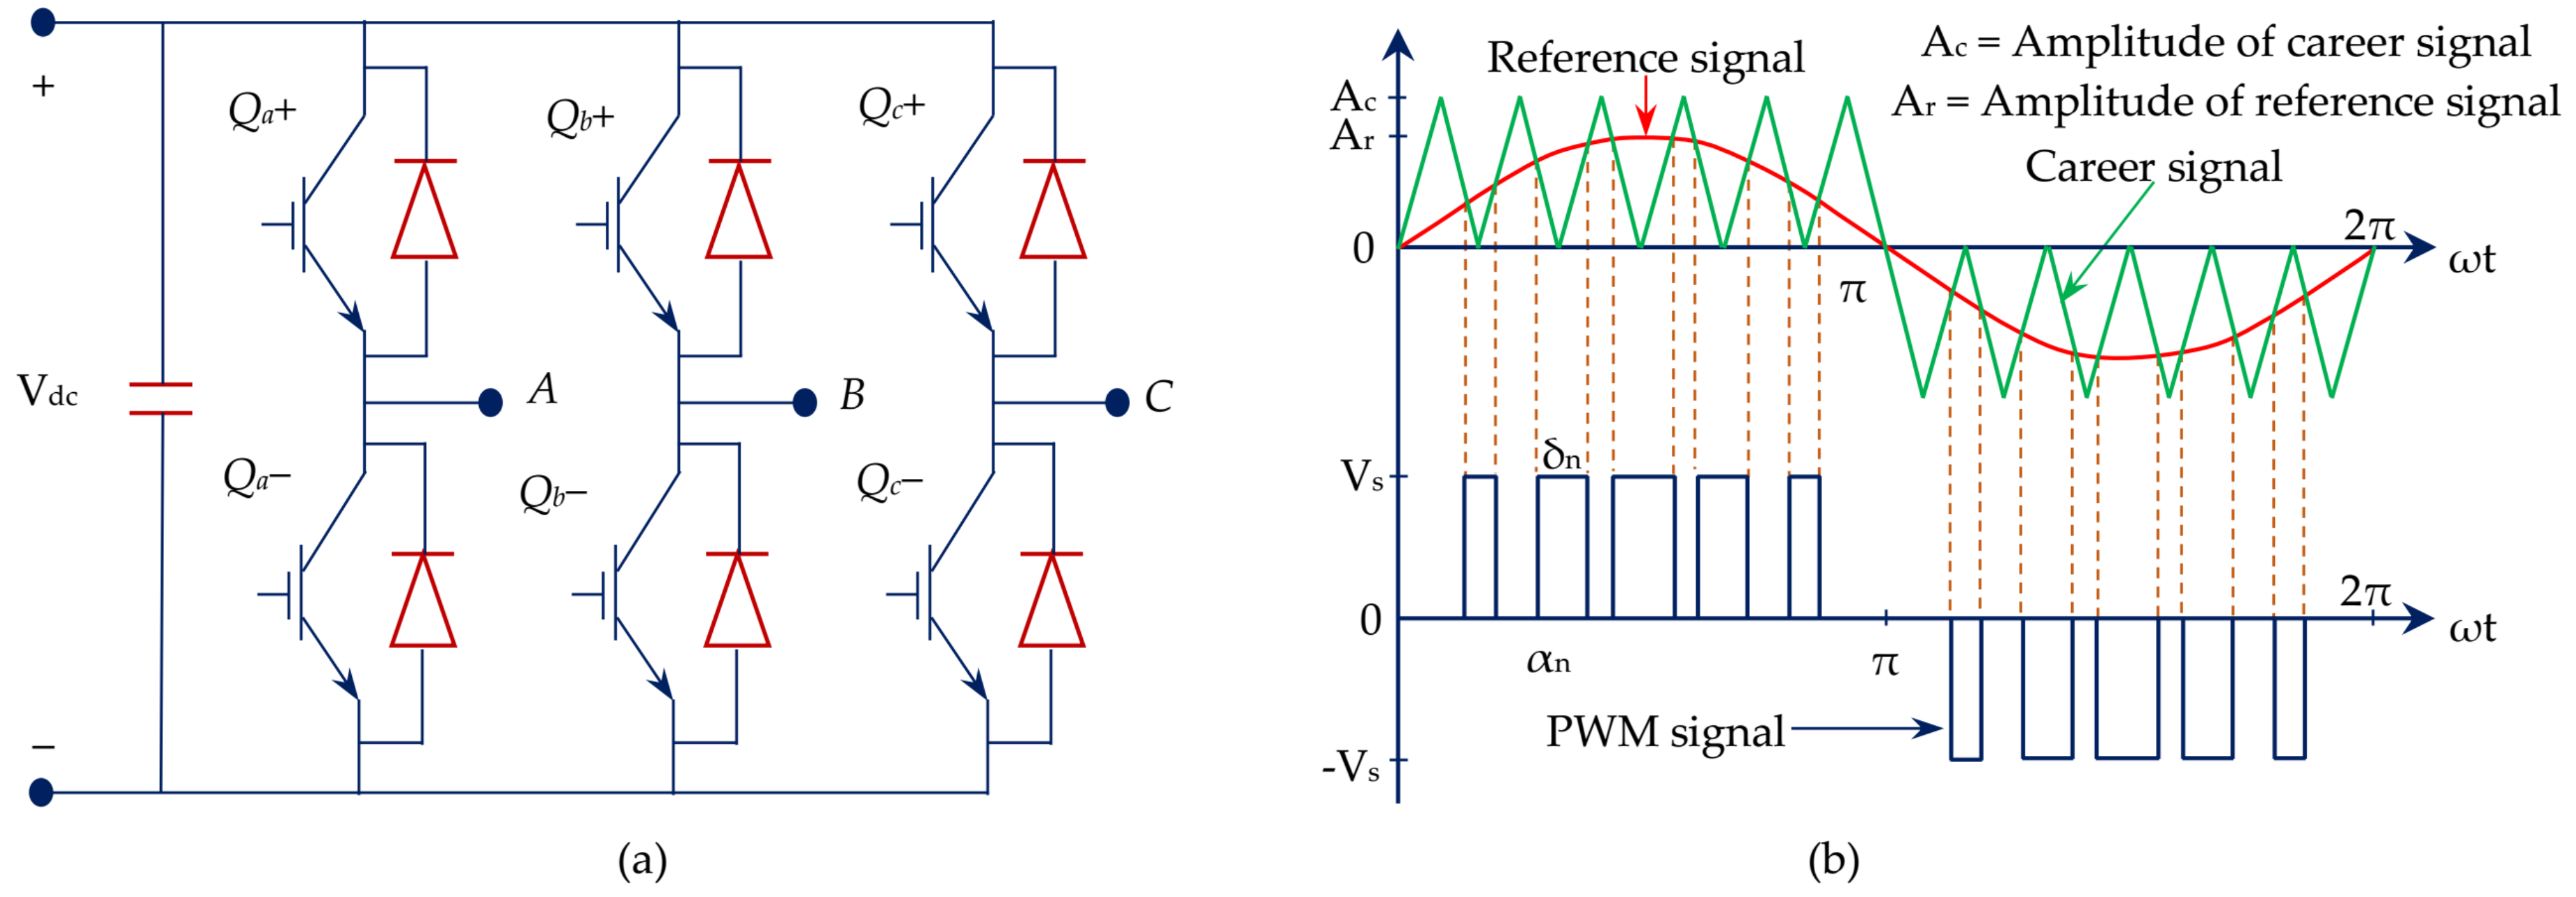
θ, the PI controller was applied to produce the necessary gate pulses. An elaborate model of gate pulse is discussed in
Figure 4a. The transformation, abc-to-dq axis worked like a reference signal of PI controller and measured the phase angle with the transmission line.
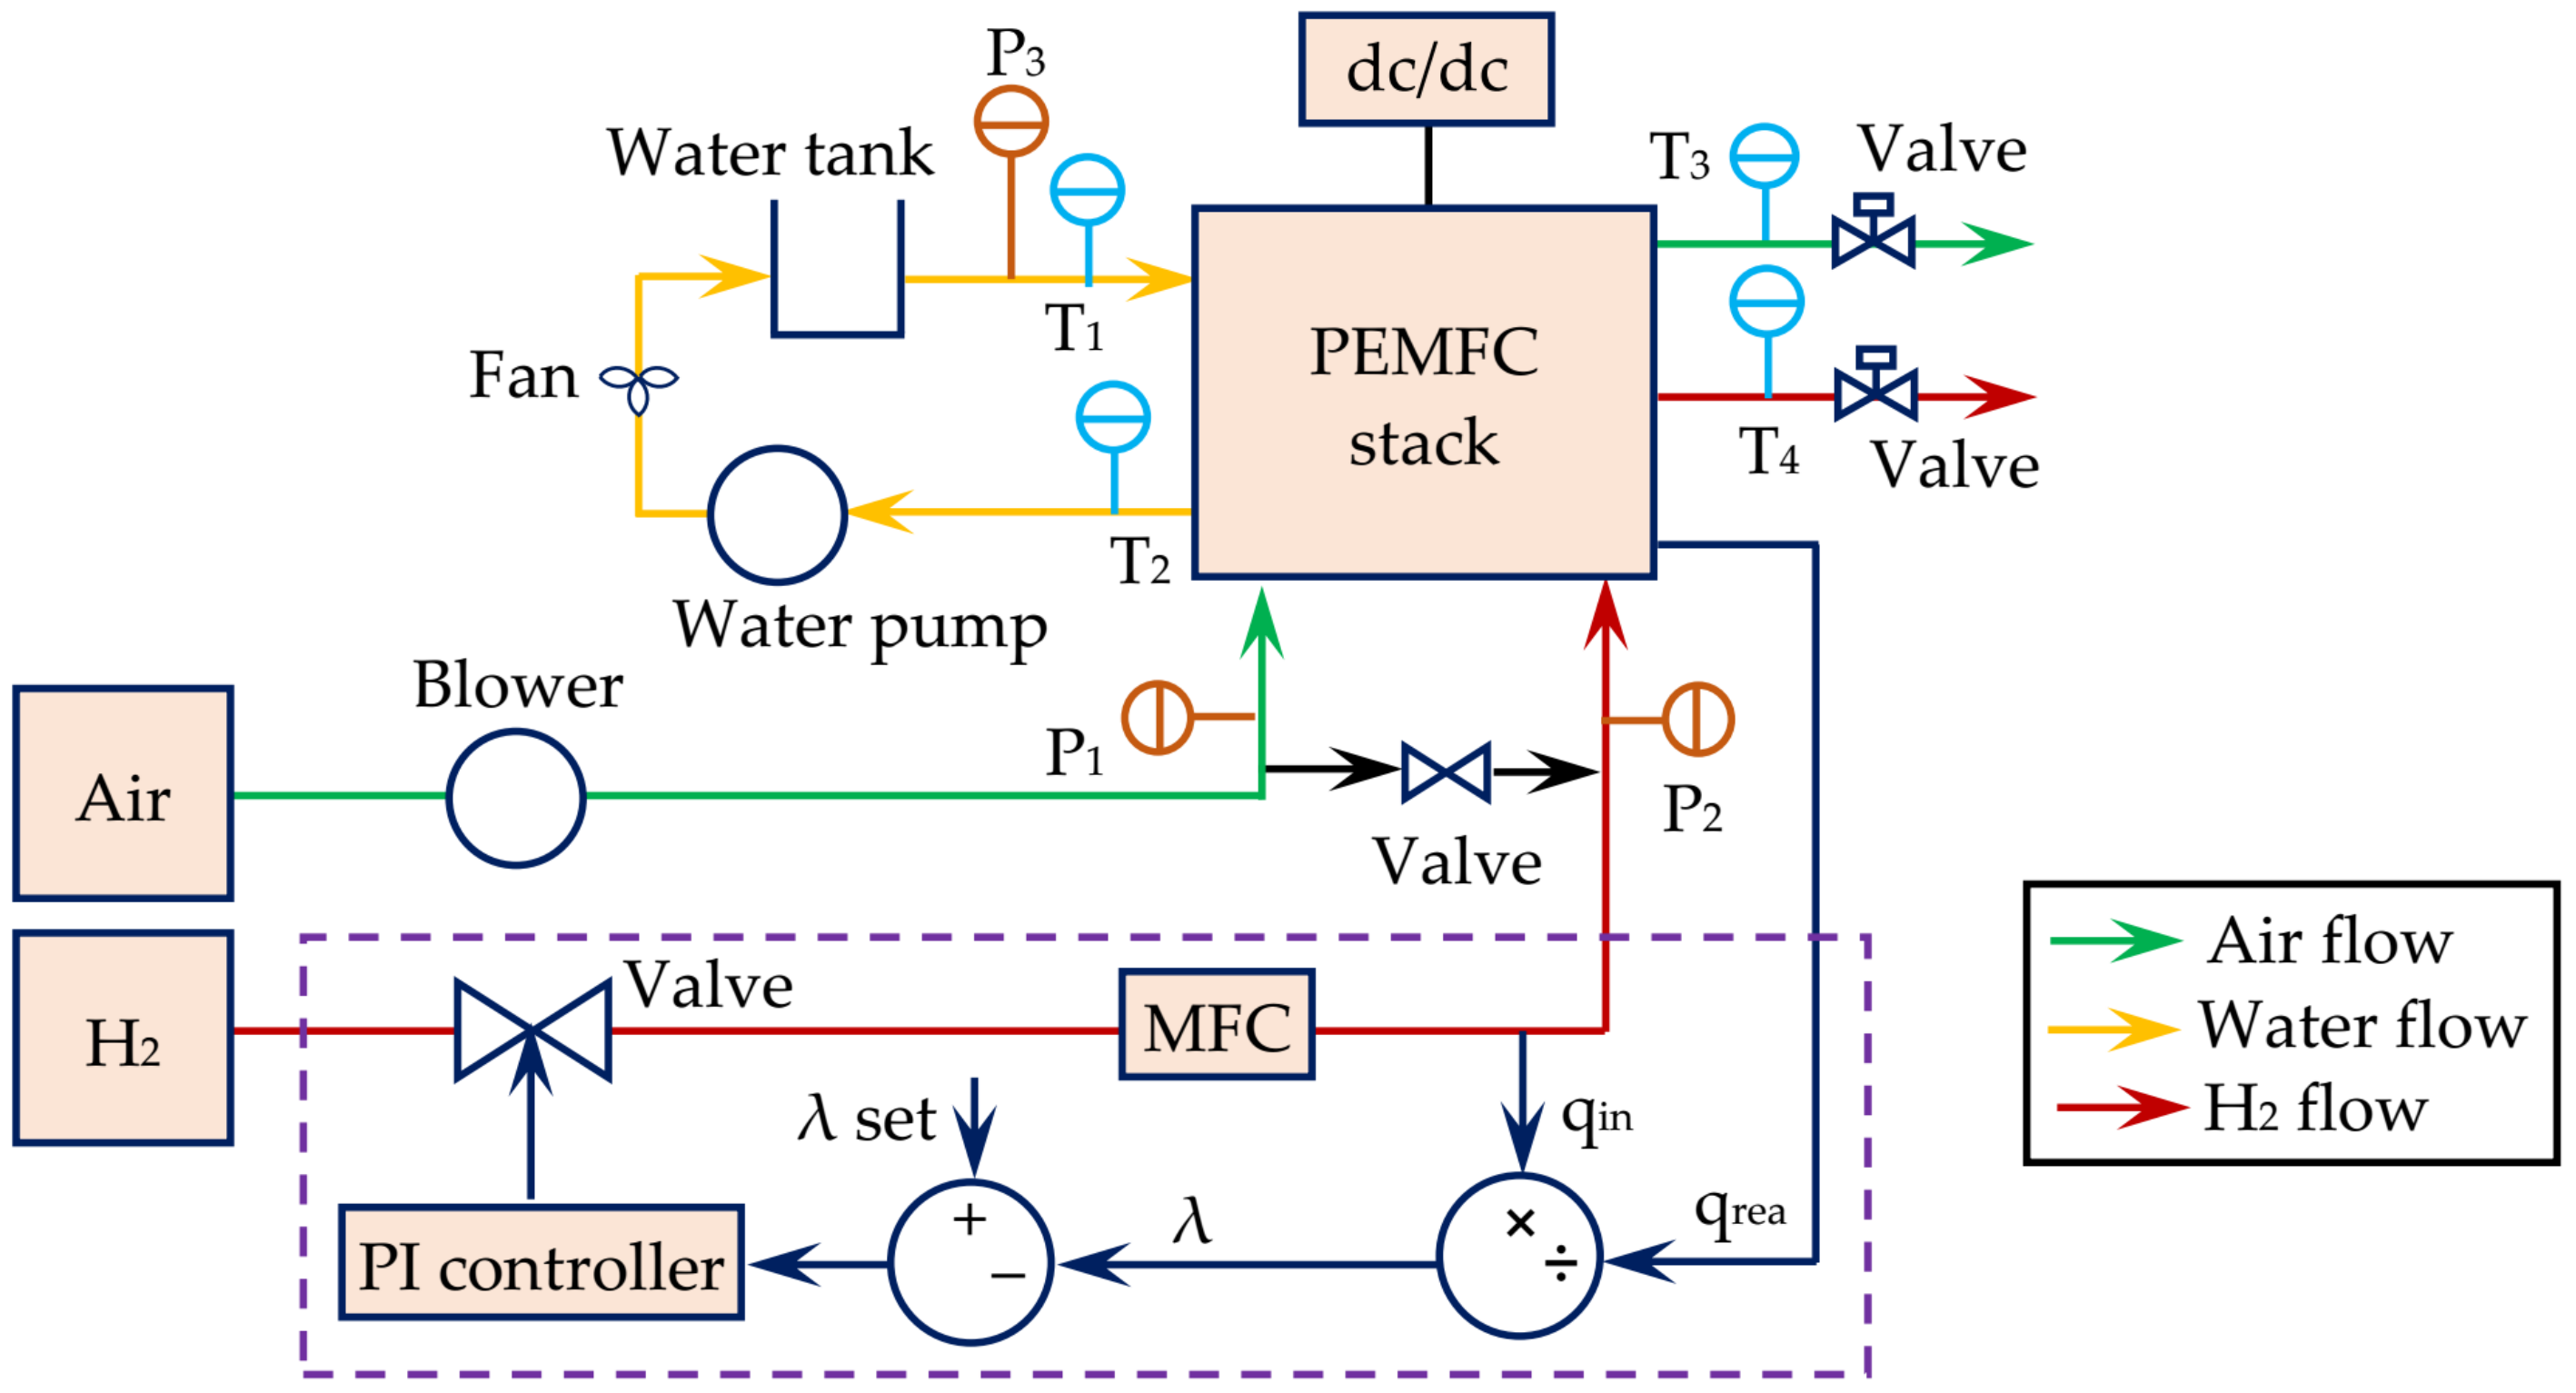
In
Figure 9, a PEMFC system is shown with fuel cell stack, dc-dc converter, gas flow model, water pump, etc. Hydrogen gas flowed through a mass flow controller (MFC), which controlled the flow of hydrogen. At the same time, air was pumped into the cathode chamber with a blower. Then, the fuel cell stack provided dc power through an electrochemical reaction. A mechanical valve was used to drain the remaining gas. To keep the proper temperature inside the stack, water cooling system was used. Since PEMFC had a chamber with thin layers, high pressure can damage the stack. Therefore, it was important to monitor and regulate the pressure difference between anode and cathode chamber. Two valves were used at the back end of the gas pipe to regulate air and fuel pressures. P
1, P
2, P
3 and P
4 were the pressure sensor which measured flow pressure whereas, temperature measurement was performed with temperature sensors T
1, T
2, T
3 and T
4. The dotted area presents the fuel flow control structure, which marks the output of the PEMFC stack. It prevented fuel starvation at the time of load changing. Therefore, the stoichiometric ratio,
λ can be expressed as the ratio of
qin and
qrea where
qin was calculated from the feedback signal of MFC, and the load current was used to figure out
qrea [
33]. The PI controller was used to control the output of MFC.
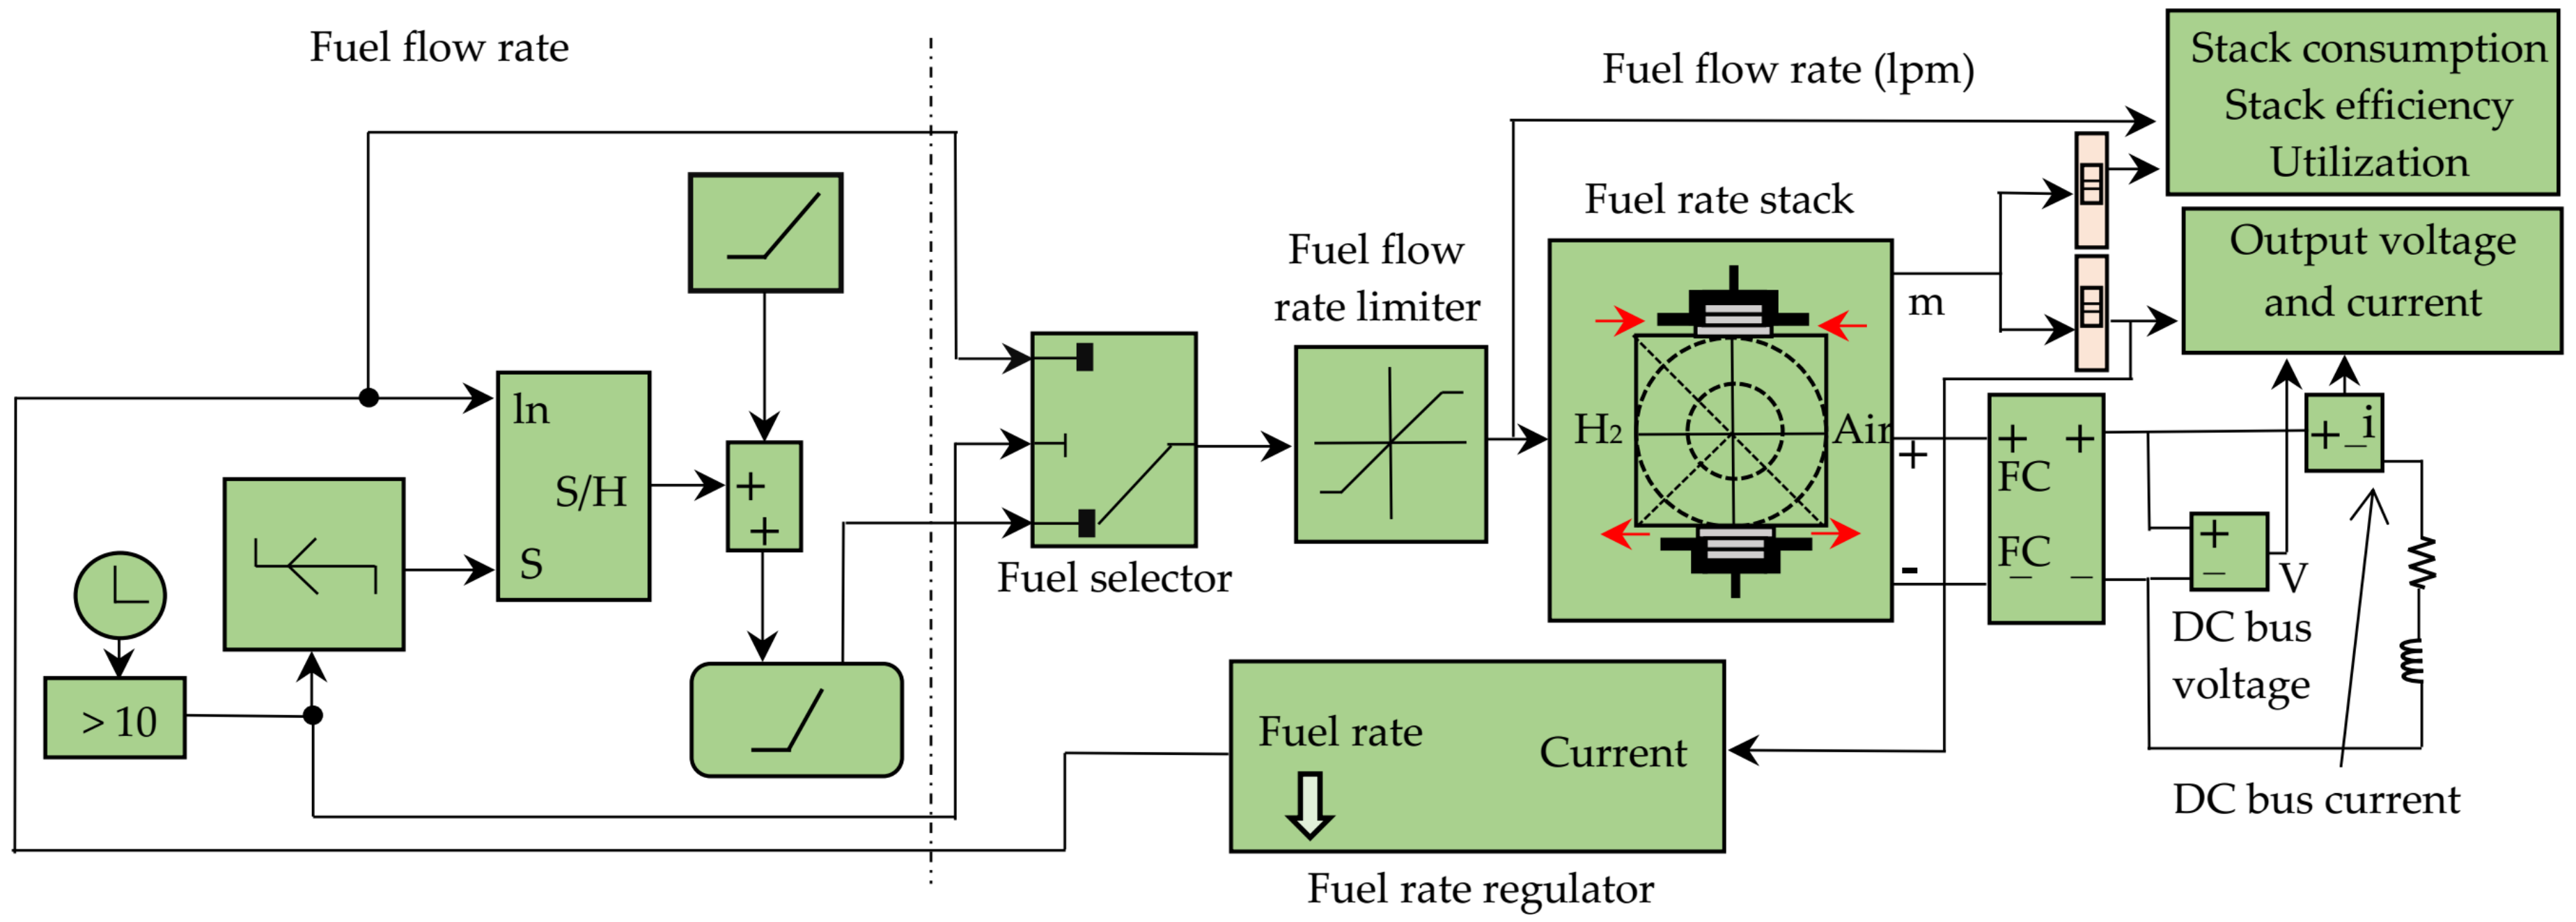
In the simulation setup, the connection between the PEMFC and the controller is illustrated in
Figure 10. The fuel cell stack was the combination of 45 fuel cells, which were connected in series. In this system, fuel flow depended on the amount of current, while the relationship between fuel flow and current was proportional. The current sensor was used to calculate the amount of fuel required by the system in accordance with the current value. On the left side of
Figure 10, an elaborated model of a fuel flow rate is shown. Fuel flow rate allowed a specific amount of fuel to flow where the unit was liter per minute (L/min or Lpm). The primary function of the fuel selector was to interface with the appropriate switch as per the required action. There were three switches in the fuel selector block. The fuel flow limiter interrupted the fuel flow during an excessive flow, and it allowed only the permissible amount of fuel to flow through it.
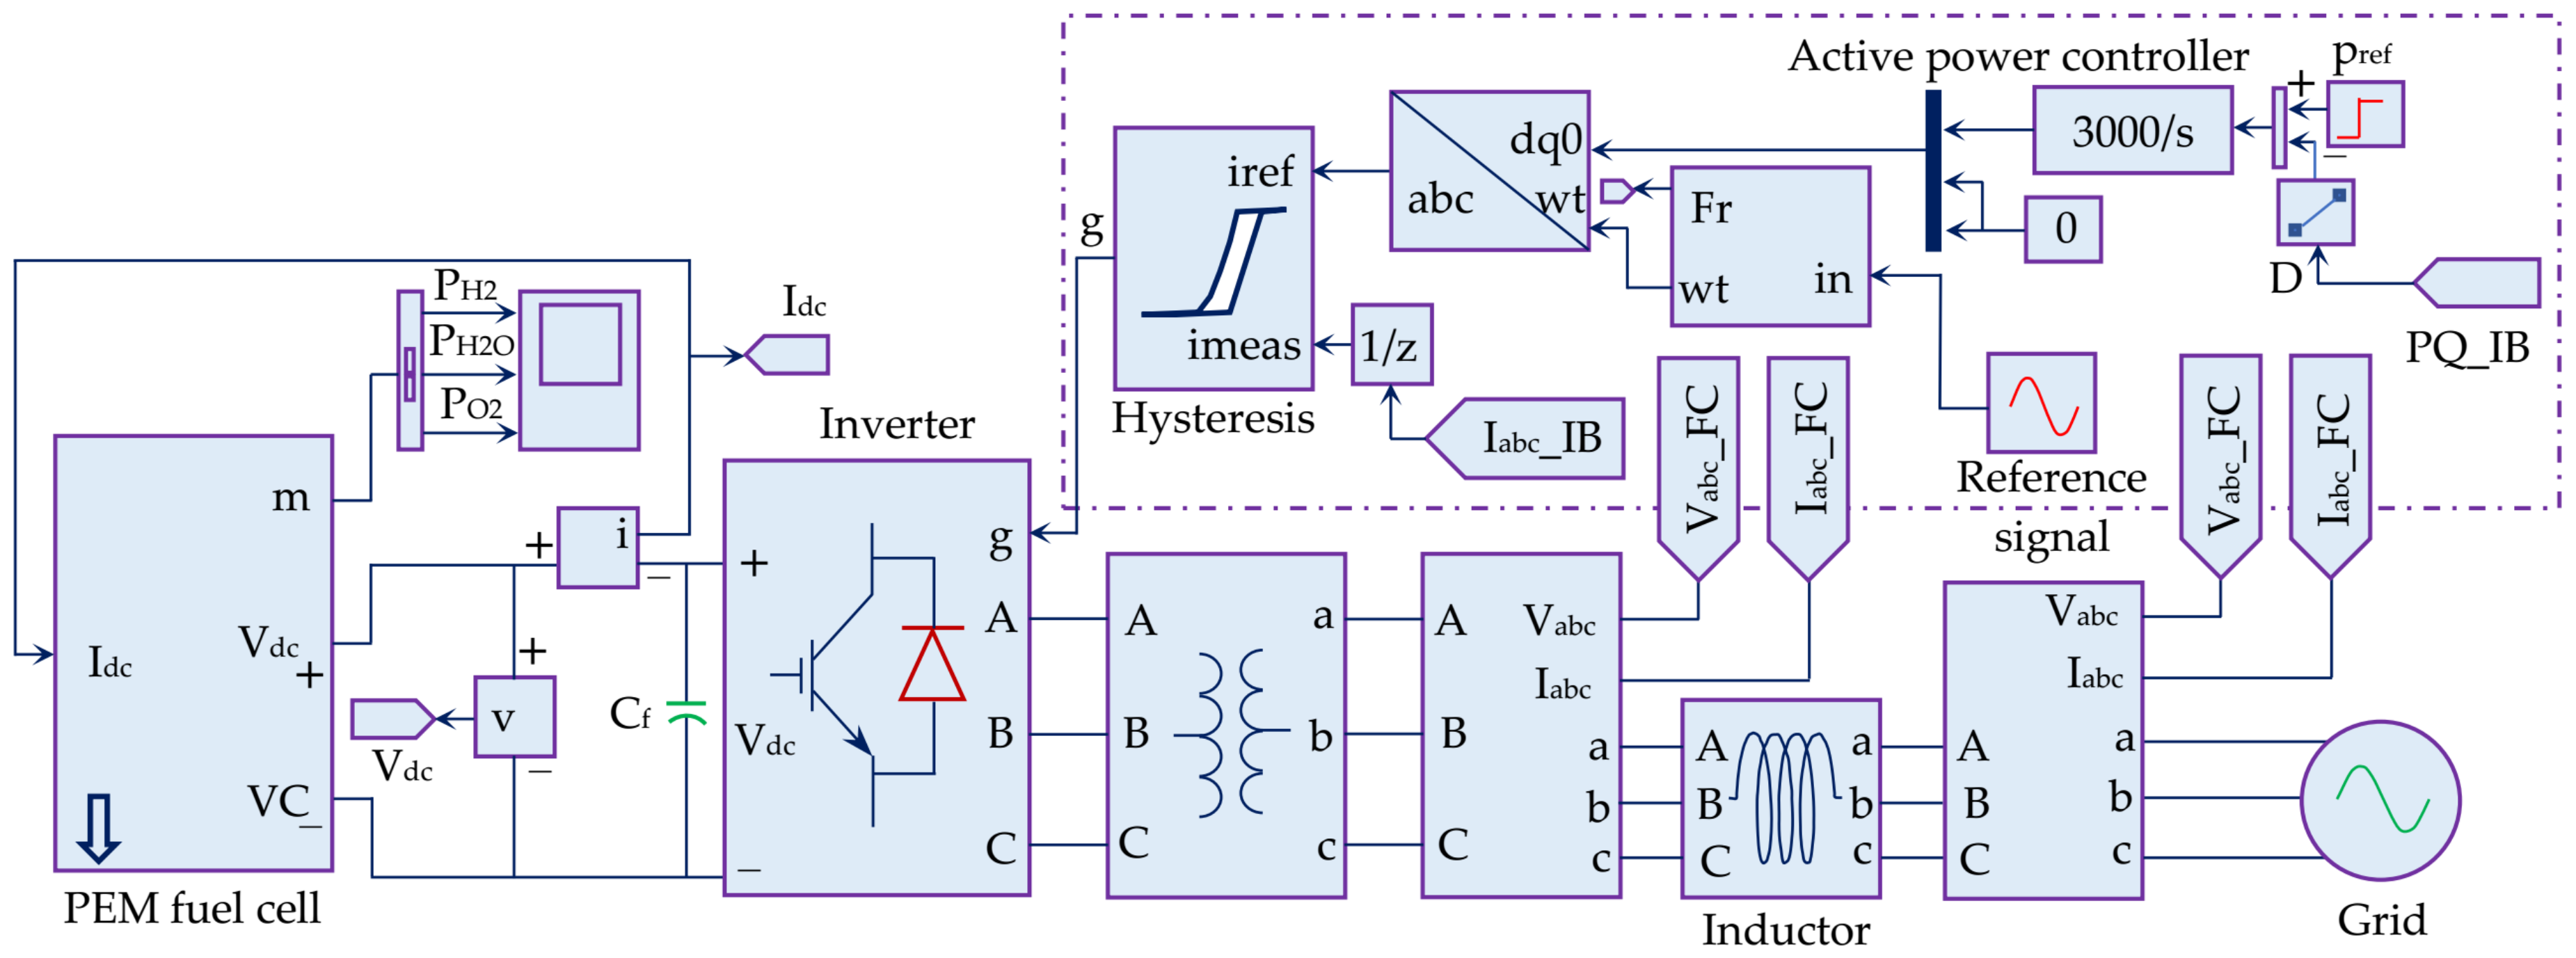
The system is described with a comprehensive model in
Figure 11, where electrical power was generated by using the PEMFC and supplied to the local grid. A 3-phase full-bridge inverter was applied in the system, which converted dc-link voltage
Vdc into three-phase ac voltages. Three-phase output connections of the inverter with the proposed system at
A,
B and
C are illustrated as well. The generated power was then transferred to the grid with the aid of a step-up transformer because the semiconductor switches of the bridge inverter were a challenge when operated at high voltage. Another reason for using the transformer was the electrical isolation for safety. A multiplexer (1:3) was connected to the measurement point ‘m’ of the PEMFC block. The supply of hydrogen, water and oxygen were measured with the 1:3 multiplexer. A dc voltmeter and ammeter were used to measure the voltage and current for dc power calculation. C
f was the filter capacitor, which reduced the noise produced by the fuel cell. It also stabilised the dc link voltage
Vdc. An inductor between the transformer and the grid represents the line inductance of the short transmission line. The dotted area represents the control block of the whole system.
6. Simulation Results
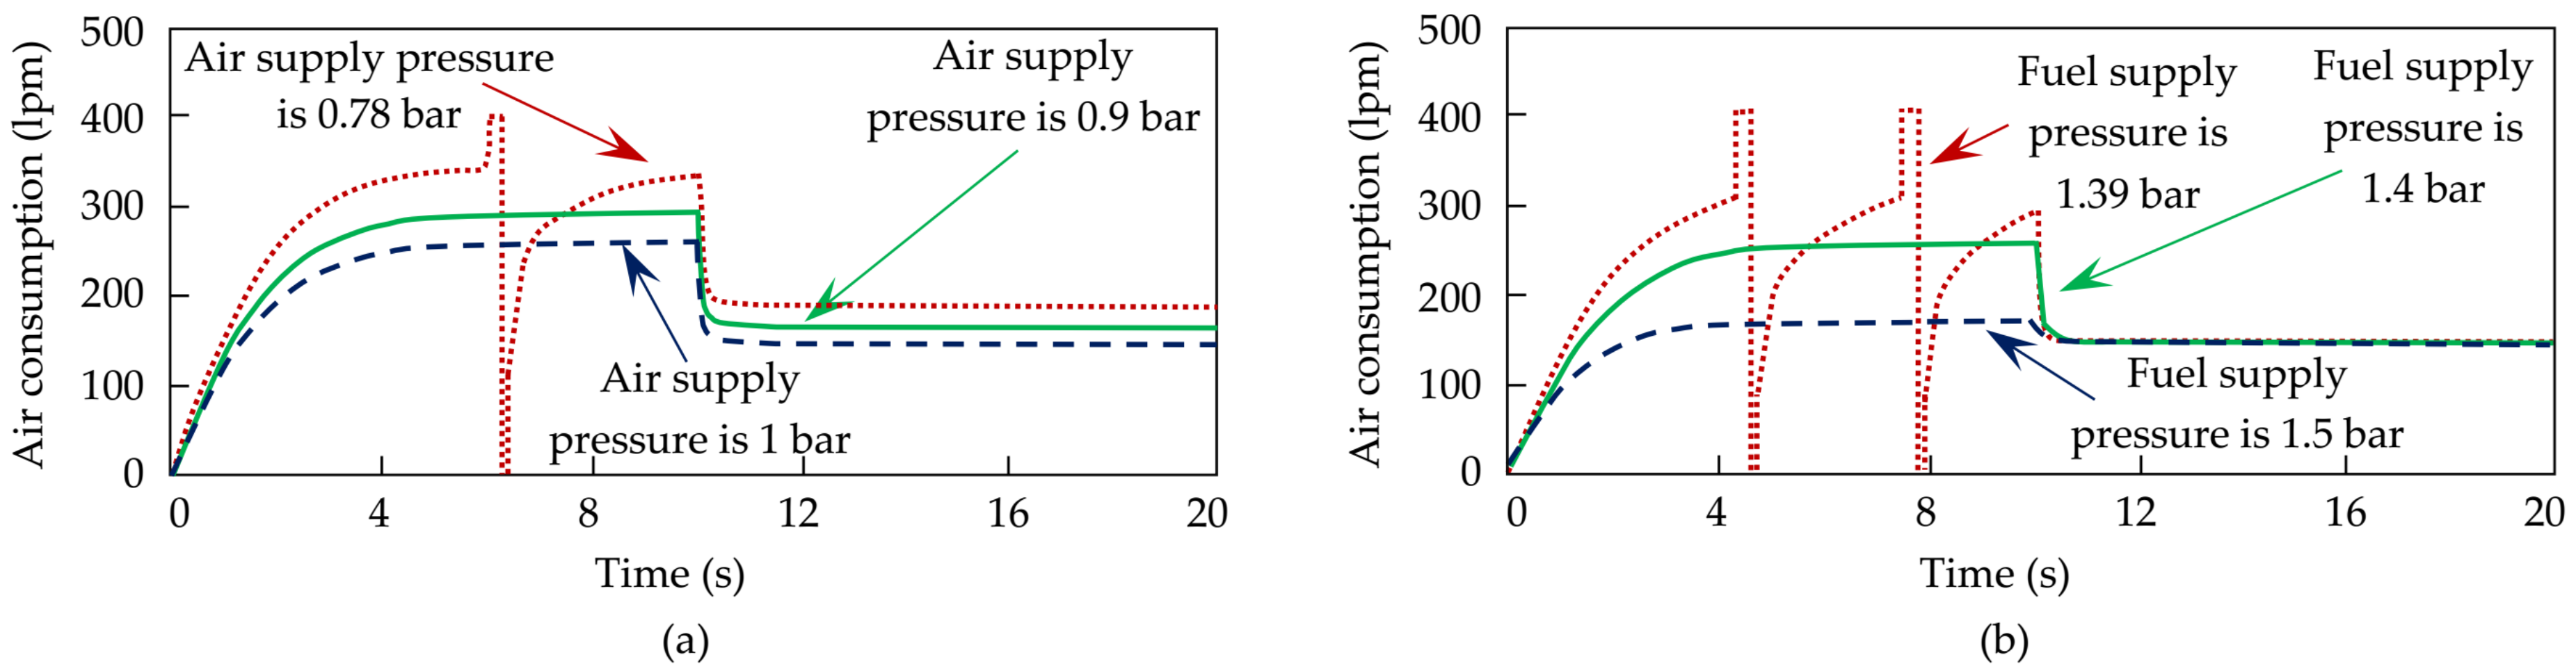
The analysed response time of the PEMFC was 10 s. The pressure of fuel supply was held constant at 1.4 bar initially while the pressure of air supply was varied. The performance remained smooth for air supply pressures between 0.8 to 1 bar, and variations within this range had no noticeable impact on the system. On the other hand, distortion began with the supply of air below 0.8 bar. Three different values of air supply pressure are shown in
Figure 12a for air consumption. No significant distortion at 0.9 bar and 1 bar was observed, but the output was obviously distorted at 0.78 bar. The simulation results showed that the distortion was inversely proportional to the value of air supply pressure.
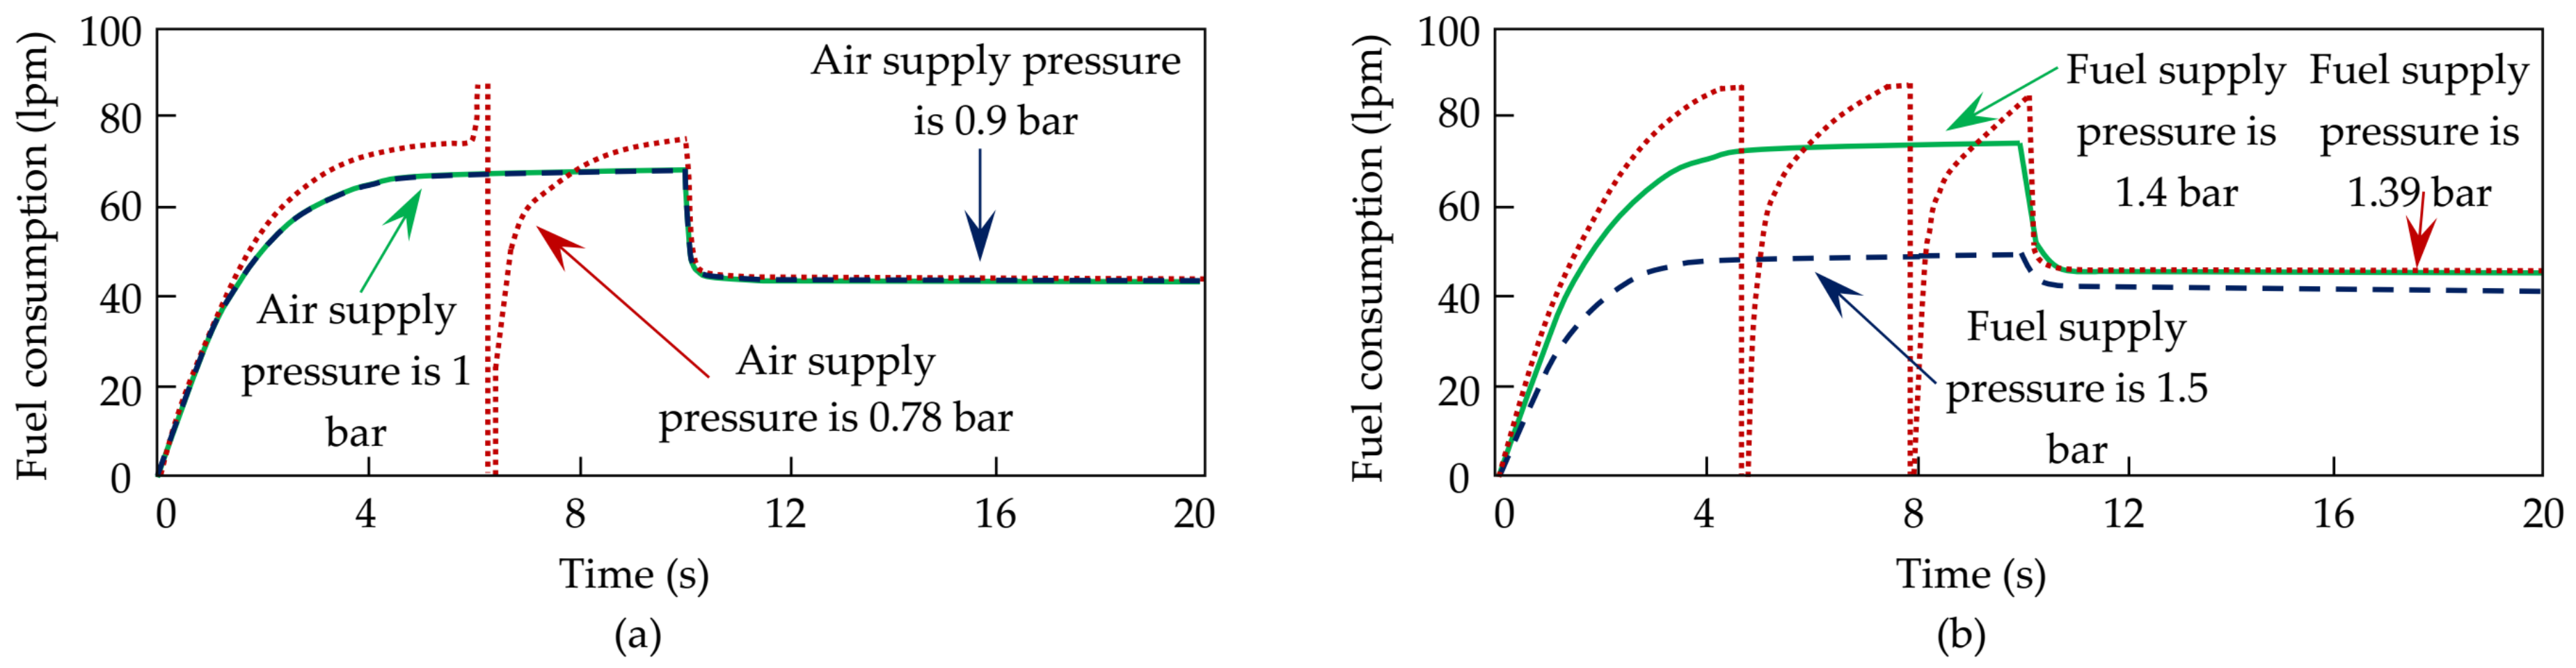
To observe the effect on fuel consumption and system performance, the air supply pressure was varied between 0.78 to 1 bar, and the results are shown in
Figure 13a and
Figure 14a. From
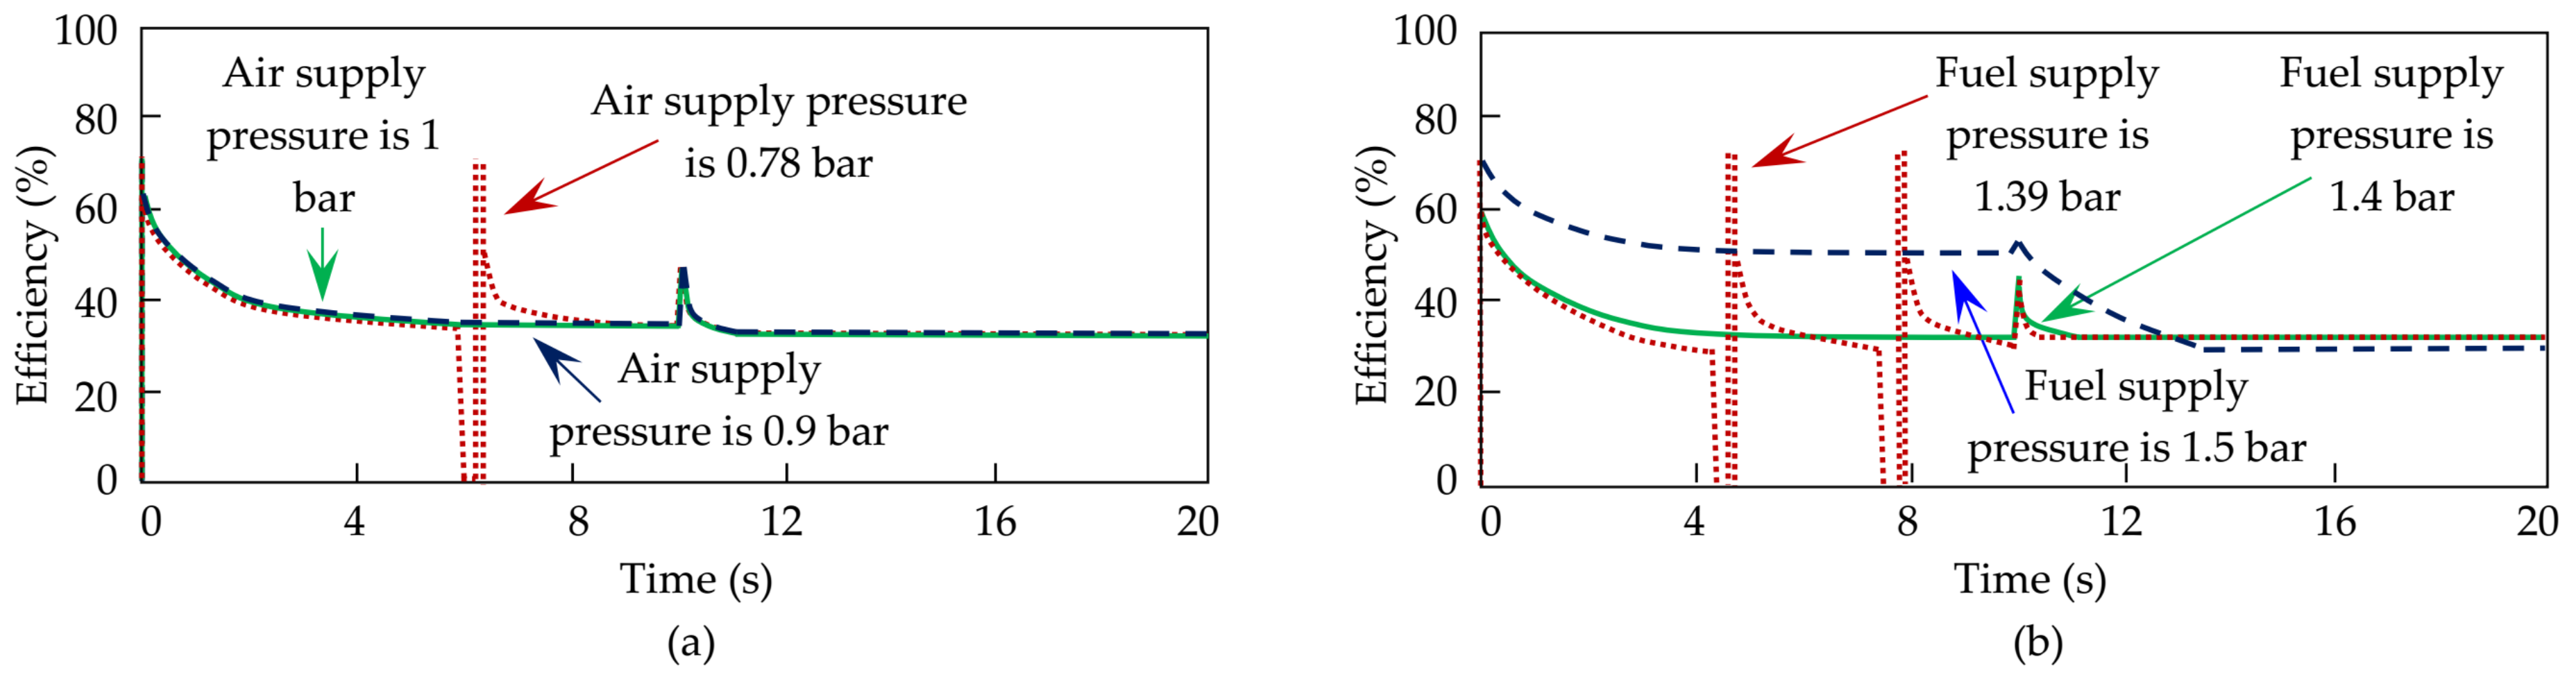
Figure 13a, it was found that these changes in air pressure did not have a remarkable impact on fuel consumption. Air supply pressure had an impact on the efficiency performance of the device, as shown in
Figure 14a. Beyond the critical value, the device became unstable. Therefore, it can be said that the minimum optimal value for air supply pressure is 0.8 bar for a constant fuel supply pressure.
In
Figure 12b, air consumption of the PEMFC for a constant air supply pressure of 1 bar with different fuel supply pressures is shown. It was observed that the system remained stable between 1.4 to 1.5 bars of fuel pressure, but the system became unstable when the fuel pressure was below 1.4. The fuel supply pressure, unlike the air supply pressure, had an impact on both the system’s fuel consumption and efficiency performance. These simulation outcomes are shown in
Figure 13b and
Figure 14b, respectively. From the plotted graphs, it was found that the outputs were distorted when fuel pressure was below 1.4 bar, and the system became unstable. According to the simulation results, when the air supply pressure was set to 1 bar, the optimum value of the fuel supply pressure was 1.4 bar.
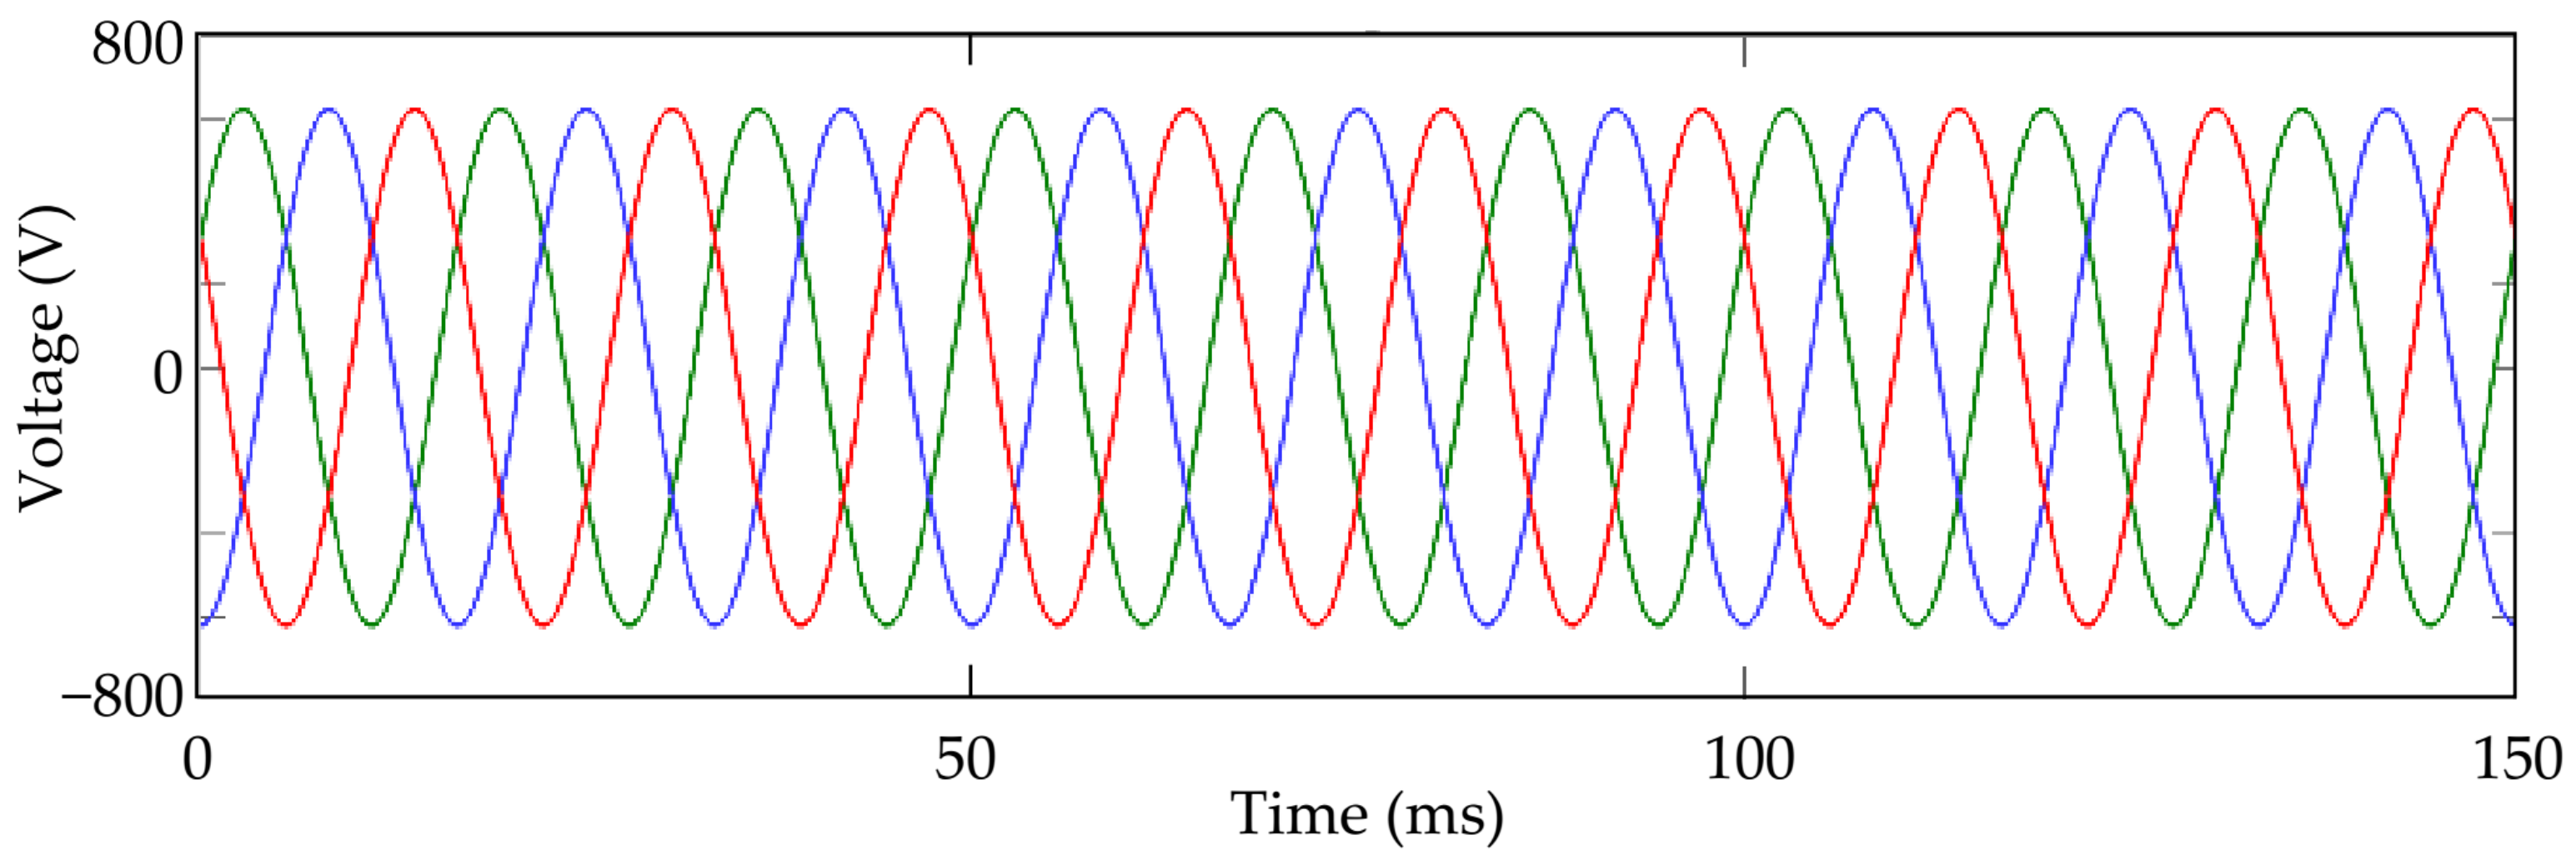
According to the simulation results, it is recommended that fuel and air supply pressures must be maintained above the respective critical points. Otherwise, the required consumption rate of fuel and the efficiency outcome would be quite unpredictable. The PEMFC was connected to a 60 Hz three-phase local grid via a full bridge IGBT inverter.
Figure 15 shows 3-phase voltage waveforms of the transformer’s secondary winding. The transformer used in the system had two functions. One was to step up the supplied ac voltage, and the other was for isolation purposes. The inverter only converted dc power, which was generated from the PEMFC, into ac power where the voltage rating was 60 V.
The turns ratio of the transformer was 1:12 so that it could step up the output ac voltage of the inverter to 480 V. This design supported the supply of ac power to the local grid successfully. Voltage waveforms were adequately smooth because of applying the correct, current control method, as shown in
Figure 11. As shown in
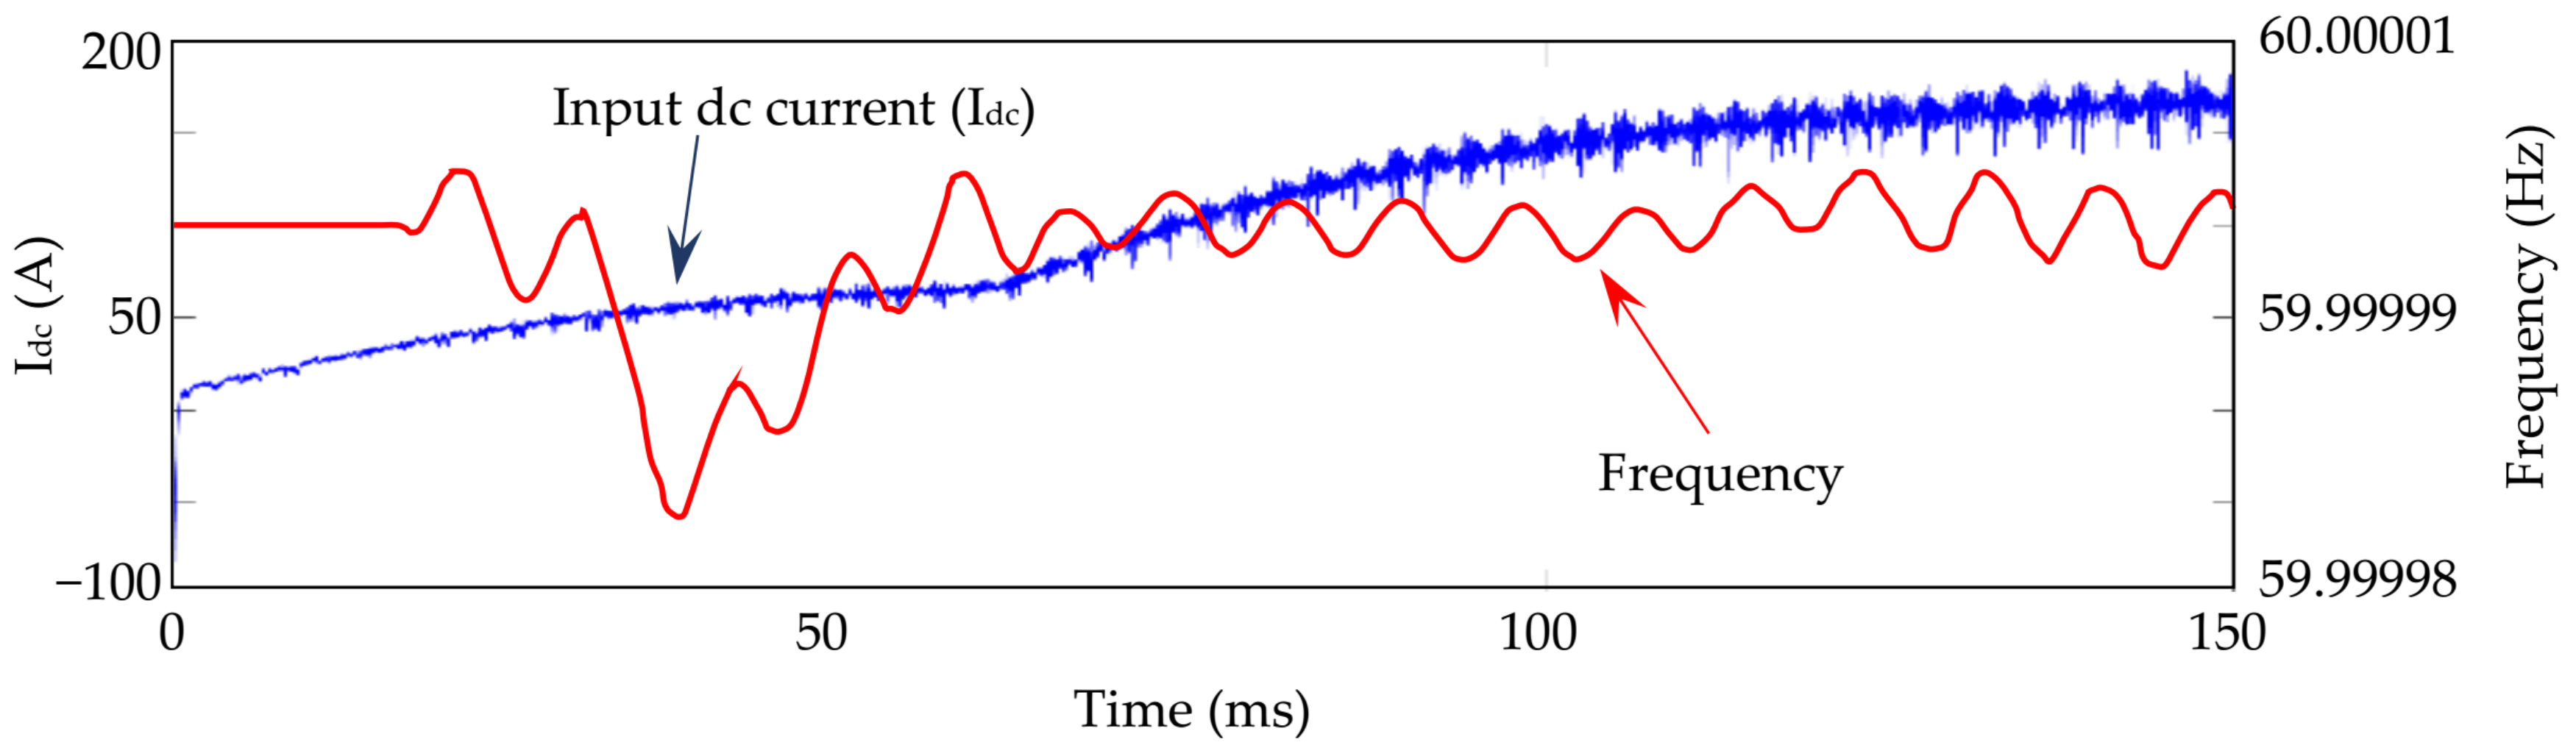
Figure 16, the current flow was controlled by a PI controller. For this reason, the instantaneous value of the current waveform was always changing because of the feedback circuit. The proposed controller took an interval of a few cycles to reach the steady-state condition. This was due to the action of the rate limiter with an appropriate PI gain that prevented the feedback system from becoming unstable. The voltage frequency of the proposed system was maintained at 60 Hz with a limited tolerance, as plotted in
Figure 17. The input dc voltage of the inverter was controlled by a dc current controller (
Figure 17) so that the common dc link voltage could be maintained. The overshoot and damping were controlled by applying appropriate gains of the feedback system.
Hysteresis switching was applied to the power inverter that further regulated the active power by controlling the current of the
d-axis while retaining the reactive power at zero. Thus, the proposed system is able to control all necessary parameters that support the PEMFC to supply electrical power to the grid. Electrical parameters of the PEMFC are summarised in
Table 1, while the other physical parameters are tabulated in
Table 2.
The analysis is divided into two portions. The first portion covers the characterisation analysis of the proton exchange membrane fuel cell at around critical pressure. It was observed that the abnormal fluctuation started after a few seconds. On the other hand, the voltage frequency of the system was 60 Hz. For this reason, one cycle required only around 16.667 ms. In these circumstances, if the simulation ran for a few seconds, it was challenging to observe the nature of electrical parameters. Simulation results/intervals were wide for the behavioral analysis of the fuel cell and narrow for the electrical parameter plots. Therefore, the simulation time was set differently so that the individual effects could be analysed. The amount of fuel supplied to the fuel cell (PEMFC) depended on fuel pressure. The low fuel pressure indicated a low amount of fuel supplied to the fuel cell. The dc power of the fuel cell was proportional to the amount of fuel supply, which was also proportional to the fuel pressure. Therefore, there was a minimum amount of fuel required to supply, which was found 1.4 bar for the proposed system. The atmospheric pressure/natural pressure of air was 1 bar. The system which was considered in the manuscript did not consist of any compressor or such type of arrangement by which air pressure could be increased. For this reason, the analysis of overpressure air was not investigated. On the other hand, the fuel pressure was controlled with a mechanical valve connected to the PI controller. The controller maintained the necessary fuel pressure, which ranged from 1.4–1.5 bar for the system.

 ,
, 


