Article

A Policy Effect Analysis of China’s Energy Storage Development Based on a Multi-Agent Evolutionary Game Model

Business School, University of Shanghai for Science and Technology, Shanghai 200093, China
*
Author to whom correspondence should be addressed.
Energies 2020, 13(23), 6293; https://doi.org/10.3390/en13236293
Submission received: 18 October 2020 / Revised: 15 November 2020 / Accepted: 26 November 2020 / Published: 29 November 2020
(This article belongs to the Special Issue Accelerating Renewable Energy Transition Post Major World Events)

Abstract

:
Energy storage technology plays a significant role in the pursuit of the high-quality development of the electricity market. Many regions in China have issued policies and regulations of different intensities for promoting the popularization of the energy storage industry. Based on a variety of initial conditions of different regions, this paper explores the evolutionary process of electricity market players considering energy storage technology. The trilateral evolutionary game model is adopted to analyze the strategies of the power plant, the power grid, and the government. After assigning the model according to an actual situation, each equilibrium point corresponds to a real electricity market situation. The results indicate the following: (1) In the process of stabilizing, the role of “Advanced Imitators” leading the strategy of building energy storage changes between the power plant and the power grid. (2) In Eastern, Middle, and Southern China, the power plants and power grids on a greater-than-medium scale will choose to build energy storage without governmental regulations, due to the abundant net profit. (3) In the northeast of China, power plants with a medium-or-lower scale will choose not to build energy storage because of the relatively low on-grid price, and small power grids can make enough profits by operating energy storage facilities. (4) In Northern China, the large power plants and the medium power grids will choose to build energy storage due to the high electricity sale price and the resulting high profit. (5) In Western China, the small power plants and power grids cannot afford to build energy storage due to the low electricity price. The results lead to valuable policy suggestions for the local governments of China in promoting energy storage in the future. To meet the goal of energy storage popularization, regional electricity market plans need relevant policies based on its existing conditions, offering suitable external conditions for adding energy storage.

1. Introduction

The global power sector is set to be fully decarbonized by 2050 according to the Paris Agreement reached in 2015 [1]. To achieve the goal of decarbonization, the clean energy industry has made considerable progress [2,3]. According to the China Electrification Development Report 2019, renewable energy accounted for 39.5 percent of installed power generation capacity and 27.9 percent of electricity generation capacity. However, the challenges of instability and discontinuity for renewable energy supply, as well as energy absorptive problems, prompt solutions [4,5,6]. Meanwhile, the government’s subsidies for the renewable energy power generation industry are gradually fading away [7], especially in terms of photovoltaic power and wind power stations [8]. Thus, the current development focus of the electricity market is gradually shifting from scale expansion to high-quality development. Advanced technologies such as “Internet+” and smart electricity generation have been given full attention [9]. Among them, large-scale energy storage technology is one of the core technologies for the intelligent development of energy Internet [10]. Battery storage technology has the potential to reduce emissions from the electric sector by increasing the penetration of wind and solar energy [11]. By the end of 2018, the cumulative installed capacity of electrochemical energy storage in China had exceeded 1.0 GW/2.9 GWh. Energy storage can assist wind and photovoltaic power stations to achieve a safe and stable power supply and alleviate the energy absorptive pressure by intelligent dispatching control under accurate power prediction [12,13,14].
The application of energy storage in the electricity market is impacted by some practical factors. Many studies have focused on these topics, mainly including regional disparities, detailed energy storage technology, relevant policies, electricity system optimization, and others.
Electricty markets in different regions have different characteristics. Nasiri et al. evaluated the impact of energy storage systems on the market settlement of region-local market economy status [15]. Schyska et al. found that the cost of capital needed to reduce carbon emissions and increase investments in renewable energy in the grid was unevenly distributed across Europe, which showed a clear north-south and east-west divide and influenced the optimal electricity system design [16]. Fu et al. proposed three operation modes of integrated energy companies: power dependence, user dependence, and bilateral cooperation from the perspective of GDP, power consumption, and the development potential of distributed resources [17].
Technically speaking, the main challenges facing energy storage are that the diversity of existing battery requirements exceed that of current technologies and that existing technologies cannot fully meet all the requirements of a given application [18]. It is difficult for current energy storage technologies to economically satisfy the short-term transients of renewable energy grid-connected operation with power, cycle life, and energy efficiency [19]. Hydropower generation and compressed air energy storage have certain requirements for geographical conditions [20]. However, although mechanical flywheels have high power and efficiency, their cost is unaffordable for the majority [21]. While electrochemical energy storage technologies such as lead-acid and sodium-sulfur cells are relatively less expensive, they are still far from satisfactory because of the limited discharge depth, cycle life, and energy efficiency [19,21].
To face these current situations and tackle these existing problems, some countries have launched relevant policies. For example, the United States, Germany, Australia, and other nations decided to integrate increasing amounts of intermittent renewable energy and carry out their policies and made regulations accordingly. These countries aim to support energy storage development [22]. However, in China, there are many problems in the development of energy storage technology and industry, including insufficient policy support, insufficient technical standards, and insufficient overall planning [23].
As regards system optimization, Cruise et al. studied the optimization operation of the energy market considering the impacts of energy storage. It was proved that the realization of energy storage value will vary significantly depending on ownership, contract, and market structure [24]. Taking PJM as an example, Zhao et al. carried out a comprehensive revenue analysis for the market-based power system. An optimal placement algorithm was used to find the optimal layout of battery energy storage systems installed at a profitable site [25]. In the process of concluding the optimal allocation, Abdelkader et al. proposed a novel optimization approach to measure the scale of multi-source PV/wind with a hybrid energy storage system [26]. For a comprehensive allocation of PV-distributed generation and battery energy storage systems (BESS), Mukhopadhyay et al. adopted particle swarm optimization [27].
Among the many studies, there are some knowledge gaps. How do the energy storage projects impact on the revenue of electricity enterprises? Will the impacts change under government regulation? What will the dynamic interaction process among the electricity enterprises have when energy storage projects access to the electricity markets? Besides, there is no research discussing how well the energy storage technologies align with the existing regional electricity infrastructure.
As for the methodologies of studying the energy storage access to the electricity markets, many scholars have chosen to describe optimal planning with detailed physical parameters. For example, Pandžić, Dvorkin used a two-tier programming framework to maximize life expectancy margins of energy storage [28]. These studies strengthened the balance mainly in terms of basic physical value and paid less attention to the economic strategies among the market participants. Lopes Ferreira et al. adopted an optimal control approach to maximize the yearly benefit [29].
Some research has focused on the profit maximization of energy storage. For example, Akbari-Dibavar et al. proposed a hybrid stochastic robust optimization method for owners of energy storage systems (ESSs) to obtain energy arbitrage to maximize the benefits [30]. Martinez-Bolanos et al. calculated the break-even point (BEP) for four battery technologies and evaluated the economic feasibility of replacing traditional diesel power plants to achieve time-shifting energy [31]. However, these methods only achieve a static balance and do not dynamically present the imitation behaviors in the electricity markets or the change processes of some of the population. Further, these optimization methods make it difficult to model the role of government
In addition, game theory is widely used to describe optimization strategies through the interaction between players. Traditional game theory provides a practical tool for simulating the strategic behavior of electricity market participants. For example, Borghetti et al. analyzed the bidding strategies of power generation enterprises based on the simple static game method and the unit commitment algorithm of cost minimization [32]. Lu et al. adopted a Nash-Stackelberg game approach in the regional energy market considering users’ integrated demand response [33]. Azad and Ghotbi used game theory to analyze the competitive market structure and market behavior under the Nash equilibrium [34]. Khojasteh used game theory to describe the trading strategies of microgrid operators (MGOs) and consumers to maximize their financial profits [35]. However, the strict assumptions of the traditional game do not hold true in practice [36], which makes it difficult to describe the complex and dynamic electricity markets.
To relax the hypothesis of complete information, Abapoura et al. proposed a non-cooperative game for an optimal bidding strategy [37]. By relaxing the hypothesis of completely rational players, the evolutionary game shows its superiority. It can also describe the imitation and strategy evolution of competitive strategies in the electricity market competition. Therefore, it more accurately models the real dynamic process of optimization decisions by different stakeholders in the electricity market. Vytelingum et al. used the evolutionary game model to describe a bidding strategy that autonomous trading agents can use to participate in continuous double auctions (CDAs) [38].
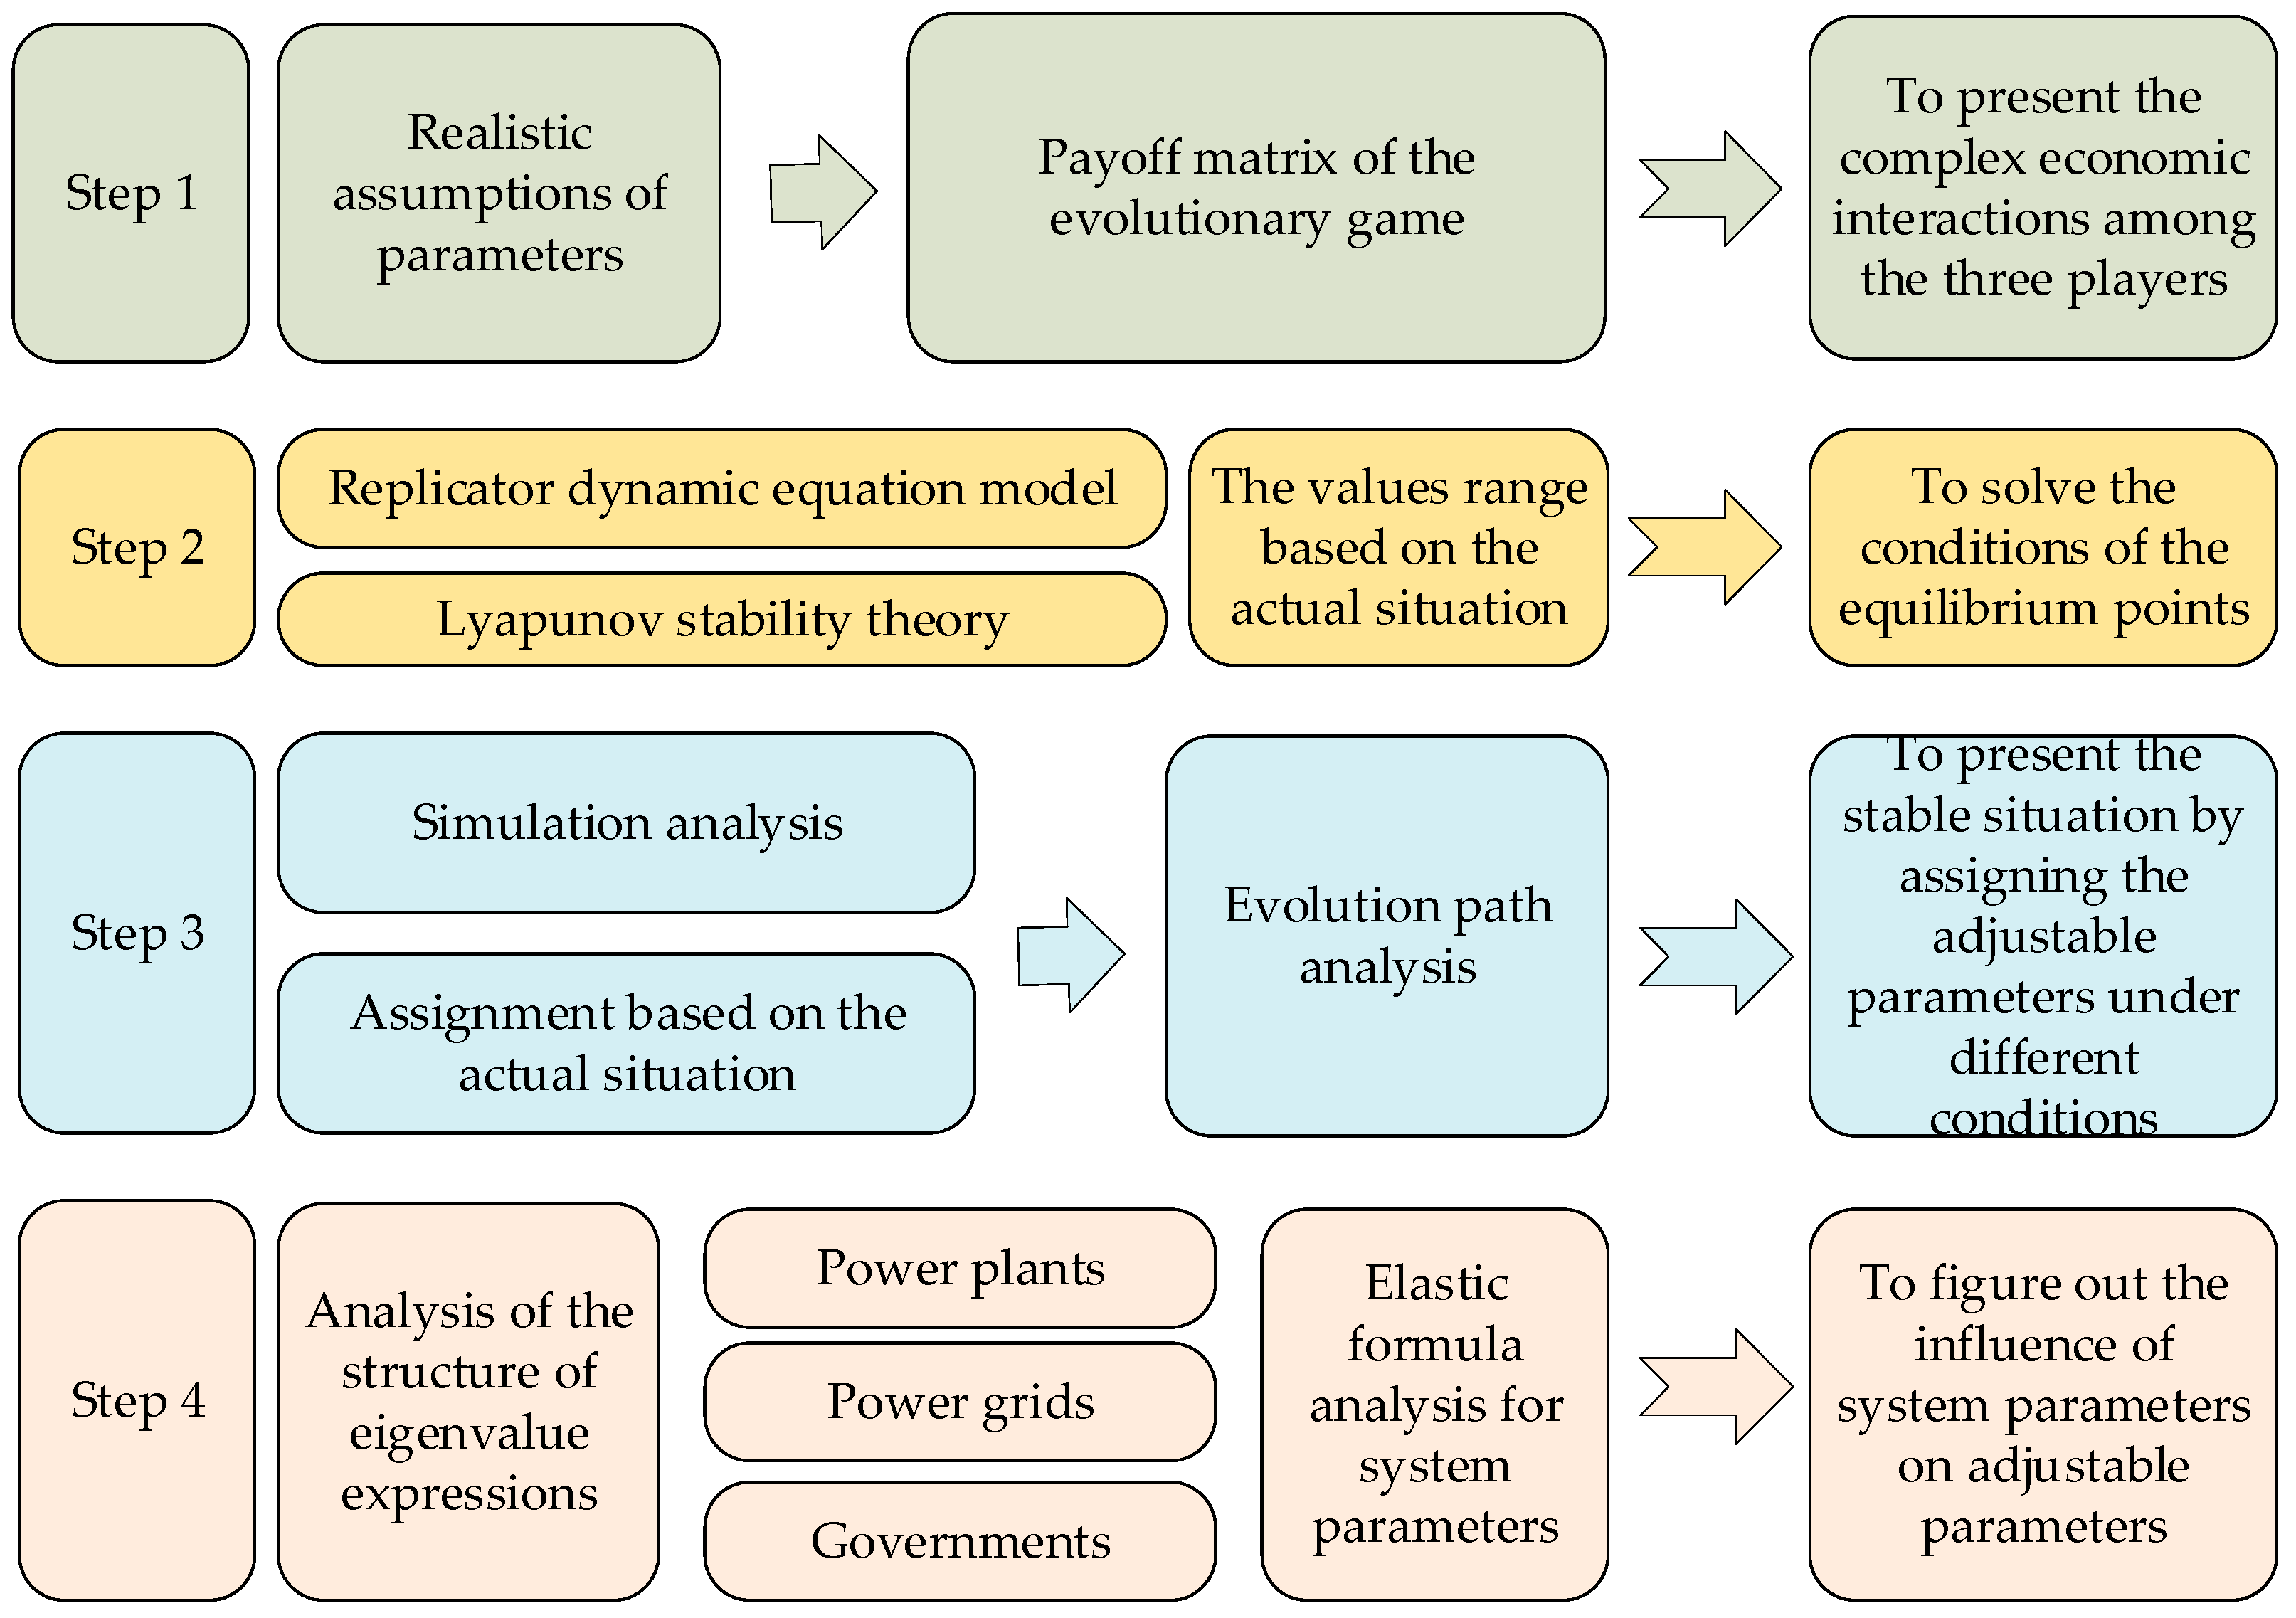
In conclusion, the evolutionary game theory has specific advantages that no other methods can achieve to present a dynamic interaction mechanism in the electricity market with limited ration and incomplete information. Thus, for research purposes and the availability of data, we adopt the evolutionary game model to analyze the complex relationship among governments, power grids, and power plants. The framework of evolutionary game analysis for this article is shown in Figure 1.
In the second section, five premises involving the electricity market with energy storage are set conforming to the practical logic. A trilateral evolutionary game model of power plants, power grids, and government population is established to present their intrinsic links. In the third section, to obtain the evolutionary stable equilibrium of the game, the replicator dynamic equation model is adopted. In the fourth section, the game equilibrium results are simulated and analyzed. How an initial strategy profile moves to an evolutionary stable equilibrium is explained. Under different system parameters, the ranges of adjustable variables were calculated to attain the stable equilibrium of the strategies. Through the analysis, we can anticipate the energy storage strategies of participants in different types of electricity markets, and thus provide valuable suggestions for shaping future policy directions in the fifth section.
Above all, the innovations of this manuscript can be summarized as follows: (a) This paper expounds the interaction mechanism between energy storage and the electricity industry by a trilateral evolutionary game method, considering the government as a player. (b) This paper clarifies the stability conditions of different equilibrium points and explains the physical meaning of the equilibrium points in detail. (c) The obtained chain of influence presents the impacts of regional differences expressed as different system parameter ranges of the adjustable variables and the impacts of those variables on the different equilibrium strategies.

2. The Trilateral Game Modeling Based on the Response of Power Plants, Power Grids, and Governments to Adding Energy Storage

2.1. Current Background and Relevant Policies of Energy Storage

In terms of technology applications, energy storage has brought apparent benefits to the development of electricity enterprises. The development of energy storage is an effective means to establish and improve the long-term absorption mechanism of clean energy and core technology for the popularization and application of renewable energy [39]. In addition, energy storage assists traditional thermal power plants to reduce frequency modulation loss and improve response speed [40]. In the context of actively increasing renewable energy consumption, the load of coal-fired power plants is limited due to the policies of giving priority to new energy in generating electricity. Thus, profits of the conventional power plants are squeezed [41,42]. The utilization rate of thermal power investment would be reduced if the thermal power units frequently start and stop as standby FM [43]. Energy storage technology is widely used for auxiliary frequency modulation. Different types of energy storage technologies show different performances in terms of energy time-shifting [31,44]. Adding energy storage on the power grid side, the auxiliary power grid can be adjusted and modulated to enhance the safe and stable operation [45]. Energy storage technology can optimize the energy consumption planning and conversion [46], provide a timely frequency response, and participate in emergency control [47].
However, the cost of the large-scale construction of energy storage at this stage is rather high due to the limitations of the technology [48]. Sioshansi proposed that social welfare can be reduced due to energy storage access to the imperfect competition in the electricity market [49]. Advances in technology can bring down the cost of energy storage [50].
To prompt the long-term development of energy storage, the incentives of relevant policies count, especially in the initial stage [51,52]. In recent years, China’s energy storage market road has zigzagged forward. Local governments have successively issued policies and regulations to promote the development of the energy storage industry, as shown in Table 1.
In 2017, China’s energy storage generally showed a positive trend of diversified development and initially possessed the foundation of industrialization. The Guiding Opinions on Promoting the Development of Energy Storage Industry and Technology put forward two stages of energy storage promotion. The first stage, mainly during the 13th Five-Year Plan period, aims to realize the transformation from an R&D demonstration project to early commercialization. The second stage, mainly during the 14th Five-Year Plan period, aims to realize the transformation from early commercialization to large-scale development.
By 2018, the tremendous growth in energy storage projects indicated a boom in this industry. Some provincial governments had issued policies requiring new wind power projects to install energy storage devices, including Shanxi, Hunan, Qinghai, Henan, Inner Mongolia, Xinjiang, Anhui, and Jiangxi. Under the limited subsidies and the low on-grid price, the large-scale construction of energy storage only brought an increased economic burden, especially for new or small energy enterprises. Throughout the energy storage industry, upstream equipment suppliers, such as battery cell, PC, and equipment integration manufacturers, could make profits, while downstream terminal demand customers had no economic benefits and a clear profit model.
In 2019, the National Development and Reform Commission issued the Measures for The Supervision and Examination of The Pricing Costs of Power Transmission and Distribution. The measures made it clear that energy storage facilities invested by power grid enterprises are not included in the costs of electricity transmission and distribution. State Grid Corporation of China and China Southern Power Grid declared intentions to suspend the construction of large-scale power-grid side energy storage projects, which paused the boom.
The first quarter of 2020 saw unprecedented losses in China’s electricity demand due to the COVID-19 virus pandemic, especially in the secondary industry. As the main source of profit for domestic electricity corporations, the industrial and commercial demand greatly shrank due to the delay to return to the work. In the second quarter, the energy consumption in China basically recovered to around 90% of the pre-epidemic level. In the short term, many energy storage plans have been delayed, and new plans are hard to execute due to the slower cost reduction compared to the pre-epidemic era. In the long term, energy storage is reserved for infrastructure construction so that well-thought-out plans will sooner or later be implemented. The volatility in the electricity market will generate a greater demand for flexible capacity and promote storage deployments. In addition, the post-epidemic supporting policies promote the energy storage industry, beyond the mere prevention of negative COVID-19 impacts. Based on The Action Plan for the Development of Energy Storage Technology (2020–2024), the National Energy Administration has further issued Guidelines on Energy Work in 2020 to stimulate the development of energy storage technology.

2.2. Evolutionary Game Modeling

In this section, a trilateral evolutionary game model is established to present the interaction mechanism of the power plants, power grids, and governments, considering energy storage access to the electricity market.

2.2.1. Basic Assumptions

Based on the evolutionary game theory and the actual situation, we propose the following premises:
Premise 1.
The power plants, power grid enterprises, and governments are the players of bounded rationality in the evolutionary game.
Premise 2.
The three players adjust their strategies through the transmission mechanism of mutual learning, imitation, communication, replication, heredity, and variation.
Premise 3.
The auxiliary service market is needed to support the safe and stable operation of the electricity system. Energy storage plays a significant role in new energy grid connection, auxiliary thermal power peak regulation, home energy storage systems, and power grid support services. Therefore, we can assume that energy storage projects are built by power plants and power grid enterprises as competitive allocations, which means that we assume that standalone energy storage enterprises provide products to power plants and power grids.
Premise 4.
The three players each have two pure strategies. For power plants, adopting energy storage technology helps peak regulation and avoids the waste of vast, newly added, standby peak-regulating units. However, the high technical cost of energy storage is a major inhibitor of energy storage facilities in addition to the existing equipment. Therefore, power plants must choose whether or not to build energy storage facilities. For power grid enterprises, adding energy storage facilities helps regulate peak load and balances the peak-valley load of the power grid. Similarly, it also brings a cost pressure to grid enterprises. Therefore, power grid enterprises have to choose whether or not to add energy storage to the power grid side.
Energy storage technology is still in a stage of development and improvement, so the intensity of government administration plays an essential role. On the one hand, as one of the core links for the energy Internet, the high-cost energy storage technology inevitably requires vigorous support from the government both in taxes and subsidies for further promotion. On the other hand, in view of the consequences of massive subsidies for photovoltaic, wind power, and new-energy vehicles, it can be inferred that too much preferential subsidy policies may breed the “subsidy fraud” behavior. Therefore, the pure strategic decision of the government is whether to regulate the development of the energy storage industry.
To sum up, the pure strategy sets of power plants, power grid enterprises, and governments are as follows: power plants choose to build or not build, power grid enterprises choose to add or not add, and the governments choose to regulate or not regulate.
Premise 5.
The probabilities of the power plants choosing to build or not build energy storage facilities are x and 1 x respectively, where x [ 0 , 1 ] . The probabilities of the power grid enterprises choosing to add or not add energy storage facility are y and 1 y , respectively, where y [ 0 , 1 ] . The probabilities of the governments choosing to regulate or not regulate the energy storage industry are z and 1 z , respectively, where z [ 0 , 1 ] .

2.2.2. Variable Setting and Target Function

In the electricity market, the revenue of power plants is mainly dependent on selling electricity to the local power grid enterprises. We assume that normally the feed-in tariff (also known as the on-grid price) of power plants is P P (yuan/kWH) and the average variable cost is C P (yuan/kWH). The generated energy of the generator set is P (kWH) in 24 h. For fossil energy power plants, power generation mainly depends on coal fuel, so the power production is accompanied by a number of carbon emissions [53]. Referring to the assumption of emission factor in Roman’s paper [54], we set the carbon tax factor to measure the contribution to carbon emission per kWH. The carbon tax uses market mechanisms to intervene in the energy consumption pattern of enterprises to reduce carbon emissions. State Council issued the Strategic Action Plan for Energy Development (2014–2020) in 2014, which explicitly constructed the green tax system in China. Considering that thermal power units are one of the main sources of carbon emissions, the electric power sector should take responsibility as a key taxpayer. Because the carbon emissions measurement technology in China is not mature, and the available equipment is relatively expensive, we calculate the tax based on the average daily electricity generation instead of the carbon dioxide emitted into the air. The carbon tax is T (yuan/kWH).
Similarly, for the power grid, the revenue is mainly determined by the margin of the sales price and the on-grid price. The electricity sales price is P G (yuan/KWH), while the average operation and maintenance cost of power transmission and distribution is C G (yuan/KWH). The two parameters are based on the amount of electricity transmitted.
The energy storage projects in power plants and power grids are A (kW)/   A (kWH) and B (kW)/   B (kWH), respectively. Thus, the load power of the former is A (kW) or B (kW) and its maximum capacity is A or B (kWH) in an ideal setting. For example, an energy storage device is 500 (kW)/1000 (kWH), which means its load power is 500 (kW) and its capacity is 1000 (kWH). The cost of energy storage projects for power plants and power grids can be divided into the construction cost and the operation cost. The construction cost values for power plants and power grids are V P and V G (yuan/KW), while their operating cost coefficients are o P and o G (yuan/kWH), respectively. We set N days as the service life of energy storage. The V P and V G here are the values that have been divided by N to obtain the average cost in one day. Since the construction of the energy storage system has positive effects on the electricity industry and even society, the construction of energy storage facilities in power plants receives tax incentives T 0 (yuan/kWH).
According to the reality of China’s daily electricity peak- and off-peak length, we assume that the charge and discharge length of the energy storage equipment are t 1 and   t 2 (h) per day, respectively. The current auxiliary service market allocation mechanism depends on the fossil generating units fulfilling their due obligation. If the generator set spends longer on auxiliary services beyond its bare-bones strength, it would be compensated; otherwise, it has to pay a penalty. Thus, it is assumed that, when the government regulates the energy storage projects of power plants and power grids, it has to decide whether to subsidize or fine the electricity enterprises according to the charging and discharging time per day. Therefore, the daily obligation time lengths of the energy storage equipment for power plants and power grids are α and β (h), respectively. The service time and the energy storage demand of the enterprises have to be considered comprehensively to set the two standards.
One study suggests that energy storage price subsidies have a more significant impact than initial cost subsidies [55]. Therefore, this paper considers the subsidies for the operation and construction costs of energy storage projects, separately. The government provides construction subsidies of r (yuan/kW) to encourage energy storage construction. To avoid subsidy cheating, we assume that the coefficient of government regulation for power plants and power grids are s P (yuan/kWH) and s G   (yuan/kWH), respectively. To be specific, when the sum of the charging and discharging times of energy storage are less than the daily obligation time, the electricity enterprises will be fined based on the difference. When the sum of the charging and discharging times of energy storage are more than the daily obligation proportions, the electricity enterprises will be subsidized based on the difference.
In order to obtain the information on the charging and discharging conditions of energy storage systems in the power plants and power grids, governments are subject to regulatory costs, which are represented as C g o v (yuan/kWH).
We assume that the total electricity demand within a day is D (kWH). Considering the power generation balance in one day, there is an identity relationship, shown as Equation (1).
P = D + x ( A t 1 A t 2 ) + y ( B t 1 B t 2 )
To sum up, system parameters and decision variables of the trilateral strategy evolution game are listed in Table 2 and Table 3, respectively.

2.2.3. The Payoff Matrix of an Evolutionary Game of Three Players

In Table 2 and Table 3, various variable parameters have been set. From the above variables involved in each department, the revenue functions of the three players can be derived under a different strategy portfolio. Therefore, the payoff matrix of the trilateral evolutionary game can be obtained as shown in Table 4.
For illustrative purposes, we provide an example here to explain the payoff of the players. When the government chooses to regulate and the power plants and power grids choose to build energy storage, the payoff functions of the power plants, power grids, and governments are P P ( 1 , 1 , 1 ) , P G ( 1 , 1 , 1 ) ,   and   G ( 1 , 1 , 1 ) , respectively, as shown in Equations (2)–(4).
P P ( 1 , 1 , 1 ) = ( P P C P T ) ( D + A t 1 + B t 1 A t 2 B t 2 ) + T 0 A t 1 ( V P r ) A ( A t 1 + A t 2 ) o P + ( A t 1 + A t 2 A α ) s P
P G ( 1 , 1 , 1 ) = ( P G C G ) ( P A t 1 B t 1 + A t 2 + B t 2 ) ( V G r ) B o G ( B t 1 + B t 2 ) + ( B t 1 + B t 2 B β ) s G
G ( 1 , 1 , 1 ) = C g o v ( A t 1 + B t 1 + A t 2 + B t 2 ) r ( A + B ) T 0 A t 1 ( A t 1 + A t 2 A α ) s P ( B t 1 + B t 2 B β ) s G + T ( D + A t 1 + B t 1 A t 2 B t 2 )
Equation (2) means that the power plants obtain the feed in tariff income based on the electricity generation and the tax breaks and subsidies for building energy storage, while they pay the variable costs, taxes, construction costs, and operation costs of building energy storage. Similarly, Equation (3) means that the power grids obtain sales income and subsidies for adding energy storage and pay the operation, maintenance, and construction costs of adding energy storage. Equation (4) means that governments are subject to regulatory costs, subsidies, and tax breaks and can obtain tax revenue.

3. Analysis of the Equilibrium Based on the Replicator Dynamic Equation Model

The equilibrium of the trilateral strategy evolutionary game system can be analyzed by imitating the dynamic equation model. This section is based on the evolutionary game payment matrix given in Table 4 for calculation.

3.1. Solution of the Evolutionary Equilibrium Based on Replicator Dynamic Equation Model

According to the payoff matrix in the second section, the expected benefits of power plants choosing to build and those choosing not to build an energy storage system can be calculated as I P 1 and I P 2 , respectively. Additionally, the average expected return of a power plant is calculated as I ¯ P . The detailed calculation process is shown in the appendix.
Similarly, the expected benefits of grids choosing to build and those choosing not to build energy storage systems are I G 1 and I G 2 , respectively. The average expected return of a power grid is I ¯ G . The expected revenue of the government under the two strategies are I z 1 and I z 2 , respectively. The average expected revenue of the government can be obtained as I ¯ z . The above detailed calculation process is shown in Appendix A.
The replicator dynamic equations of the trilateral evolutionary game system are shown in Equation (5):
{ F ( x ) = x ( 1 x ) ( I P 1 I P 2 ) F ( y ) = y ( 1 y ) ( I G 1 I G 2 ) F ( z ) = z ( 1 z ) ( I z 1 I z 2 )
For simplicity’s sake, H ( x ) , H ( y ) , H ( z ) , G ( y , z ) , G ( x , z ) , and G ( x , y ) are shown in the following formulas:
{ H ( x ) = x ( 1 x ) H ( y ) = y ( 1 y ) H ( z ) = z ( 1 z )
{ G ( y , z ) = ( I P 1 I P 2 ) = { ( P P C P T ) [ D + A t 1 A t 2 + y ( B t 1 B t 2 ) ] + z T 0 A t 1 ( V P z r ) A ( A t 1 + A t 2 ) o P + z ( A t 1 + A t 2 A α ) s P } G ( x , z ) = ( I G 1 I G 2 ) = { ( P G C G ) [ P B t 1 + B t 2 x ( A t 1 A t 2 ) ] ( V G z r ) B o G ( B t 1 + B t 2 ) + z ( B t 1 + B t 2 B β ) s G } G ( x , y ) = ( I z 1 I z 2 ) = [ C g o v ( A t 1 + B t 1 + A t 2 + B t 2 ) x r A x T 0 A t 1 y r B x ( A t 1 + A t 2 A α ) s P y ( B t 1 + B t 2 B β ) s G ]
According to Lyapunov’s stability theory, we should judge the equilibrium according to the eigenvalues of the Jacobian matrix at each equilibrium point. When the real part of all eigenvalues is negative, the equilibrium point reaches an evolutionary stable state. The Jacobian matrix of the trilateral game system can be written in the form of Equation (8):
J = [ F ( x ) x F ( x ) y F ( x ) z F ( y ) x F ( y ) y F ( y ) z F ( z ) x F ( z ) y F ( z ) z ] = [ ( 1 2 x ) G ( y , z ) x ( 1 x ) G ( y , z ) y x ( 1 x ) G ( y , z ) z y ( 1 y ) G ( x , z ) x ( 1 2 y ) G ( x , z ) y ( 1 y ) G ( x , z ) z z ( 1 z ) G ( x , y ) x z ( 1 z ) G ( x , y ) y ( 1 2 z ) G ( x , y ) ]
To set F ( x ) = 0 , F ( y ) = 0 , and F ( z ) = 0 , we can obtain eight conditions according to the structure Equation (5). Combined with the Jacobian matrix in Equation (8), the possible equilibrium points can only be obtained from H   ( x )   =   0 , H   ( y )   =   0 , and H   ( z )   =   0 , which include (0,0,0), (0,0,1), (0,1,0), (0,1,1), (1,0,0), (1,0,1), (1,1,0), and (1,1,1) [56]. The Jacobian matrix at the above eight possible equilibrium points is a diagonal matrix, and its eigenvalues are the elements on the diagonal. The stable condition for the equilibrium to become steady is that “the three eigenvalues are all negative”.

3.2. Assignment Analysis of the Equilibrium Point

According to the reality, the feed-in tariff in China fluctuates based on the benchmark electricity price approved by the Price Department. Competitive bidding is implemented for the remaining electricity. Thus, the range of feed-in tariff ( P P ) is within (0.25, 0.45) (yuan/kWH).
Considering that the average variable cost of power plant ( C P ) is mainly affected by coal fuel price, we set the variable costs referring to the price of coal power generation.
The carbon tax base should be carbon emissions. The coefficient of the actual coal consumption of thermal power generation should be 0.4040 (kgce/kWH) according to China Energy Statistics Yearbook. Therefore, a ton of coal generates about 2500 kWH of electricity and produces about 2.62 tons of carbon dioxide. Considering comprehensively the level of the carbon tax abroad and the environmental tax in China, the range of carbon tax is assumed to be within (0.004, 0.15) (yuan/kWH).
The sales electricity price ( P G ) is within (0.26, 1.5) (yuan/kWH) according to the reality. The average operation and maintenance cost of power grid enterprises is mainly related to power transmission and distribution. The cost of non-energy storage is not the focus of this paper, so we set the cost ( C G ) as a constant.
In China, the average daily peak and valley hours of electricity consumption are usually 14 to 16 (h). In some regions, such as Zhejiang, the industrial and commercial electricity price sets the peak and valley periods of electricity consumption for 24 hours. Therefore, we have the condition of t 1 + t 2 24 (h).
We set the net profit of the generated electricity for a power plant with Equation (9), and the net profit of transmission capacity for a power grid enterprise with Equation (10).
N P P = P P C P T
N P G = P G C G
When the energy storage is chosen to be built, the cost of the power plant’s energy storage is determined by Equation (11), and the cost of the energy storage on the grid is determined by Equation (12):
E P ( t 1 , t 2 ) = V P + ( t 1 + t 2 ) o P
E G ( t 1 , t 2 ) = V G + ( t 1 + t 2 ) o G
Statistics of energy storage projects from 2018 to 2020 indicate the general range of the energy storage construction cost and operating cost. α and β , which are set by the governments, represent the least daily run time of energy storage in the power plants and power grids, respectively. To simplify the regulation process, the threshold and the subsidy amount set by the government on the power plant side usually do not differ much from those set by the grid side. Therefore, we have the conditions of α = β and s P = s G . The model can thus be preliminarily assigned, and the parameter range of the stable condition for the possible equilibrium points can be calculated.
Based on Table 5 and Table 6, the adjustable variable range can be determined by the stability conditions of the equilibrium point, so as to obtain a series of evolutionary stable conditions within the actual range. The different conditions correspond to different real electricity markets. Accordingly, the evolutionary stable equilibrium points represent the final strategies of these different electricity markets. For example, if the point (1,1,0) is an equilibrium point of evolutionary stability, the parameters have to satisfy the conditions { 24 θ × N P P > E P 24 ϑ × N P G > E G A A + B ω A ( t 1 , t 2 ) + B A + B ω B ( t 1 , t 2 ) + C g o v ( t 1 + t 2 ) > 0 .
We set the proportion of power generation for energy storage load power as Equation (13), and the proportion of daily electricity demand for energy storage load power is set as Equation (14):
θ = P 24 A
ϑ = D 24 B
By assigning the corresponding values of system parameters in Table 5 and Table 6 into the inequality group, we can obtain Equation (15):
{ 1.56 θ > V P + o P ( t 1 + t 2 ) 3.6 ϑ > V G + o G ( t 1 + t 2 ) 0.84 t 1 + 0.8 t 2 > 1.75
To make it clearer, if the point (1,1,0) is an evolutionary stable equilibrium point, the adjustable variables must satisfy Equation (15). For example, facing energy storage facilities where A = 10,000 (kW), V P = 3 (yuan/kW), and o P = 0.1 (yuan/kWH), medium and large power plants with a generator set power greater than 20,500 (kW) will choose to build energy storage. The energy storage of power grids needs to be judged by the demand. Facing energy storage equipment where B = 15,000 (kW), V G = 3 (yuan/kW), and o G = 0.1 (yuan/kWH), power grid enterprises with a demand above 319,400 (kWH) will ultimately choose to add energy storage equipment. The government will not choose to regulate energy storage after a long-term evolutionary game. Hence, the trilateral game strategy achieves an equilibrium point of evolutionary stability at the point (1,1,0).
Therefore, we can conclude that medium and large power plants with the power of generating sets above 20.5 (MW) and medium and large power grid enterprises with an electricity demand above 319.4 (MWH) will eventually choose to build energy storage facilities, and the government will choose not to regulate them.

4. Analysis of the Influence of System Parameters on Adjustable Variables

Power plants’ revenues include net profits from selling electricity to power grids and subsidies from the government for constructing and operating energy storage. The power grids’ revenues consist of the net profits from electricity sales to the consumers and the subsidies from the government for adding and operating energy storage. The government pays regulatory costs and provide subsidies to energy enterprises or fines them when it chooses to regulate. The evolutionary game system has different stable equilibrium points under different constraints. At the equilibrium point, the evolutionary stable state is reached, the evolutionary stable equilibrium is formed, and the refined Nash equilibrium is achieved.

4.1. Analysis of the Strategic Impact among Power Plants, Power Grids, and Governments at the Equilibrium Point

The simulation was applied to further verify the stable state of evolution at each equilibrium point. Considering the equilibrium point (1,1,0) as an example, the assignment results are shown in Table 5 and Table 6.
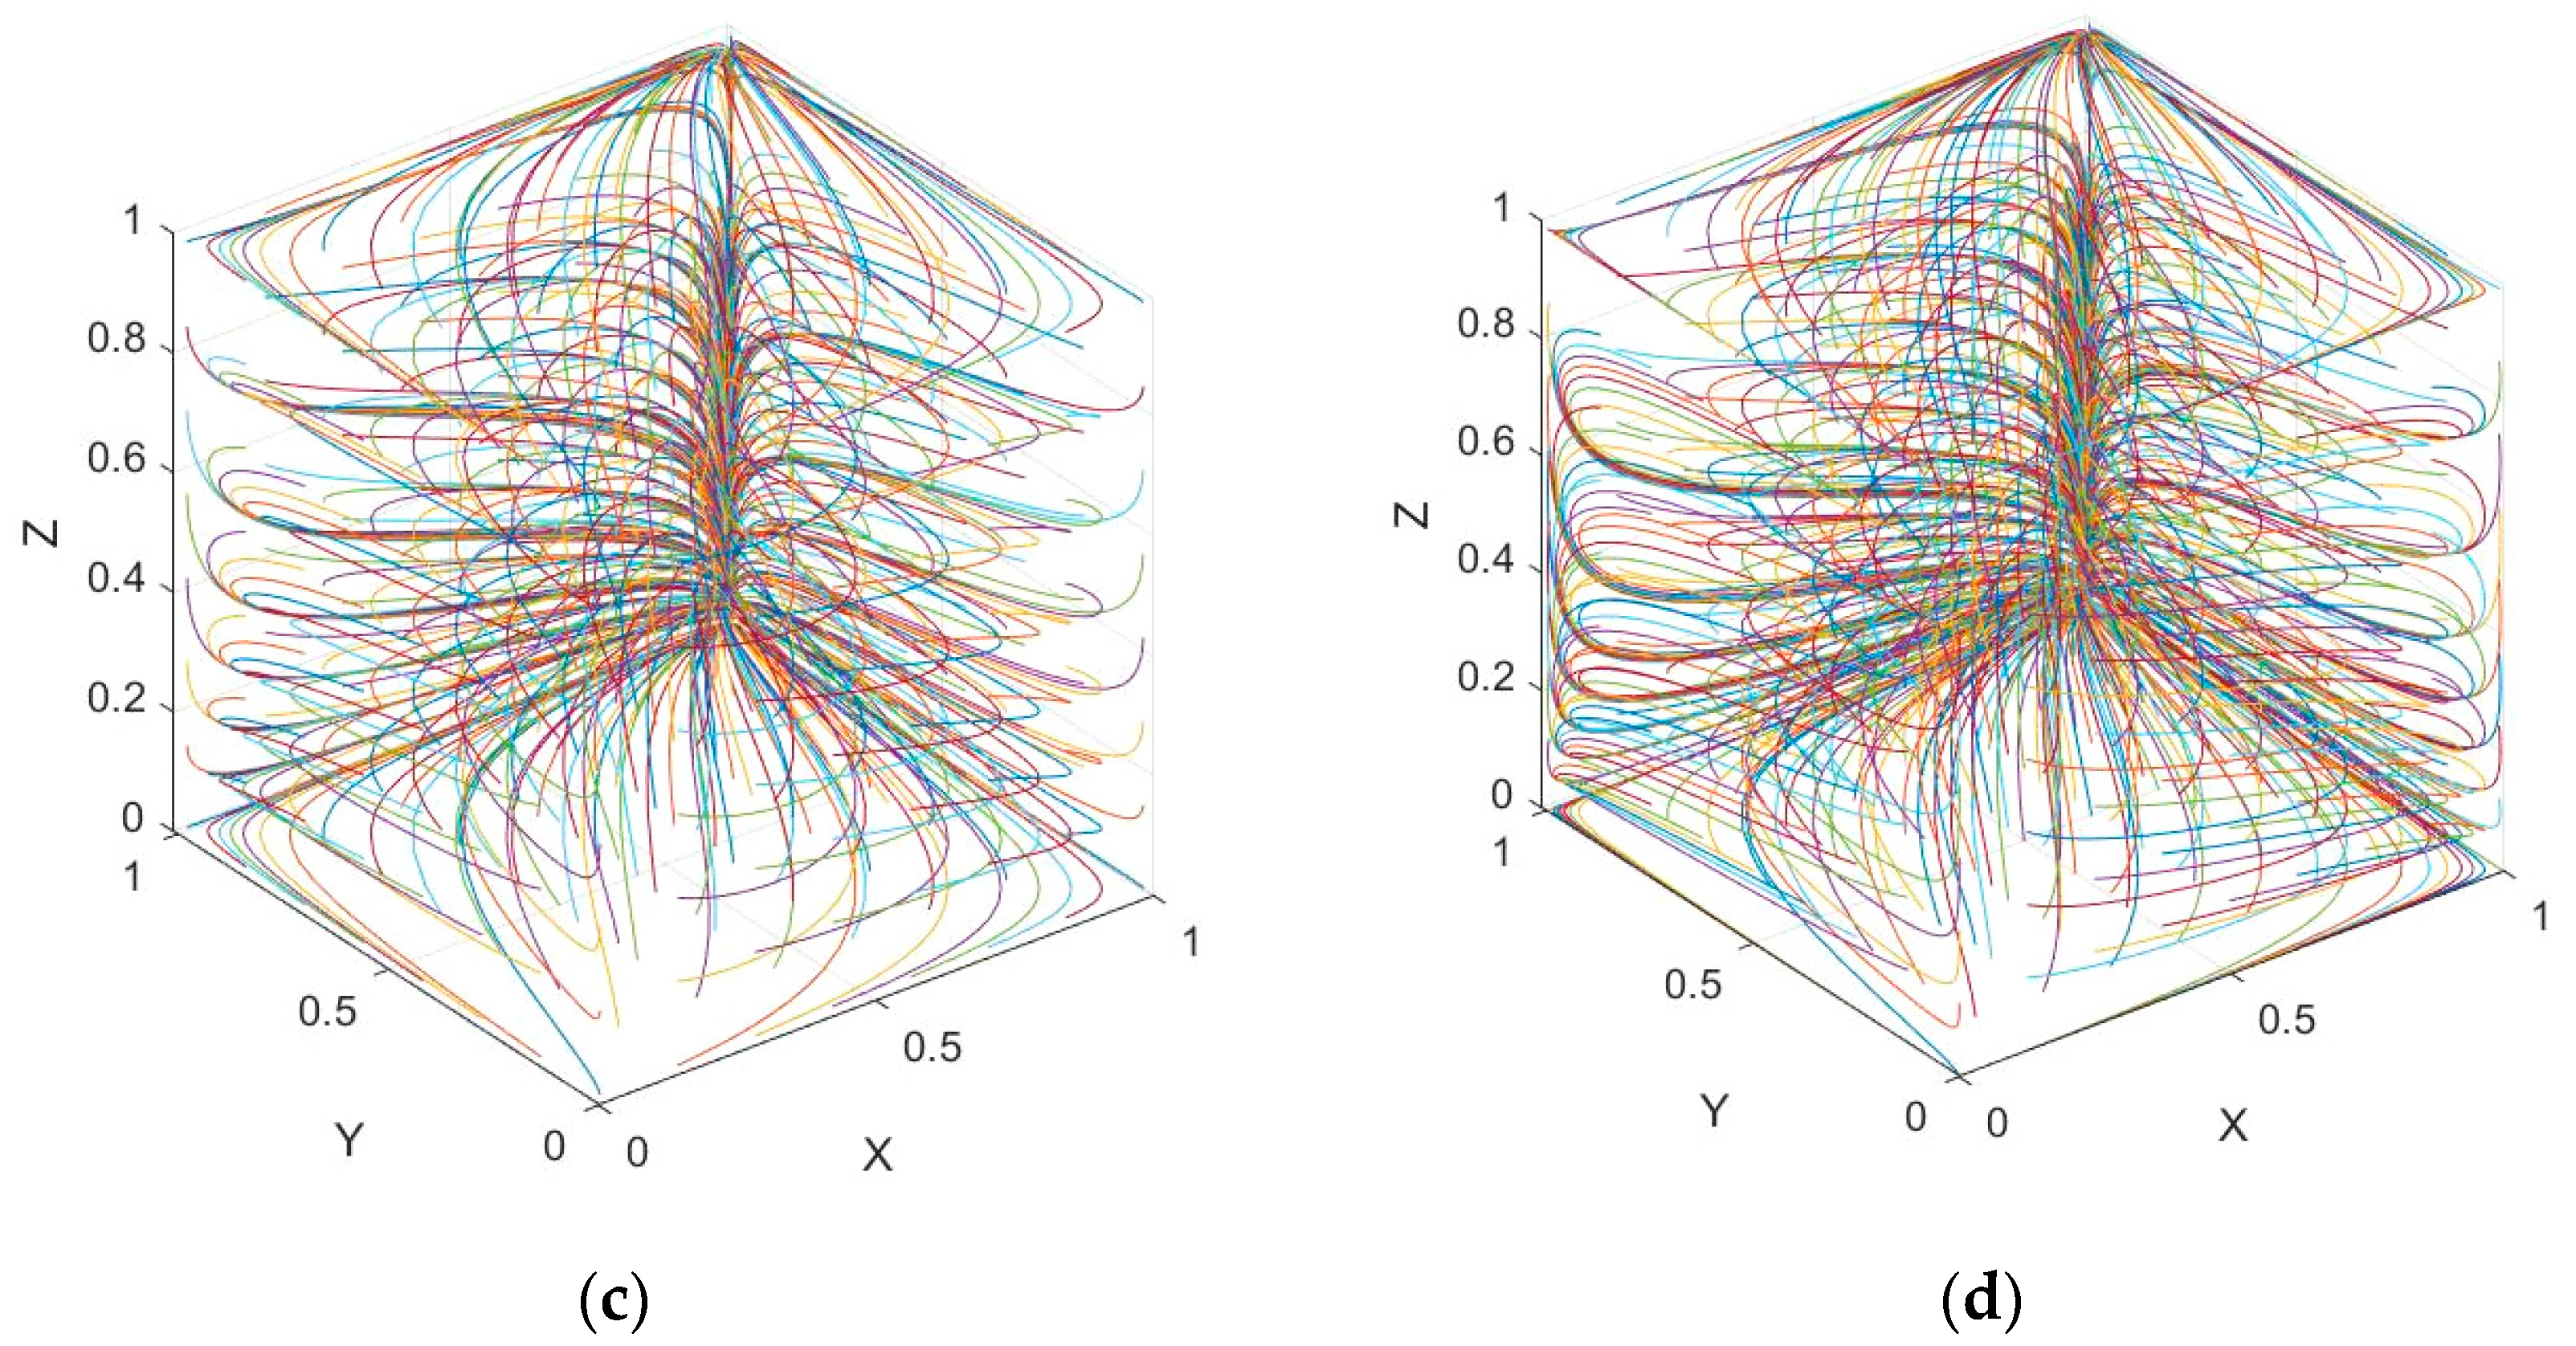
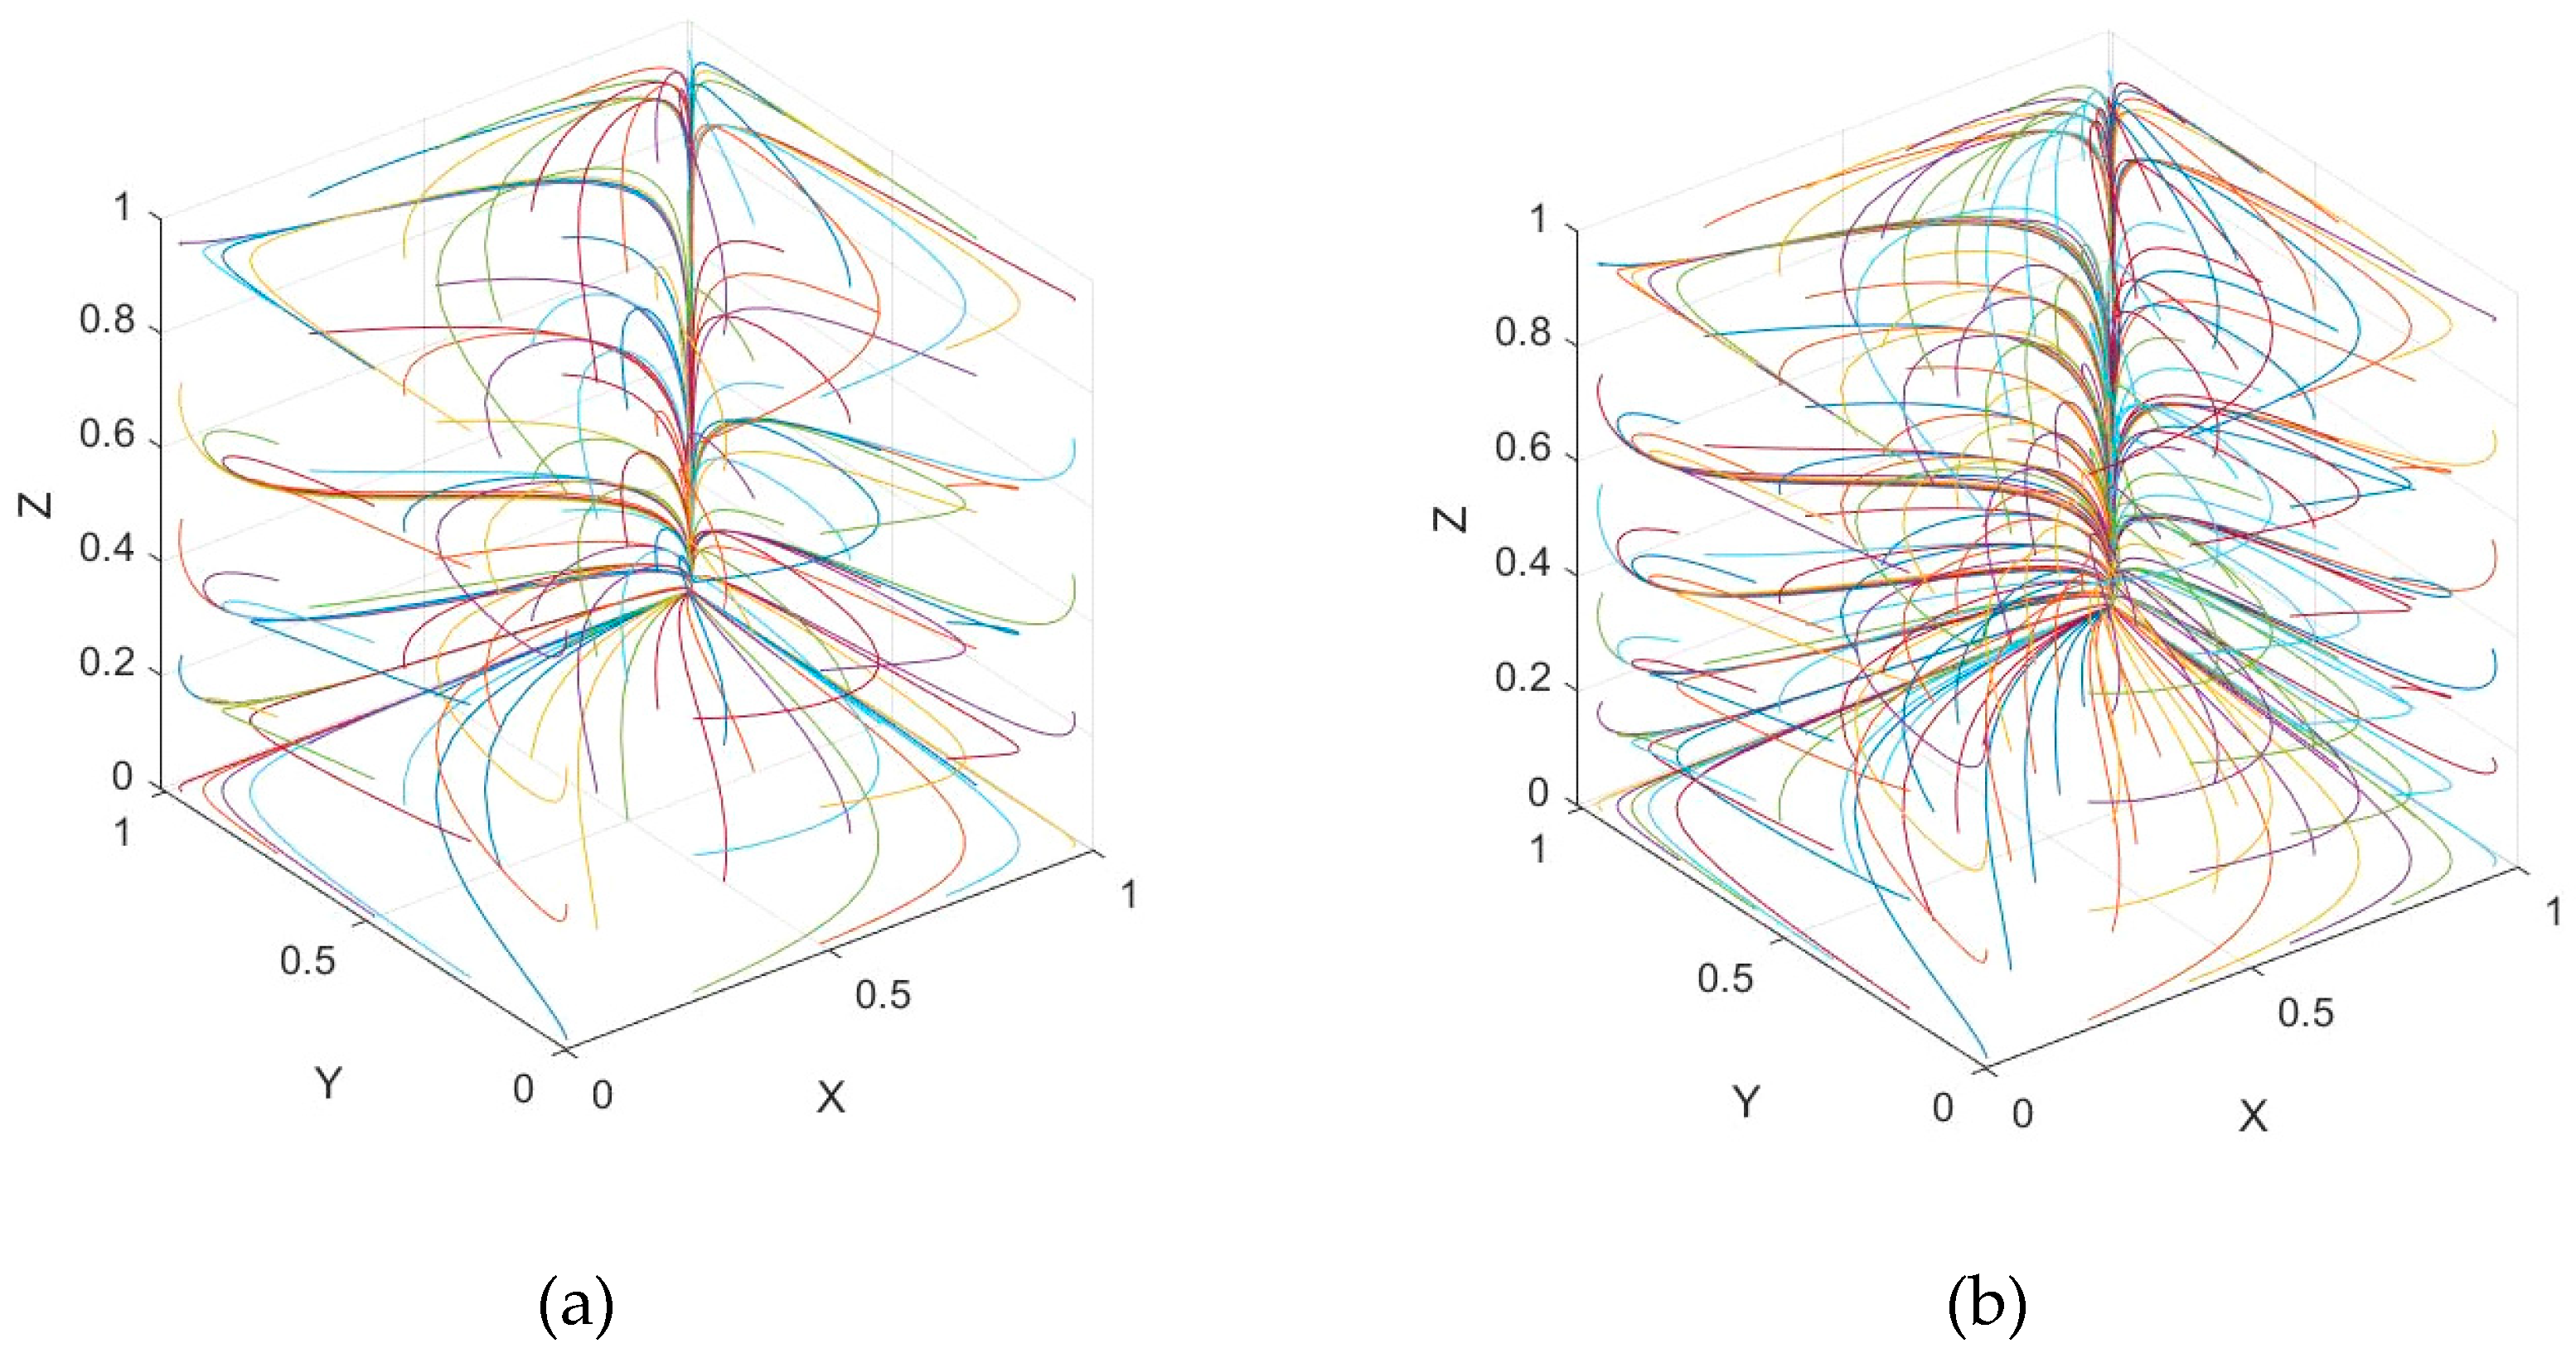
As shown in Figure 2 the initial values of x, y, and z are evaluated at step sizes of 1/4, 1/5, 1/7, and 1/8 from 0 to 1. By observing the dynamic trajectory of strategy changes of ( x ,   y ,   z ) , we can analyze the process of achieving the evolutionary equilibrium state.
According to the simulation results in Figure 2, it can be seen that, after rounds of simulation, the only evolutionary stable equilibrium point of the trilateral game system is (1,1,0), which proves the above conclusion in Section 3.2. In the case of high-power generation and high electricity consumption, after a long-term evolutionary game process, power plants and power grids both choose to build energy storage, and the government tends to choose not to regulate the energy storage industry. According to the trend of the simulation diagram, we can see that power plants and power grid enterprises are rather sensitive to the government’s choice. No matter what initial proportion chooses to build energy storage, once the government decides whether or not to carry out energy storage condition supervision, electricity enterprises will quickly respond. At a random initial point, if the proportion of power plants choosing to build energy storage is higher than that of the power grids, power plants can be regarded as “advanced imitators”. In other words, the proportion of power plants that build energy storage strategies will increase sharply. All power plants will adopt the strategy of building energy storage due to the visible benefits. When the proportion of the power plants increases to a certain degree, power grids begin to play the role of “advanced imitators”. It is shown by the high proportion that building energy storage is lucrative and valuable for power plants. Thus, power grid enterprises have compelling reasons to imitate the strategy of adding energy storage. The proportion of power grid enterprises that choose to add energy storage will then show a higher growth rate, until the game reaches an evolutionary stable state. This is how the equilibrium point is reached when power plants are advanced imitators. The other cases are similar to the above evolutionary process.
According to Section 3.2, different evolutionary game equilibrium results can be obtained by adjusting system parameters, and the analysis process is similar to (1,1,0). The transaction electricity quantity between power plants and power grids is Q ( = D + A t 1 A t 2 = P B t 1 + B t 2 ) (kWH). For more specific results, the classification of the scale of the power plants and the power grids are shown in Table 7. We select typical examples to list, as shown in Table 8 and Figure 3.

4.2. Effects of System Parameters on Equilibrium Conditions

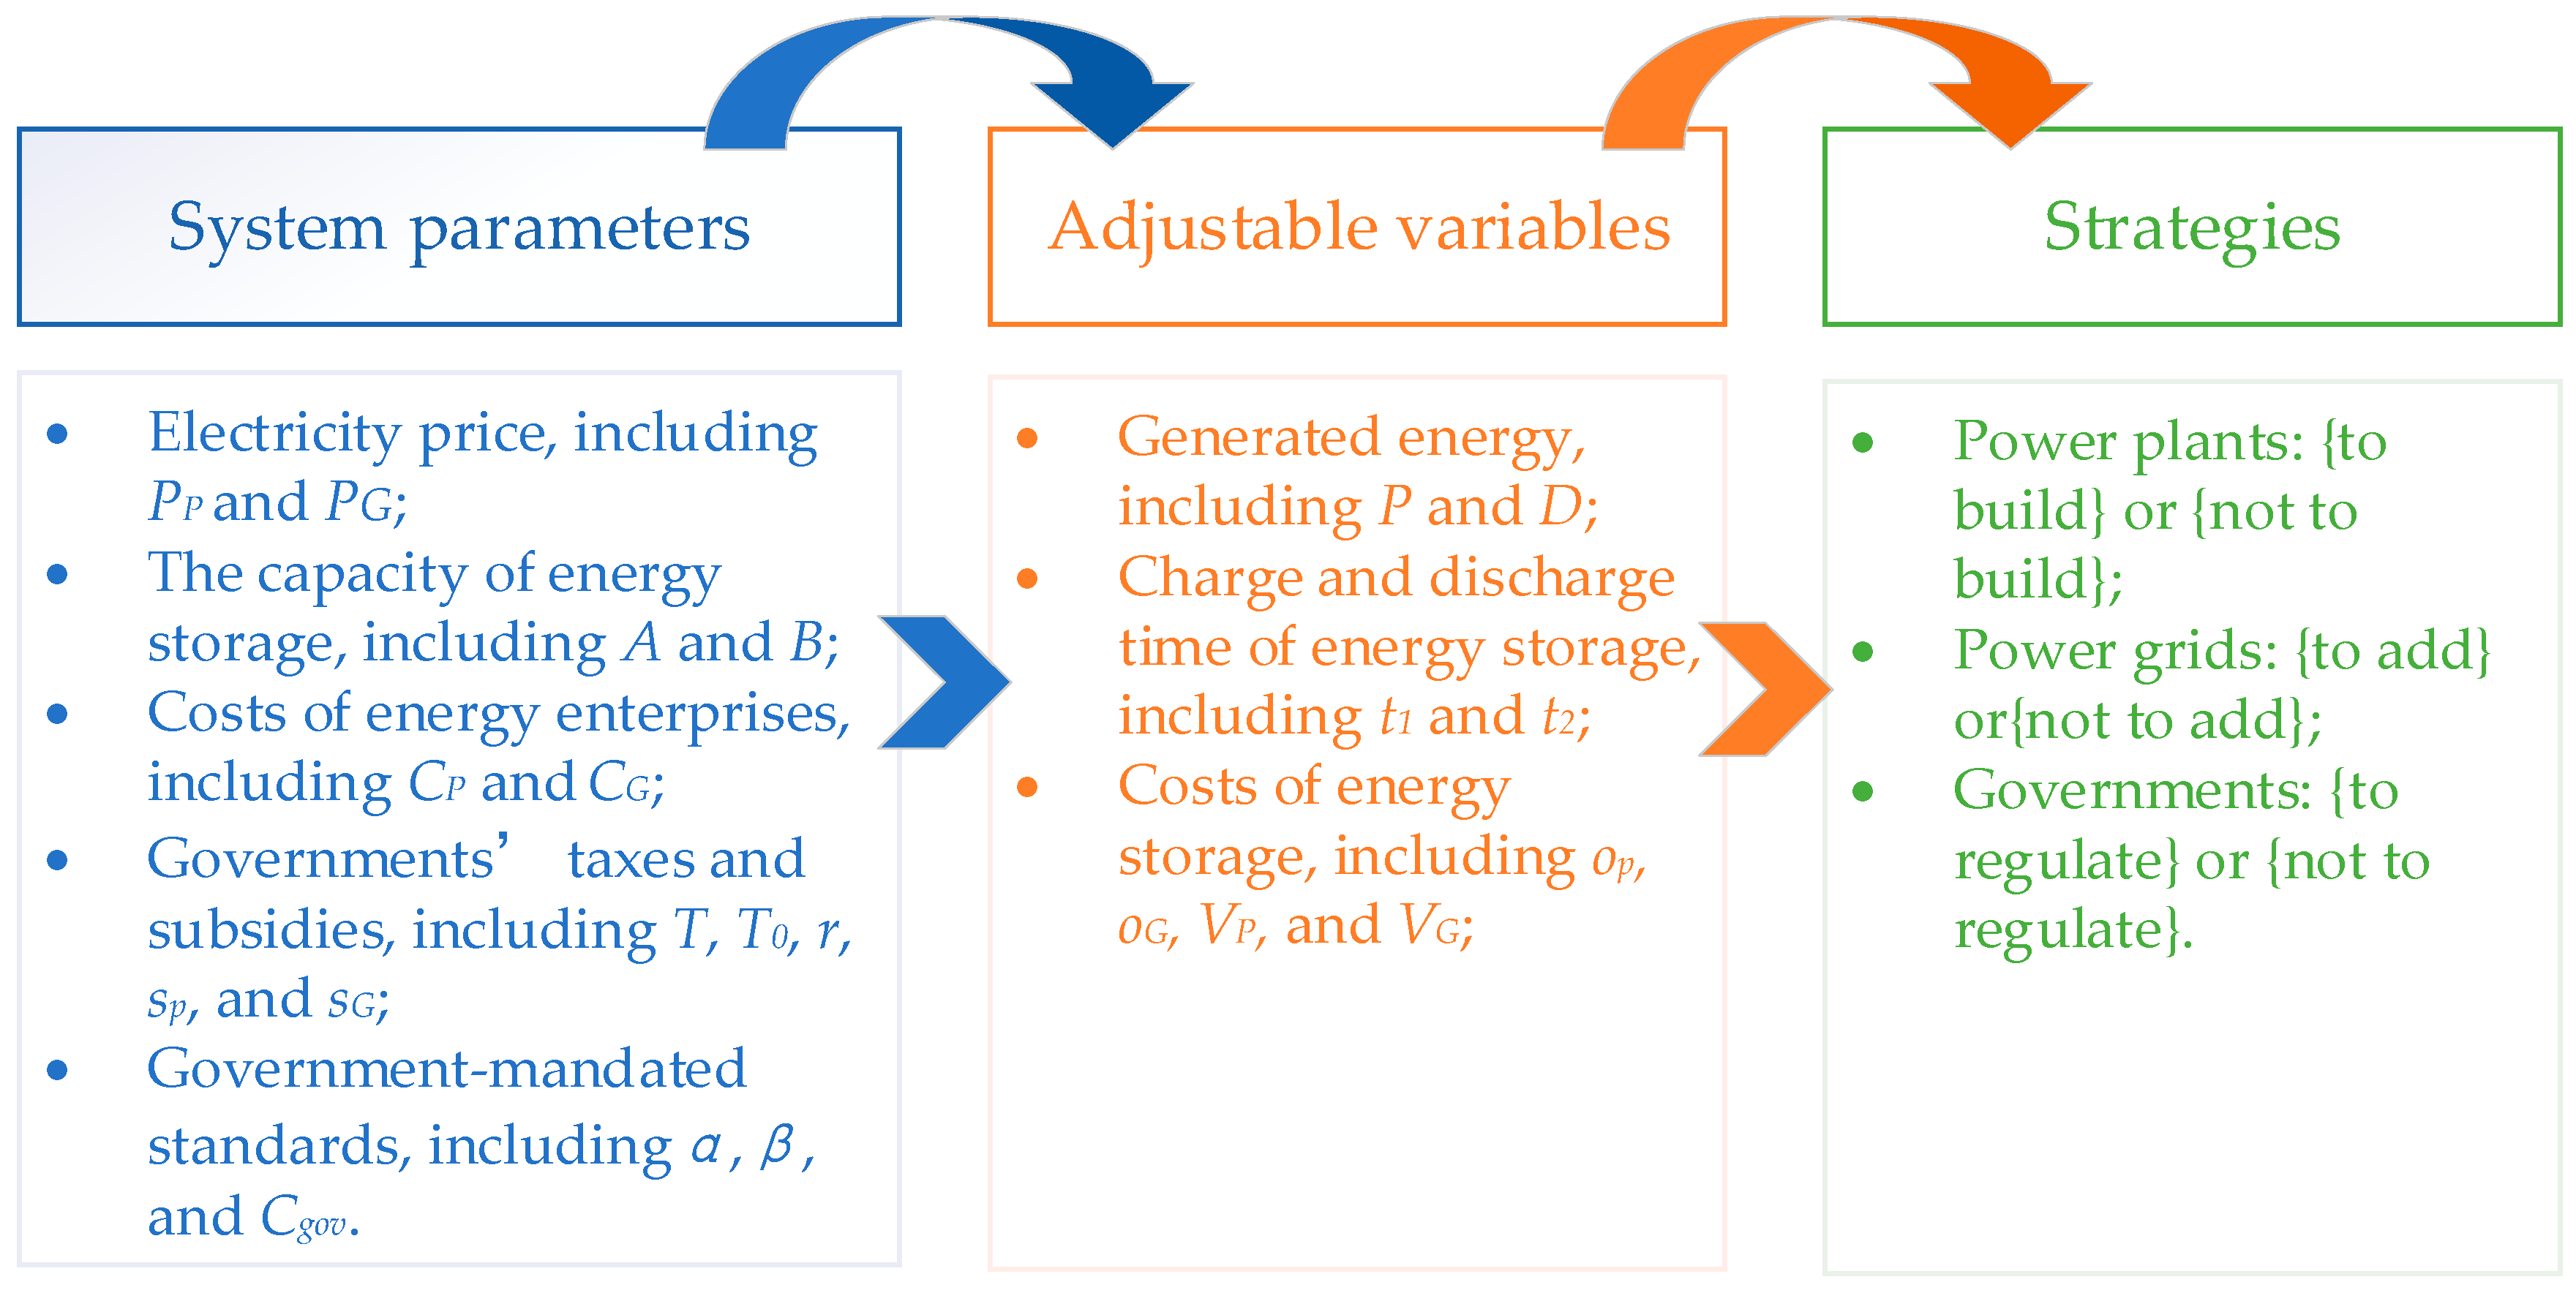
In Section 3, we discussed the impacts of adjustable variables on strategies with the system parameters unchanged. In this section, we relax that assumption and measure the impacts of variable system parameters on the adjustable variables. Thus, we can obtain a chain of influence in the electricity market, which is shown in Figure 4.
In order to measure the specific impacts of system parameters on adjustable variables, this section uses the actual range of parameters in Table 5 and Table 6. The conclusions drawn by the model have practical significance and policy value.
According to Section 3.2, when the point (1,1,0) is the evolutionary stable equilibrium point, the adjustable variables satisfy Equation (15) based on the unchanged system parameters. By changing the system parameters in a certain range as shown in Table 5, we can explore the feasible boundary of the adjustable variables. Through inducting the swings of the influences, we can then define some conditions as effective mediate factors for electricity markets.
From Section 3.1, we can get the eigenvalues of the Jacobian matrix at the point (1,1,0) as follows:
λ 1 = ( P P C P T ) ( D + A t 1 A t 2 + B t 1 B t 2 ) + V P A + ( A t 1 + A t 2 ) o P
λ 2 = ( P G C G ) ( P B t 1 + B t 2 A t 1 + A t 2 ) + V G B + o G ( B t 1 + B t 2 )
λ 3 = r A ( A t 1 + A t 2 A α ) s P T 0 A t 1 r V G B ( B t 1 + B t 2 B β ) s G C g o v ( A t 1 + B t 1 + A t 2 + B t 2 )
According to Equation (1), when x = y = 1 ,
P = D + A t 1 A t 2 + B t 1 B t 2
Furthermore, according to Equations (9), (10), (13) and (14), the system parameters can be written in the full differential form, shown in Equations (20)–(22).
Δ ( P P C P T ) = V P + ( t 1 + t 2 ) o P 24 θ 2 Δ θ + 1 24 θ Δ V P + o P 24 θ ( Δ t 1 + Δ t 2 ) + t 1 + t 2 24 θ Δ o P
Δ ( P G C G ) = V G + o G ( t 1 + t 2 ) 24 ϑ 2 Δ ϑ + 1 24 ϑ Δ V G + o G 24 ϑ ( Δ t 1 + Δ t 2 ) + t 1 + t 2 24 θ Δ o G
A α Δ s P + B β Δ s G ( A + B ) Δ r A t 1 Δ T 0 = [ A s P + B s G + C g o v ( A + B ) + A T 0 ] Δ t 1 + [ A s P + B s G + C g o v ( A + B ) ] Δ t 2
The changes of the system parameters can then be calculated to analyze its impacts on the adjustable variables of the three players according to Equations (20)–(22).

4.2.1. The Influence of System Parameters of Power Plants on Adjustable Variables

To measure the impact of changes in feed-in tariff, variable costs, and carbon tax on the adjustable variables of power plants, we set sensibility indicators as per Equations (23)–(26)
ϵ N P P , θ = Δ θ / θ Δ ( P P C P T ) / ( P P C P T )
ϵ N P P , V P = Δ V P / V P Δ ( P P C P T ) / ( P P C P T )
ϵ N P P , o P = Δ o P / o P Δ ( P P C P T ) / ( P P C P T )
ϵ N P P , t 1 o r   t 2 = Δ t 1 / t 1 + Δ t 2 / t 2 Δ ( P P C P T ) / ( P P C P T )
At the equilibrium point (1,1,0), there is the conclusion of | ϵ N P P , θ | = | 24 θ ( P P C P T ) V P + ( t 1 + t 2 ) o P | > 1 according to Equation (23). This indicates that, if there is a small change in the on-grid price ( P P ), the variable cost of the power plants ( C P ), and the carbon tax ( T ), θ   would change substantially. θ is influenced by the average daily electricity generation ( P ) and the energy storage per load ( A ). As shown in Table A1, due to Equation (9) , the magnitude of changes in P P , C P , and T results in the same magnitude but opposite effects on the θ.
For example, when | Δ P P | ± 0.065 (yuan/kWH), that is P P (0.335, 0.465) (yuan/kWH), the medium-and small-scale power plants will eventually choose to build energy storage facilities. The lower P P is, the less profitable the power plant will be, and the more sensitive the medium-and small-scale power plants will be. Facing the energy storage facilities of the same specification, when N P P is extreme low, only power plants of a medium-or-higher size will eventually choose to build energy storage.
When Δ P P > 0.065 (yuan/kWH), that is P P is in the range of (0.25, 0.335) (yuan/kWH), the power plants ultimately choose not to build energy storage facilities. Since N P P is less than 0 at this time, the deficit pressure will be heavier for the power plants with the burden of an energy storage cost. At this point, the loss of installing energy storage is relatively higher than that of not installing energy storage. Therefore, in order to avoid making the situation worse, power plants of all scales tend to choose not to build energy storage.
Similarly, when C P changes in the range of 0.135~0.265 (yuan/kWH), it has the same influence on the average daily power generation ( P ) due to the condition of P P ( 0.335 ,   0.465 ) (yuan/kWH). The larger C P is, the more sensitive P is. Because the rising cost of power generation will reduce the profits of medium- and small-scale power plants, they cannot afford energy storage projects of the same specification. When the government chooses to levy a carbon tax   T , it increases the cost burden of power plants, which has the same impact on   P as C P . When T varies within the range of ( 0.07 , 0.2 ) (yuan/kWH), the power of the generator set in the power plants with energy storage is greater than 490 (MWH).
At the evolutionary stable equilibrium point (1,1,0), we can obtain the following conclusions based on Equations (24) and (25): | ϵ N P P , V P | = | 24 θ ( P P C P T ) V P | > 1 and | ϵ N P P , o P | = | 24 θ ( P P C P T ) o P ( t 1 + t 2 ) | > 1 .
This indicates that the feed-in tariff ( P P ), the variable cost of the power plant ( C P ), and the carbon tax ( T ) have a significant impact on the energy storage cost of the power plants, including the construction cost ( V P ) and operating cost ( o P ).
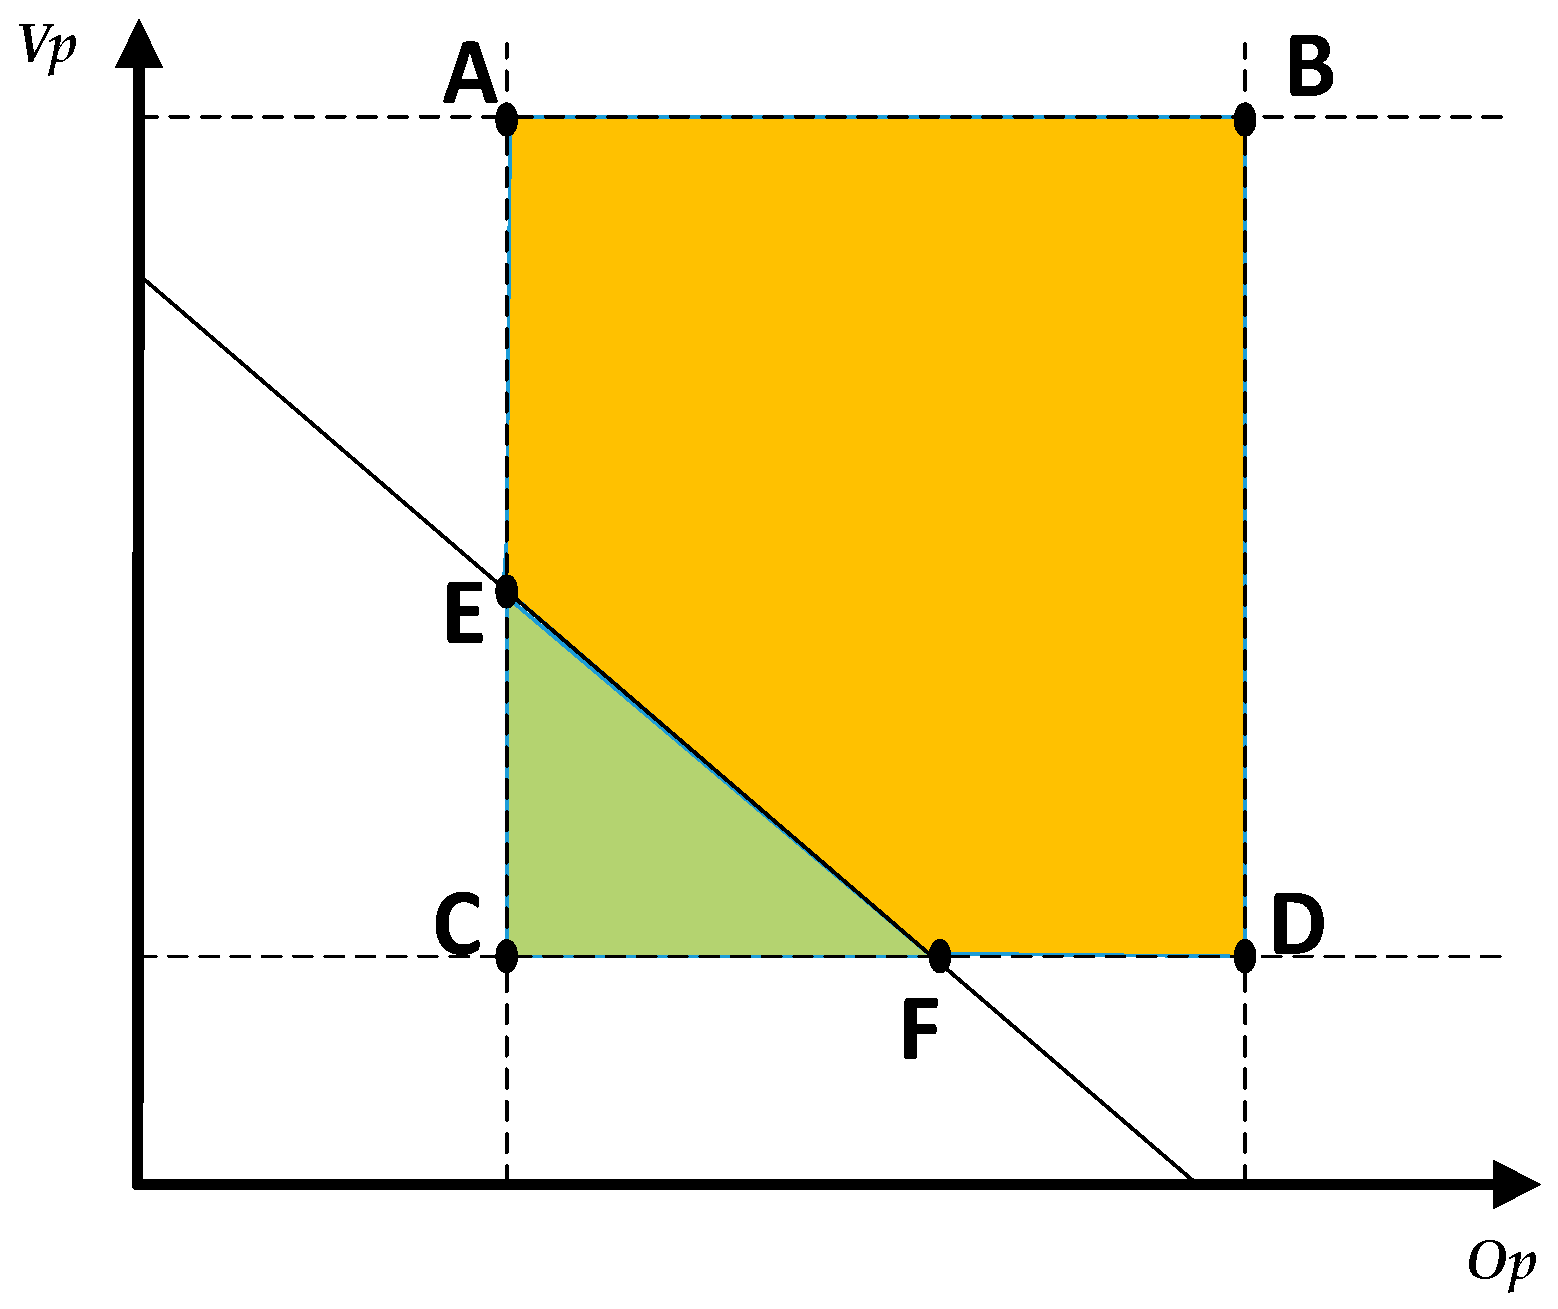
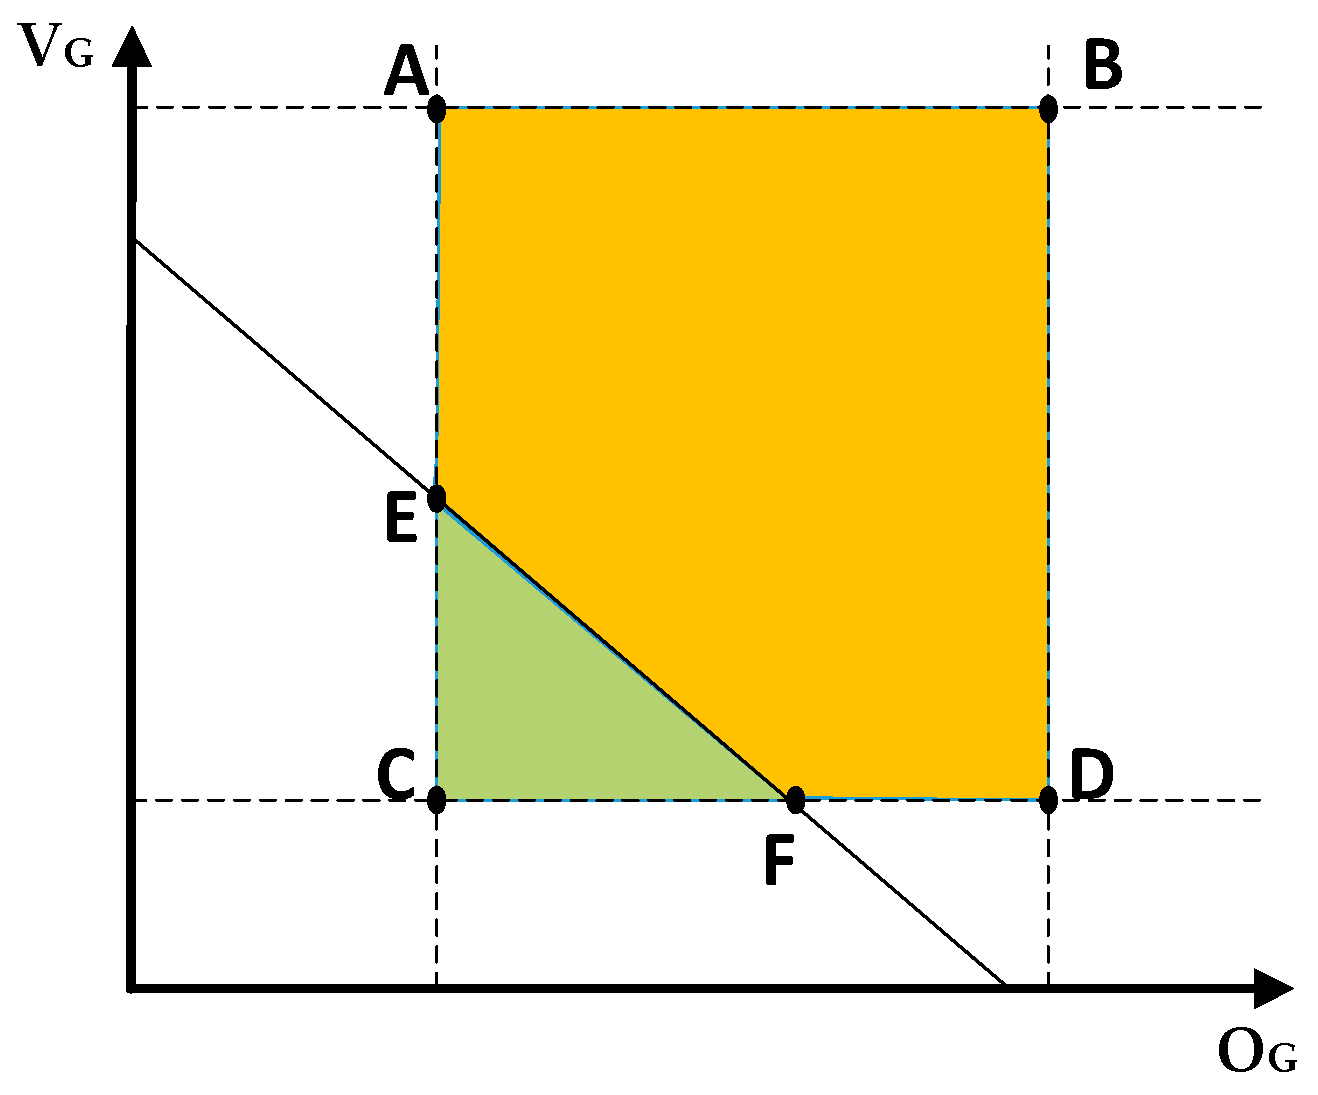
As shown in Table 5 and Table 6, the energy storage costs borne by power grid enterprises are operating costs and construction costs. The two costs satisfy the conditions of o G ( 0.05 ,   0.15 )   (yuan/kWH) and   V G ( 1.5 ,   7 ) (yuan/kW). The corresponding points are shown in Figure 5, including the points of A (0.05, 7), B (0.15, 7), C (0.05, 1.5), and D (0.15, 1.5). We set θ equal to 3 . Point E and Point F are the intersections where the line EF intersects the sides of the rectangle ABDC. Line EF satisfy the equation of V P + 16 o P = 72 N P P . Point E is on the side of AB or AC, and Point F is on the side of DB or DC.
The detailed impacts of N P P on V P and o P are shown in Table A2. As the N P P changes, the range of V P and o P changes. Table A2 describes the changes in range by using the change in the coordinates of Point E and Point F. When N P P is in the range of (−0.085, 0.039) (yuan/kWH), the profits of the power plants are very low; thus, the energy storage technology on the market is unaffordable. After a long-term evolutionary game, the power plants choose not to build energy storage facilities, that is to achieve evolutionary stability at the point (0,1,0). Correspondingly, the point ( o P , V P ) is within the rectangle ACDB in Figure 5. When N P P is in the range of 0.032~0.1306 (yuan/kWH) and V P + 16 o P < 72 N P P , the power plants choose to build energy storage facilities. In Figure 5, this area corresponds to the point ( o P , V P ) within the scope of triangular ECF, which satisfies the evolutionary stable equilibrium condition of the point (1,1,0). On the contrary, the points in the range of polygon AEFDB satisfy the stable equilibrium condition of evolution at (0,1,0).
According to Equation (9), C P and T have the same impact depth as P P but in the opposite direction on energy storage cost. When P P increased by 0.01 (yuan/kWH), the corresponding V P and o P increased by 0.72 (yuan/kW) and 0.045 (yuan/kWH) respectively. When the feed-in tariff is extremely low, the profit margins of the power plants are squeezed. When Δ P P < 0 , power plants tend to choose the low-cost energy storage devices, such as lead carbon batteries. Faced with expensive energy storage technologies, power plants will choose not to build energy storage due to the cost burden. When Δ P P > 0 (yuan/kWH), power plants have a wider choice of energy storage technologies on the basis of profitability. For example, power plants with greater profit margins could opt for more cost-effective lithium-ion batteries.
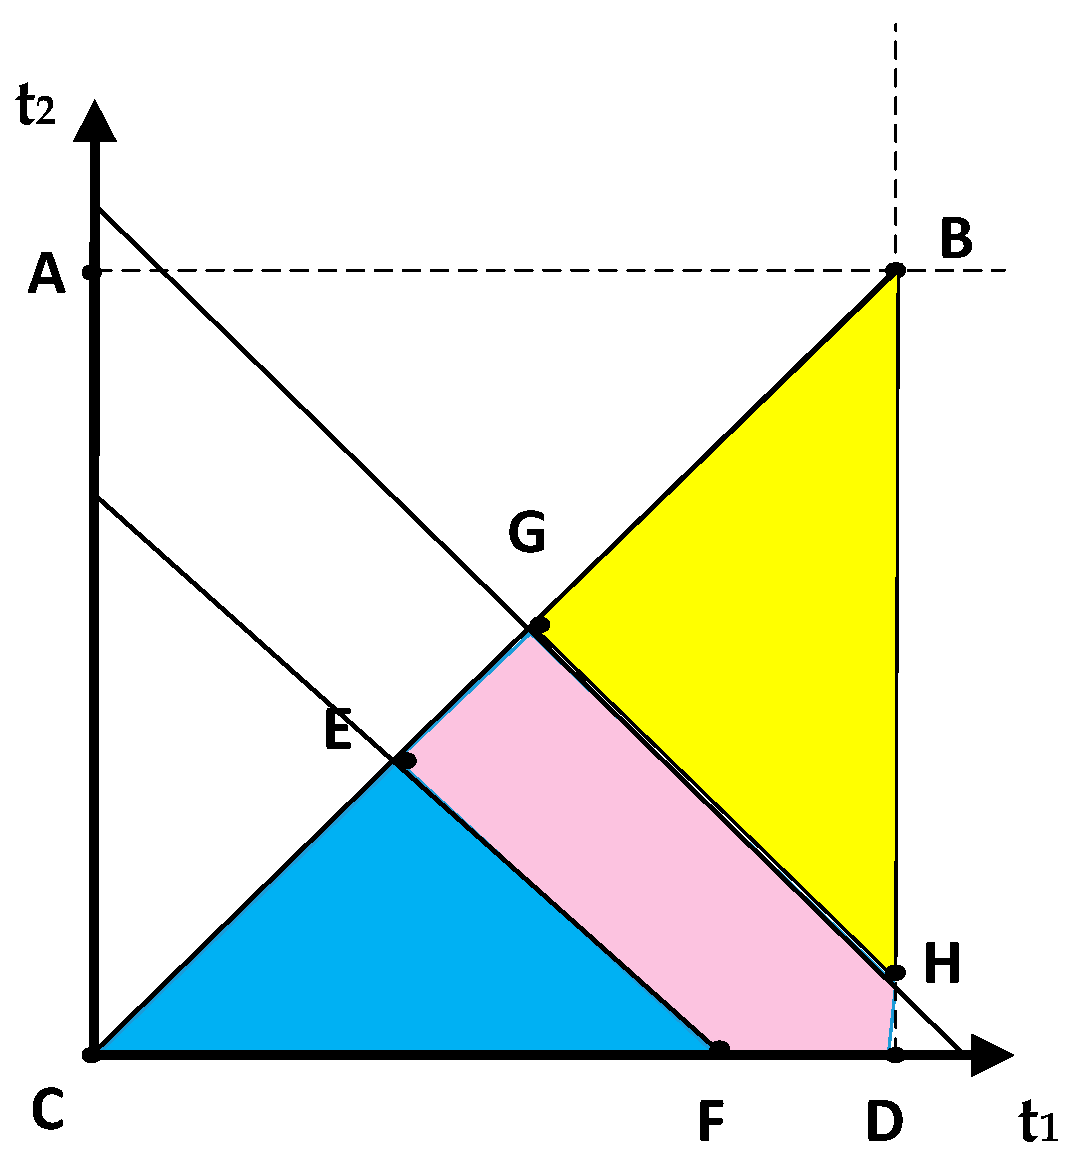
As shown in Table 5 and Table 6, energy storage charging and discharging time meets the basic conditions of t 1 , t 2 ( 0 , 12 ) . The corresponding points A ( 0 , 12 ), B (12,12), C (0,0), and D (12,0) are shown in Figure 6. Because the storage charging time must be longer than the discharge time, the corresponding range is inside the triangle BDC. Let θ = 3 and ϑ = 1.86 . Points E and F are the points where the line EF intersects the sides of the triangle BDC. The line EF satisfies the equation of 0.84 t 1 + 0.8 t 2 = 1.75 . In addition, the charging and discharging time of energy storage is also affected by the net profit. Points G and H are the points where the charge and discharge time constraint line GH related to N P P or N P G intersects the side of the triangle BDC. The line GH satisfies the equation of m t 1 + n t 2 = l . Points E and G are on the side of BC, and Points F and H are on the side of DB or DC. Point I is the intersection of line EF and line GH.
Based on Equation (26), we can obtain the conclusions of | ϵ N P P , t 1 | = | 24 θ ( P P C P T ) o P t 1 | > 1 and | ϵ N P P , t 2 | = | 24 θ ( P P C P T ) o P t 2 | > 1 . This means that the size of the net profit of the power plant has an impact on the choice of charging and discharging time for energy storage. When N P P increases by 0.01 (yuan/kWH), the charging and discharging time of energy storage will increase by 7.2 (h) correspondingly. This means that power grid companies are more willing to use energy storage facilities for longer periods if their profit margins increase. As shown in Table A3, when the   N P P is less than 0.055 (yuan/kWH), the charging and discharging time of energy storage greatly restricts the power plant from making profits. In other words, power plants will make the total charge and discharge time less than the average daily charge and discharge standard regulated by the government ( α ), which leads to subsidy cheating. When N P P is above 0.055 (yuan/kWH), power plants that choose to build energy storage facilities will have more charging and discharging time options. When the N P P of the power plants without subsidies can afford the energy storage construction cost, the power plant chooses to use energy storage in accordance with regulations, and the government ultimately chooses not to regulate it. When power plants need sufficient subsidies to cover the cost of energy storage, they are inclined to implement subsidy fraud. Facing widespread and serious subsidy fraud, the governments will ultimately choose to take regulatory measures.

4.2.2. The Influence of System Parameters of Power Grids on Adjustable Variables

For Equation (21), we assume the following sensibility indicators:
ϵ N P G , ϑ = Δ ϑ / ϑ Δ ( P G C G ) / ( P G C G )
ϵ N P G , V G = Δ V G / V G Δ ( P G C G ) / ( P G C G )
ϵ N P G , o G = Δ o G / o G Δ ( P G C G ) / ( P G C G )
ϵ N P G , t 1 o r   t 2 = Δ t 1 / t 1 + Δ t 2 / t 2 Δ ( P G C G ) / ( P G C G )
Based on Equation (27), we can obtain the conclusion of | ϵ N P G , ϑ | = | 24 ϑ ( P G C G ) V G + ( t 1 + t 2 ) o G | > 1 . This is in line with the economic law of lower prices and higher demand. As shown in Table A4, when N P G is within the range of   ( 0.195 , 0 )   (yuan/kWH), power grid enterprises of all electricity demand levels will not choose to add energy storage equipment after a long-term evolutionary game. Given that the enterprises themselves are struggling to make ends meet, adding storage rashly would only make the situation worse. When N P G is in the range of ( 0 ,   0.1 ) (yuan/kWH), power grids with small or even micro electricity demand from users will choose not to add energy storage devices. As the net profits ( N P G ) fall, the scales of the power grid enterprises must be increased to afford the store energy devices. When N P G is less than 0.01 ( MWH ) , only the super-large-scale power grids enterprises can afford it. When N P G is in the range of ( 0.1 ,   1.05 ) (yuan/kWH), the power grid enterprises with a medium-or-higher-scale electricity demand will choose to build energy storage after long-term evolution. As N P G rises, energy storage becomes affordable for some small or even micro power grid enterprises. We can conclude that, if the profit margins of the power grid enterprises shrink slightly, the electricity demand of power grid enterprises will largely increase.
Based on Equations (28) and (29), we can obtain the conclusions of ϵ N P G , V G = | 24 ϑ ( P G C G ) V G | > 1 and ϵ N P G , o G = | 24 ϑ ( P G C G ) o G ( t 1 + t 2 ) | > 1 .
The energy storage costs of power grid enterprises include operating costs and construction costs. Based on the basic settings in Figure 5, we set ϑ equal to 1.86 . Points E and F are the intersections where the line intersects the sides of the rectangle ABDC, as shown in Figure 7. The line EF satisfies the equation of V G + 16 o G = 44.67 N P G . With different values of N P G , the corresponding coordinates of Points E and F change, as shown in Table A5.
When N P G is within the range of ( 0.195 , 0.05149 ) (yuan/kWH), power grid enterprises have difficulty in making profits. Facing the energy storage cost of o G ( 0.05 ,   0.15 ) (yuan/kWH) and V G ( 1.5 ,   7 ) (yuan/kW), the power grid enterprises choose not to add energy storage facilities. When   N P G is within the range of (0.05149, 0.21) (yuan/kWH), the profits of power grid enterprises can cover several types of energy storage technologies. If the power grid enterprises can make profits after adding energy storage, the power grid enterprises ultimately choose to build energy storage. On the contrary, if the energy storage cost cannot be paid, power grid enterprises ultimately choose not to add energy storage. When   N P G is within the range of ( 0.21 , 0.7 )   (yuan/kWH), all power grid enterprises can make profits with energy storage construction. Therefore, they ultimately choose to add energy storage equipment. To be more specific, when sales price P G increased by 0.01 (yuan/kWH), the corresponding costs of V G and o G increased by 0.446 (yuan/kW) and 0.2792 (yuan/kWH). For example, grid companies with greater profit margins prefer lithium batteries than lead-acid storage batteries.
Based on Equation (30), we can obtain | ϵ N P P , t 1 | = | 24 ϑ ( P G C G ) o G t 1 | > 1 and | ϵ N P P ,   t 2 | = | 24 ϑ ( P G C G ) o G t 2 | > 1 . We assume that ϑ = 1.86 . When N P G is increased by 0.01 (yuan/kWH), the corresponding charging and discharging time of energy storage both increase by 4.46 (h). This means that power grid enterprises are more willing to use energy storage facilities for a longer period if their profit margins increase.
As shown in Figure 6 and Table A6, when the net profits of the power grid enterprises are less than 0.09 (yuan/kWH), the profit space is too small to cover the operation of energy storage. Thus, the power grid enterprises tend to shorten the charging and discharging time and choose to cheat subsidies. When the net profits of the power grid enterprises are more than 0.09 (yuan/kWH), the power grid enterprises would have enough net profits to cover the energy storage costs. Power grid enterprises will choose the compliant use of the energy storage facilities. The government will choose not to regulate them. When power grid enterprises have to rely on government subsidies to build energy storage, power grid enterprises will implement subsidy fraud, and the government will ultimately choose regulation.

4.2.3. The Influence of System Parameters of Governments on Adjustable Variables

Based on Equation (22), we assume the sensibility indicators as per Equations (31)–(38).
ϵ s P ,   t 1 = Δ t 1 / t 1 Δ s P / s P
ϵ s P ,   t 2 = Δ t 2 / t 2 Δ s P / s P
ϵ s G ,   t 1 = Δ t 1 / t 1 Δ s G / s G
ϵ s G ,   t 2 = Δ t 2 / t 2 Δ s G / s G
ϵ r ,   t 1 = Δ t 1 / t 1 Δ r / r
ϵ r ,   t 2 = Δ t 2 / t 2 Δ r / r
ϵ T 0 ,   t 1 = Δ t 1 / t 1 Δ T 0 / T 0
ϵ T 0 ,   t 2 = Δ t 2 / t 2 Δ T 0 / T 0
From Equations (31)–(34), we can obtain the conclusions of | ϵ s P ,   t 1 | = | A α s P A t 1 s P + B t 1 s G + C g o v ( A + B ) t 1 + T 0 A t 1 | < 1 , | ϵ s P ,   t 2 | = | A α s P A t 2 s P + B t 2 s G + C g o v ( A + B ) t 2 | < 1 , | Δ t 1 / t 1 Δ s G / s G | = | B β s G A t 1 s P + B t 1 s G + C g o v ( A + B ) t 1 + T 0 A t 1 | < 1 , and | Δ t 2 / t 2 Δ s G / s G | = | B β s G A t 2 s P + B t 2 s G + C g o v ( A + B ) t 2 | < 1 . This means that, when the regulatory intensity coefficient of the governments for power enterprises changes, including subsidy and penalty coefficient, insignificant impacts are made on the average daily charging and discharging time of energy storage built by the power plants or added by the power grids.
Similarly, from Equations (35) and (36), we can obtain the conclusions of | Δ t 1 / t 1 Δ r / r | = | A + B A t 1 s P + B t 1 s G + C g o v ( A + B ) t 1 + T 0 A t 1 | < 1 and | Δ t 2 / t 2 Δ r / r | = | A + B A t 2 s P + B t 2 s G + C g o v ( A + B ) t 2 | < 1 . This means that the government’s subsidies for energy storage construction costs ( r ) has a limited influence on the charging and discharging time of energy storage for the electricity enterprises.
Based on Equations (37) and (38), we can obtain the conclusions of | Δ t 1 / t 1 Δ T 0 / T 0 | = | A t 1 T 0 A t 1 s P + B t 1 s G + C g o v ( A + B ) t 1 + T 0 A t 1 | < 1 and | Δ t 2 / t 2 Δ T 0 / T 0 | = | A t 1 T 0 A t 2 s P + B t 2 s G + C g o v ( A + B ) t 2 | < 1 , and we can also conclude that the carbon tax exemption, implemented by the government for the energy storage construction in the power plants, has limited impacts on the charging and discharging duration choices of energy storage in power plants.
In conclusion, the charging and discharging duration of energy storage is not sensitive to the subsidy factors and standards factors determined by governments. Due to the limited influence, incentives and supporting policies are required to stimulate a greater use of energy storage for power plants and power grids. Therefore, it is more effective to stimulate the promotion of store energy by boosting the profit margin instead of government interference.

4.2.4. Summary of the Influence of System Parameters

An evolutionary stable equilibrium point corresponds to a stable equilibrium strategy portfolio, which is determined by different assignment ranges of adjustable variables. In a certain region, the system parameters are unchanged; thus, the evolutionary stable equilibrium point is obtained with the adjustable variables scoped to certain ranges.
The adjustable variables of power plants and power grids are influenced by their system parameters, including the influence of P P , C P , and T on P , t 1 , t 2 , V P , and o P and the impacts of P G and C G on D , t 1 , t 2 , V G , and o G .
According to the National Bureau of Statistics, the actual situations of the main regional electricity markets are shown in Table 9. System parameters are determined by the characteristics of regional electricity markets. Different regions have their own range of system parameters, which limits the adjustable variables to a certain range to form another evolutionary stable equilibrium point. Thus, in the period of energy storage technologies access to the electricity markets, it is of practical value to study the regional disparities on the choices of building energy storage projects for both power plants and power grids.
To be specific, many large-scale thermal power plants are built in East China, North China, and South China. On the one hand, provinces such as Guangdong and Jiangsu have developed an industrial economy, so that large industrial electricity consumption needs to be guaranteed by large-scale power plants. On the other hand, provinces such as Shanxi have rich coal resources, which is suitable for supplying fuels for large coal-fired power plants.
The setting of each regional electricity market is basically quantified in Table 9. Thus, the corresponding parameters of each regional power market can be found in Table 7 and Appendix B and Appendix C. Based on the factors of each region including electricity price, generation capacity, and demand condition, we can make the following classification and analysis corresponding to the findings above. The results can be summarized in Table 10.
(1)
In the Eastern China, Middle-China, and Southern China electricity market, the power plants and power grids enterprises on a greater-than-large scale will choose to build energy storage. Due to the relatively higher electricity price and thus the abundant net profit, they will use the energy storage facilities in compliance. Thus, the provincial government will choose not to regulate. The situation meets the condition of the equilibrium point (1,1,0).
(2)
In the northeast of China, power plants of a medium-or-lower scale will choose not to build energy storage, because the on-grid price is set relatively low in some underdeveloped areas to cover the cost of daily operation. However, faced with relatively high electricity sale prices, small power grid enterprises can make enough profit to afford to add and properly use energy storage. The government will choose not to regulate. These regions conform to the stable condition of the equilibrium point (0,1,0).
(3)
In the Northern China electricity market, only the power plants on a greater-than-large scale can afford to build energy storage due to the low net profits. Meanwhile, the power grids on a greater-than-medium scale will choose to add energy storage, because some economically developed areas, such as Beijing and Tianjin, have relatively high electricity sale prices and thus make high profits. Thus, the provincial government will choose not to regulate after a long-term evolution, meeting the condition of the equilibrium point (1,1,0).
(4)
In the Western China electricity market, the power plants and power grids on a less-than-small scale cannot afford to build energy storage due to the low price in Table 9 and thus the meager net profits. In particular, when the cost of energy storage projects is not included in the price of electricity, these regions cannot make more profit by increasing electricity prices. Therefore, there is no need for the government to regulate, which meets the condition of the equilibrium point (0,0,0).
To sum up, the electricity market characteristics of each region are shown through system parameters. Based on the different system parameter ranges, power enterprises can obtain different stable strategy sets via an evolutionary game, and governments can propose supervision or non-supervision policies accordingly.
Applying the influence analysis of system parameters to the reality, the findings can be analyzed by thinking in the opposite direction. If the development plan of a certain place tends to achieve the goal of energy storage popularization, it needs to adjust the local power industry structure with targeted craft. For example, in East China, where there are many large-scale electric power enterprises, the Industry-University-Research policy supports the development of the energy storage technology. Hence, the reduced technology costs and relaxed threshold of punishment can effectively encourage power plants and power grid enterprises to actively build energy storage.
5. Conclusions

In conclusion, this paper uses the trilateral evolutionary game model to study energy storage access to electricity markets with regard to regional disparities. We can obtain the following conclusions based on the above analysis:
(1)
On the path of evolution toward stability, the role of “advanced imitator” changes under certain conditions. In the process of stabilization for the power plant and the power grid, there is a shift of the role of “advanced imitator”, who leads the sharp proportional increase in energy storage construction choices. When the proportion of one strategy on one side increased enough, the other side will imitate that strategy on a large scale, until an evolutionary stable state is reached.
(2)
An evolutionary stable equilibrium point corresponds to a stable equilibrium strategy portfolio, which is determined by different assignment ranges of adjustable variables. Adjustable variables of power plants and power grids are influenced by their system parameters. System parameters are determined by the characteristics of regional electricity markets. Different regions have their own range of system parameters. Thus, different real electricity market situations correspond to different evolutionary stable equilibrium points. The equilibrium conditions of the equilibrium point (1,1,0) are applicable to medium- and large-scale electricity markets in Eastern China, Middle China, and Southern China. Additionally, the conditions of power plants of a greater-than-large scale and power grids of a greater-than-medium scale in the Northern China electricity market meet the equilibrium point (1,1,0). The power plants of a medium and small scale and the small power grids in the northeast of China are suitable for the strategic portfolio of (0,1,0). The stable conditions of the equilibrium point (0,0,0) are appropriate for power plants and power grids of a less-than-small scale in the Western China electricity market.
(3)
The impacts of government policy on adjustable variables are weakened due to the interaction mechanism of the electricity market. Government subsidies require substantial input to achieve a small visible promotion effect. This strategy is likely to backfire for small power companies. Therefore, the subsidy strategy of governments should be carefully set, and a system of fines can, to some extent, prevent cheating.
(4)
To achieve the expected goal of increasing the application of energy storage, some parameters can be directed to specific ranges. The behaviors of power enterprises are closely related to electricity prices and costs. The penetration of energy storage technology can be effectively promoted by appropriately raising electricity prices and implementing cost reduction strategies.
Based on the above conclusions, we make the following suggestions for regional policymakers:
(1)
For large-scale electricity markets in Eastern China, Middle China, and Southern China, it is generally possible to build energy storage and make a profit without government subsidies. Through moderate market competition, stable and reasonable electricity prices can be obtained to ensure that the income of medium-scale enterprises can afford energy storage. Therefore, the provincial governments only need to provide basic supervision and leave enough space for market development independently of energy storage.
(2)
For the Northern China electricity market, in addition to the further closure of smaller plants, helping establish a reasonable energy storage compensation mechanism and regulating the auxiliary electricity market to play its due role should be on the agenda for the governments. Thus, given that the cost of energy storage projects is not included in the price of electricity, it is necessary to stimulate market activity through greater subsidies to ensure profitability.
(3)
For the Western China electricity market, adding energy storage is inappropriate for electricity enterprises of all scales at the present stage. The most urgent task for provincial governments is to encourage energy storage technologies. By reducing energy storage construction and operation costs, electricity enterprises can afford energy storage. The next step is to promote the popularization of energy storage technology and improve power consumption efficiency.
(4)
To popularize the goal of energy storage, regional electricity market plans need to be formulated based on its own conditions. A suitable range of external conditions would provide a more efficient and proper path towards adding energy storage.
The evolutionary game model can be used to describe in detail the revenue situation and strategy selection trends considering energy storage of key players in different electricity markets. Analyzing the conditions of different electricity markets can effectively calculate an applicable scope of parameters for an equilibrium strategy. Analysis based on the trilateral evolutionary game and the replicator dynamic equation model proposed in this paper has been shown to be useful in exploring the high-quality development of the electricity industry.
Limited by the time and length, the authors of this paper did not subdivide the electricity price and other parameters for more accurate results. Based on the conclusions in this manuscript, further research will focus on the impacts of adding energy storage on other electricity market participants, such as the changes in consumer welfare under different sales price levels.

Author Contributions

T.Z.: methodology, visualization, and writing of the original draft. L.P.: review and editing. S.C. and C.Z.: preliminary investigations. All authors have read and agreed to the published version of the manuscript.

Funding

This research received funding from the National Natural Science Foundation of China (Program NO. 71704110).

Acknowledgments

The authors gratefully acknowledge support from the National Natural Science Foundation of China (Program NO. 71704110).

Conflicts of Interest

The authors declare that there are no conflicts of interest.

Appendix A. The Detailed Calculation Process of the Replicator Dynamics Equation to Solve the Equilibrium of the Evolutionary Game

The specific calculation process of the trilateral evolutionary game equilibrium in the third section is as follows.
According to the premises in the second section, the choices of the power plant include the construction of an energy storage system and the non-construction of an energy storage system, with probabilities of x and ( 1 x ), respectively. We can determine the expected benefits of power plants choosing to build and those choosing not to build energy storage systems with Equations (A1) and (A2).
I P 1 = y z [ ( P P C P T ) ( D + A t 1 + B t 1 A t 2 B t 2 ) + T 0 A t 1 ( V P r ) A ( A t 1 + A t 2 ) o P + ( A t 1 + A t 2 A α ) s P ] + ( 1 y ) z [ ( P P C P T ) ( D + A t 1 A t 2 ) + T 0 A t 1 ( V P r ) A ( A t 1 + A t 2 ) o P + ( A t 1 + A t 2 A α ) s P ] + y ( 1 z ) [ ( P P C P T ) ( D + A t 1 + B t 1 A t 2 B t 2 ) V P A ( A t 1 + A t 2 ) o P ] + ( 1 y ) ( 1 z ) [ ( P P C P T ) ( D + A t 1 A t 2 ) V P A ( A t 1 + A t 2 ) o P ]
I P 2 = y z [ ( P P C P T ) ( D + B t 1 B t 2 ) ] + ( 1 y ) z [ ( P P C P T ) D ] + y ( 1 z ) [ ( P P C P T ) ( D + B t 1 B t 2 ) ] + ( 1 y ) ( 1 z ) [ ( P P C P T ) D ]
Accordingly, the average expected return of a power plant is calculated using Equation (A3).
I ¯ P =   x I P 1 + ( 1 x ) I P 2
Thus, the replicator dynamic equation of the power plants is shown in Equation (A4).
F ( x ) = x t = x ( I P 1 I ¯ P ) = x ( 1 x ) ( I P 1 I P 2 ) = x ( 1 x ) { ( P P C P T ) [ D + A t 1 A t 2 + y ( B t 1 B t 2 ) ] + z T 0 A t 1 ( V P z r ) A ( A t 1 + A t 2 ) o P + z ( A t 1 + A t 2 A α ) s P }
The choices of power grid enterprises include the construction of an energy storage system and the non-construction of an energy storage system. The selection probability of the two strategies is y and ( 1 y ) , respectively. Similarly, we can further calculate the expected benefits of grids choosing to build and those choosing not to build energy storage systems in Equations (A5) and (A6)
I G 1 = x z [ ( P G C G ) ( P A t 1 B t 1 + A t 2 + B t 2 ) o G ( B t 1 + B t 2 ) ( 1 r ) V G B + ( B t 1 + B t 2 B β ) s G ] + ( 1 x ) z [ ( P G C G ) ( P B t 1 + B t 2 ) o G ( B t 1 + B t 2 ) ( 1 r ) V G B + ( B t 1 + B t 2 B β ) s G ] + x ( 1 z ) [ ( P G C G ) ( P A t 1 B t 1 + A t 2 + B t 2 ) o G ( B t 1 + B t 2 ) V G B ] + ( 1 x ) ( 1 z ) [ ( P G C G ) ( P B t 1 + B t 2 ) o G ( B t 1 + B t 2 ) V G B ]
I G 2 = x z [ ( P G C G ) ( P A t 1 + A t 2 ) ] + ( 1 x ) z [ ( P G C G ) P ] + x ( 1 z ) [ ( P G C G ) ( P A t 1 + A t 2 ) ] + ( 1 x ) ( 1 z ) [ ( P G C G ) P ]
Accordingly, the average expected return of a power grid is calculated using Equation (A7).
I ¯ G =   y I G 1 + ( 1 y ) I G 2
Thus, the replicator dynamic equation of the power grids is shown in Equation (A8).
F ( y ) = y t = y ( I G 1 I ¯ G ) = y ( 1 y ) ( I G 1 I G 2 ) = y ( 1 y ) { ( P G C G ) [ P B t 1 + B t 2 x ( A t 1 A t 2 ) ] ( V G z r ) B o G ( B t 1 + B t 2 ) + z ( B t 1 + B t 2 B β ) s G }
According to the assumption, the probabilities of a government choosing to regulate and a government choosing not to regulate the energy storage construction of power plants and power grids are z and ( 1 z ) , respectively. We can calculate the expected revenue of the government under the two scenarios, respectively.
I z 1 = x y [ C g o v ( A t 1 + B t 1 + A t 2 + B t 2 ) r ( A + B ) ( A t 1 + A t 2 A α ) s P ( B t 1 + B t 2 B β ) s G + T ( D + A t 1 + B t 1 A t 2 B t 2 ) T 0 A t 1 ] + x ( 1 y ) [ C g o v ( A t 1 + A t 2 ) C g o v ( B t 1 + B t 2 ) r A ( A t 1 + A t 2 A α ) s P + T ( D + A t 1 A t 2 ) T 0 A t 1 ] + ( 1 x ) y [ C g o v ( B t 1 + B t 2 ) C g o v ( A t 1 + A t 2 ) r B ( B t 1 + B t 2 B β ) s G + T ( D + B t 1 B t 2 ) ] + ( 1 x ) ( 1 y ) [ C g o v ( A t 1 + B t 1 + A t 2 + B t 2 ) + T D ]
I z 2 = x y [ T ( D + A t 1 + B t 1 A t 2 B t 2 ) ] + x ( 1 y ) T ( D + A t 1 A t 2 ) + ( 1 x ) y T ( D + B t 1 B t 2 ) + ( 1 x ) ( 1 y ) T D
According to Equations (A9) and (A10), the average expected revenue of the government can be obtained, as shown in Equation (A11).
I ¯ z = z I z 1 + ( 1 z ) I z 2
The replicator dynamic equations of the governments are shown in Equation (A12).
F ( z ) = z t = z ( I z 1 I ¯ z ) = z ( 1 z ) ( I z 1 I z 2 ) = [ C g o v ( A t 1 + B t 1 + A t 2 + B t 2 ) x r A x T 0 A t 1 y r B x ( A t 1 + A t 2 A α ) s P y ( B t 1 + B t 2 B β ) s G ]

Appendix B. The Effect of Net Profit of Power Plants on the Adjustable Variables

Table A1. Influence of N P P on the power generation decisions of power plants.
P (0,0,0)(0,1,0)(1,0,0)(1,1,0)
N P P
0.085 ~ 0.001 P < 490 MWH 490 < P < 24 , 000   MWH
0.01 P < 490 MWH 490 < P < 4600 MWH 4600 < P < 24 , 000 MWH
0.035 P < 490 MWH 490 < P < 1314 MWH P > 1314 MWH
0.045 P < 490 MWH 490 < P < 1022 MWH P > 1022 MWH
0.055 P < 490 MWH 490 < P < 836 MWH P > 836 MWH
0.065 P < 490 MWH 490 < P < 708 MWH P 708 MWH
0.075 P < 490 MWH 490 < P < 613 MWH P > 613 MWH
0.085 P < 490 MWH 490 < P < 541 MWH P > 541 MWH
0.09 P < 490 MWH 490 < P < 511 MWH P > 511 MWH
0.095 P < 490 MWH P > 510 MWH
0.105 P < 468 MWH 468 < P < 510 MWH P > 510 MWH
0.115 P < 430 MWH 430 < P < 510 MWH P > 510 MWH
0.13 P < 384 MWH 384 < P < 510 MWH P > 510 MWH
Table A2. Influence of N P P on energy storage selection in power plants.
( o P , V P ) (1,1,0)(0,1,0)
N P P
0.085 ~ 0.0319 ( o P , V P ) { ( o P , V P ) | 1.5 < V P < 7 , 0.05 < o P < 0.15 }
0.032The point ( o P , V P ) is inside the triangle CEF, C (0.05,1.5), E (0.05,1.504), F (0.5025,1.5)The point is inside the pentagon ABDFE, A (0.05,7), B (0.15,7), D (0.15,1.5), E (0.05,1.504), F (0.5025,1.5)
0.035The point ( o P , V P ) is inside the triangle CEF, C (0.05,1.5), E (0.05,1.72), F (0.06375,1.5)The point is inside the pentagon ABDFE, A (0.05,7), B (0.15,7), D (0.15,1.5), E (0.05,1.72), F (0.06375,1.5)
0.045 The point ( o P , V P ) is inside the triangle CEF, C (0.05,1.5), E (0.05,2.44), F (0.10875,1.5)The point is inside the pentagon ABDFE, A (0.05,7), B (0.15,7), D (0.15,1.5), E (0.05,2.44), F (0.10875,1.5)
0.055The point ( o P , V P ) is inside the quadrilateral CEFD, C (0.05,1.5), E (0.05,3.16), F (0.15,1.56), D (0.15,1.5)The point ( o P , V P ) is inside the quadrilateral ABEF, A (0.05,7), B (0.15,7), E (0.05,3.16), F (0.15,1.56)
0.065The point ( o P , V P ) is inside the quadrilateral CEFD, C (0.05,1.5), E (0.05,3.88), F (0.15,2.28), D (0.15,1.5)The point ( o P , V P ) is inside the quadrilateral ABEF, A (0.05,7), B (0.15,7), E (0.05,3.88), F (0.15,2.28)
0.075The point ( o P , V P ) is inside the quadrilateral CEFD, C (0.05,1.5), E (0.05,4.6), F (0.15,3), D (0.15,1.5)The point ( o P , V P ) is inside the quadrilateral ABEF, A (0.05,7), B (0.15,7), E (0.05,4.6), F (0.15,3)
0.085The point ( o P , V P ) is inside the quadrilateral CEFD, C (0.05,1.5), E (0.05,5.32), F (0.15,3.72), D (0.15,1.5)The point ( o P , V P ) is inside the quadrilateral ABEF, A (0.05,7), B (0.15,7), E (0.05,5.32), F (0.15,3.72)
0.095The point ( o P , V P ) is inside the quadrilateral CEFD, C (0.05,1.5), E (0.05,6.04), F (0.15,4.44), D (0.15,1.5)The point ( o P , V P ) is inside the quadrilateral ABEF, A (0.05,7), B (0.15,7), E (0.05,6.04), F (0.15,4.44)
0.105The point ( o P , V P ) is inside the quadrilateral CEFD, C (0.05,1.5), E (0.05,6.76), F (0.15,5.16), D (0.15,1.5)The point ( o P , V P ) is inside the quadrilateral ABEF, A (0.05,7), B (0.15,7), E (0.05,6.76), F (0.15,5.16)
0.115The point is inside the pentagon CAEFD, C (0.05,1.5), A (0.05,7), E (0.08,7), F (0.15,5.88), D (0.15,1.5)The point ( o P , V P ) is inside the triangle BEF, B (0.15,7), E (0.08,7), F (0.15,5.88),
0.13The point is inside the pentagon CAEFD, C (0.05,1.5), A (0.05,7), E (0.1475,7), F (0.15,6.96), D (0.15,1.5)The point ( o P , V P ) is inside the triangle BEF, B (0.15,7), E (0.1475,7), F (0.15,6.96)
Table A3. Influence of N P P on energy storage charging and discharging time decisions in power plants.
( t 1 , t 2 ) (1,1,0)(1,1,1)
N P P
−0.085~0.055The point ( t 1 , t 2 ) is inside the quadrilateral EFHG, E (1.06707,1.06707), F (2.08333,0), G (4.8,4.8), H (9.6,0)
0.0573The point ( t 1 , t 2 ) is inside the quadrilateral EFHG, E (1.06707,1.06707), F (2.08333,0), G (5.628,5.628), H (11.256,0)The point ( t 1 , t 2 ) is inside the triangle HFI, F (2.08333,0), H (2.081333,0), I (2.07667,0.007)
0.065The point ( t 1 , t 2 ) is inside the pentagon EFDHG, D (12,0), E (1.06707,1.06707), F (2.08333,0), G (8.4,8.4), H (12,4.8)The point ( t 1 , t 2 ) is inside the quadrilateral EFHG, E (1.06707,1.06707), F (2.08333,0), G (0.14,0.14), H (0.23333,0)
0.066The point ( t 1 , t 2 ) is inside the pentagon EFDHG, D (12,0), E (1.06707,1.06707), F (2.08333,0), G (8.76,8.76), H (12,5.52)The point ( t 1 , t 2 ) is inside the triangle CEF, C (0,0), E (1.06707,1.06707), F (2.08333,0)
0.075The point ( t 1 , t 2 ) is inside the quadrilateral EFDB, B (12,12), D (12,0), E (1.06707,1.06707), F (2.08333,0)The point ( t 1 , t 2 ) is inside the triangle CEF, C (0,0), E (1.06707,1.06707), F (2.08333,0)
0.075~0.13The point ( t 1 , t 2 ) is inside the quadrilateral EFDB, B (12,12), D (12,0), E (1.06707,1.06707), F (2.08333,0)The point ( t 1 , t 2 ) is inside the triangle CEF, C (0,0), E (1.06707,1.06707), F (2.08333,0)

Appendix C. The Effect of Net Profit of Power Grids on the Adjustable Variables

Table A4. Influence of N P G on electricity demand of power grid enterprises.
D (0,0,0)(0,1,0)(1,0,0)(1,1,0)
N P G
0.19 ~0 D   <   687.69 MWH 687.69   <   D   <   24 , 000   MWH
0.007 D   <   687.69 MWH 687.69   <   D   <   10 , 000   MWH 10 , 000   <   D   <   24 , 000 MWH
0.01 D   <   687.69 MWH 687.69   <   D   <   6950   MWH D   >   6950   MWH
0.05 D   <   687.69 MWH 687.69   <   D   <   1430   MWH D   >   1430 MWH
0.07 D   <   687.69 MWH 687.69   <   D   <   1035.71   MWH D   >   1035.71   MWH
0.09 D   <   687.69 MWH 687.69   <   D   <   766.67   MWH D   >   766.67 MWH
0.1 D   <   670   MWhMWH D   >   690   MWhMWH
0.11 D   <   607.27   MWhMWH 607.27   <   D   <   657.69   MWhMWH D   >   657.69   MWhMWH
0.12 D   <   555 MWhMWH 555   <   D   <   657.69 MWhMWH D   >   657.69 MWhMWH
0.13 D   <   510.77   MWhMWH 510.77   <   D   <   657.69 MWHMWh D   >   657.69   MWhMWH
0.14 D   <   472.85   MWhMWH 472.85   <   D   <   657.69   MWhMWH D   >   657.69   MWhMWH
0.15 D \   < \   440 \   MWhMWH 440   <   D   <   657.69 MWhMWH D   >   657.69 MWhMWH
0.2 D   <   325   MWhMWH 325   <   D   <   657.69 MWhMWH D   >   657.69   MWhMWH
0.3 D   <   210   MWhMWH 210   <   D   <   657.69 MWhMWH D   >   657.69   MWhMWH
0.4 D   <   152.5   MWhMWH 152.5   <   D   <   657.69 MWhMWH D   >   657.69   MWhMWH
0.5 D   <   118   MWhMWH 118   <   D   <   657.69 MWhMWH D   >   657.69   MWhMWH
1.05 D   <   45.17   MWhMWH 45.17   <   D   <   657.69 MWhMWH D   >   657.69   MWhMWH
Table A5. Influence of N P G on the energy storage cost decisions of power grid enterprises.
( o G , V G ) (1,1,0)(0,0,0)
N P G
0.195 ~0.05149 ( o G , V G ) { ( o G , V G ) | 1.5 < V G < 7 , 0.05 < o G < 0.15 }
0.0515 The point ( o G , V G ) is inside the triangle CEF, C (0.05,1.5), F (0.05002,1.5), E (0.05,1.5003)The point ( o G , V G ) is inside the pentagon ABDFE, A (0.05,7), B (0.15,7), D (0.15,1.5), F (0.05431,1.5), E (0.05,1.569)
0.06The point ( o G , V G ) is inside the triangle CEF, C ( 0.05 , 1.5 ) ,   F ( 0.07375 , 1.5 ) ,   E ( 0.05 , 1.88 ) The point ( o G , V G ) is inside the pentagon ABDFE, A (0.05,7), B (0.15,7), D (0.15,1.5), F (0.7875,1.5), E (0.05,1.96)
0.08The point ( o G , V G ) is inside the triangle CEF, C (0.05,1.5), F (0.129583,1.5), E (0.05,2.7733)The point ( o G , V G ) is inside the pentagon ABDFE, A (0.05,7), B (0.15,7), D (0.15,1.5), F (0.13625,1.5), E (0.05,2.88)
0.09The point ( o G , V G ) is inside the quadrilateral CDFE, C ( 0.05 , 1.5 ) , D (0.15,1.5), F (0.15,1.62), E (0.05,3.22)The point ( o G , V G ) is inside the quadrilateral ABFE, A (0.05,7), B (0.15,7), F (0.15,1.74), E (0.05,3.34)
0.1The point ( o G , V G ) is inside the quadrilateral CDFE, C ( 0.05 , 1.5 ) , D (0.15,1.5), F (0.15,2.067), E (0.05,3.6667)The point ( o G , V G ) is inside the quadrilateral ABFE, A (0.05,7), B (0.15,7), F (0.15,2.2), E (0.05,3.8)
0.12The point ( o G , V G ) is inside the quadrilateral CDFE, C (0.05,1.5), D (0.15,1.5), F (0.15,2.96), E (0.05,4.56)The point ( o G , V G ) is inside the quadrilateral ABFE, A (0.05,7), B (0.15,7), F (0.15,3.12), E (0.05, 4.72)
0.14The point ( o G , V G ) is inside the quadrilateral CDFE, C (0.05,1.5), D (0.15,1.5), F (0.15,3.8533), E (0.05,5.4533)The point ( o G , V G ) is inside the quadrilateral ABFE, A (0.05,7), B (0.15,7), F (0.15,4.04), E (0.05, 5.64)
0.15The point ( o G , V G ) is inside the quadrilateral CDFE, C (0.05,1.5), D (0.15,1.5), F (0.15,4.3), E (0.05, 5.9)The point ( o G , V G ) is inside the quadrilateral ABFE, A (0.05,7), B (0.15,7), F (0.15,4.5), E (0.05, 6.1)
0.16The point ( o G , V G ) is inside the quadrilateral CDFE, C (0.05,1.5), D (0.15,1.5), F (0.15,4.7467), E (0.05, 6.3467)The point ( o G , V G ) is inside the quadrilateral ABFE, A (0.05,7), B (0.15,7), F (0.15,4.96), E (0.05,6.56)
0.18The point ( o G , V G ) is inside the pentagon CDFEA, C (0.05,1.5), D (0.15,1.5), F (0.15,5.64), E (0.065,7), A (0.05,7)The point ( o G , V G ) is inside the triangle BEF, B (0.15,7), F (0.15,5.88), E (0.08, 7)
0.2The point ( o G , V G ) is inside the pentagon CDFEA, C (0.05,1.5), D (0.15,1.5), F (0.15,6.5333), E (0.12083,7), A (0.05,7)The point ( o G , V G ) is inside the triangle BEF, B (0.15,7), F (0.15,6.8), E (0.1375, 7)
0.21The point ( o G , V G ) is inside the pentagon CDFEA, C (0.05,1.5), D (0.15,1.5), F (0.15,6.98), E (0.14875,7), A (0.05,7)
0.22~0.7 ( o G , V G ) { ( o G , V G ) | 1.5 < V G < 7 , 0.05 < o G < 0.15 }
Table A6. Influence of N P G on energy storage charging and discharging time decisions of power grid enterprises.
( t 1 , t 2 ) ( 1 , 1 , 0 ) (1,1,1)
N P G
0.195~0.0719The point ( t 1 , t 2 ) is inside the triangle IFH
0.07195The point ( t 1 , t 2 ) is inside the triangle IFH, F (2.08333,0), E (1.06707,1.06707), G (1.06883,1.06883), H (2.13767,0)
0.08The point ( t 1 , t 2 ) is inside the quadrilateral FEGH, F (2.08333,0), E (1.06707,1.06707), G (2.8667,2.8667), H (5.7333,0)
0.0940The point ( t 1 , t 2 ) is inside the quadrilateral FEGH, F (2.08333,0), E (1.06707,1.06707), G (5.9933,5.9933), H (11.98667,0)
0.0970The point   ( t 1 , t 2 )   is inside the pentagon DFEGH, D (12,0), F (2.08333,0), E (1.06707,1.06707), G (6.66333,6.66333), H (12,1.32667)The point ( t 1 , t 2 ) is inside the triangle EGI, F (2.08333,0), G (1.0433,1.0433), I (2.01667.0.07)
0.1The point   ( t 1 , t 2 )   is inside the pentagon DFEGH, D (12,0), F (2.08333,0), E (1.06707,1.06707), G (7.3333,7.3333), H (12,2.6667)The point ( t 1 , t 2 ) is inside the quadrilateral FEGH, F (2.08333,0), E (1.06707,1.06707), G (0.70833,0.70833), H (1.41667,0)
0.11The point   ( t 1 , t 2 )   is inside the pentagon DFEGH, D (12,0), F (2.08333,0), E (1.06707,1.06707), G (9.5667,9.5667), H (12,7.13)The point ( t 1 , t 2 ) is inside the triangle CEF, C (0,0), E (1.06707,1.06707), F (2.08333,0)
0.12The point   ( t 1 , t 2 ) is inside the pentagon DFEGH, D (12,0), F (2.08333,0), E (1.06707,1.06707), G (11.8,11.8), H (12,11.6)The point ( t 1 , t 2 ) is inside the triangle CEF, C (0,0), E (1.06707,1.06707), F (2.08333,0)
0.13The point ( t 1 , t 2 ) is inside the quadrilateral BDFE, B (12,12), D (12,0), F (2.08333,0), E (1.06707,1.06707)The point ( t 1 , t 2 ) is inside the triangle CEF, C (0,0), E (1.06707,1.06707), F (2.08333,0)
0.14The point ( t 1 , t 2 ) is inside the quadrilateral BDFE, B (12,12), D (12,0), F (2.08333,0), E (1.06707,1.06707)The point ( t 1 , t 2 ) is inside the triangle CEF, C (0,0), E (1.06707,1.06707), F (2.08333,0)
0.15The point ( t 1 , t 2 ) is inside the quadrilateral BDFE, B (12,12), D (12,0), F (2.08333,0), E (1.06707,1.06707)The point ( t 1 , t 2 ) is inside the triangle CEF, C (0,0), E (1.06707,1.06707), F (2.08333,0)
0.16The point ( t 1 , t 2 ) is inside the quadrilateral BDFE, B (12,12), D (12,0), F (2.08333,0), E (1.06707,1.06707)The point ( t 1 , t 2 ) is inside the triangle CEF, C (0,0), E (1.06707,1.06707), F (2.08333,0)
0.2~0.7The point ( t 1 , t 2 ) is inside the quadrilateral BDFE, B (12,12), D (12,0), F (2.08333,0), E (1.06707,1.06707)The point ( t 1 , t 2 ) is inside the triangle CEF, C (0,0), E (1.06707,1.06707), F (2.08333,0)

References

  1. Bravo, R.; Friedrich, D. Integration of energy storage with hybrid solar power plants. Energy Procedia 2018, 151, 182–186. [Google Scholar] [CrossRef]
  2. Wang, Y.; Song, J.; Yang, W.; Dong, L.; Duan, H. Unveiling the driving mechanism of air pollutant emissions from thermal power generation in China: A provincial-level spatiotemporal analysis. Resour. Conserv. Recycl. 2019, 151, 104447. [Google Scholar] [CrossRef]
  3. An, Y.; Zhai, X. SVR-DEA model of carbon tax pricing for China’s thermal power industry. Sci. Total Environ. 2020, 734, 139438. [Google Scholar] [CrossRef] [PubMed]
  4. Choopani, K.; Effatnejad, R.; Hedayati, M. Coordination of Energy Storage and Wind Power Plant considering Energy and Reserve Market for a Resilience Smart Grid. J. Energy Storage 2020, 30, 101542. [Google Scholar] [CrossRef]
  5. Wang, Y.; Yu, H.; Wang, X.; Zhang, F.; Huang, Y. Consideration of reliability and economy to Capacity Configuration of energy storage system: Case Study of a large scale wind power plant in the Northwest China. Energy Procedia 2018, 152, 149–155. [Google Scholar] [CrossRef]
  6. Timmons, D.; Elahee, K.; Lin, M. Microeconomics of electrical energy storage in a fully renewable electricity system. Sol. Energy 2020, 206, 171–180. [Google Scholar] [CrossRef]
  7. Jia, X.; Du, H.; Zou, H.; He, G. Assessing the effectiveness of China’s net-metering subsidies for household distributed photovoltaic systems. J. Clean. Prod. 2020, 262, 121161. [Google Scholar] [CrossRef]
  8. Xiong, Y.; Yang, X. Government subsidies for the Chinese photovoltaic industry. Energy Policy 2016, 99, 111–119. [Google Scholar] [CrossRef]
  9. Feng, C.; Liao, X. An overview of “Energy + Internet” in China. J. Clean. Prod. 2020, 258, 120630. [Google Scholar] [CrossRef]
  10. Roberts, B.P.; Sandberg, C. The role of energy storage in development of smart grids. Proc. IEEE 2011, 99, 1139–1144. [Google Scholar] [CrossRef]
  11. Bistline, J.E.; Young, D.T. Emissions impacts of future battery storage deployment on regional power systems. Appl. Energy 2020, 264, 114678. [Google Scholar] [CrossRef]
  12. Zhang, R.; Jiang, T.; Bai, L.; Li, G.; Chen, H.; Li, X.; Li, F. Adjustable robust power dispatch with combined wind-storage system and carbon capture power plants under low-carbon economy. Int. J. Electr. Power Energy Syst. 2019, 113, 772–781. [Google Scholar] [CrossRef]
  13. Bullich-Massagué, E.; Cifuentes-García, F.-J.; Glenny-Crende, I.; Cheah-Mañé, M.; Aragüés-Peñalba, M.; Díaz-González, F.; Gomis-Bellmunt, O. A review of energy storage technologies for large scale photovoltaic power plants. Appl. Energy 2020, 274, 115213. [Google Scholar] [CrossRef]
  14. Trieb, F.; Thess, A. Storage plants—A solution to the residual load challenge of the power sector? J. Energy Storage 2020, 31, 101626. [Google Scholar] [CrossRef]
  15. He, G.; Lin, J.; Sifuentes, F.; Liu, X.; Abhyankar, N.; Phadke, A. Rapid cost decrease of renewables and storage accelerates the decarbonization of China’s power system. Nat. Commun. 2020, 11, 1–9. [Google Scholar] [CrossRef]
  16. Nasiri, N.; Abapour, M.; Mirzaei, M.A.; Loni, A.; Mohammadi-Ivatloo, B.; Zare, K.; Marzband, M. A bi-level market-clearing for coordinated regional-local multi-carrier systems in presence of energy storage technologies. Sustain. Cities Soc. 2020, 63, 102439. [Google Scholar] [CrossRef]
  17. Schyska, B.U.; Kies, A. How regional differences in cost of capital influence the optimal design of power systems. Appl. Energy 2020, 262, 114523. [Google Scholar] [CrossRef] [Green Version]
  18. Fu, Y.; Zhu, X.; Geng, M.; Zhou, Q.; Yang, H. Research on the Operation Model of the Integrated Energy Service Company Based on Regional Economic and Resource Differences. In Proceedings of the 2020 9th International Conference on Industrial Technology and Management (ICITM), Oxford, UK, 11–13 February 2020; pp. 239–244. [Google Scholar]
  19. Trahey, L.; Brushett, F.R.; Balsara, N.P.; Ceder, G.; Cheng, L.; Chiang, Y.-M.; Hahn, N.T.; Ingram, B.J.; Minteer, S.D.; Moore, J.S.; et al. Energy storage emerging: A perspective from the Joint Center for Energy Storage Research. Proc. Natl. Acad. Sci. USA 2020, 117, 12550–12557. [Google Scholar] [CrossRef]
  20. Pasta, M.; Wessells, C.D.; Huggins, R.A.; Cui, Y. A high-rate and long cycle life aqueous electrolyte battery for grid-scale energy storage. Nat. Commun. 2012, 3, 1149. [Google Scholar] [CrossRef] [Green Version]
  21. Yang, Z.; Zhang, J.; Kintner-Meyer, M.C.W.; Lu, X.; Choi, D.; Lemmon, J.P.; Liu, J. Electrochemical Energy Storage for Green Grid. Chem. Rev. 2011, 111, 3577–3613. [Google Scholar] [CrossRef]
  22. Soloveichik, G.L. Battery Technologies for Large-Scale Stationary Energy Storage. Annu. Rev. Chem. Biomol. Eng. 2011, 2, 503–527. [Google Scholar] [CrossRef] [PubMed] [Green Version]
  23. Moore, J.; Shabani, B. A Critical Study of Stationary Energy Storage Policies in Australia in an International Context: The Role of Hydrogen and Battery Technologies. Energies 2016, 9, 674. [Google Scholar] [CrossRef]
  24. Ma, L.; Li, H.; Ge, Y.; Shi, J.; Liu, G.; Li, B. Energy Storage in High Penetration of Renewable Energy Power System: Technologies, Application and Supporting Policies. In Proceedings of the 2019 IEEE Sustainable Power and Energy Conference (iSPEC), Beijing, China, 21–23 November 2019; pp. 1428–1433. [Google Scholar] [CrossRef]
  25. Cruise, R.J.R.; Flatley, L.; Zachary, S. Impact of storage competition on energy markets. Eur. J. Oper. Res. 2018, 269, 998–1012. [Google Scholar] [CrossRef] [Green Version]
  26. Zhao, Z.; Wang, C.; Nazari, M.H. Revenue Analysis and Optimal Placement of Stationary and Transportable Energy Storage Systems in Energy and Frequency Regulation Markets. arXiv 2020, arXiv:2001.01771. [Google Scholar]
  27. Heidari, A.A.; Rabeh, A.; Ali, D.M.; Mohamed, J. Multi-objective genetic algorithm based sizing optimization of a stand-alone wind/PV power supply system with enhanced battery/supercapacitor hybrid energy storage. Energy 2018, 163, 351–363. [Google Scholar] [CrossRef]
  28. Mukhopadhyay, B.; Das, D. Multi-objective dynamic and static reconfiguration with optimized allocation of PV-DG and battery energy storage system. Renew. Sustain. Energy Rev. 2020, 124, 109777. [Google Scholar] [CrossRef]
  29. Pandzic, H.; Dvorkin, Y.; Carrion, M. Investments in merchant energy storage: Trading-off between energy and reserve markets. Appl. Energy 2018, 230, 277–286. [Google Scholar] [CrossRef]
  30. Ferreira, H.L.; Staňková, K.; Lopes, J.A.P.; Slootweg, J.G.H.; Kling, W.L. Dual technology energy storage system applied to two complementary electricity markets using a weekly differentiated approach. J. Energy Storage 2017, 12, 226–242. [Google Scholar] [CrossRef] [Green Version]
  31. Akbari-Dibavar, A.; Zare, K.; Nojavan, S. A hybrid stochastic-robust optimization approach for energy storage arbitrage in day-ahead and real-time markets. Sustain. Cities Soc. 2019, 49, 101600. [Google Scholar] [CrossRef]
  32. Martinez-Bolanos, J.R.; Udaeta, M.E.M.; Gimenes, A.L.V.; Da Silva, V.O. Economic feasibility of battery energy storage systems for replacing peak power plants for commercial consumers under energy time of use tariffs. J. Energy Storage 2020, 29, 101373. [Google Scholar] [CrossRef]
  33. Borghetti, A.; Massucco, S.; Silvestro, F. Influence of feasibility constrains on the bidding strategy selection in a day-ahead electricity market session. Electr. Power Syst. Res. 2009, 79, 1727–1737. [Google Scholar] [CrossRef]
  34. Lu, Q.; Lü, S.; Leng, Y. A Nash-Stackelberg game approach in regional energy market considering users’ integrated demand response. Energy 2019, 175, 456–470. [Google Scholar] [CrossRef]
  35. Azad, S.; Ghotbi, E. A game equilibrium model of a retail electricity market with high penetration of small and mid-size renewable suppliers. Electr. J. 2017, 30, 22–29. [Google Scholar] [CrossRef]
  36. Khojasteh, M. A robust energy procurement strategy for micro-grid operator with hydrogen-based energy resources using game theory. Sustain. Cities Soc. 2020, 60, 102260. [Google Scholar] [CrossRef]
  37. Gao, F.; Sheblé, G.B. Electricity market equilibrium model with resource constraint and transmission congestion. Electr. Power Syst. Res. 2010, 80, 9–18. [Google Scholar] [CrossRef]
  38. Abapour, S.; Mohammadi-Ivatloo, B.; Hagh, M.T. A Bayesian game theoretic based bidding strategy for demand response aggregators in electricity markets. Sustain. Cities Soc. 2020, 54, 101787. [Google Scholar] [CrossRef]
  39. Vytelingum, P.; Cliff, D.; Jennings, N. Strategic bidding in continuous double auctions. Artif. Intell. 2008, 172, 1700–1729. [Google Scholar] [CrossRef] [Green Version]
  40. Ho, W.S.; Macchietto, S.; Lim, J.S.; Hashim, H.; Muis, Z.A.; Liu, W.H. Optimal scheduling of energy storage for renewable energy distributed energy generation system. Renew. Sustain. Energy Rev. 2016, 58, 1100–1107. [Google Scholar] [CrossRef]
  41. Jia, Y.; Zheng, J.; Chen, H.; Yan, Z.; Wang, J.; Chang, X. Capacity Allocation Optimization of Energy Storage in Thermal-Storage Frequency Regulation Dispatch System Based on EEMD. Dianwang Jishu/Power Syst. Technol. 2018, 42, 2930–2937. [Google Scholar] [CrossRef]
  42. Leonard, M.D.; Michaelides, E.E.; Michaelides, D.N. Energy storage needs for the substitution of fossil fuel power plants with renewables. Renew. Energy 2020, 145, 951–962. [Google Scholar] [CrossRef]
  43. Richter, M.; Oeljeklaus, G.; Görner, K. Improving the load flexibility of coal-fired power plants by the integration of a thermal energy storage. Appl. Energy 2019, 236, 607–621. [Google Scholar] [CrossRef]
  44. Gu, Y.; Xu, J.; Chen, D.; Wang, Z.; Li, Q. Overall review of peak shaving for coal-fired power units in China. Renew. Sustain. Energy Rev. 2016, 54, 723–731. [Google Scholar] [CrossRef]
  45. Mahlia, T.; Saktisahdan, T.; Jannifar, A.; Hasan, M.; Matseelar, H. A review of available methods and development on energy storage; technology update. Renew. Sustain. Energy Rev. 2014, 33, 532–545. [Google Scholar] [CrossRef]
  46. Pearre, N.; Swan, L. Reimagining renewable electricity grid management with dispatchable generation to stabilize energy storage. Energy 2020, 203, 117917. [Google Scholar] [CrossRef]
  47. Sobhani, S.O.; Sheykhha, S.; Madlener, R. An integrated two-level demand-side management game applied to smart energy hubs with storage. Energy 2020, 206, 118017. [Google Scholar] [CrossRef]
  48. Dhundhara, S.; Verma, Y.P. Capacitive energy storage with optimized controller for frequency regulation in realistic multisource deregulated power system. Energy 2018, 147, 1108–1128. [Google Scholar] [CrossRef]
  49. Engelken, M.; Römer, B.; Drescher, M.; Welpe, I.M.; Picot, A. Comparing drivers, barriers, and opportunities of business models for renewable energies: A review. Renew. Sustain. Energy Rev. 2016, 60, 795–809. [Google Scholar] [CrossRef]
  50. Sioshansi, R. When energy storage reduces social welfare. Energy Econ. 2014, 41, 106–116. [Google Scholar] [CrossRef]
  51. Yu, H.; Duan, J.; Du, W.; Xue, S.; Sun, J. China’s energy storage industry: Develop status, existing problems and countermeasures. Renew. Sustain. Energy Rev. 2017, 71, 767–784. [Google Scholar] [CrossRef]
  52. Winfield, M.; Shokrzadeh, S.; Jones, A. Energy policy regime change and advanced energy storage: A comparative analysis. Energy Policy 2018, 115, 572–583. [Google Scholar] [CrossRef]
  53. Wang, C.; Xie, H. Research on dynamic Characteristics and Influencing factors of Carbon emission in China’s electric power industry. China Popul. Resour. Environ. 2015, 25, 21–27. [Google Scholar] [CrossRef]
  54. Roman, M.; Roman, M.; Roman, K.K. Spatial differentiation of particulates emission resulting from agricultural production in Poland. Agric. Econ. (Czech Repub.) 2019, 65, 375–384. [Google Scholar] [CrossRef]
  55. Chen, W.; Zeng, Y.; Xu, C. Energy storage subsidy estimation for microgrid: A real option game-theoretic approach. Appl. Energy 2019, 239, 373–382. [Google Scholar] [CrossRef]
  56. Cheng, L.; Yu, T. Nash Equilibrium-Based Asymptotic Stability Analysis of Multi-Group Asymmetric Evolutionary Games in Typical Scenario of Electricity Market. IEEE Access 2018, 6, 32064–32086. [Google Scholar] [CrossRef]
Figure 1. The framework of evolutionary game analysis.
Energies 13 06293 g001
Figure 2. Dynamic simulation results of the initial assignment: (ad) represents dynamic trajectories of strategy changes of (1,1,0) under 125, 216, 512, and 729 rounds dynamic simulations corresponding to 1/4, 1/5, 1/7, and 1/8 step size conditions, respectively.
Energies 13 06293 g002aEnergies 13 06293 g002b
Figure 3. Dynamic simulation results after adjusting the adjustable variables: (ac) represents dynamic trajectories of strategy changes of (0,0,0), (1,0,0), and (1,1,1), under 125 rounds dynamic simulations corresponding to 1/4 step size conditions.
Energies 13 06293 g003
Figure 4. The chain of influence.
Energies 13 06293 g004
Figure 5. Schematic diagram of impacts of N P P on energy storage’s selection in power plants.
Energies 13 06293 g005
Figure 6. Influence of N P P or N P G on energy storage charge-discharge time decisions.
Energies 13 06293 g006
Figure 7. Influence of N P G on the energy storage cost decisions of power grid enterprises.
Energies 13 06293 g007
Table 1. Policy documents related to the energy storage of local governments.
Major Policy DirectionsRegions
Supporting the development of energy storage technology as the focus of the electrical reformBeijing, Jilin, Zhejiang, Jiangsu, Hunan, Henan, Shanghai, Guangdong, and Xinjiang
Supporting the construction of energy storage projectsNew energy power stations + energy storageHunan, Xinjiang, Beijing, Hubei, Anhui, Zhejiang, Jiangsu, Yunnan, Xizang, and Qinghai
The power side + energy storageGuangdong, Shanxi, Liaoning, Inner Mongolia, Guizhou, Qinghai, and Xinjiang
The grid side + energy storageHunan, Henan, Guangdong, Jiangsu, Gansu, and Qinghai
The user side + energy storageInner Mongolia, Jiangsu, Ningxia, Shanxi, Shandong, Guangdong, and Hubei
Supporting energy storage projects, preferentially on-gridInner Mongolia, Henan, and Hubei
Encouraging the application of energy storage in peak frequency modulation and demand response by providing subsidiesShandong, Zhejiang, Henan, Jiangsu, Xinjiang, and Fujian
Other incentive policiesXinjiang, Hunan, Beijing, and Shandong
Table 2. System parameters of the trilateral strategy evolution game.
System ParametersDefinition Units
P P The feed-in tariff (on-grid price)yuan/kWH
P G The electricity sale priceyuan/kWH
C P The average variable cost of power plants yuan/kWH
C G The average operation and maintenance cost of power gridsyuan/kWH
T The carbon tax on power plantsyuan/kWH
A The energy storage system built by a power plant is A (kW)/   A (kWH), of which the load power is A (kW)kW
B The energy storage system added by a power grid enterprise is B (kW)/   B (kWH), of which the load power is B (kW)kW
C g o v The regulatory cost for governments to supervise energy storage projectyuan/kWH
s P The regulation intensity of the government to power plants, which is based on the difference between the actual charge and discharge quantity and the standard quantity within 24 hyuan/kWH
s G The regulation intensity of governments to power grids, which is based on the difference between the actual charge and discharge quantity and the standard quantity within 24 hyuan/kWH
α The standard charging and discharging time length in a day set by the government for the energy storage built by the power plantsh
β The standard charging and discharging time length in a day set by the government for the energy storage built by the power grids enterprisesh
T 0 Coefficient of tax breaks for power plants that have built the energy storage facilitiesyuan/kWH
r The subsidy factor for the cost of constructing an energy storage system at a power plant or power gridyuan/kW
Table 3. Adjustable variables of the trilateral strategy evolution game.
Adjustable VariablesDefinitionUnit
P Total generated electricity in a daykWH
D The total electricity demand of users in a daykWH
t 1 Total time of energy storage charging in a dayh
t 2 Total time of energy storage discharging in a dayh
V p The average construction cost of the energy storage for the power plants, which has been divided into a daily valueyuan/kW
V G The average construction cost of the energy storage for the power grids, which has been divided into a daily valueyuan/kW
o P The operation and maintenance cost coefficient of energy storage equipment in power plantsyuan/kWH
o G The operation and maintenance cost coefficient of energy storage equipment in power gridsyuan/kWH
Table 4. Evolutionary game payoff matrix.
The Government Chooses to Regulate ( z ) The Grid Chooses to Add Energy Storage ( y ) The Grid Chooses not to Add Energy Storage ( 1 y )
The Power Plant chooses to build Energy Storage   ( x ) Power plants ( P P C P T ) ( D + A t 1 + B t 1 A t 2                               B t 2 ) + T 0 A t 1                               ( V P r ) A                               ( A t 1 + A t 2 ) o P                               + ( A t 1 + A t 2                               A α ) s P ( P P C P T ) ( D + A t 1 A t 2 )                               + T 0 A t 1                               ( V P r ) A                               ( A t 1                               + A t 2 ) o P                               + ( A t 1 + A t 2                               A α ) s P
Power grids ( P G C G ) ( P A t 1 B t 1 + A t 2                               + B t 2 ) o G ( B t 1                               + B t 2 ) ( V G                               r ) B + ( B t 1                               + B t 2 B β ) s G ( P G C G ) ( P A t 1 + A t 2 )
Governments C g o v ( A t 1 + B t 1 + A t 2 + B t 2 )                               r ( A + B )                               ( A t 1 + A t 2                               A α ) s P ( B t 1                               + B t 2 B β ) s G                               + T ( D + A t 1                               + B t 1 A t 2                               B t 2 ) T 0 A t 1 C g o v ( A t 1 + A t 2 ) C g o v ( B t 1                               + B t 2 ) r A                               ( A t 1 + A t 2                               A α ) s P + T ( D                               + A t 1 A t 2 )                               T 0 A t 1
The Power Plant chooses not to build Energy Storage   ( 1 x ) Power plants ( P P C P T ) ( D + B t 1 B t 2 ) ( P P C P T ) D
Power grids ( P G C G ) ( P B t 1 + B t 2 ) o G ( B t 1                               + B t 2 ) ( V G                               r ) B + ( B t 1                               + B t 2                               B β ) s G ( P G C G ) P
Governments C g o v ( B t 1 + B t 2 ) C g o v ( A t 1                               + A t 2 ) r B                               ( B t 1 + B t 2                               B β ) s G + T ( D                               + B t 1 B t 2 ) C g o v ( A t 1 + B t 1 + A t 2 + B t 2 )                               + T D
The Government Chooses not to Regulate ( 1 z ) The Grid Chooses to Add Energy Storage   ( y ) The Grid Chooses not to Add Energy Storage   ( 1 y )
The Power Plant chooses to build Energy Storage (x) Power plants ( P P C P T ) ( D + A t 1 + B t 1 A t 2                               B t 2 ) V P A                               ( A t 1 + A t 2 ) o P ( P P C P T ) ( D + A t 1 A t 2 )                               V P A ( A t 1                               + A t 2 ) o P
Power grids ( P G C G ) ( P A t 1 B t 1 + A t 2                               + B t 2 ) o G ( B t 1                               + B t 2 ) V G B ( P G C G ) ( P A t 1 + A t 2 )
Governments T ( D + A t 1 + B t 1 A t 2 B t 2 ) T ( D + A t 1 A t 2 )
The Power Plant chooses not to build Energy Storage   ( 1 x ) Power plants ( P P C P T ) ( D + B t 1 B t 2 ) ( P P C P T ) D
Power grids ( P G C G ) ( P B t 1 + B t 2 )                               o G ( B t 1 + B t 2 )                               V G B ( P G C G ) P
Governments T ( D + B t 1 B t 2 ) T D
Table 5. Reference range for the initial assignment of system parameters.
System ParameterScope of the AssignmentAssignmentUnit
P P [0.25, 0.45]0.4yuan/kWH
P G [0.26, 1.5]0.6yuan/kWH
A [0, 200,000]10,000kW
B [0, 200,000]15,000kW
C P [0.135, 0.265]0.2yuan/kWH
C G [0.35, 0.6]0.45yuan/kWH
T [0.001, 0.15]0.135yuan/kWH
α [0, 12]7.5h
β [0, 12]7.5h
s P [0, 0.5]0.3yuan/kWH
s G [0, 0.5]0.3yuan/kWH
T 0 [0, 0.5]0.1yuan/kWH
r [0, 1]0.5yuan/kW
C g o v [0, 1]0.5yuan/kWH
Table 6. Reference range for the initial assignment of adjustable parameters.
Adjustable VariableScope of the AssignmentAssignmentUnit
t 1 0~129h
t 2 0~127h
V p 1.5~73yuan/kWH
V G 1.5~73yuan/kWH
o P [0.05, 0.15]0.1yuan/kWH
o G [0.05, 0.15]0.1yuan/kWH
P 0~24,000,000720,000kWH
D 0~24,000,000670,000kWH
Table 7. Classification of the power plant scale and the power grid scale.
Classification Generated   Energy   ( P ) Generator Set Power Electricity   Demand   of   Users   ( D )
Micro scale P < 384   MWH P / 24 < 16 MW D < 210 MWH
Small scale 384 < P < 490 MWH 16 < P / 24 < 20.4 MW 210 < D < 657.7 MWH
Medium scaleMedium and small scale 490 < P < 1022 MWH 20.4 < P / 24 < 42.6 MW 657.7 < D < 1035 MWH
Medium- and-large scale 1022 < P < 2400 MWH 42.6 < P / 24 < 100 MW 1035 < D < 2400 MWH
Large scale 2400 < P < 7200 MWH 100 < P / 24 < 300 MW 2400 < D < 6950 MWH
Super-large scale 7200 < P < 24 , 000 MWH 300 < P / 24 < 1000 MW 6950 < D < 24 , 000 MWH
Table 8. Typical examples are given to illustrate the different evolutionary stable equilibrium points corresponding to different adjustable variable assignments.
Simulation FiguresAdjustable Variable ChangesEvolutionary Stable Equilibrium ConditionsEvolutionary Stable Equilibrium PointConclusion
Figure 3a Simulation result is (0,0,0) after adjusting adjustable variables P = 400 , 000   ( kWH ) , D = 350 , 000   ( kWH ) . 0 t 1 ,   t 2 12 ,   Q < 540   MHW(0,0,0)When the regional transaction scales of power plants and power grids are both small, the small regional electricity enterprises will not build energy storage facilities, and the government ultimately chooses not to regulate the energy storage industry.
Figure 3b Simulation result is (1,0,0) after adjusting adjustable variablesP = 480,000   ( kWH ) , D = 480 , 000   ( kWH ) , V P = 1   ( yuan / kW ) 1.23 t 1 + 1.13 t 2 > 1.75 , V P < 0.065 V G + 0.03 t 1 0.1 t 2 , 6.4103 V P < D < 4.1667 ( V G + 2.4 ) , 30.3846 t 1 + 0.3846 t 2 + 153.8462 V P < P < 84 t 1 36 t 2 + 2400 V G .(1,0,0)When the energy storage cost is relatively low, small power plants choose to build and use energy storage facilities. When the energy storage facility cost is relatively high for small power grids with small electricity demands, small power grids choose not to build energy storage facilities. The government ultimately chooses not to regulate.
Figure 3c Simulation result is (1,1,1) after adjusting adjustable variables P = 1 , 200 , 000   ( kWH ) , D = 1 , 177 , 500   ( kWH ) , t 1 = 1.4   ( h ) , t 2 = 0.5   ( h ) . 0.84 t 1 + 0.8 t 2 < 1.75 , P > 41.545   MW, D > 1538.5   MWH(1,1,1)Large power plants and power grids ultimately choose to construct energy storage to cheat subsidies, and the government ultimately chooses to regulate energy storage.
Table 9. Actual situation of main regional electricity markets.
Regional Electricity MarketsOn-Grid Price (yuan/kWH)Sales Price (yuan/kWH)Daily Thermal Power Generation (GWH)Daily Electricity Demand (GWH)Administrative Regions
Eastern China Electricity Market0.3697~0.41530.5179~1.4029Around 3000Around 4700 Jiangsu, Anhui, Zhejiang, Shanghai, and Fujian
Northern China Electricity Market0.2772~0.37290.3208~1.5295Around 3000 Around 2900Beijing, Tianjin, Hebei, Shanxi, Shandong, and West Inner Mongolia
Northeast China Electricity Market0.3035~0.37230.79~0.8972Around 1800 Around 2000 Liaoning, Jilin, Heilongjiang, and East Inner Mongolia
Middle-China Electricity Market0.3551~0.44710.7499~1.1801Around 1700 Around 3500 Hubei, Hunan, Henan, Sichuan, Chonagqing, and Jiangxi
Western China Electricity Market0.2595~0.33460.345~1.1549Around 1000 Around 1300 Shaanxi, Gansu, Qinghai, and Ningxia
Southern China Electricity Market0.3358~0.45050.613~0.8787Around 1500 Around 3300 Guangdong, Guangxi, Yunnan, Guizhou, and Hainan
Table 10. Regional equilibrium based on the findings of influence on energy storage.
RegionsDaily Thermal Power Generation ScaleDaily Electricity Demand ScaleEquilibrium PointEquilibrium ConditionsLimiting Conditions
Eastern China Electricity MarketGreater-than-medium scaleGreater-than-medium scale(1,1,0) P / 24   >   20.5   (MW), D   >   320 (MWH), 0.84 t 1 + 0.8 t 2 > 1.75 N P P   >   0.0008 (yuan/kWH), N P G   >   0.05 (yuan/kWH)
Middle-China Electricity Market
Southern China Electricity Market
Northern China Electricity MarketMedium-or-lower scaleGreater-than-small scale(0,1,0) 10 < P / 24 < 34.6   ( MW ) , 13.14 < Q < 830.77   ( MWH ) , t 1 + t 2 > 1.5441 0.0578 < N P P < 0.0379   (yuan/kWH), N P G   >   0.05 ( yuan/kWH)
Northeast China Electricity MarketGreater-than-large scaleGreater-than-medium scale(1,1,0) P / 24 > 20.5 (MW), D > 320 (MWH), 0.84 t 1 + 0.8 t 2 > 1.75 0   <   N P P   <   0.0379   ( yuan/kWH), N P G   >   0.05   ( yuan/kWH)
Western China Electricity MarketLess-than-small scaleLess-than-small scale(0,0,0) 0 t 1 ,   t 2 12 ,   Q < 540   ( MWH ) N P P   <   0   (yuan/KWH),   N P G   <   0 (yuan/kWH)
Publisher’s Note: MDPI stays neutral with regard to jurisdictional claims in published maps and institutional affiliations.