Abstract
The sample size or particle size of shale plays a significant role in the characterization of pores by various techniques. To systematically investigate the influence of particle size on pore characteristics and the optimum sample size for different methods, we conducted complementary tests on two overmature marine shale samples with different sample sizes. The tests included small-angle neutron scattering (SANS), gas (N2, CO2, and H2O) adsorption, mercury injection capillary pressure (MICP), and field emission-scanning electron microscopy (FE-SEM) imaging. The results indicate that artificial pores and fractures may occur on the surface or interior of the particles during the pulverization process, and some isolated pores may be exposed to the particle surface or connected by new fractures, thus improving the pore connectivity of the shale. By comparing the results of different approaches, we established a hypothetical model to analyze how the crushing process affects the pore structure of overmature shales. Our results imply that intact wafers with a thickness of 0.15–0.5 mm and cubic samples (~1 cm3) are optimal for performing SANS and MICP analyses. Meanwhile, the 35–80 mesh particle size fraction provides reliable data for various gas physisorption tests in overmature shale. Due to the intrinsic heterogeneity of shale, future research on pore characteristics in shales needs a multidisciplinary approach to obtain a more comprehensive, larger scale, and more reliable understanding.
1. Introduction
With the commercial development of shale gas in North America and China, the pore characteristics of shale reservoirs have been extensively studied [1,2,3]. Pore characteristics not only control the hydrocarbon gas storage capacity [4,5], but also have an important influence on the gas flow mechanism and producibility [6,7], which can provide basic information for the evaluation of shale reservoirs and shale gas accumulation mechanisms. Therefore, a series of quantitative and visual techniques are used to characterize the pore structure of shales and the characterization scales are summarized in Figure 1.
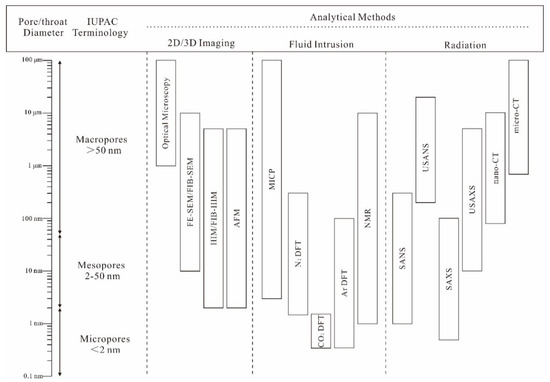
Figure 1.
Methods used to investigate pore characteristics in shale (modified from [3]).
Among the above methods, fluid intrusion analytical methods are the most widely applied to characterize the pore structure of shale [8,9,10]. However, for each test, there is no uniform standard as to whether the test sample size should be an intact or crushed sample, as well as the particle size of the crushed sample. Chen et al. [11] carried out gas (N2 and CO2) physisorption measurements on New Albany Shales with different particle sizes (4 mesh, 20 mesh, and 60 mesh), and the results indicated that the mesopore volume increased with a decrease in particle size, whereas the micropore volume changed irregularly. Subsequently, Wei et al. [12] and Han et al. [13] evaluated the effect of particle size (5–250 mesh) on the change in pore structure through gas (N2 and CO2) adsorption experiments for Longmaxi Shale samples. Their conclusions were consistent with those of Chen et al. [11], who found that the decrease in particle size primarily affected the pores larger than 10 nm, and suggested that 60–140 mesh is the most suitable particle size for gas adsorption tests. In addition, Mastalerz et al. [14] suggested that gas adsorption tests on low-maturity (Ro~0.57%) and high-maturity (Ro~1.30%) shale samples with smaller particle size (200 mesh) could eliminate the equilibration problems and attain accurate results. However, Hazra et al. [15] proposed that shale particle sizes that were too fine would lead to destruction or alteration of the mesopore structures. Similarly, the results of the mercury injection capillary pressure (MICP) analysis for Barnett and Haynesville shale samples demonstrate that permeability and accessible porosity increase with decreasing sample particle size, indicating that the shale matrix has a higher connectivity on a small scale [16]. Moreover, the water vapor adsorption results for shale show that the total adsorption at 95% relative humidity (RH) is smaller in larger particle size samples, which is associated with fewer accessible pores [17,18]. Nevertheless, there is still a lack of a systematic analysis explaining the above results in the various fluid intrusion experiments.
In addition to fluid intrusion techniques, the nondestructive small-angle neutron scattering (SANS) technique has been used to evaluate the pore characteristics of shale reservoirs in recent years [19,20,21]. The main advantage of SANS in characterizing pore structure compared with fluid intrusion methods is that it contains information on closed pores (inaccessible to fluids) [3]. Thin sections of thickness from 0.15 mm to 0.5 mm are commonly used in the SANS test for shale for neutron transmission and avoidance of multiple scattering [22,23]. In addition, shale grain samples can also be used for the SANS test to avoid the anisotropy of the SANS images for wafer samples [24,25,26]. However, few studies have been performed on the effect of particle size on pore structure using SANS. Previous studies using fluid intrusion techniques considered the enhancement of the pore connectivity and ignored the artificial pores and fractures generated in the process of particle size reduction [14,16,27]. Therefore, the revelation of pore structure changes in the shale samples with different particle sizes by SANS can compensate for the deficiencies of previous studies. Moreover, the results of the crushed shale pressure-decay test for different particle sizes show that the helium permeability decreases with decreasing particle size [28]. However, the adsorption capacity of methane increased with decreasing particle size [29]. The reasons for the above phenomena can be explained by the mechanism of pore structure changes during the process of shale particle size reduction.
This study aims to reveal the influence of particle size on the pore characteristics of overmature organic-rich shales. Two shale samples were prepared as 1 cm cubes and particles of 20–35 mesh, 35–80 mesh, and 80–200 mesh. With a combination of SANS, low-pressure gas (N2, CO2, and H2O) physisorption, and MICP, pore structure changes in shale with different sample sizes were first analyzed quantitatively. Then, the grinding positions of the shale were observed and characterized using field emission-scanning electron microscopy (FE-SEM). Finally, the effect of the pulverization process on the original pore characteristics of the shale was revealed. Thus, this study attempts to provide a reasonable suggestion on the size of shale samples that should be selected for the characterization techniques of different principles.
2. Materials and Methods
2.1. Sample Preparation
In this work, two fresh, overmature marine shale samples were collected from the Upper Ordovician Wufeng Formation of Well TY1 and Lower Cambrian Niutitang Formation of Well RY2, northwest of Guizhou Province, respectively (Figure 2). Information regarding the composition and maturity of selected samples is listed in Table 1. The raw shale samples were cut into cubes with a side length of 1 cm for the FE-SEM observation and MICP test. Then, the cubes were carefully hand-crushed and sieved into three particle size subsamples: 20–35 mesh (size A), 35–80 mesh (size B), and 80–200 mesh (size C). The shale samples used for analysis were well preserved, and with no sign of oxidation or weathering. Each subsample was dried in a vacuum oven at 60 °C for more than 48 h (until mass constancy) to remove the initial moisture content and subsequently analyzed via SANS, low-pressure N2 and CO2 physisorption, water vapor adsorption, and MICP measurements to determine various parameters of pore characteristics.
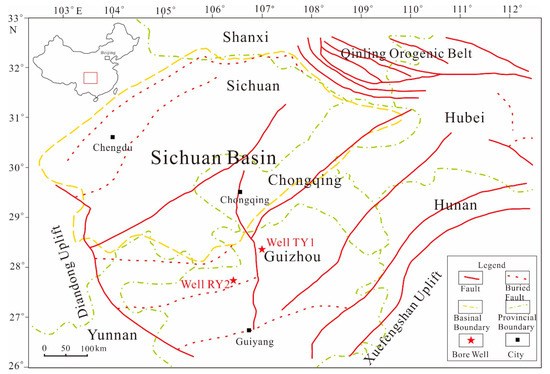
Figure 2.
Location map of sampling wells in southern China (modified from [10]).

Table 1.
Basic properties of shale samples used in this work.
2.2. SANS Experiment
SANS was performed at the Suanni SANS instrument at the China Mianyang Research Reactor using three sample-to-detector distances (10 m, 4 m, and 1 m) and two neutron wavelengths λ = 5.3 Å (4 m, 1 m) and λ = 8 Å (10 m). The scattering vector (Q) range of this test was 0.0039–0.3 Å−1, which corresponds to the pore diameters (D) from 128 nm to 1.7 nm, according to an approximate relation D = 5/Q [30]. Shale samples with different particle sizes were placed into Hellma cells with a 1 mm path length for the SANS measurement. The raw scattering data were corrected for scattering from the background and space between sample particles by acid-washed quartz sand with the same mesh and empty-cell [21]. The corrected SANS data were analyzed using the polydisperse size-distribution model (PDSM) in IRENA macros of the IGOR Pro software, which assumes that the pores are in a spherical shape and have a random size distribution [31]. Additional background information on the application of the SANS technique for pore characterization of shales can be found in a review article of Sun [3].
2.3. Low-Pressure N2 and CO2 Physisorption
Shale samples with different particle sizes were analyzed via low-pressure N2 and CO2 physisorption on a Quantachrome Autosorb-iQ apparatus after the SANS tests. The samples were degassed at 105 °C for 12 h to remove any adsorbed moisture and volatile matter. The relative pressures (P/P0, where P0 is the vapor pressure of the adsorbing gas, and P is the actual gas pressure) of the N2 and CO2 adsorption ranged from 0.0009 to 0.995 and 0.0006 to 0.03, respectively. The surface area and pore size distribution (PSD) of the samples were calculated from N2 adsorption data. N2-based and CO2-based adsorption data were interpreted using the density functional theory (DFT) [32].
2.4. Water Vapor Adsorption Experiment
Water vapor adsorption (WVA) tests were carried out on the shale samples, which completed low-pressure gas physisorption using the dynamic vapor sorption (DVS) method at 25 °C. The DVS apparatus (Quantachrome Aquadyne) accurately measures the mass change (resolution of 0.1 μg ± 1%) of shale samples from 2% to 95% RH to obtain the water vapor ad-/desorption isotherm. The RH usually corresponds to the ratio of the pressure of water vapor (P) to the pressure of saturated vapor (P0). Based on the Kelvin equation, the relation between RH and pore radius (rp) of the water-filled capillary can be described [33]:
where γ is the surface tension, is the molar volume of the water vapor, θ is the contact angle, R is the universal gas constant, and T is the temperature. In addition to the water-filled in the pores by capillary condensation, the water adsorbed on the pore surfaces also occupies part of the pore volume. Before capillary condensation, it is assumed that the pore surface of the shale is covered by multiple layers of water vapor with the same interfacial forces to form a water film of a specified thickness. When van der Waals force is the main controlling factor of water film thickness, the thickness (t) of the water-adsorbed layer on the pore surface could be calculated using Hasley’s equation [17]:
Since the bound water in clay minerals is not removed during sample treatment, only water film and capillary water are considered when calculating the PSD of the shale sample by WVA isotherm. The mass change could then be converted to the pore volume. The actual pore radius (r) measured by WVA could be expressed as follows:
2.5. MICP Measurement
MICP measurements were conducted on intact cube samples and crushed samples (size A, size B, and size C) using a porosimeter (Autopore IV 9520, Micromeritics) located at the China University of Geosciences (Wuhan) at pressures up to 60,000 psia (~413 MPa). In addition, to determine the influence of the space between the particles on the intrusion curves, acid-washed quartz sand with different particle sizes was used as a reference for MICP. The porosities and distribution of pore-throat sizes ranging from 3 nm to 36 μm were calculated from the mercury intrusion data.
2.6. FE-SEM Imaging
The intact TY1-20 shale sample was first cut into a 10 mm × 10 mm × 5 mm slice, and then ion-milled on a 10 mm × 10 mm surface using an argon-ion-beam polisher (LEICA EM XTP) to obtain a smooth surface for FE-SEM observation. After imaging, the sample was carefully hand-crushed into particles of approximately 0.5 mm in diameter (~35 mesh). Then, the crushed subsamples were further observed using FE-SEM to identify the influence of crushing on the shale sample.
3. Experimental Results
3.1. Characteristics of SANS Results
Figure 3a,b display the neutron scattering curves of the two shale samples with different particle sizes. As shown in Figure 3a,b, the scattering intensity of the shale samples with size C in the low Q region is higher than that of shale samples with size A. The neutron SLD values of the shale samples were calculated by averaging the SLD value of each component in the shale, recorded in Table 2. The detailed calculation method can be found in our previous study [3,20]. Shale is treated as a pseudo-two-phase system of pores and solids when the pore structure parameters are determined from SANS tests [34]. Table 2 shows the results of the porosity and specific surface area (SSA) derived from SANS. For the two shale samples, with decreasing particle size, the PDSM porosity increased (Table 2). Because the porosity measured by SANS represents the total porosity (open and closed pores), the increase in porosity with the decrease in particle size is primarily due to the artificially increased pore and fracture space induced during the sample crushing. However, the SSA of the shale samples derived from SANS did not show the same trend as porosity.
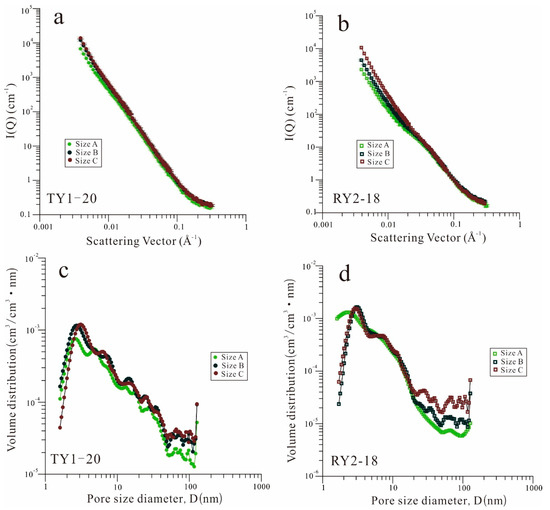
Figure 3.
(a,b) Small-angle neutron scattering (SANS) profiles and (c,d) pore size distribution (PSD) for the TY1-20 and RY2-18 samples with three different particle sizes.
Table 2.
Pore parameters of samples from SANS and gas (N2 and CO2) adsorption.
The relationship between the scattering vector (Q) and pore radius (R) can be transformed by the empirical equation R = 2.5/Q [30]. The PSD of the samples with different particle sizes are illustrated in Figure 3c,d for comparison. For the TY1-20 sample (Figure 3c), the pore volumes of both size B and size C were significantly higher than those of size A within the pore size range tested by SANS. For the RY2-18 sample (Figure 3d), as the particle size decreased, the pore volume of the pores with a diameter greater than 20 nm increased considerably. In addition, the pore volumes of size B and size C within the pore size range of 2~5 nm were also significantly higher than that of size A.
3.2. Low-Pressure N2 and CO2 Physisorption
Figure 4a,b show the N2 adsorption–desorption isotherms of the two shale samples for the three different particle sizes. All samples display distinct hysteresis loops, and the hysteresis influence of desorption is mostly due to the pore morphology (ink-bottle shape). A comparison of the adsorption branches shows that the shale samples with the minimum particle size exhibit the maximum adsorption capacity at the maximum equivalent pressure. The observation of the desorption branches demonstrates that the desorption rate increases as the particle size decreases from size A to size C. In other words, the decrease in sample particle size shortens the distance required for desorption, thus enhancing the pore connectivity and gas transport capacity.
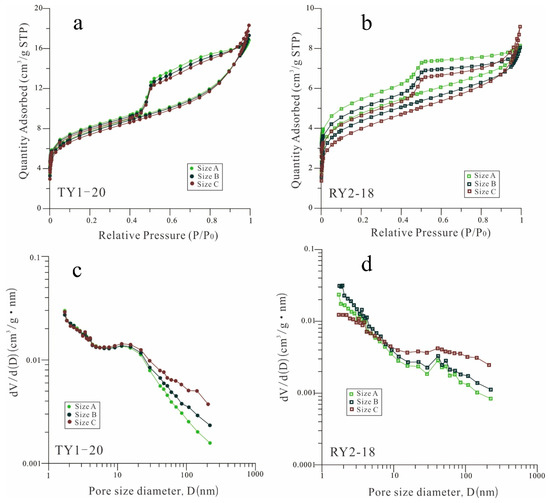
Figure 4.
(a,b) Low-pressure N2 adsorption/desorption isotherms and (c,d) PSD for the TY1-20 and RY2-18 samples with three different particle sizes.
The N2 pore volume and surface area of the two samples are listed in Table 2. For sample TY1-20, the N2 pore volume increased with decreasing particle size, and the increased pore volume is predominantly concentrated on the range of pore sizes larger than 10 nm (Figure 4c). Similarly, the BET SSA of sample TY1-20 does not show the same trend as the pore volume changes with particle size. For sample RY2-18, the N2 pore volume and SSA increased with the particle size reduction from size A to size B, but then decreased for size C. Similar to sample TY1-20, the pore volume with a pore size larger than 10 nm increased with the decrease in particle size (Figure 4d). However, sample RY2-18 at particle size C exhibited a significant reduction in pore volume within the pore size range of less than 10 nm.
The CO2 adsorption capacity of the two samples decreased slightly with a decrease in particle size (Figure 5a,b). Determined by CO2 adsorption, the pore volume and SSA of the shale samples were consistent (Table 2). The consistency of the CO2 PSD curves of shale samples with different particle sizes (Figure 5c,d) indicates that the effect of particle size reduction on the micropore volume of the overmature shale is limited.
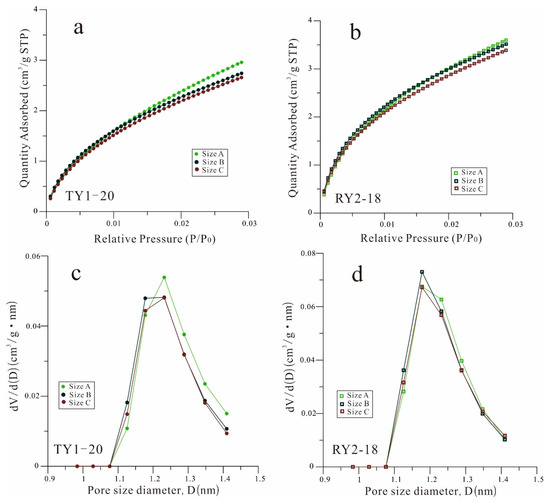
Figure 5.
(a,b) CO2 adsorption isotherms and (c,d) PSD for the TY1-20 and RY2-18 samples with three different particle sizes.
3.3. WVA Analysis
The water vapor adsorption–desorption isotherms of the shale samples are presented in Figure 6a,b. As the particle size decreased, the total water adsorption of the shale samples under 95% RH increased continuously (Table 3). When the RH is higher than 70%, the WVA curves of samples with different particle sizes are the most distinct. According to Equations (1)–(3), the results of the distribution relationship between pore size diameter and water incremental intrusion are shown in Figure 6c,d. Within the pore size range, less than 6.2 nm (corresponding to approximately 70% RH), the water absorption capacity of the samples with different particle sizes did not differ significantly. However, with pore sizes larger than 6.2 nm, the water vapor uptake increased dramatically with decreasing particle size. In general, the adsorption of water vapor in shale occurs in three stages: monomolecular-layer coverage, multimolecular-layer adsorption, and capillary condensation with an increase in humidity [18,35]. Therefore, the influence of particle size on the WVA of the overmature shale is primarily reflected in the stage of capillary condensation.
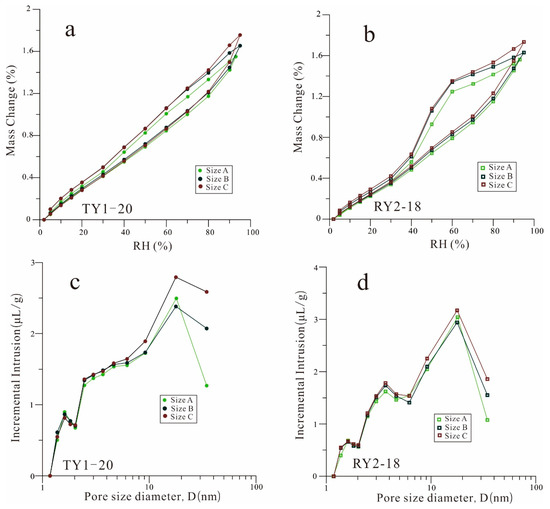
Figure 6.
(a,b) Water vapor adsorption/desorption isotherms and (c,d) PSD for the TY1-20 and RY2-18 samples with three different particle sizes.
Table 3.
Parameters obtained from water vapor adsorption (WVA) and MICP analyses.
Moreover, pronounced hysteresis loops were observed in all the water vapor adsorption/desorption isotherms (Figure 6a,b). Based on the IUPAC classification, the hysteresis loops of sample TY1-20 and sample RY2-18 can be classified as type H3 and type H2, indicating slit-like and ink-bottle shape pore networks, respectively [36]. In this work, the Areal Hysteresis Index (AHI) was used to quantitatively describe the characteristics of the hysteresis loop. The AHI is expressed as follows [37]:
where and are the areas under the adsorption and desorption isotherms, respectively. The AHI values of sample RY2-18 were significantly higher than those of sample TY1-20 (Table 3). In addition, the values of AHI tended to increase with the decreasing particle size.
3.4. MICP Analysis
The cumulative mercury intrusion curves and pore-throat size distribution curves for all sample sizes of TY1-20 and RY2-18 are illustrated in Figure 7. As shown in Figure 7, as the sample size decreased, the cumulative mercury intrusion volume increased. The cumulative intrusions of sample TY1-20 from the cube to size B increased even at the maximum pressure (413 MPa), indicating that mercury will continue to enter the pore space if the pressure is increased. However, for TY1-20 with size C, the cumulative intrusion would not increase when the pressure was higher than 4000 psia. For sample RY2-18, the cumulative intrusion volume of all the samples except the cube will be constant after a certain pressure.
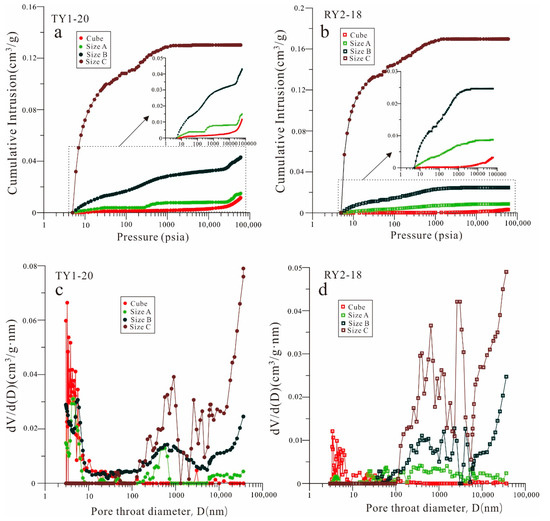
Figure 7.
(a,b) MICP intrusion curves and (c,d) pore volume distribution vs. pore-throat diameters for the TY1-20 and RY2-18 samples with four different sample sizes.
The pore-throat size distribution curves (Figure 7) indicate that the accessible pore volume connected with the pore throat less than 10 nm in the cube samples will be greatly reduced in the particle samples. For the samples with particle size C, the pore network space connected with a pore throat of less than 100 nm almost disappeared. Contrarily, the connected pore volume of the samples with pore-throat diameters larger than 100 nm dramatically increased with the decrease in sample size. Furthermore, the MICP results of acid-washed quartz sand with different particle sizes demonstrated that the influence between particles was mostly manifested on the micron scale (Figure 8).
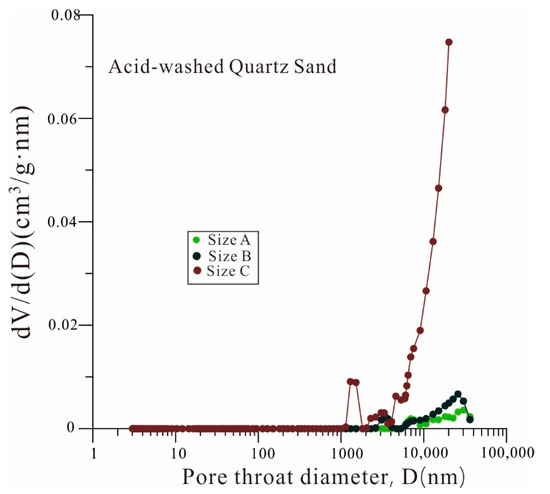
Figure 8.
Pore volume distribution vs. pore-throat diameters of quartz samples with three different particle sizes.
Table 3 summarizes the results of the pore structure parameters corrected by the acid-washed quartz sand using MICP data and conformance volume calculations [16,38] for the different sample sizes of TY1-20 and RY2-18 samples. The results demonstrate that porosity is strongly related to the sample size, which increased with decreasing sample size. With the decrease in the sample size, the pore throat with a small diameter gradually disappeared, which led to an increase in the average pore-throat size (APtS) and a decrease in the total pore area. The particle density of the same samples with different sizes also exhibited slight differences, indicating that there will inevitably be subtle differences in composition in the sorting process.
3.5. Observation of FE-SEM
Various mineral components and organic matter can be clearly observed under FE-SEM on the smooth surface of shale obtained by argon-ion-beam polishing (Figure 9a). The crushed subsamples were then fixed with epoxy resin and further observed using FE-SEM, revealing that the smooth surface became rough (Figure 9b). Artificial microcracks at the nanometer scale formed by the fracture of rigid minerals could be observed on the rough surface of crushed subsamples (Figure 9c). In addition, in the process of particle size reduction, the structure of the clay minerals was prone to collapse, leading to the generation of smaller fragments and new artificial pore space (Figure 9c).
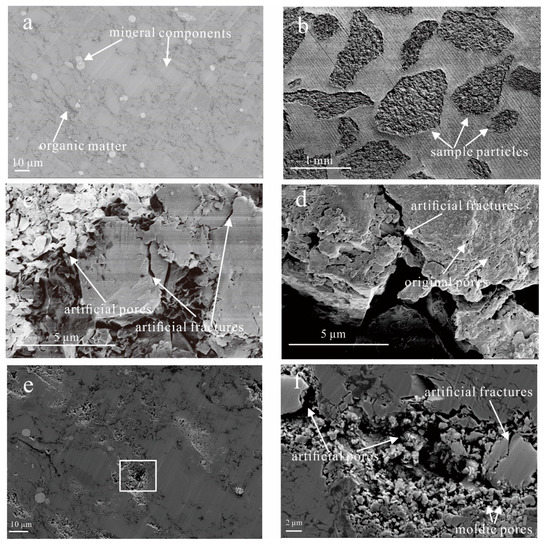
Figure 9.
Field emission-scanning electron microscopy (FE-SEM) images of the TY1-20 sample. (a) Smooth surface of shale obtained by argon-ion-beam polishing; (b) Crushed subsamples were then fixed with epoxy resin; (c) Artificial pores and microcracks; (d) Artificial microfractures perpendicular to the bedding direction; (e) Marks of the crushing process on the smooth surface; (f) An enlargement of the crush mark in the rectangle area in Figure 9e.
Among the artificial microcracks, artificial microfractures perpendicular to the bedding direction are more conducive to enhancing pore connectivity. As illustrated in Figure 9d, the hydrocarbon fluids in the original pores could flow out through artificial microfractures, whereas the small molecular fluid in fluid-invasion porosimetry can enter the original pores through the artificial microfractures. The marks of the crushing process on the smooth surface by argon-ion-beam polishing could be observed in the local area of the particle sample (Figure 9e). By magnifying the observation of the crush area (Figure 9f), it was found that the artificial pore-fracture is manifested in three forms: (1) the separation of rigid minerals (quartz, calcite, etc.) and plastic components (organic matter and clay) to form artificial pore-fractures; (2) the fragmentation of mineral grains to form artificial fractures; and (3) the spalling of mineral grains, such as pyrite, to form artificial moldic pores.
4. Discussion
4.1. Effect of Particle Size on Pore Structure Characteristics
The results of the SANS show that the total porosities (including both open and closed pores) increased with the decrease in particle size (Table 2). This characteristic indicates that the increased porosity is due to the artificial pores or fractures created by the pulverization process. Previous studies [11,15] have shown that shear and compression forces in the crushing process induce the formation of new fractures and smaller fragments in the shale, generating new porosity, which is consistent with the results of our FE-EM observations. In addition, during the crushing process, the shale samples commonly fracture along the inherent weak parts, which will also lead to the disappearance of some microfractures [28,39]. Based on the analysis of the above results, a hypothetical model of the effect of the crushing process on the pore structure in shale was established (Figure 10). As illustrated in Figure 10, when an intact shale sample is crushed into particles, the pore connectivity in the shale is significantly enhanced. For a particle, artificial fractures or pores may form on the surface or interior of the particle. Meanwhile, some isolated pore networks may also be exposed to the particle surface or connected by new fractures.
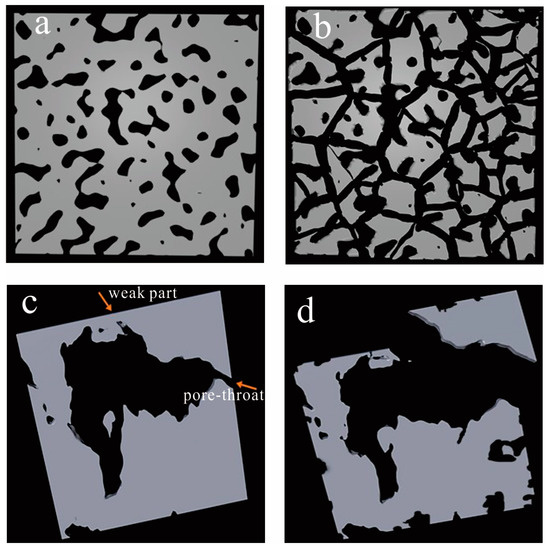
Figure 10.
Model of an intact shale and a particle shale (a,c) before and (b,d) after crushing (the gray areas denote the shale solid matrix, and the black areas denote pores or fractures space).
The results of the MICP data indicate that MICP porosity increases with the decrease in sample size (Table 3). For the MICP test, shale can be divided into three constituents: accessible pores, inaccessible pores, and solid matrix [40,41]. The primary pores in the overmature shale have been greatly reduced after a long period of compaction and cementation [42,43]. In addition, the closure of minerals to the organic matter pore system results in low overall pore connectivity in the overmature shale [10,44,45]. Therefore, with the increase in sample size, the pore connectivity of shale decreases further, which results in a lower cumulative mercury intrusion, consistent with the reduction in accessible porosity. Moreover, as can be seen from the schematic representation of particle size reduction (Figure 10c,d), the disappearance of some pore throats results in a lower driving pressure for mercury entering the pores. When pore throats less than 3 nm (corresponding to a maximum pressure of 60,000 psia) are damaged, the pores that are inaccessible to mercury become accessible, thus increasing the accessible porosity. Gas injection porosimetry experiments from Sun et al. [46] also indicated that the crushing process decreases the required total diffusion time and minimum gas injection pressure. The results of MICP show that the destruction of the smaller pore throat is the primary cause of the increase in APtS and the decrease in total pore area with an increase in the crushing level.
The studies of Davudov et al. [47] and Hu et al. [7] on Barnett shale show that permeability and diffusivity increase as the sample size decreases. The permeability measured by MICP in shale is a strongly correlated function of accessible porosity and APtS [47]. Therefore, the increase in these two parameters is bound to increase shale permeability. However, the permeability values obtained from the helium shale matrix permeameter (Core Laboratories SMP 200) in the Woodford Shale decrease with a decrease in the sample particle size [28]. Compared with the permeability measured by MICP, the permeability of the shale matrix measured by the helium pressure-decay method is primarily at the nano-Darcy scale [28], which is inconsistent with the micro-Darcy scale permeability reported by Davudov and Moghanloo [16]. This also indicates that the shale matrix permeability is controlled by pore-throat distribution. With the reduction in particle size, the disappearance of a smaller pore throat will cause some transport pores to become dead-end pores, which will lead to a loss of seepage capacity and a decrease in matrix permeability.
The effect of the particle size on the pore structure parameters obtained by low-pressure gas (N2, CO2, and H2O) physisorption are compared with those generated by MICP and SANS (Table 2 and Table 3). The pore structure characterization in the shales using the gas adsorption techniques range from micropores to macropores with the increase in pressure, which is opposite to the order of Hg entering the pores in MICP [48,49]. For N2 adsorption, the connectivity of the pore network, especially for sizes larger than 10 nm, is significantly enhanced (Figure 4), which is consistent with previous studies [11,13]. However, according to the results of sample RY2-18 (Figure 4), the particle sizes of 80~200 mesh will cause some small pores to be damaged. A similar phenomenon of pore destruction was observed in the results of CO2 adsorption, but the overall effect on the pore system parameters was not significant. For WVA, an increasing trend was found for the total adsorption at 95% RH with a decreasing particle size, which could be dependent on the enhanced connectivity of the hydrophilic pore network [50]. The pore structure changes associated with clay minerals observed by FE-SEM may be responsible for the increased water adsorption sites. Similarly, previous studies also found that the methane uptake rate and excess sorption capacity of shale increased with a decrease in particle size [29,51]. This also indicates that the physical disruption of shale fabric will improve the pore connectivity and, thus, more methane adsorption sites. In addition, the increased artificial space can improve the swelling ability of shale after methane adsorption [52,53].
Moreover, evidence for the weaker hysteresis effect of N2 in the pores associated with smaller particle sizes (Figure 4) is related to the increased pore connectivity due to shorter flow paths. However, the hysteresis loops of water vapor sorption did not tighten with a decreasing particle size (Figure 6). In contrast, AHI increased with decreasing particle size, suggesting that wettability, in addition to pore structure, also caused fluid retention in the pores [35,36,50]. The closed porosities of various shales calculated by comparing the results of N2 adsorption and SANS have been reported in some studies [20,54,55]. However, in this work, the results of SANS were found to contain information on artificial pores rather than those of gas adsorption. Therefore, for the same particle size, the closed porosity measured by comparing the results of N2 adsorption and SANS is generally overestimated.
4.2. Implications for Sample Size Selection of Different Methods
The size of the sample has a great influence on the determination of the petrophysical parameters of shale using different measurement methods. The heterogeneity of shale is characterized by rich microstructural features (microfractures and laminae), complex components (organic matter and minerals), and multi-scale pore structure (from nanometers to micrometers) [56,57,58]. As shown in Figure 11, for the same intact shale sample, sampling at different locations for testing may produce different results. In addition, based on the analysis of Section 4.1, the difference in the results of particle size variation obtained by several methods is primarily related to the different theoretical bases.
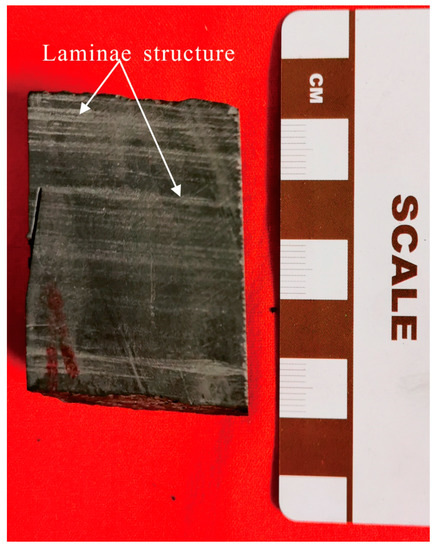
Figure 11.
Sedimentary structure characteristics of the TY1-20 sample.
For the neutron scattering technique, the most significant advantage is the nondestructive determination of the total porosity, including open and closed pores. Gu et al. [59] studied Marcellus shale with different sampling directions (parallel and perpendicular to the lamination) and found that the scattering pattern of the parallel layered samples is isotropic, while that of the vertically layered samples is anisotropic. The study of pore anisotropy in oriented shale wafers using SANS provides new insights for shale gas storage, migration, and preservation [23,60,61]. The SANS test on particle shale samples results in isotropic scattering patterns due to the reduced effects of bedding and microfractures. For the same shale sample, the scattering intensity for particles is higher overall in the low Q range than in the intact wafer [22]. The results of this work also indicate that the downsizing of particles will increase the SANS porosity due to the creation of more artificial pore space. Therefore, it is imperative to select an intact shale wafer in the SANS test to limit the analytical error caused by artificial space on the shale surface. Shale wafers with a thickness of 0.15~0.5 mm seem to be optimal for performing SANS analysis, considering the scattering time and multiple scattering of the shale.
The MICP measurement provides multi-scale (nm-μm-scale) information regarding the pore throats of shale [62,63,64]. Compared with the intact shale sample, the real pore throat distribution characteristics could not be provided with the destruction of small pore throat with particle reduction (Figure 7). Meanwhile, the artificially increased pore space is also reflected in the results of MICP. According to Yu et al. [27], the MICP results for 20~35 mesh particle shale samples can be corrected by fractal theory. However, the study only eliminated the error of mercury intrusion between particles without mentioning the effect of pore-throat damage. In addition, the smaller the particle is, the larger the modified exterior surface will be, causing the edge-accessible pores in shale to constitute a high percentage of the interior volume, which cannot truly reflect the pore-throat distribution of the shale [7,65]. As shown in Figure 11, the selection of representative positions at the centimeter scale can reflect the pore characteristics of shale more comprehensively. Therefore, the cubic samples (~1 cm3) with polished surfaces reduced the effect of cutting pockmarks and pore-throat damage and were more suitable for the MICP test. Moreover, previous studies have confirmed that MICP with cubes from overmature shale has minimal compression effects [40,66].
Many studies have demonstrated that more pores can be accessible to the adsorption gas (e.g., N2, CO2, and H2O) as the particle size of pulverized shale decreased [11,14,50]. Meanwhile, samples with smaller particle sizes can shorten the equilibration time and increase the desorption rate [41]. Therefore, Mastalerz et al. [14] suggested that a 200 mesh size of shale is more suitable for N2 and CO2 analysis to determine the total pore volume. However, the N2 and CO2 adsorption results in this work indicate that an extremely fine particle size (80–200 mesh) may result in the destruction of finer mesopores (i.e., less than 10 nm) and micropores, which is consistent with the study of Hazra et al. [15]. Gas adsorption experiments typically measure pore size ranges of less than 100 nm and rarely involve artificial pores and fractures on the shale surface during the grinding process [12,13]. Considering the equilibration time and original pore connectivity characteristics of shale, 35~80 mesh particle samples provide good quality and reliable data for characterizing the PSD and calculating the pore volume of the overmature shale. For WVA of overmature shale, it is recommended to use consistent particle sizes for comparison with other gas adsorption results.
Due to the intrinsic heterogeneity of shale, the information to be included should be selected when characterizing the pore characteristics of organic-rich shales. Pore structure characterization is a significant part of a petrophysical evaluation of shale reservoirs and for assessing shale gas productivity. However, even for samples with the same particle size, discrepant results will be produced owing to the different principles and error sources of each test method. Therefore, future research on pore characteristics will need a multidisciplinary approach to obtain a more comprehensive, larger scale, and more reliable results.
5. Conclusions
Multiple tests, including SANS, MICP, gas (N2, CO2, and H2O) physisorption, and FE-SEM, were conducted to analyze the influence of particle size on the pore characteristics of the two overmature shales. The following main conclusions can be summarized:
- (1)
- The results consistently show that artificial pores and fractures are created on the surface or interior of the particles during the pulverization process. The pore connectivity of the shale is enhanced as some isolated pore networks may be exposed to the particle surface or connected by new fractures.
- (2)
- For the SANS analysis of the shale, intact wafers with a thickness of 0.15~0.5 mm and an area of approximately 1 cm2 are the optimal sample size. Fine particles less than 80 mesh are not recommended because the result will include information regarding artificial pores and fractures.
- (3)
- For the MICP test, the cubic samples (~1 cm3) appear to be optimal. The downsizing of particles will lead to the destruction of the pore-throat, which cannot reflect the true pore-throat distribution of shale using the MICP test.
- (4)
- Gas adsorption is usually conducted on the same shale samples for comparison. Considering the equilibration time and original pore connectivity characteristics of shale, 35~80 mesh is the most practical for overmature shale.
Highlights
- (1)
- The analytical sample size influences small-angle neutron scattering and fluid intrusion results.
- (2)
- A model of the effect of the crushing process on the pore structure was established by visual and quantitative techniques.
- (3)
- An intact wafer with a thickness of 0.15~0.5 mm is recommended for SANS measurements.
- (4)
- Cubic samples (~1 cm3) appear to be optimal for MICP analysis of shale.
- (5)
- The 35–80 mesh particle size range is optimum for overmature shale samples used in gas adsorption.
Author Contributions
As corresponding authors, S.J. and M.S. have made substantial contributions to the conception of the work. Y.S. analyzed the experimental results and drafted the manuscript. Y.X., L.Z., X.Z., L.S., L.B., Q.H. and T.P.B. performed the various tests and helped with the synthesis results. Z.P. contributed to the preparation and revision of the manuscript. All authors have read and agreed to the published version of the manuscript.
Funding
This research was funded by National Natural Science Foundation (Grant Nos. 41802146, 41830431and 41690134), the Strategic Priority Research Program of the Chinese Academy of Sciences (No. XDA14010302), Key Laboratory of Tectonics and Petroleum Resources (TPR-2019-09), and the Fundamental Research Funds for the Central Universities (No. CUG180608) of China, for their financial support.
Conflicts of Interest
The authors declare no conflict of interest.
References
- Clarkson, C.R.; Solano, N.; Bustin, R.; Bustin, A.; Chalmers, G.R.L.; He, L.; Melnichenko, Y.; Radlinski, A.P.; Blach, T. Pore Structure Characterization of North American Shale Gas Reservoirs Using Usans/Sans, Gas Adsorption, and Mercury Intrusion. Fuel 2013, 103, 606–616. [Google Scholar] [CrossRef]
- Guo, T. The Fuling Shale Gas Field—A Highly Productive Silurian Gas Shale With High Thermal Maturity and Complex Evolution History, Southeastern Sichuan Basin, China. Interpretation 2015, 3, SJ25–SJ34. [Google Scholar] [CrossRef]
- Sun, M.; Zhao, J.; Pan, Z.; Hu, Q.; Yu, B.; Tan, Y.; Sun, L.; Bai, L.; Wu, C.; Blach, T.P.; et al. Pore Characterization of Shales: A Review of Small Angle Scattering Technique. J. Nat. Gas Sci. Eng. 2020, 78, 103294. [Google Scholar] [CrossRef]
- Chalmers, G.R.; Bustin, R.M.; Power, I.M. Characterization of Gas Shale Pore Systems by Porosimetry, Pycnometry, Surface Area, and Field Emission Scanning Electron Microscopy/Transmission Electron Microscopy Image Analyses: Examples from the Barnett, Woodford, Haynesville, Marcellus, and Doig Units. AAPG Bull. 2012, 96, 1099–1119. [Google Scholar] [CrossRef]
- Ko, L.T.; Ruppel, S.C.; Loucks, R.G.; Hackley, P.C.; Zhang, T.; Shao, D. Pore-Types and Pore-Network Evolution in Upper Devonian-Lower Mississippian Woodford and Mississippian Barnett Mudstones: Insights From Laboratory Thermal Maturation and Organic Petrology. Int. J. Coal Geol. 2018, 190, 3–28. [Google Scholar] [CrossRef]
- Javadpour, F.; Fisher, D.; Unsworth, M. Nanoscale Gas Flow in Shale Gas Sediments. J. Can. Pet. Technol. 2007, 46, 10. [Google Scholar] [CrossRef]
- Hu, Q.; Ewing, R.P.; Rowe, H.D. Low Nanopore Connectivity Limits Gas Production in Barnett Formation. J. Geophys. Res. Solid Earth 2015, 120, 8073–8087. [Google Scholar] [CrossRef]
- Zhang, L.; Xiong, Y.; Li, Y.; Wei, M.; Jiang, W.; Lei, R.; Wu, Z. DFT Modeling of CO2 and Ar Low-Pressure Adsorption for Accurate Nanopore Structure Characterization in Organic-Rich Shales. Fuel 2017, 204, 1–11. [Google Scholar] [CrossRef]
- Rijfkogel, L.S.; GhanbarianiD, B.; Hu, Q.; Liu, H.-H. Clarifying Pore Diameter, Pore Width, and Their Relationship Through Pressure Measurements: A Critical Study. Mar. Pet. Geol. 2019, 107, 142–148. [Google Scholar] [CrossRef]
- Sun, M.; Zhang, L.; Hu, Q.; Pan, Z.; Yu, B.; Sun, L.; Bai, L.; Fu, H.; Zhang, Y.; Zhang, C.; et al. Multiscale Connectivity Characterization of Marine Shales in Southern China by Fluid Intrusion, Small-Angle Neutron Scattering (SANS), and FIB-SEM. Mar. Pet. Geol. 2020, 112, 104101. [Google Scholar] [CrossRef]
- Chen, Y.; Wei, L.; Mastalerz, M.; Schimmelmann, A. The Effect of Analytical Particle Size on Gas Adsorption Porosimetry of Shale. Int. J. Coal Geol. 2015, 138, 103–112. [Google Scholar] [CrossRef]
- Wei, M.; Xiong, Y.; Zhang, L.; Li, J.; Peng, P. The Effect of Sample Particle Size on the Determination of Pore Structure Parameters in Shales. Int. J. Coal Geol. 2016, 163, 177–185. [Google Scholar] [CrossRef]
- Han, H.; Cao, Y.; Chen, S.-J.; Lu, J.-G.; Huang, C.-X.; Zhu, H.-H.; Zhan, P.; Gao, Y. Influence of Particle Size on Gas-Adsorption Experiments of Shales: An Example From a Longmaxi Shale Sample from the Sichuan Basin, China. Fuel 2016, 186, 750–757. [Google Scholar] [CrossRef]
- Mastalerz, M.; Hampton, L.; Drobniak, A.; Loope, H. Significance of Analytical Particle Size in Low-Pressure N2 and CO2 Adsorption of Coal and Shale. Int. J. Coal Geol. 2017, 178, 122–131. [Google Scholar] [CrossRef]
- Hazra, B.; Zhang, Z.; Vishal, V.; Singh, A.K. Pore Characteristics of Distinct Thermally Mature Shales: Influence of Particle Size on Low-Pressure CO2 and N2 Adsorption. Energy Fuels 2018, 32, 8175–8186. [Google Scholar] [CrossRef]
- Davudov, D.; Moghanloo, R.G. Scale-Dependent Pore and Hydraulic Connectivity of Shale Matrix. Energy Fuels 2018, 32, 99–106. [Google Scholar] [CrossRef]
- Yang, R.; Jia, A.; He, S.; Hu, Q.; Dong, T.; Hou, Y.; Yan, J. Water Adsorption Characteristics of Organic-Rich Wufeng and Longmaxi Shales, Sichuan Basin (China). J. Pet. Sci. Eng. 2020, 193, 107387. [Google Scholar] [CrossRef]
- Yang, R.; Jia, A.; He, S.; Hu, Q.; Sun, M.; Dong, T.; Hou, Y.; Zhou, S. Experimental Investigation of Water Vapor Adsorption Isotherm on Gas-Producing Longmaxi Shale: Mathematical Modeling and Implication for Water Distribution in Shale Reservoirs. Chem. Eng. J. 2021, 406, 125982. [Google Scholar] [CrossRef]
- Xu, H. Probing Nanopore Structure and Confined Fluid Behavior in Shale Matrix: A Review on Small-Angle Neutron Scattering Studies. Int. J. Coal Geol. 2020, 217, 103325. [Google Scholar] [CrossRef]
- Sun, M.; Yu, B.; Hu, Q.; Zhang, Y.; Li, B.; Yang, R.; Melnichenko, Y.B.; Cheng, G. Pore Characteristics of Longmaxi Shale Gas Reservoir in the Northwest of Guizhou, China: Investigations Using Small-Angle Neutron Scattering (SANS), Helium Pycnometry, and Gas Sorption Isotherm. Int. J. Coal Geol. 2017, 171, 61–68. [Google Scholar] [CrossRef]
- Sun, M.; Zhang, L.; Hu, Q.; Pan, Z.; Yu, B.; Sun, L.; Bai, L.; Connell, L.D.; Zhang, Y.; Cheng, G. Pore Connectivity and Water Accessibility in Upper Permian Transitional Shales, Southern China. Mar. Pet. Geol. 2019, 107, 407–422. [Google Scholar] [CrossRef]
- Zhang, Y.; Hu, Q.; Long, S.; Zhao, J.; Peng, N.; Wang, H.; Lin, X.; Sun, M. Mineral-Controlled NM-μM-Scale Pore Structure of Saline Lacustrine Shale in Qianjiang Depression, Jianghan Basin, China. Mar. Pet. Geol. 2019, 99, 347–354. [Google Scholar] [CrossRef]
- Zhang, R.; Liu, S.; He, L.; Blach, T.P.; Wang, Y. Characterizing Anisotropic Pore Structure and Its Impact on Gas Storage and Transport in Coalbed Methane and Shale Gas Reservoirs. Energy Fuels 2020, 34, 3161–3172. [Google Scholar] [CrossRef]
- Zhang, Y.; Barber, T.J.; Hu, Q.; Bleuel, M.; El-Sobky, H.F. Complementary Neutron Scattering, Mercury Intrusion and SEM Imaging Approaches to Micro- and Nano-Pore Structure Characterization of Tight Rocks: A Case Study of the Bakken Shale. Int. J. Coal Geol. 2019, 212, 103252. [Google Scholar] [CrossRef]
- Sun, M.; Yu, B.; Hu, Q.; Yang, R.; Zhang, Y.; Li, B.; Melnichenko, Y.B.; Cheng, G. Pore Structure Characterization of Organic-Rich Niutitang Shale From ChinA: Small Angle Neutron Scattering (SANS) Study. Int. J. Coal Geol. 2018, 186, 115–125. [Google Scholar] [CrossRef]
- Bahadur, J.; Radlinski, A.P.; Melnichenko, Y.B.; Mastalerz, M.; Schimmelmann, A. Small-Angle and Ultrasmall-Angle Neutron Scattering (SANS/USANS) Study of New Albany Shale: A Treatise on Microporosity. Energy Fuels 2015, 29, 567–576. [Google Scholar] [CrossRef]
- Yu, Y.; Luo, X.; Wang, Z.; Cheng, M.; Lei, Y.; Zhang, L.; Yin, J. A New Correction Method for Mercury Injection Capillary Pressure (MICP) to Characterize the Pore Structure of Shale. J. Nat. Gas Sci. Eng. 2019, 68, 102896. [Google Scholar] [CrossRef]
- Achang, M.; Cui, X.; Pashin, J.C. The Influence of Particle Size, Microfractures, and Pressure Decay on Measuring the Permeability of Crushed Shale Samples. Int. J. Coal Geol. 2017, 183, 174–187. [Google Scholar] [CrossRef]
- Gaus, G.; Kalmykov, A.; Krooss, B.M.; Fink, R. Experimental Investigation of the Dependence of Accessible Porosity and Methane Sorption Capacity of Carbonaceous Shales on Particle Size. Geofluids 2020, 2020, 2382153. [Google Scholar] [CrossRef]
- Radliński, A.; Boreham, C.; Lindner, P.; Randl, O.; Wignall, G.; Hinde, A.; Hope, J. Small Angle Neutron Scattering Signature of Oil Generation in Artificially and Naturally Matured Hydrocarbon Source Rocks. Org. Geochem. 2000, 31, 1–14. [Google Scholar] [CrossRef]
- Zhang, Y.; Hu, Q.; Barber, T.J.; Bleuel, M.; Anovitz, L.M.; Littrell, K. Quantifying Fluid-Wettable Effective Pore Space in the Utica and Bakken Oil Shale Formations. Geophys. Res. Lett. 2020, 47. [Google Scholar] [CrossRef]
- Mastalerz, M.; Schimmelmann, A.; Drobniak, A.; Chen, Y. Porosity of Devonian and Mississippian New Albany Shale Across a Maturation Gradient: Insights From Organic Petrology, Gas Adsorption, and Mercury Intrusion. AAPG Bull. 2013, 97, 1621–1643. [Google Scholar] [CrossRef]
- Zolfaghari, A.; Dehghanpour, H.; Xu, M. Water Sorption Behaviour of Gas Shales: II. Pore Size Distribution. Int. J. Coal Geol. 2017, 179, 187–195. [Google Scholar] [CrossRef]
- Anovitz, L.A.; Cole, D.R. Characterization and Analysis of Porosity and Pore Structures. Rev. Miner. Geochem. 2015, 80, 61–164. [Google Scholar] [CrossRef]
- Zolfaghari, A.; Dehghanpour, H.; Holyk, J. Water Sorption Behaviour of Gas Shales: I. Role of Clays. Int. J. Coal Geol. 2017, 179, 130–138. [Google Scholar] [CrossRef]
- Cheng, P.; Tian, H.; Xiao, X.; Gai, H.; Li, T.; Wang, X. Water Distribution in Overmature Organic-Rich Shales: Implications from Water Adsorption Experiments. Energy Fuels 2017, 31, 13120–13132. [Google Scholar] [CrossRef]
- Tang, X.; Ripepi, N.; Valentine, K.A.; Keles, C.; Long, T.; Gonciaruk, A. Water Vapor Sorption on Marcellus Shale: Measurement, Modeling and Thermodynamic Analysis. Fuel 2017, 209, 606–614. [Google Scholar] [CrossRef]
- Wang, S.; Javadpour, F.; Feng, Q. Confinement Correction to Mercury Intrusion Capillary Pressure of Shale Nanopores. Sci. Rep. 2016, 6, 20160. [Google Scholar] [CrossRef]
- Chen, Y.; Qin, Y.; Wei, C.; Huang, L.; Shi, Q.; Wu, C.; Zhang, X. Porosity Changes in Progressively Pulverized Anthracite Subsamples: Implications for the Study of Closed Pore Distribution in Coals. Fuel 2018, 225, 612–622. [Google Scholar] [CrossRef]
- Davudov, D.; Moghanloo, R.G. Impact of Pore Compressibility and Connectivity Loss on Shale Permeability. Int. J. Coal Geol. 2018, 187, 98–113. [Google Scholar] [CrossRef]
- Zheng, D.; Su, Y.; Reza, Z. Integrated Pore-Scale Characterization of Mercury Injection/Imbibition and Isothermal Adsorption/Desorption Experiments Using Dendroidal Model for Shales. J. Pet. Sci. Eng. 2019, 178, 751–765. [Google Scholar] [CrossRef]
- Zhao, J.; Jin, Z.; Hu, Q.; Liu, K.; Liu, G.; Gao, B.; Liu, Z.; Zhang, Y.; Wang, R. Geological Controls on the Accumulation of Shale Gas: A Case Study of the Early Cambrian Shale in the Upper Yangtze Area. Mar. Pet. Geol. 2019, 107, 423–437. [Google Scholar] [CrossRef]
- Zhao, J.; Jin, Z.; Jin, Z.; Hu, Q.; Hu, Z.; Du, W.; Yan, C.; Geng, Y. Mineral Types and Organic Matters of the Ordovician-Silurian Wufeng and Longmaxi Shale in the Sichuan Basin, China: Implications for Pore Systems, Diagenetic Pathways, and Reservoir Quality in Fine-Grained Sedimentary Rocks. Mar. Pet. Geol. 2017, 86, 655–674. [Google Scholar] [CrossRef]
- Tang, X.; Jiang, Z.; Li, Z.; Gao, Z.; Bai, Y.; Zhao, S.; Feng, J. The Effect of the Variation in Material Composition on the Heterogeneous Pore Structure of High-Maturity Shale of the Silurian Longmaxi Formation in the Southeastern Sichuan Basin, China. J. Nat. Gas Sci. Eng. 2015, 23, 464–473. [Google Scholar] [CrossRef]
- Tang, X.; Jiang, Z.; Jiang, S.; Wang, P.; Xiang, C. Effect of Organic Matter and Maturity on Pore Size Distribution and Gas Storage Capacity in High-Mature to Post-Mature Shales. Energy Fuels 2016, 30, 8985–8996. [Google Scholar] [CrossRef]
- Sun, J.; Dong, X.; Wang, J.; Schmitt, D.R.; Xu, C.; Mohammed, T.; Chen, D. Measurement of Total Porosity for Gas Shales by Gas Injection Porosimetry (GIP) Method. Fuel 2016, 186, 694–707. [Google Scholar] [CrossRef]
- Davudov, D.; Moghanloo, R.G.; Lan, Y. Evaluation of Accessible Porosity Using Mercury Injection Capillary Pressure Data in Shale Samples. Energy Fuels 2018, 32, 4682–4694. [Google Scholar] [CrossRef]
- Sun, M.; Yu, B.; Hu, Q.; Chen, S.; Xia, W.; Ye, R. Nanoscale pore characteristics of the Lower Cambrian Niutitang Formation Shale: A Case Study From Well Yuke #1 in the Southeast of Chongqing, China. Int. J. Coal Geol. 2016, 16–29. [Google Scholar] [CrossRef]
- Sun, M.; Yu, B.; Hu, Q.; Yang, R.; Zhang, Y.; Li, B. Pore Connectivity and Tracer Migration of Typical Shales in South China. Fuel 2017, 203, 32–46. [Google Scholar] [CrossRef]
- Yang, R.; Jia, A.; Hu, Q.; Guo, X.; Sun, M. Particle Size Effect on Water Vapor Sorption Measurement of Organic Shale: One Example From Dongyuemiao Member of Lower Jurassic Ziliujing Formation in Jiannan Area of China. Adv. Geo-Energy Res. 2020, 4, 207–218. [Google Scholar] [CrossRef]
- Zou, J.; Rezaee, R. Effect of Particle Size on High-Pressure Methane Adsorption of Coal. Pet. Res. 2016, 1, 53–58. [Google Scholar] [CrossRef]
- Wang, Y.; Liu, L.; Sheng, Y.; Wang, X.; Zheng, S.; Luo, Z. Investigation of Supercritical Methane Adsorption of Overmature Shale in Wufeng-Longmaxi Formation, Southern Sichuan Basin, China. Energy Fuels 2019, 33, 2078–2089. [Google Scholar] [CrossRef]
- Ju, Y.; He, J.; Chang, E.; Zheng, L. Quantification of CH4 Adsorption Capacity in Kerogen-Rich Reservoir Shales: An Experimental Investigation and Molecular Dynamic Simulation. Energy 2019, 170, 411–422. [Google Scholar] [CrossRef]
- Mastalerz, M.; He, L.; Melnichenko, Y.B.; Rupp, J.A. Porosity of Coal and Shale: Insights from Gas Adsorption and SANS/USANS Techniques. Energy Fuels 2012, 26, 5109–5120. [Google Scholar] [CrossRef]
- Liu, K.; Ostadhassan, M.; Sun, L.; Zou, J.; Yuan, Y.; Gentzis, T.; Zhang, Y.; Carvajal-Ortiz, H.; Rezaee, R. A Comprehensive Pore Structure Study of the Bakken Shale with SANS, N2 Adsorption and Mercury Intrusion. Fuel 2019, 245, 274–285. [Google Scholar] [CrossRef]
- Jiang, S.; Xu, Z.; Feng, Y.; Zhang, J.; Cai, D.; Chen, L.; Wu, Y.; Zhou, D.; Bao, S.; Long, S. Geologic Characteristics of Hydrocarbon-Bearing Marine, Transitional and Lacustrine Shales in China. J. Asian Earth Sci. 2016, 115, 404–418. [Google Scholar] [CrossRef]
- Milliken, K.L.; Esch, W.L.; Reed, R.M.; Zhang, T. Grain Assemblages and Strong Diagenetic Overprinting in Siliceous Mudrocks, Barnett Shale (Mississippian), Fort Worth Basin, Texas. AAPG Bull. 2012, 96, 1553–1578. [Google Scholar] [CrossRef]
- Cao, X.; Gao, Y.; Cui, J.; Han, S.; Kang, L.; Song, S.; Wang, C. Pore Characteristics of Lacustrine Shale Oil Reservoir in the Cretaceous Qingshankou Formation of the Songliao Basin, NE China. Energies 2020, 13, 2027. [Google Scholar] [CrossRef]
- Gu, X.; Cole, D.R.; Rother, G.; Mildner, D.F.R.; Brantley, S.L. Pores in Marcellus Shale: A Neutron Scattering and FIB-SEM Study. Energy Fuels 2015, 29, 1295–1308. [Google Scholar] [CrossRef]
- Liu, S.; Zhang, R. Anisotropic Pore Structure of Shale and Gas Injection-Induced Nanopore Alteration: A Small-Angle Neutron Scattering Study. Int. J. Coal Geol. 2020, 219, 103384. [Google Scholar] [CrossRef]
- Blach, T.; Radliński, A.P.; Edwards, D.S.; Boreham, C.J.; Gilbert, E.P. Pore Anisotropy in Unconventional Hydrocarbon Source Rocks: A Small-Angle Neutron Scattering (SANS) Study on the Arthur Creek Formation, Georgina Basin, Australia. Int. J. Coal Geol. 2020, 225, 103495. [Google Scholar] [CrossRef]
- Huang, H.; Chen, L.; Dang, W.; Luo, T.; Sun, W.; Jiang, Z.; Tang, X.; Zhang, S.; Ji, W.; Shao, S.; et al. Discussion on the Rising Segment of the Mercury Extrusion Curve in the High Pressure Mercury Intrusion Experiment on Shales. Mar. Pet. Geol. 2019, 102, 615–624. [Google Scholar] [CrossRef]
- Moghadam, A.; Vaisblat, N.; Harris, N.B.; Chalaturnyk, R. On the Magnitude of Capillary Pressure (Suction Potential) in Tight Rocks. J. Pet. Sci. Eng. 2020, 190, 107133. [Google Scholar] [CrossRef]
- El Sharawy, M.S.; Gaafar, G.R. Pore-Throat Size Distribution Indices and Their Relationships with the Petrophysical Properties of Conventional and Unconventional Clastic Reservoirs. Mar. Pet. Geol. 2019, 99, 122–134. [Google Scholar] [CrossRef]
- Hu, Q.; Liu, H.; Yang, R.; Zhang, Y.X.; Kibria, G.; Sahi, S.; Alatrash, N.; MacDonnell, F.M.; Chen, W. Applying Molecular and Nanoparticle Tracers to Study Wettability and Connectivity of Longmaxi Formation in Southern China. J. Nanosci. Nanotechnol. 2017, 17, 6284–6295. [Google Scholar] [CrossRef]
- Zhao, J.; Jin, Z.; Jianhua, Z.; Jin, Z.; Barber, T.J.; Zhang, Y.; Bleuel, M. Integrating SANS And Fluid-Invasion Methods to Characterize Pore Structure of Typical American Shale Oil Reservoirs. Sci. Rep. 2017, 7, 15413. [Google Scholar] [CrossRef]
Publisher’s Note: MDPI stays neutral with regard to jurisdictional claims in published maps and institutional affiliations. |
© 2020 by the authors. Licensee MDPI, Basel, Switzerland. This article is an open access article distributed under the terms and conditions of the Creative Commons Attribution (CC BY) license (http://creativecommons.org/licenses/by/4.0/).