Article

Implementation of the Indoor Environmental Quality (IEQ) Model for the Assessment of a Retrofitted Historical Masonry Building

by
Michał Piasecki
1,*,
Elżbieta Radziszewska-Zielina
2,
Piotr Czerski
3,
Małgorzata Fedorczak-Cisak
4,
Michał Zielina
5,
Paweł Krzyściak
6,
Patrycja Kwaśniewska-Sip
7 and
Wojciech Grześkowiak
8
1
Department of Thermal Physics, Acoustics and Environment, Building Research Institute, Filtrowa 1, 00-611 Warsaw, Poland
2
Faculty of Civil Engineering, Chair of Management in Construction, Cracow University of Technology, 24 Warszawska Street, 31-155 Kraków, Poland
3
Construction and Conservation Company EXIMRENO, Sp. z o.o. 5/5 Makowskiego Street, 30-322 Kraków, Poland
4
Lesser Poland Centre of Energy Efficient Construction, Cracow University of Technology, 114 Lea Street, 30-133 Kraków, Poland
5
Faculty of Environmental and Engineering, Cracow University of Technology, 24 Warszawska Street, 31-155 Kraków, Poland
6
Department of Mycology, Faculty of Medicine, Chair of Microbiology, Jagiellonian University Collegium Medicum, 18 Czysta Street, 31-121 Kraków, Poland
7
Air Quality Investigation Department, Łukasiewicz Research Network—Wood Technology Institute, 1 Winiarska Street, 60-654 Poznań, Poland
8
Faculty of Wood Technology, Institute of Chemical Wood Technology, Poznań University of Life Sciences, 38/42 Wojska Polskiego Street, 60-637 Poznań, Poland
*
Author to whom correspondence should be addressed.
Energies 2020, 13(22), 6051; https://doi.org/10.3390/en13226051
Submission received: 15 October 2020 / Revised: 6 November 2020 / Accepted: 16 November 2020 / Published: 19 November 2020
(This article belongs to the Collection Feature Papers in Energy, Environment and Well-Being)

Abstract

:
Achieving a satisfactory level for indoor environments of historical buildings is an ongoing problem that needs to be solved due to a large demand for deep retrofits in the whole of Europe. The implementation of the indoor environmental quality index (IEQ) to predict an occupant’s satisfaction in thermo-modernized historical buildings is a new concept which is a response to existing needs. In this article, a relevant study is provided with the intention to evaluate the indoor environmental performance of retrofitting effects in historical buildings dating back to the years 1873–1878. Considering the historical character of the buildings, some of the cellar spaces were fitted out with an innovative internal insulation system of mineral sheets based on calcium silicate to prevent water vapor condensation and effectively limit mold growth. The IEQ methodology was applied for retrofitted and non-retrofitted spaces as a comparison. Four essential components of indoor quality are investigated: thermal comfort, indoor air quality, acoustic comfort, and visual quality. The results of sub-component indexes are calculated based on the measured indoor parameters and the specific sensory functions. This paper discusses the results of an indoor environmental analysis including a mycological air quality assessment with the newly developed IAQindex (fungal air contamination index), total volatile organic compound concentration (TVOC), CO2, and formaldehyde (HCHO) assessment, the evaluation energy-related thermal comfort, acoustic, and visual quality, of modernized spaces. A questionnaire survey study was additionally carried out among a building’s users intentioned to compare the accounts of satisfaction before and after the retrofitting process and also to compare “subjective” results with the one’s based on in situ tests. The retrofitting approach was proven to be effective in limiting the presence of molds and a significant difference in indoor environmental quality between thermally insulated and uninsulated spaces was observed and discussed.

1. Introduction

Historical buildings constitute a great share of the European building stock, about 40% of the buildings are over 50 years old, with more than 25% dating from before 1945. Historical buildings are very demanding in the context of changing the parameters of indoor comfort. When they were built, the main focus was usually paid to their architecture, durability, mechanical performance, and function, and to a much lesser extent the user’s health and satisfaction requirements. These buildings, in most cases, are not well insulated, and a significant part of the colder regions of Europe suffer from wall freezing, consequently, many have mycological problems. Their weakly controlled indoor environments often affect the occupants health, comfort, and work efficiency. For energy-saving reasons, retrofitted buildings are often becoming airtight, condemning people to artificial climatic conditions. The list of problems related to thermal modernization of historical buildings is long, and one of the basic problems to be solved by this paper is the development of a method in assessing the effects of thermal modernization for historical buildings. The formal and technical requirements for buildings are different than 200 years ago. A significant part of the basic requirements is related to thermal and acoustic comfort, functionality, and air quality. The scope of construction work performed in historical buildings is subjected to formal and legal regulations stipulated in the Construction Law Acts [1] and the Heritage Protection and Preservation Acts [2]. The technical conditions are often listed in the National Technical Building Codes [3]. The necessity to conserve energy in the construction sector results in passing stricter thermal protection regulations [4]. Additionally, when planning construction works in the center of urban agglomerations, surrounded by historic buildings, the appropriate selection of materials and technologies as well as the organization of works is not an easy matter [5,6]. When modernizing a historic building, one should also be careful not to worsen its technical condition [7].
Historical buildings are exempt from strict energy-related requirements [8]. However, such buildings are commonly used for functions involving the presence of people and its indoor environmental performance should be suitably adequate for a building’s usage [9,10]. Quite often, the technical condition of historical buildings, their thermal and damp-related problems, the resultant poor indoor air quality and mold growth, force owners to perform renovation work that is nevertheless subjected to significant constraints. Financial accountability for a modernization project is strongly dependent on the adopted technical solutions [4]. When considering the renovation and energy modernization of historic buildings, an improvement in the indoor quality environment and the achievement of parameters typical for energy-efficient buildings should ultimately lead to an improvement of the indoor quality and operational savings. However, it is related to the limitation of the usable area by a necessity to use internal thermal insulation. Due to the need to preserve architectural and historical goods and cultural heritage, it is not always possible to perform this type of protection from the outside [10]. However, when internal insulation is applied, the hygro-thermal characteristics is changed and moisture management is therefore an important task [11]. Two main approaches to moisture management are commonly recommended: using vapor-impermeable systems and using vapor-permeable, capillary-active systems. Using vapor-impermeable interior insulation systems prevents the water vapor flux in the wall with vapor-retardant foils, dense interior plaster, etc. The positive aspect of this type of insulation is that there is no condensation inside the partition wall. However, it is still possible to have migrating moisture that cannot dry out towards the inside, for example, when driving rain penetrates the wall. In this case, the use of vapor-retardant systems, where the vapor conductivity changes depending on the surrounding moisture level, are used. When using vapor-permeable, capillary-active, interior insulation systems vapor is allowed to diffuse into walls. They buffer the resulting moisture and remove it from the condensation place back towards the room. The method of finishing the insulation from the inside, materials used [12] including the paint coating [13], also influences the preservation of moisture in the wall. The hygroscopic storage capacity of vapor-permeable, capillary-active interior insulation systems may allow for humidity in indoor air to be buffered. Crucial to the functioning and performance of the interior insulation is the interaction between moisture buffering, vapor, and liquid water transport. An assessment of interior insulation types therefore requires exact and practical knowledge of these variables. An example study [14] has employed simulation method to analyze the hygro-thermal risks of internal insulation to investigate the environmental impact of the intervention. A detailed planning was required to analyze the state of the construction, to prepare the surfaces, to protect against the driving rain on the exterior wall, and to design for airtightness and thermal bridges [11].
Excessive mold growth in the indoor space of historical buildings can cause negative health conditions and specifically contribute to the development of health problems like asthma and a deterioration of comfort, limiting their use of indoor space [15,16,17,18,19]. People in cities spend increasingly more time indoors (87% on average), while studies indicate that in many cases the concentration of airborne pollutants within indoor environments may be much higher than in the outdoor environment [20,21]. Microbiological pollutants, e.g., molds, can be present in structural and finishing materials [22]. One comprehensive solution that can improve the indoor environmental quality and the comfort of use of indoor spaces is the use of calcium silicate panels applied from the inside. The materials used in the thermal insulation system under analysis are mineral products composed of calcium, quartz sand, and water. They do not emit toxins and do not contain substances prohibited in construction [20,21,22,23]. In [24], the authors presented a positive assessment of the comfort of use of buildings wherein thermal insulation was applied using the calcium silicate system in question in terms of mold removal. The case study was performed two months after the thermal insulation had been applied, which is a relatively short time. As indicated by the authors of [25], the primary factor that determines mold growth on construction materials is their organic substance content and their equilibrium moisture content. The calcium silicate panels are composed of inorganic substances and their equilibrium moisture content is relatively low [26], which positively affects mold growth prevention.
Technical and material solutions in retrofitted buildings impact the indoor environment [21,22]. The problem of low indoor environment quality in retrofitted buildings is very common and, in the author’s experience (as laboratory experts), at least 40% of historical buildings have significant problems due to bad acoustics, poor air quality, low thermal comfort in winter and summer plus a significant number of technical problems such as wet and freezing walls. A promising approach for an assessment of the quality of the indoor environment is indoor environmental quality assessment approach [24,25], which, due to the use of known indoor objective test methods, can answer the question whether the retrofitted indoor space provides satisfactory performance for occupants, i.e., the predicted percentage of dissatisfaction with individual environmental parameters can be calculated. The IEQ model is mainly combined of four elements of indoor environment quality [25,26]: thermal comfort, air quality in the room, acoustic comfort, and visual comfort. The IEQ model uses accepted sensory-based models for sub-components that quantify the impact of stimuli on human senses (predicted satisfaction expressed in %). The topic of modelling and determining the wide level of comfort in renovated and retrofitted buildings using approaches similar to the IEQ method in the literature has only a few positions. Paper [27] shows the assessment process of indoor environmental conditions in a partially retrofitted university building in Galway built in the 1970s and retrofitted in 2005. The research assesses criteria provided in EN standards (EN 15251 replaced by EN 16798-1 [28], ASHRAE 55 [29] and CBE IEQ survey [30]. Occupant “vote surveys” supported by measurements were used to assess the compliance of IEQ parameters including thermal, visual, and acoustic comfort and also indoor air quality. The relationship between the performance of the building’s envelope and occupant comfort were analyzed across retrofitted and non-retrofitted spaces. The work [27], however, did not address the problem of historical buildings where the level of mold growth is the basic element of air quality, which is a basic component of IEQ for us. In the research [31], the authors observe the effects of a ventilation system for energy efficiency and indoor environmental quality in a renovated historical building as well the IEQ approach is addressed but only a limited number of environmental quality indicators is used. The results of indoor environmental quality testing mainly focused on humidity, the CO2 concentration, PM10 concentration.
A review of a museum’s indoor environment conditions studies and guidelines and their impact on the museum’s artefacts and the energy consumption are provided in [32]. This review paper provides a rich guide of information in terms of a museum’s indoor environments parameters. Part of the information on the moisture, humidity, and the presence of fungi in the air is somehow analogous to our case study of a historical building.
The interesting research that has been published in the field of our interest is [33]. The proposed energy performance indoor environmental quality retrofit approach is a methodology to assist building owners who consider refurbishment or retrofitting of their buildings. The methodology is implemented into a software tool which identifies the appropriate refurbishment or retrofitting actions taking into account energy and indoor environmental quality issues. Because the approach to environmental assessments has changed in recent years, due to the introduction of new standards [28,29], it is currently not possible to use this method in practice. Paper [34] illustrates the energy-saving potential and indoor environmental quality performance of a façade addition on existing and low energy performing buildings. Different technical solutions are proposed, and the IEQ indicators’ simulation results are presented for the case of a students’ building block of the 1980s located in Athens. Nevertheless, the proposed methods cannot be directly transferred to a historical building, where different aspects require attention.
Currently, there is no method in the literature to assess the modernization effects of a historic building insulated from the inside, and therefore the topic proposed complements and extends the use of the IEQ method for this purpose. This paper presents the results of on-site research performed in the indoor spaces of historical masonry building located in Cracow’s historic city center. The building was built in the years 1873–1878 to house a military barracks. As mold growth had been observed in the cellars, it became necessary to conduct heavy modernization work. Due to the historical character of the buildings, an indoor thermal insulation system was applied. The indoor climate panels, apart from their thermal insulation properties, are to prevent water vapor condensation and, thanks to a highly basic environment, limit mold growth.
The main goal of the study is to present a practical guide for the indoor environment evaluation of a retrofitted historical building by using the IEQ modified model. The authors use a modified IEQ model to assess the impact of the modernization techniques used. The authors present the results of the air quality assessment (based on indoor objective measurements), including an evaluation of the mycological purity of air in terms of volatile substances (a new method), as well as studies concerning the assessment of the energy quality of the modernized spaces. Afterwards, the authors compare the effects of applying thermal insulation to the renovated spaces with test results for analogous spaces that were not modernized. Furthermore, to assess the indoor comfort a survey study was performed among the building occupants. The results obtained with the objective method are compared with the objective method based on the questionnaire.

2. Materials and Methods

2.1. Scope of Experimental Work

The study was aimed to assess the impact of the internal insulation system on the environmental quality of spaces. In the article, the authors considered the following main research issues:
  • Definition of boundary conditions for a method including case study definition with measurement strategy, equipment selection, determination of uncertainty.
  • Measurements of indoor quality elements including air pollution; CO2, volatile organic compounds (VOCs), fungal contamination, thermal comfort parameters, acoustic measurements, and intensity of light.
  • Conversion of measured physical values to predicted user satisfaction levels based on specific sensory equations/models.
  • Providing a new equation of user satisfaction level based on fungal air concentration and reference values from the literature.
  • Calculation of the IEQindex (measurement-based) value for the assessed building space before and after retrofitting (based on calculated sub-component values).
  • Calculation of the IEQindex (users questionnaire-based) value for the assessed building space before and after retrofitting (based on sub-component values).
  • In-depth mycological analysis of the object.
  • Assessment of the influence of applied thermal insulation system on the comfort parameters and environmental quality.
  • Comparison of IEQindex results by vote (questionnaire) and measurement method.
  • Discussion of the results.

2.2. Case-Study Building and Retrofitting Method

The case-study building of the Faculty of Environmental and Energy of the Cracow University of Technology (FEEE CUT) was built in the years 1872–1878, initially acting as a military barracks of the Austrian garrison within the complex of the Arch-Prince Rudolph Barracks of the Krakow Fortress. After the Second World War, the buildings were adapted for the purposes of the University. The analyzed building is a part of a complex of historical buildings (Figure 1).
The external and internal walls are made of solid brick on a cement mortar, mainly 60cm thick with thermal conductivity value 1.05 (W/m2 K). After a decision to adapt the cellar spaces for use as classrooms and gastronomical spaces, a technical audit was performed, which found a lack of a vertical damp proof course in the foundation walls, confirmed the presence of saltpeter rot in the plaster, mortar and bricks, and numerous instances of fungal colonies which found excellent conditions for growth due to the high damp level of the walls, an acidic base and positive temperatures. The project was co-funded by the Polish National Environmental Protection and Water Management Fund, as a part of the priority programme “Green Investment System”—energy management in public buildings. The scope of the energy retrofitting work for the building included the renovation of historical brick elevations and improving the thermal insulation of external partitions. The energy retrofitting of was performed by applying the Epatherm System (Figure 2), which—as stated by the manufacturer—prevents fungal growth, facilitates water vapor diffusion and has self-cleaning properties. This is of high significance considering the high yearly pollution indicators observed in Cracow. Declaration of the full system technical data is provided at http://www.epasit.pl/php/epatherm_lst.php. The main technical features of the plates are: persistent alkalinity at very high porosity and the ability to release excess moisture. System of lime-silicate boards with components (adhesive, putty, and paint) are characterized by resistance to changes in volume (no shrinking). The plates are able to absorb several times more water than its own weight, optimally equalizing the difference between temperature and air humidity, which is possible thanks to the low water vapor diffusion coefficient (µ = 3), moisture from the air does not condense on the surface of the walls, but is absorbed by the pores of the board and returned under appropriate conditions. The high alkalinity of the boards (pH = 12) does not allow for a fungal grow. Self-cleaning effect is declared due to the addition of titanium oxide. The water vapor permeability for the board itself is declared by manufacture as 3 (µ coefficient, see Table 1), for adhesive the manufacturer declared 8 ± 2. Some of the spaces on the upper floor of the building, which were in the best technical condition, were not subjected to energy retrofitting. The elements of the system applied have been presented in Figure 2.
The building spaces of the cellar were subjected to energy retrofitting using the system (section B, Figure 3), while the spaces on the upper floor were not subjected to energy retrofitting (section A, Figure 3) as is presented on a demonstrative cross-section and photographs before, during and after the energy retrofit of selected cellar spaces, Figure 4. The value of the thermal coefficient U after thermal modernization of walls is 0.59 (W/m2 K).
The renovation works began with the preparation of the substrate from the inside. The mold was removed from the surface of the walls and the substrate was cleaned of dust and dirt. The uneven, cleaned substrate was primed with an undercoat plaster and levelled with a renovation plaster. Climate panels were primed on both sides and pressed against the substrate with a layer of adhesive. At the joining of the sides, the plates engage. The surface of the boards is covered with vapor-permeable paint on the side. An implemented climate panel system is mainly composed of a white mineral insulation plate based on calcium silicate. It is a thermal-insulating material, resistant to pressure, soundproofing, non-flammable, and relatively easy to process. The system consists of components with similar and coordinating properties, such as a special adhesive with a biocide, primer and finishing coat. Due to the “moisture buffering effect”, the system is intended to prevent the formation of mold inside the rooms. It also prevents dirt from accumulating as dust. The board regulates the indoor climate and prevents water condensation and the formation of mold indoors. Climate panels are used for thermal insulation of walls from the inside where it is impossible or difficult to use an external thermal insulation system. This system of climatic panels is especially used in historic buildings made of clinker bricks, sandstone, stone, in buildings with a “half-timbered” structure and with decorative façade elements. Thanks to good capillary activity and vapor permeability, the board automatically regulates the relative air humidity in rooms and maintains it at a constant level.
As the boards are made of natural raw materials: sand and lime, the material is recommended for occupants suffering from allergies. Technical data of climatic plates are presented in Table 1.
The analysis performed for the purposes of this paper involved a comparison of the microbiological purity of the walls and the indoor environment, as well as a comparison of the indoor microclimate for spaces subjected to energy retrofitting—in the Faculty of Environmental and Energy (section B) and the rooms that were not subjected to it—in the FEEE (section A). The FEEE building is mechanically ventilated. The air exchange during the measurement period was approx. 0.5. The buildings and spaces are heated with the installation of hot water heaters (see Figure 4), and the heat is supplied from the city’s central heating system. Both systems were operating normally at the time of the analysis of the buildings. In addition, for the purposes of comparison, a portion of the tests were performed in the uninsulated spaces of the Faculty of Architecture due to the building being comparable, i.e., it was built in the same year and using the same technology as the FEEE CUT building, but was not subjected to energy retrofitting.

2.3. Indoor Environmental Quality Model and Sub-Elements

Index IEQ refers to the building’s indoor environment quality considering the occupants’ satisfaction level presented in 0–100% scale (as a percentage of users satisfied) in accordance to [35,36]. The percentage of satisfied users is determined by the means of the indoor measured environmental parameters and their specific sensory models implemented. The IEQ model is composed of four indoor comfort sub-indexes (also presented in a 0–100% scale): thermal comfort index TCindex, indoor air quality index IAQ, acoustic comfort index ACcindex and daylight comfort index Lindex [25]. The IEQ sub-model elements were justified in the following publications [25,37] where human perception sensory studies were applied. For objective physical indoor parameters, the corresponding sub-component indexes are calculated based on the perception models (Equations (3)–(10)). The reliability of the IEQ model was also analyzed in publication [37]. The authors use the IEQ model formula [25];
I E Q i n d e x   = 0.25 T C i n d e x + 0.25 Σ I A Q i n d e x + 0.25 A C c i n d e x + 0.25 L i n d e x
The each IEQ sub-element’ SIi (predicted percentage of occupants’ satisfied) is calculated from a specific Equations (3)–(10) using a conversion formula (from dissatisfaction level) (2) [25]:
SIi =100 − PD(SIi)
where PD is the predicted percentage of occupants dissatisfied (PD) and PD(SIi) is the percentage of occupants dissatisfied with one of the four IEQ’s elements (SIi) and i is a number of IEQ sub-elements. The IEQ model (1) was previously used to evaluate office buildings and to evaluate a single-family building [35].
A model for a thermal performance index determination (first included IEQ’s element) TCindex is provided in the EN standards [34,35] and it takes into account the number of indoor environmental and user-oriented parameters: actual indoor air temperature ta (°C), actual mean radiant temperature tmr (°C), airspeed va (m/s), water vapor partial pressure pv (Pa), the occupant metabolic rate M (W/m2) or (met) and the clothing insulation value Icl (m2K/W)) or (clo). The predicted mean vote indicator PMV based on standard ISO-7730 is a reference to calculate dissatisfaction percentage (PDTC). Provided in standards [38,39] method was validated for nearly zero energy buildings in [40] (4);
PDTC = 100 − 99.9·exp(−0.0355·PMV4 − 0.242·PMV2)
The values of thermal comfort indexes PMV and PD are automatically determined and provided by a computer (logger) connected to the thermal parameters’ sensors.
The second important element considered as a part of the IEQ model is the indoor air quality index IAQindex. Four main elements of indoor air quality are included by us: total volatile organic compound concentration (TVOC), formaldehyde concentration HCHO, carbon dioxide concentration CO2, and the concentration of fungal spores in the indoor air (FCU). These IAQ elements reflect the level of indoor pollution with the source of emissions from construction products, external air infiltration and biogenic pollution. For the element concerning the concentration of fungi spores in the air, presented new approach has never been used so far, and the authors believe that it is an extremely important element when assessing the thermo-modernization effect of retrofitting deeply damp walls and spaces of the historical buildings.
For the first considered element of IAQ sub-model (CO2), a formula of PD = f(cCO2) is used based on the experimental dependence [25,41] (5);
PDCO2 = 407·exp(−15.5·∆CCO20.25)
where ∆CCO2 is carbon concentration (ppm) above the outdoor level (a reference value of 350 ppm is recommended if not measured). CO2 does not represent the other important sources of indoor air pollution, such as the emission of volatile compounds (VOCs) from the construction products and materials, fittings, and finishings. A function PD = f(cTVOC) is applied to the IEQ, where a high level of VOCs may be detected (for example where new materials are used). The authors [42] provided a function of TVOC concentration CTVOC (in µg/m3) concerning the percentage of dissatisfaction (6) that is implemented in the analyzed case study building [42]:
PDTVOC = 405·exp(−11.3·CTVOC−0,25)
The third included element considered in the IAQ index assessment is a formaldehyde HCHO indoor air concentration. The authors proposed the equation of PD = f(cHCHO) and the authors implement it as well [43]:
PDHCHO = 100 − 95·exp(−0.068·log(cHCHO/0.01))4 − 0.44 log(cHCHO/0.01)2)
where cHCHO is HCHO indoor air concentration in mg/m3.
The last considered (a newly proposed) element of the IAQ assessment is the indoor air contamination by fungi spores. Basing on a dozen reference documents (Table 2) [44,45,46,47,48,49,50,51,52,53,54,55,56,57,58] and scaling the impact levels recommended by these sources into the scale of 1–100% of user satisfaction, a basis for a user satisfaction determination was developed.
Based on the [44,45,46,47,48,49,50,51,52,53,54,55,56,57,58], the theoretical function describing the number of dissatisfied users by the number of fungi spores in the air was developed as a logarithmic regression (R2 = 0.86) applied considering Weber–Fechner theory [59] (Figure 5).
The obtained regression of PD = f(cFCU) has a formula:
PDFCU = 18.8·ln(cFCU) − 86.7
where CFCU is indoor air fungi spore concentration in FCU/m3.
The authors use the ΣIAQ function (8) enabling the aggregation of indoor air quality sub-elements to determine the overall satisfaction of users with air quality. The weights of the ΣIAQ elements were determined in accordance with the multi attribute decision making (MADM) method recommended in the publication [60]. The equation for ΣIEQ takes the specific form for our case study where fungi contamination is a high impact element:
ΣIAQindex = 100 − (0.03·PDCO2 + 0.26·PDTVOC + 0.03·PDHCHO + 0.68 PDCFU)
A model of acoustic dissatisfaction is also adopted. Some authors suggested using the Australian Standard based approach [17,25] that allows the assessment of the increase in the percentage of occupants dissatisfied with a noise level (PDACc) by an increase in the A-weighted noise level LAeq beyond design or recommended value. Weber–Fechner’s law, which we honor, assumes that the change in human perception is logarithmic in relation to the stimulus (sound) intensity, so the function of the relationship between the two logarithmic variables gives the linear relationship. The relationship of the increase of PD with the change in noise level beyond the recommended value to the equivalent measured sound levels (A), LAeq is [61] (9) is described by a function (9) [25,61]:
PDAcc = 2·(LAeq _measured sound level – LAeq_recommended sound level)
and the result is the predicted percentage of sound level dissatisfied occupants in a 0–100% scale.
The relationship between measured daylight illuminance Emin [lux] and the percentage of people dissatisfied with a daylight level is calculated using Equation (10) [62]:
PDL = −0.0175 + 1.0361/{1 + exp(+4.0835·(log10(Emin) − 1.8223)}

2.4. Equipment and Experimental Tests Methodology

2.4.1. Thermal Comfort Measurement

Thermal indoor measurements were done in the FEEE building using a microclimate multi-functional instrument AHLBORN with a digital ALMEMO D6 (made in Germany). The method is based on ISO 7726 [38] and ISO 7730 [39]. The measured indoor parameters were ta—actual indoor air temperature, tg—temperature of blackened globe by heat radiation sensor, tnw—wet-bulb temperature, RH—relative air humidity, and va—airflow speed. Measurements of physical parameters by an instrument are necessary to determine PMV and PD value. Tests were done at a height of 160 cm. The frequency of data collection was every 0.5 h over winter and summer test periods. The technical data of detection sensors are presented in Table 3.
The uncertainty of PDTC determination using the measurement method is 3.2% [37]. Additionally, the tests of thermal performance of retrofitted and un-retrofitted walls were done by a FLIR E50 thermal imaging camera and presented in a result section (January 2020). The temperature reading scope of the camera ranges between −20 °C and 650 °C with a resolution of 240 × 180, 60 Hz. The measurement was made based on the standard EN 13,187 [33].
Thermal comfort was determined in two test periods: in winter (10–13.01.2020, covering all period) and in summer (16–22.09.2020, covering all period). Data on the weather parameters are shown in the appendixFigure A1 and Figure A2.

2.4.2. Indoor Air Quality Tests (CO2, TVOC, HCHO, and CFU)

The air quality assessment includes an analysis of the basic elements of air quality plus fungal contamination. The microbiological air quality study was performed using the aspiration method. This method employed Sabouraud Glucose Agar (SGA) (BioMaxima, Made in Poland) and Rose Bengal Agar (RBA) (BioMaxima) mycological mediums. Air samples were collected using the impact method by employing the MAS 100 Air Sampler (Merck) with an air aspiration of 200 l and sampling performed at the center of the spaces at a height of 1.3 m above the floor surface [27]. The collected samples were incubated for seven days in media at a temperature of 27 °C in laboratory incubators. After three days of incubation, the number of microfungus colonies was noted. Microfungus species identification was performed using microscopic methods based on available identification keys [28,29]. Qualitative testing for fungal infestation of wall surfaces of the analyzed six spaces was also performed. Swabs were taken of plaster fragments and other finishes in various locations on the walls in the spaces under study. The biological material was then deposited in a Sabouraud Glucose Agar (SGA) and a Rose Bengal Agar (RBA) biological medium. The samples were stored in laboratory incubators at a temperature of 27 °C. Identification was performed using microscopic fungal identification keys accounting for the colony morphology and sporulation structures of the isolated species.
The air quality tests of indoor air volatile organic compounds (VOCs) concentration levels were performed in accordance with the PB5/K3.2/MCBE procedure formulated by the Lesser Poland Center for Energy-Efficient Construction. The air quality test was intended to determine the presence and level of total volatile organic compounds VOCs using photoionization detector PID. Measurements were performed using the VelociCalc Model 9565 device. Digital CO2 sensor FYAD00 with integrated signal processor was used (Table 4). IAQ tests were done in one research session (10–13 January 2020).

2.4.3. Sound Level Tests

The tests were conducted according to the national standard PN—87/B—02,156 Building acoustics—Methods for measuring the A sound level in buildings [63]. The most unfavorable 8 h (traffic) are taken as the assessment time. The sound level measurements were conducted in the daytime (13.01.2020, 10 a.m.–6:00 p.m.). The following measurements were used: Brüel and Kjær 4231 acoustic calibrator (made in the USA), Norsonic-121 analyzer (made in Norway), Brüel and Kjær 4165 measuring microphones (made in the USA), an analyzer with microphone Norsonic-140 (made in Norway). Before the tests were conducted, calibration of the measuring path was effected in accordance with the instruction “check of the acoustic measurement channel”. The results were evaluated concerning the requirements of the national standard PN-B-02151-2:2018-01, considering permissible sound levels A in rooms intended for human dwelling. Acoustic comfort was determined in one research test: in winter (13.01.2020). The external sound level values necessary to determine the recommended values in the FEEE spaces were taken from the acoustic interactive map of noise available at https://umk-gd.maps.arcgis.com. Additional measurement conditions were doors and windows were closed during noise measurement and only two people were allowed in the room. Other noise sources were limited in the tested rooms. Measurement points were 1.2 m above the floor. The minimum distance from the walls were 1 m, from the windows 2.0 m. The microphone were placed at a distance greater than 1 m from the operator. Number of measurement points was 3.

2.4.4. Visual Comfort Test

The daylight illumination level Emin (lux) was measured by the instrument MAVOLUX 5032C with sensor 3C15683 in accordance with the standard EN 12,464 [64]. The light intensity measurements were conducted in the daytime (13.01.2020 and 16.09.2020, 10:00–16:00).

2.4.5. Subjective Indoor Comfort test by Questionnaire—Vote Assessment

Additionally, in order to confirm the results resulting from the IEQ model based on provided indoor measurements, a test of the level of satisfaction of teaching staff in the analyzed FEEE spaces was conducted by the subjective “vote” method. The purpose of this test was to approximately confirm the values obtained with the objective IEQ index. The study of the comfort of using the rooms by employees was conducted using the survey method. The respondents (n = 12; age, sex: 48 K, 48 M, 68 M, 63 M, 47 M, 50 K, 52 M, 49 K, 53 K, 54 M, 47 K, 50 K, white Caucasian type) were asked to rate on a five-point scale (1–5 scale, where 1—low (bad), and 5—high (good)) the following parameters related to the comfort of using the room (currently, after the wall insulation process): visual (daylight comfort); respiratory comfort (how to breathe, air quality); acoustic comfort (silencing the room); and thermal comfort (thermal). The respondents were also asked to evaluate the same parameters on the same scales, but for the situation before retrofitting. The last question was whether the user noticed any problems with mold growth after insulation and if so what? The guideline [29] on the assessment of the social properties of buildings were used, in which, within the group of health and comfort requirements, the following issues are listed: thermal comfort, indoor air quality characteristics, acoustic characteristics, visual comfort and spatial features. In the case of rooms that were insulated, the respondents were employees of the Cracow University of Technology who conduct teaching in the laboratory located in the basement of the case study object. Vote assessment considered the user’s comfort perception before and after retrofitting process in the spaces. People who took part in the study are considered as experts, they are the employees who most often stay in the laboratory space, conducting didactic activities and are able to make a reliable assessment. The results obtained on a 5-point scale were converted to a percentage scale of increase of comfort (after the retrofit process) to compare it with the IEQ objective method.

2.4.6. Limitations and Assumptions of the Adopted Method

The presented results refer to two samples of test periods (3 days in January, 8 days in September 2020). These periods may be considered as potentially representative (winter/summer) and selected to approximate the behavior of the indoor environment of a case study building. Some of the measurements made in winter were not repeated in the summer, including air pollution level TVOC and fungal spores, and sound level tests. It was assumed that the values shown in winter should not significantly differ from those in summer. In the context of TVOC concentration, in the absence of evident sources of indoor emission of VOCs (construction materials), and with similar parameters of temperature and humidity inside, the level of TVOC pollution should be at a similar constant and low level in summer and winter. The background TVOC level from street pollution for the same traffic density should also not be significantly different. In the context of the analysis of the concentration of the number of fungal spores in the air, we believe that after thermal insulation, the sources of fungal spores were eliminated and there was no need to re-test in the summer. Thus, we believe that a low concentration level in winter would be similar in summer. In the context of a building space that is not retrofitted and has serious problems with fungi contamination on the walls, the season of the year may have some significance and influence on their number. Nevertheless, authors do not really focus on this issue. The spore levels in both seasons would be similarly high.
TVOC measurements were made with a PID sensor having a significantly greater measurement uncertainty than the gas chromatography normally used in IAQ studies. It is also assumed that in winter the heat output of the radiators was constant over time and that the conditions inside the rooms were quasi-stable at the time of tests. Measurements were made in modernized and adequately non-modernized spaces, so the authors assume that the boundary conditions at the time of measurement for these two types of spaces were consistent. Assuming the variability of factors that may have had an indirect impact on the result, the authors assume that the expanded uncertainty for the IEQ calculations is 20%.

3. Results

3.1. Overall IEQ Index (Measurement Method) and Values of Comfort Sub-Component Indexes

In this section, the experimental results of indoor environmental assessments of a case study building spaces are provided according to the IEQ model presented in the Method section. Table 5 shows the measurement results essential to calculate IEQ sub-element indexes in the non-retrofitted and retrofitted spaces assessed in Winter (January 2020) and Summer (September 2020). Table 5 shows the averaged values for the entire test periods.
The measured indoor environmental parameters (Table 5) were used as the input values to Equations (3)–(10) to determine all IEQ sub-component indexes (Table 6) The overall IEQindex for case study building calculated in accordance to Equation (10) is also presented in Table 6, both for non-retrofitted and retrofitted spaces.

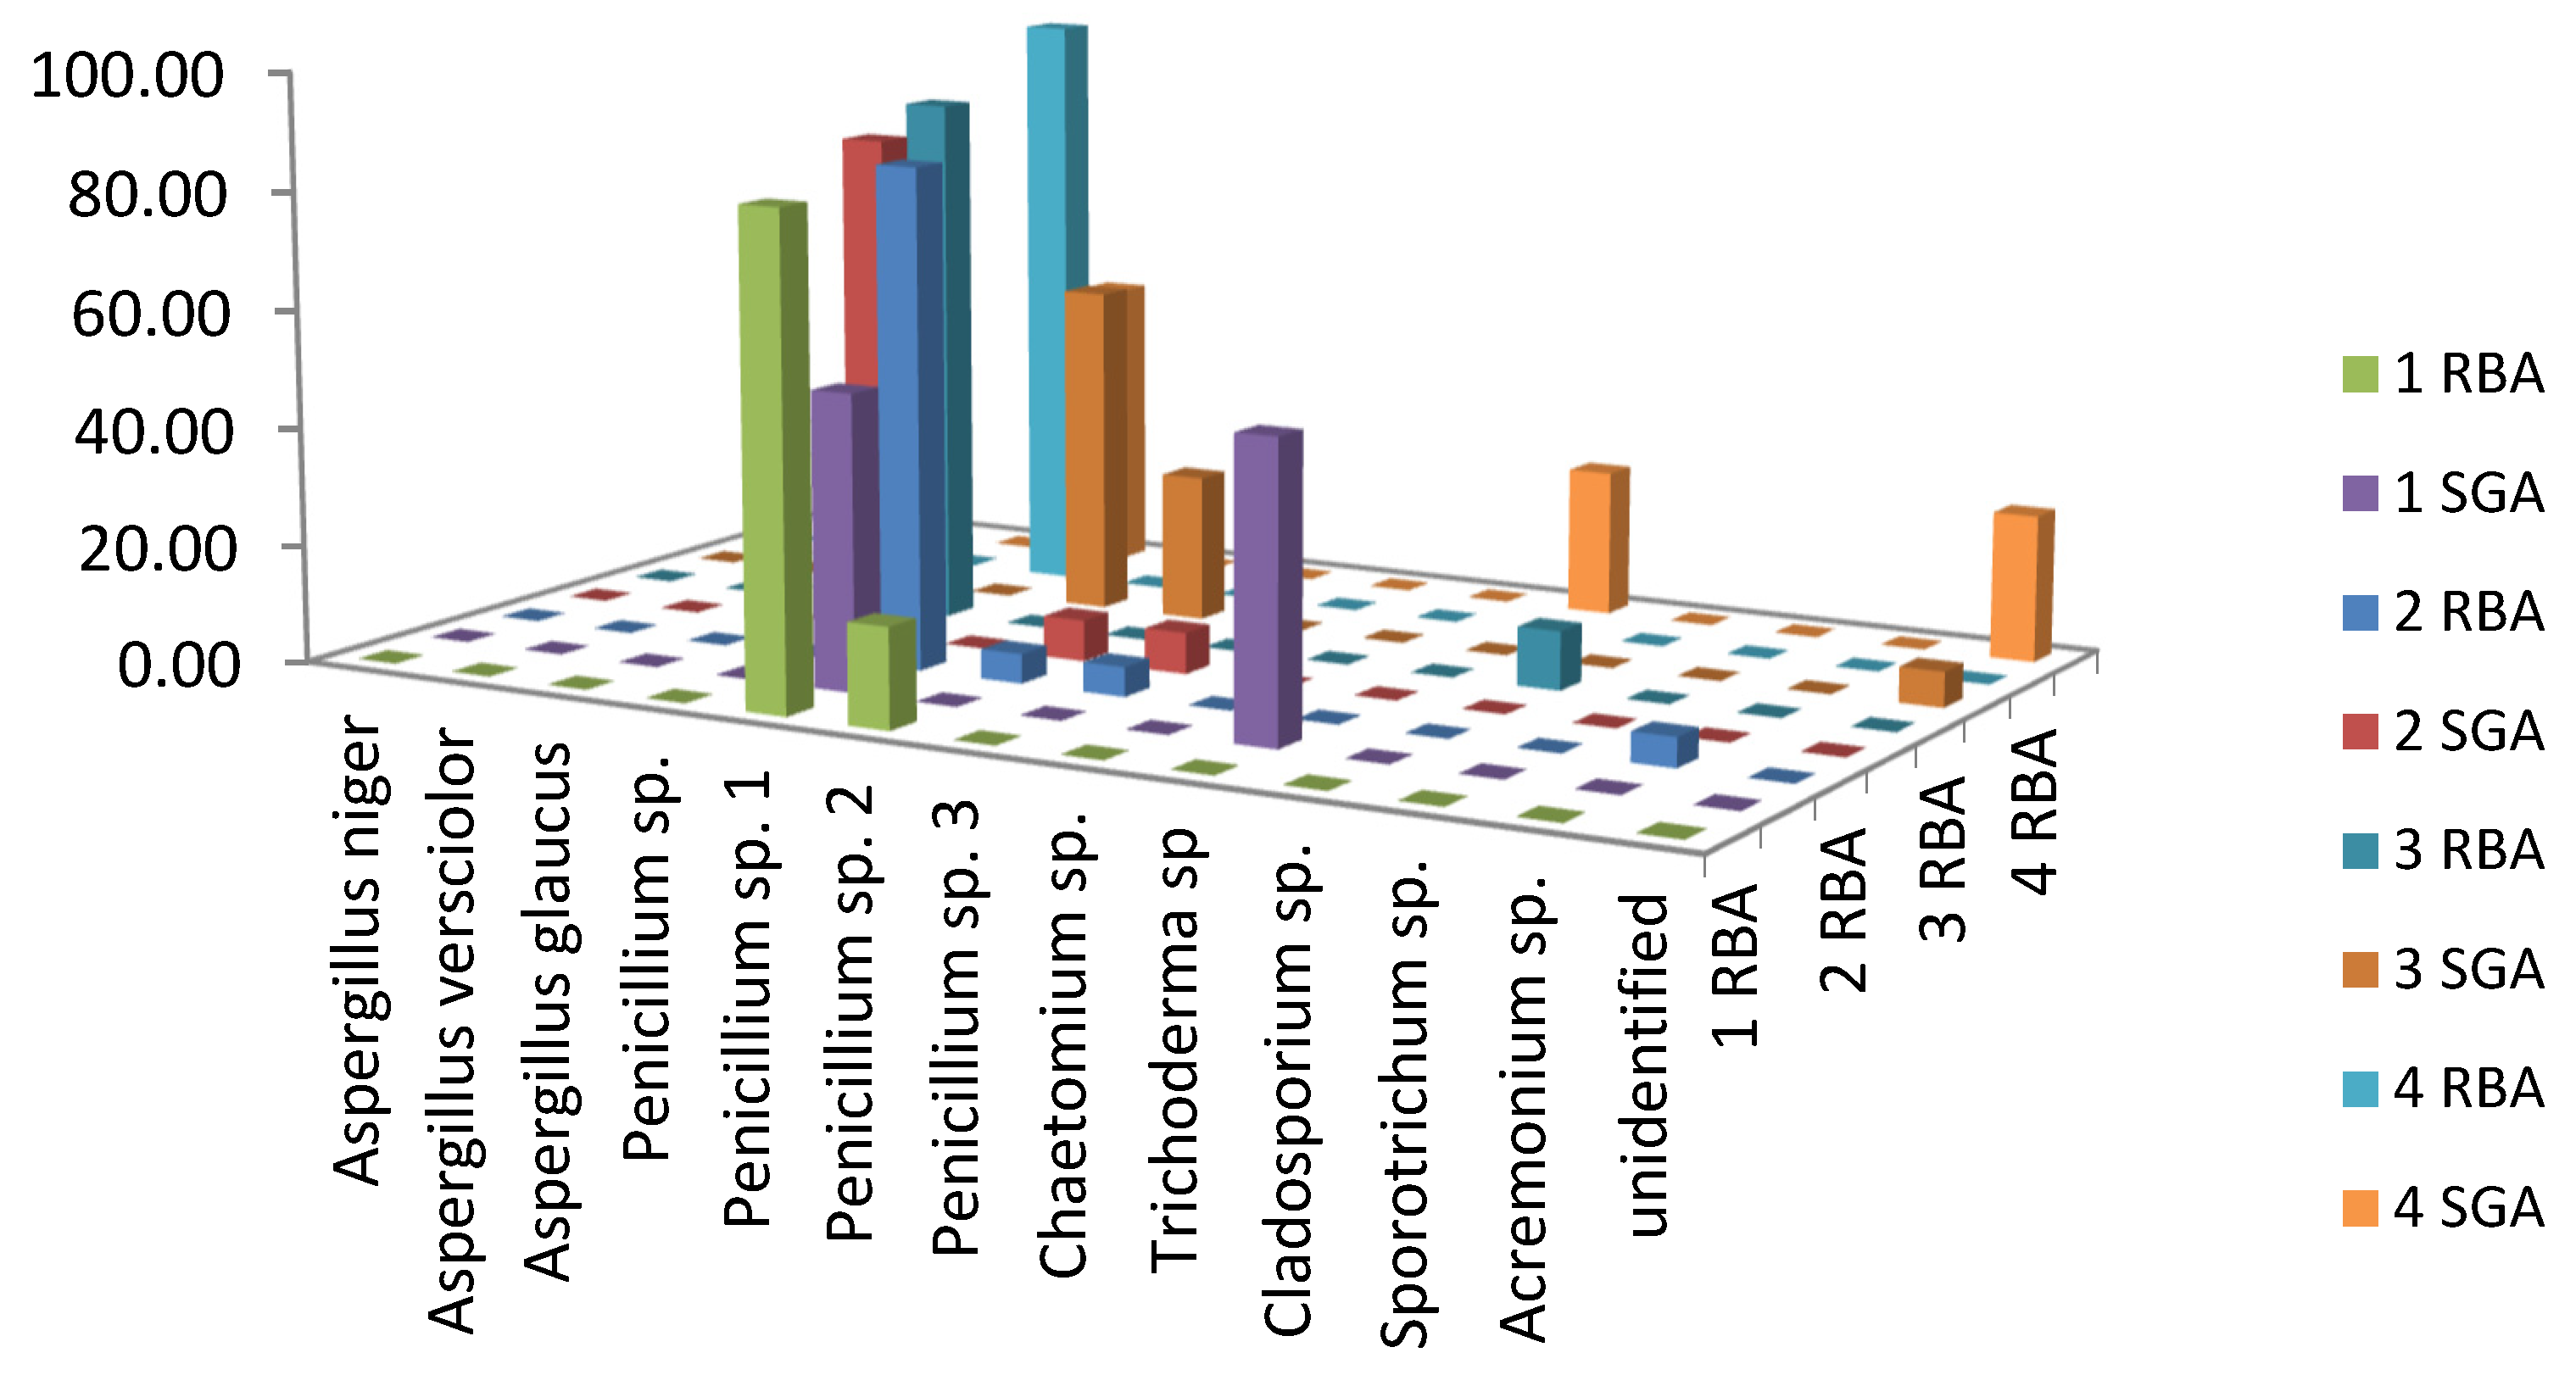
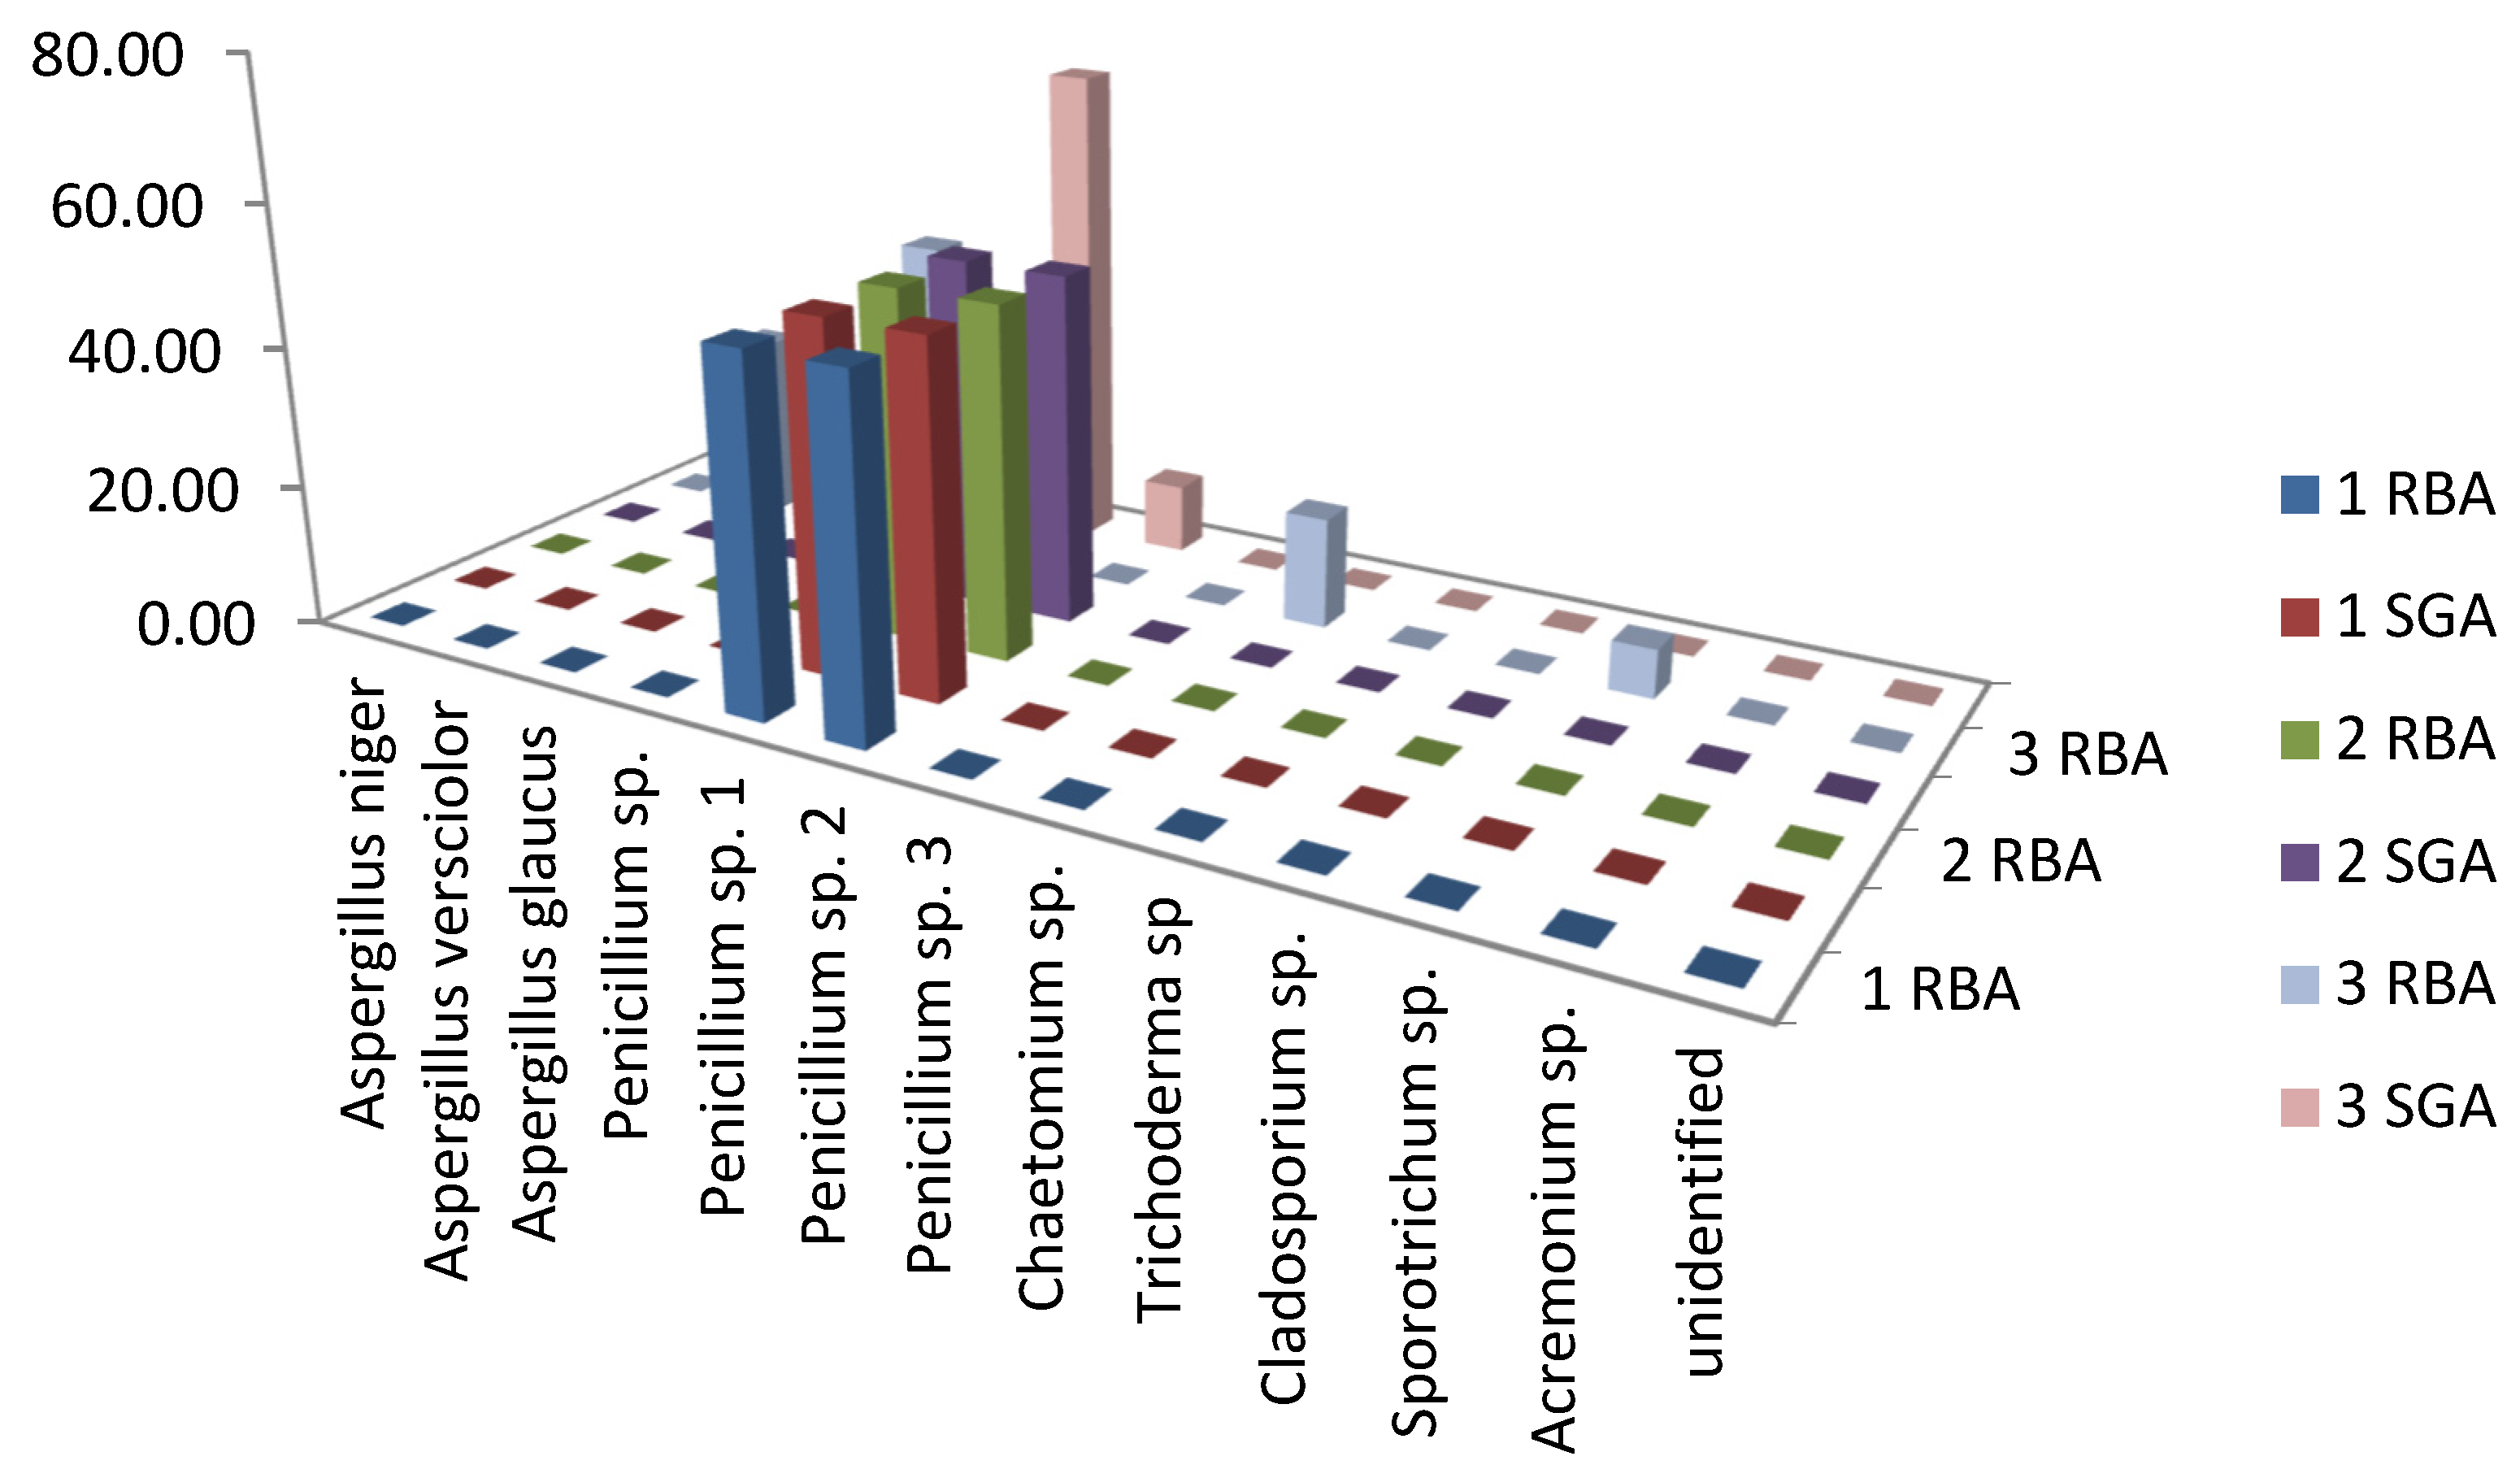
3.2. Microbiological Results

When analyzing the results of air quality tests, a varied number of spores per indoor air m3 was observed. The summary results of airborne spore concentration tests in the spaces under study have been presented in Table 7. Significant differences in spore concentrations in different mediums were also observed. The lowest number of spores (5 CFU/m3) was observed in one energy-retrofitted room in the cellar while using the RBA medium, whereas, for the SGA medium, the spore count was 25 CFU/m3. The highest spore concentrations regardless of medium were observed in one upper-floor space that was not energy-retrofitted (Figure 6).
In the RBA medium, a count of 1880 CFU/m3 was observed, while for SGA, the spore count was 1560 CFU/m3 (Table 7). Despite the higher number of airborne spores present in this room, the spore concentration does not exceed acceptable levels found in recommendations as to permissible airborne fungal spore concentrations in residential and office spaces [44].
The qualitative analyses of the collected air samples also showed considerable diversity in terms of the species of present microfungi, which varied from to room to room and depending on the mycological medium used. The percentage share of identified mold species in each room has been presented in Figure 7 and Figure 8. In the SGA medium, all samples showed the presence of Penicillium sp., ranging between 43 and 100%. In terms of the highest colony numbers observed in No. 1 and 2 non-energy-retrofitted spaces on the upper floor, as many as 100% of the identified colonies belonged to the Penicillium spp. The qualitative assessments of other spaces showed the dominance of molds typical of residential and office spaces from the species Aspergillus spp., Chaetomium sp., Sporotrichum sp., Cladosporium sp. and Trichoderma sp., which were observed in general spore count ranges of between 4 and 50% (depending on the room). These fungus species are considered to be common allergens. Furthermore, fungus species such as Penicillium spp. and Aspergillus spp. are considered to be mold species belonging to the second risk group—factors that can be harmful to humans. The Aspergillus fungi present in the spaces are considered allergenic and toxic factors (Aspergillus versicolor) and can cause contagious and invasive diseases (Aspergillus niger) [65]. The measurements performed after the application of the investigated materials showed that after prolonged Epatherm panel use, the microclimatic and microbiological conditions of rooms were good (below permissible levels). No observable mold growth was found in the room. The visible damage to the paint layer in the corridor did not have a mycological cause.
Considering the presence of microfungi on the surfaces of partitions, the authors observed differences arising from the type of medium used. The results of testing swabs collected from the surfaces of each room have been presented in Table 8.
The richest species composition of the isolated fungi was observed in the uninsulated rooms of the FA. The presence of molds and their species composition can be associated with the form of use of this space and the materials stored there (paper magazines, student projects and assignments). The Chaetomium sp. fungi isolated in this space are characterized by cellulolytic activity. The growth of Aspergillus versicolor 76.9%, Penicillium sp. 15.4%, Chaetomium sp. 7.7% was observed in an RBA medium. The growth observed in the SGA medium was as follows: Aspergillus versicolor 50%, Aspergillus ochraceus 25%, Penicillium sp. 16.7%, and Chaetomium sp. 8.3%. Singular microfungus species were observed in the remaining rooms. No fungus presence was detected on partition surfaces in rooms three (insulated cellar) and three (uninsulated upper floor). Considering that room three located in the uninsulated section of the building is used as an office where people are often present, it can be assumed that it is vented often, which affects the result. Based on data presented in Table 8, it can be concluded that only singular, trace amounts of microfungus colonies appeared on the wall surfaces insulated with the Epatherm System. Their presence can be caused by various factors, such as the presence of plants in the room (point 1, Figure 9). These fungus colonies can come from the soil.

3.3. Air Quality Test Results Concerning the Presence of VOSs and Relative Indoor Humidity of External Walls

Table 9 presents the results of volatile organic compound measurements performed in the rooms where the internal thermal insulation system had been applied, while Table 10 and Table 11 present the results for rooms that were not subjected to energy retrofitting. The study showed higher overall VOC levels by as much as 60% in the uninsulated spaces on the upper floor (FEEE building) and an over 10% increase in uninsulated cellar spaces (FA) relative to insulated cellar spaces (FEEE). The results suggest a significant decrease in VOC levels in spaces where the thermal insulation panels were applied. However, there is no certainty whether this decrease was caused by a reduction in pollutant emission from the construction materials or elimination of metabolic VOCs from fungal wall degradation [66]. The relative surface humidity test indicated that spaces insulated with the Epatherm climate panels showed lower surface humidity.

3.4. Thermal Comfort Testing Results

The outdoor temperatures during the measuring summer period ranged from 10 °C at night to a maximum of 30 °C during the day. In Figure 10, the authors provided the results of the percentage of dissatisfied with thermal comfort PD (in %) in the space of case study building where the thermal modernization was performed (blue line) and in the space where without retrofitting process (red line) during the summer period (16–22 September 2020).
As shown, the thermal modernization of the indoor walls caused a potential increase in the number of occupants satisfied with the thermal comfort after modernization by approx. 20%. Figure 11 presents a chart of thermal comfort values: PMV (-) and PD (%) for a space that was subjected to energy retrofitting using the Epatherm System in a winter period.
The application of the thermal insulation system under study also found a visual aspect (Figure 12). The uninsulated space has watermarks, particularly in the areas of geometric bridges (corners), while insulated space maintains an aesthetically pleasing appearance without watermarks or spots. This is also evidence of a lack of mold and fungus growth on the internal surfaces of external walls. The change in the wall radiation temperature directly translates into an increase in the comfort of occupants.

3.5. Results Concerning the Comfort of Use by Questionnaire (Vote) Method

Figure 13 shows the comfort perception results by occupants of the cellar spaces before and after the energy retrofitting and the comfort of use of other, uninsulated spaces, as reported in a survey study performed among research staff. The subjective assessment was made on a five-point scale (n = 12).
Concerning the vote of the users of the spaces that were energy-retrofitted—the cellar spaces assigned for use as didactic laboratories—a considerable improvement across almost all comfort parameters was observed in these spaces when compared to the conditions before the application of thermal insulation (Figure 13). After energy-retrofitting, the thermal comfort level was rated the highest (a rating of 4—“good”, +32.5% change), with acoustic and IAQ comforts rated lower (a rating of 3.5, +12.5%, and 37.5% changes, respectively). Before the energy retrofit, the lowest rating (2) was given to the IAQ (stale air) and daylight comfort (cellar with small windows). The users did not observe any problems with mold growth after the energy retrofit. The users of uninsulated upper-floor spaces (staff rooms) gave also the lowest rating to the IAQ (a rating of 2.5). Apart from daylight comfort, the remaining parameters for the uninsulated upper-floor spaces were rated at the same level as cellar prior to energy retrofit.

4. Discussion of Results and Conclusions

The energy retrofitting scenarios are usually evaluated in terms of cost-effective energy saving, while the effects on other parameters (like occupants’ perception) are often neglected [67]. There are indications that energy-retrofitted buildings can also create risks for indoor environmental quality and for the health and comfort of occupants [68]. The authors intended to solve this research problem by providing and verifying in practice the method of assessing thermo-modernization effects.
The thermal comfort tests (winter, heating applied) showed significant differences in the microclimate between the space subjected to energy retrofitting and those that were not. PMV indicators for retrofitted space ranged between −0.1 and +0.2, which classifies the rooms as belonging to category A as per EN ISO 7730, while also resulting in a percentage of persons dissatisfied with thermal conditions ranging between 5 and 7%. These spaces displayed high thermal stability. In the spaces that were not energy-retrofitted, the comfort level expressed via the PMV indicator ranged between +0.9 and 1.3, which corresponds to a class above “C”, as per EN ISO 7730 (with a 22 to 40% predicted percentage of persons dissatisfied with thermal conditions). As presented, the thermal modernization of the indoor walls caused a potential increase in the number of people satisfied with the thermal comfort after modernization in winter by approximately 20%.
Table 12 compares the results obtained by the provided objective IEQ method and the survey and voting subjective method by experts who use a building on a daily basis. The comparison method presented in Table 12 shows the percent of comfort increase in the context of the changes after the thermal modernization. The results are quite consistent, the Pearson correlation coefficient of both method results is 96%. The results of the survey confirmed the results obtained with the IEQ measurement method.
The users indicated that the indoor air quality (∆ΣIAQindex) and the thermal comfort (∆TCindex) changed the most, the odor of fungi determined their response by a vote. The changes in the perception of indoor air quality comfort (∆ΣIAQindex) determined by both methods are almost at the same level, as well as the lack of change in daylighting perception (∆Lindex). The thermal (∆TCindex) and acoustic comfort changes (∆Accindex) are seen as greater by vote than shown by the IEQ method.
A new and innovative element of the adopted IEQ method is the introduction to the assessment of ΣIAQ a new component related to the impact of fungal spore concentration on the perception of users. The provided proposal, based on a dozen literature sources, presents the relationship between the number of satisfied occupants (in %) and the number of fungal spores in the indoor air. This element may be highly important for the assessing the comfort and wellbeing level of the historic buildings. The adopted evaluation system showed an increase in the number of users satisfied with the quality of indoor air in the context of the concentration of fungi spores by as much as 42% and taking into account all elements of the IAQ assessment by 35%. Additionally, authors demonstrated the practical use of the multi attribute decision model to determine the weights of the IAQ index in this specific case as proposed in [60].
The application of thermal insulation from the inside of buildings may be problematic due to the risk of water vapor condensation within the partition [69,70,71] and the possibility of reaching critical surface humidity, which facilitates mold and fungus growth. In our case, a retrofitting system whose main element is calcium silicate internal thermal insulation panels was used during the energy retrofitting of a historical building located on the Cracow University of Technology campus. It has been shown (Table 12) that the applied internal thermal insulation system had a direct impact on numerous parameters of the indoor environment, determining the comfort and wellbeing of occupants. The applied system significantly reduced the humidity of the walls and partly reduced the air humidity in the spaces tested. The application of the system efficiently eliminated the problem of fungal wall degradation and almost completely eliminated fungi spores from the indoor air to the level fully adapted to the permanent stay of people. The findings confirm the high effectiveness of the calcium silicate panel system in preventing the growth of molds in a historical masonry building. Fungal spore concentrations in the air inside the spaces where the panels were applied, did not exceed 100 CFU/m3. The study found a higher concentration of mold spores in the air in uninsulated spaces, which showed the predominance of a single fungus species—Penicillium. Elevated mold spore concentrations were observed while testing the walls of uninsulated rooms.
The provided thermal system also increased the thermal stability of the walls and rooms similar to [66] in the winter and reduced the temperature fluctuations and, consequently, the fluctuations of thermal comfort parameters, and thus improved the thermal comfort expressed as a percentage of dissatisfied occupants by 24% (IEQ method) and 33% (vote method). The insulation system also caused a slight improvement in air quality in terms of the concentration of volatile organic compounds, which is probably related to the reduction of metabolic VOCs from wall degradation caused by fungi.
The case study building is exposed to direct street noise at the level of 65–70 dB (daytime). The new insulation system resulted in a slight improvement in the acoustic insulation of the wall, and thus a certain improvement in the acoustic climate of the rooms The system has not deteriorated the visual quality related to the level of daylight as expected, which had to be caused by the increase in wall thickness.
As proposed, the quality of the indoor environment (IEQindex) may be a practical measure to predict people’s comfort perception level inside historical buildings retrofitted as the authors presented. The article provided a practical approach for the implementation of the IEQ model including its important sub-components. A good level of indoor environmental quality of a case study building after thermo-modernization has been demonstrated, the modernization process applied improved the overall quality of the IEQ index by 15%. It should also be emphasized that a significant correlation was found between the comfort increase rates using the IEQ model method and the questionnaires filled in by building users (experts). The Pearson correlation coefficient was as high as 96%. The strong correlation obtained for presented case-study building does not have to be repeated at such a level in the assessments of other buildings in the future due to the significant uncertainty (of over a dozen percent) of both methods (IEQ and vote).
The findings showed a marked difference in the indoor environmental quality of rooms wherein the calcium silicate thermal insulation panels had been applied relative to uninsulated spaces, with the former showing much more favorable results. All the analyzed comfort parameters improved, which was confirmed by the users of these rooms in a provided survey study. The results obtained with the survey method show gains in comfort even higher than the result from the presented method (+25%).
The presented assessment may be an important element in defining thermo-modernization requirements in buildings in the future in terms of achieving almost zero energy buildings [72].

Author Contributions

Conceptualization, M.P. and E.R.-Z.; methodology, M.P. and E.R.-Z.; software, M.P.; validation, E.R.-Z. and M.F.-C.; formal analysis, M.P., P.K. and W.G.; investigation–tests, M.F.-C., P.K.-S., M.Z. and P.K.; resources, M.P. and M.F.-C.; data curation, M.P. and M.F.-C.; writing—original draft preparation, M.P., E.R.-Z., M.F.-C., P.K. and W.G.; writing—review and editing, M.P. and M.F.-C.; visualization, M.P., M.F.-C., P.K. and W.G.; supervision, M.P. and M.Z.; project administration, P.C.; resources, P.C.; funding acquisition, M.P., P.C. and M.F.-C. All authors have read and agreed to the published version of the manuscript.

Funding

This research received no external funding.

Acknowledgments

Special thanks to Krystyna Kostyrko for consultations and ideas that result in an increasing use of the IEQ method (of which is one of the creators).

Conflicts of Interest

The author declares no conflict of interest.

Appendix A. Outdoor Weather Data for the Measuring Periods

Figure A1. Outside temperature (blue line) and relative humidity RH (Red line) for the period 16–22 September 2020.
Energies 13 06051 g0a1
Figure A2. Outside temperature and relative humidity for the period 10–13 January 2020.
Energies 13 06051 g0a2

References

  1. Act of 7 July 1994, Building Law. J. Laws 1994. Available online: https://isap.sejm.gov.pl/isap.nsf/download.xsp/WDU19940890414/U/D19940414Lj.pdf (accessed on 1 November 2020). (In Polish)
  2. Act of 23 July 2003, The Protection of Monuments and the Care of Monuments. J. Laws 2003. Available online: http://isap.sejm.gov.pl/isap.nsf/download.xsp/WDU20031621568/T/D20031568L.pdf (accessed on 1 November 2020). (In Polish)
  3. Obwieszczenie Ministra Infrastruktury i Rozwoju z dnia 17 lipca 2015 r. w Sprawie Ogłoszenia Jednolitego Tekstu Rozporządzenia Ministra Infrastruktury w Sprawie Warunków Technicznych, Jakim Powinny Odpowiadać Budynki i ich Usytuowanie (Dz. U. No 75, pos. 690), as Amended. Available online: http://prawo.sejm.gov.pl/isap.nsf/DocDetails.xsp?id=WDU20150001422 (accessed on 19 December 2019). (In Polish)
  4. Bak, J.; Radziszewska–Zielina, E.; Zielina, M. Analysis of the spatial structure of green building in the aspect of selected environmental issues on the example of the city of Cracow (Poland). In Proceedings of the IOP Conference Series: Materials Science and Engineering, Prague, Czech Republic, 17–21 June 2019; Volume 603, pp. 1–10. [Google Scholar]
  5. Radziszewska-Zielina, E.; Kania, E.; Śladowski, G. Problems of the Selection of Construction Technology for Structures of Urban Aglomerations. Arch. Civ. Eng. 2018, 64, 55–71. [Google Scholar] [CrossRef]
  6. Radziszewska-Zielina, E.; Śladowski, G. Proposal of the Use of a Fuzzy Stochastic Network for the Preliminary Evaluation of the Feasibility of the Process of the Adaptation of a Historical Building to a Particular Form of Use. In Proceedings of the WMCAUS IOP Conference Series: Materials Science and Engineering, Prague, Czech Republic, 12–16 June 2017; Volume 245, p. 072029. [Google Scholar]
  7. Fedorczak-Cisak, M.; Radziszewska-Zielina, E.; Orlik-Kożdoń, B.; Steidl, T.; Tatara, T. Analysis of the thermal retrofitting potential of the external walls of podhale’s historical timber buildings in the aspect of the non-deterioration of their technical condition. Energies 2020, 13, 4610. [Google Scholar] [CrossRef]
  8. Radziszewska-Zielina, E.; Rumin, R. Analysis of the Profitability of Investment in Renewable Energy Sources on The Example of a Semi-Detached House. In Proceedings of the International Conference on the Sustainable Energy and Environment Development SEED, Krakow, Poland, 17–19 May 2016; Volume 10, p. 00079. [Google Scholar]
  9. Fedorczak-Cisak, M.; Kowalska, A.; Radziszewska-Zielina, E.; Śladowski, G.; Pachla, F.; Tatara, T. A multicriteria approach for selecting the utility function of the historical building “Stara Polana” located in Zakopane. In Proceedings of the 64 Scientific Conference of the Committee for Civil Engineering of the Polish Academy of Sciences, Krynica Zdroj, Poland, 16–20 September 2018; Volume 262, p. 07002. [Google Scholar]
  10. Fedorczak-Cisak, M.; Kowalska-Koczwara, A.; Nering, K.; Pachla, F.; Radziszewska-Zielina, E.; Śladowski Tatara, T.G.; Ziarko, B. Evaluation of the Criteria for Selecting Proposed Variants of Utility Functions in the Adaptation of Historic Regional Architecture. Sustainability 2019, 11, 1094. [Google Scholar] [CrossRef] [Green Version]
  11. Troi, A.; Bastian, Z. Energy efficiency solutions for historic buildings. In A Handbook; Birkhauser Verlag GmbH: Basel, Switzerland, 2015; ISBN 978-3-03821-646-9. [Google Scholar]
  12. Loganina, V.; Frolov, M.; Fediuk, R. Developed Heat-insulating Dry Mortar Mixes for the Finishing of Aerated Concrete Walls. Mag. Concr. Res. 2020, 19, 1–14. [Google Scholar] [CrossRef]
  13. Loganina, V.; Fediuk, R.; Usanova, K.; Timokhin, R. Regularities of Change in the Properties of Paint Coatings on Cement Concretes at Moistening. In Proceedings of the International Scientific Conference on Energy, Environmental and Construction Engineering, Petersburg, Russia, 19–20 November 2019; Volume 70, pp. 1–14. [Google Scholar] [CrossRef]
  14. Bottino-Leone, D.; Larcher, M.; Herrera-Avellanosa, D.; Haas, F.; Troi, A. Evaluation of natural-based internal insulation systems in historic buildings through a holistic approach. Energy 2019, 181, 521–531. [Google Scholar] [CrossRef]
  15. Moses, L.; Morrissey, K.; Sharpe, R.A.; Taylor, T. Exposure to Indoor Mouldy Odour Increases the Risk of Asthma in Older Adults Living in Social Housing. Int. J. Environ. Res. Public Health 2019, 16, 2600. [Google Scholar] [CrossRef] [Green Version]
  16. Maus, R.; Goppelsroder, A.; Umhauer, H. Survival of bacterial and mold spores in airfilter media. Atmos. Environ. 2001, 35, 105–113. [Google Scholar] [CrossRef]
  17. Hippelein, M.; Rügamer, M. Ergosterol as an indicator of mould growth on building materials. Int. J. Hyg. Environ. Health 2004, 207, 379–385. [Google Scholar] [CrossRef]
  18. Cox-Ganser, J.M. Indoor dampness and mould health effects—Ongoing questions on microbial exposures and allergic versus nonallergic mechanisms. Clin. Exp. Allergy 2015, 45, 1478–1482. [Google Scholar] [CrossRef] [Green Version]
  19. Gutarowska, B. Metabolic activity of moulds as a factor of building materials biodegradation. Pol. J. Microbiol. 2010, 59, 119–124. [Google Scholar] [CrossRef]
  20. Nielsen, K.F.; Gravesen, S.; Nielsen, P.A.; Andersen, B.; Thrane, U.; Frisvad, J.C. Production of mycotoxins on artificially and naturally infested building materials. Mycopathologia 1999, 145, 43–56. [Google Scholar] [CrossRef] [PubMed] [Green Version]
  21. Pasanen, A.L.; Kasanen, J.P.; Rautiala, S.; Ikaheimo, M.; Kaariainen, H.; Kalliokoski, P. Fungal growth and survival in building materials under fluctuating moisture and temperature conditions. Int. Biodeterior. Biodegrad. 2000, 46, 117–127. [Google Scholar] [CrossRef]
  22. Kwaśniewska-Sip, P.; Cofta, G.; Nowak, P.B. Resistance of fungal growth on Scots pine treated with caffeine. Int. Biodeterior. Biodegrad. 2018, 132, 178–184. [Google Scholar] [CrossRef]
  23. Radziszewska-Zielina, E.; Czerski, P.; Grześkowiak, W.; Kwaśniewska-Sip, P. Comfort of Use Assessment in Buildings with Interior Wall Insulation based on Silicate and Lime System in the Context of the Elimination of Mould Growth. Arch. Civ. Eng. 2020, 66, 89–104. [Google Scholar]
  24. Ncube, M.; Riffat, S. Developing an indoor environment quality tool for assessment of mechanically ventilated office buildings in the UK—A preliminary study. Build. Environ. 2012, 53, 26–33. [Google Scholar] [CrossRef] [Green Version]
  25. Piasecki, M.; Kostyrko, K.; Pykacz, S. Indoor environmental quality assessment: Part 1: Choice of the indoor environmental quality sub-component models. J. Build. Phys. 2017, 41, 264–289. [Google Scholar] [CrossRef]
  26. Sarbu, I.; Sebarchievici, C. Aspects of indoor environmental quality assessment in buildings. Energy Build. 2013, 60, 410–419. [Google Scholar] [CrossRef]
  27. Zuhaib, S.; Manton, R.; Griffin, C.; Hajdukiewicz, M.; Keane, M.M.; Goggins, J. An Indoor Environmental Quality (IEQ) assessment of a partially-retrofitted university building. Build. Environ. 2018, 139, 69–85. [Google Scholar] [CrossRef]
  28. EN 16798-1:2019. Indoor Environmental Input Parameters for Design and Assessment of Energy Performance of Buildings Addressing Indoor Air Quality, Thermal Environment, Lighting and Acoustics. Available online: https://sklep.pkn.pl/pn-en-16798-1-2019-06e.html (accessed on 1 November 2020).
  29. ANSI/ASHRAE Standard 55:2017. Thermal Environmental Conditions for Human Occupancy; ANSI: Piscataway, NJ, USA, 2017.
  30. Enescu, D.; Van Der Linden, W.; Loomans, M.; Hensen, J. CBE Thermal Comfort Tool for EN-16798. Renew. Sustain. Energy Rev. 2017, 79, 1353–1379. [Google Scholar] [CrossRef]
  31. Nagy, R.; Mečiarová, L.; Vilčeková, S.; Burdová, E.K.; Košičanová, D. Investigation of a ventilation system for energy efficiency and indoor environmental quality in a renovated historical building: A case study. Int. J. Environ. Res. Public Health 2019, 16, 4133. [Google Scholar] [CrossRef] [Green Version]
  32. Sharif-Askari, H.; Abu-Hijleh, B. Review of museums’ indoor environment conditions studies and guidelines and their impact on the museums’ artifacts and energy consumption. Build. Environ. 2018, 143, 186–195. [Google Scholar] [CrossRef]
  33. Jaggs, M.; Palmer, J. Energy performance indoor environmental quality retrofit—A European diagnosis and decision making method for building refurbishment. Energy Build. 2000, 31, 97–101. [Google Scholar] [CrossRef]
  34. Ferrante, A.; Fotopoulou, A.; Semprini, G.; Cantelli, D.; Ruggiero, S.; Karalis, M.; Efthymiou, C.; Papadaki, D.; Assimakopoulos, M.N. IEQ and energy improvement of existing buildings by prefabricated facade additions: The case of a student house in Athens. In Proceedings of the IOP Conference Series: Materials Science and Engineering, Bari, Italy, 5–7 September 2019. [Google Scholar]
  35. Piasecki, M. Practical Implementation of the Indoor Environmental Quality Model for the Assessment of Nearly Zero Energy Single-Family Building. Buildings 2019, 9, 214. [Google Scholar] [CrossRef] [Green Version]
  36. Nimlyat, P.S. Indoor environmental quality performance and occupants’ satisfaction [IEQPOS] as assessment criteria for green healthcare building rating. Build. Environ. 2018, 144, 598–610. [Google Scholar] [CrossRef]
  37. Piasecki, M.; Kostyrko, K.B. Indoor environmental quality assessment, part 2: Model reliability analysis. J. Build. Phys. 2018, 5, 288–315. [Google Scholar] [CrossRef]
  38. ISO 7726. Ergonomics of the Thermal Environment–Instruments for Measuring Physical Quantities. Available online: https://www.iso.org/standard/14562.html (accessed on 1 November 2020).
  39. ISO 7730. Ergonomics of the Thermal Environment–Analytical Determination and Interpretation of Thermal Comfort Using Calculation of the PMV and PPD Indices and Local Thermal Comfort Criteria. Available online: https://www.iso.org/standard/39155.html (accessed on 1 November 2020).
  40. Piasecki, M.; Cisak, M.F.; Biskupski, J.; Furtak, M. Experimental confirmation of the reliability of Fanger’s thermal comfort model—Case study of a near-zero energy building (NZEB) office building. Sustainability 2019, 11, 2461. [Google Scholar] [CrossRef] [Green Version]
  41. Frontczak, M.; Schiavon, S.; Goins, J.; Arens, E.; Zhang, H.; Wargocki, P. Quantitative relationships between occupant satisfaction and satisfaction aspects of indoor environmental quality and building design. Indoor Air 2012, 22, 119–131. [Google Scholar] [CrossRef] [Green Version]
  42. Piasecki, M.; Kozicki, M.; Firląg, S.; Goljan, A.; Kostyrko, K. The approach of including TVOCs concentration in the indoor environmental quality model (IEQ)—Case studies of BREEAM certified office buildings. Sustainability 2018, 10, 3902. [Google Scholar] [CrossRef] [Green Version]
  43. Piasecki, M.; Kostyrko, K.B. Combined Model for IAQ Assessment: Part 1—Morphology of the Model and Selection of Substantial Air Quality Impact Sub-Models. Appl. Sci. 2019, 9, 3918. [Google Scholar] [CrossRef] [Green Version]
  44. PN-89 Z-04111/03, Ochrona Czystości Powietrza. Badania Mikrobiologiczne. Oznaczanie Liczby Grzybów Mikroskopowych w Powietrzu Atmosferycznym (Imisja) Przy Pobieraniu Próbek Metodą Aspiracyjną i Sedymentacyjną; Polish Standards PKN: Warsaw, Poland, 1989. (In Polish)
  45. American Conference of Governmental Industrial Hygienists. Threshold Limit Values (Tlvs) for Chemical Substances and Physical Agents and Biological Exposure Indices; ACGIH: Cincinnati, OH, USA, 2001; ISBN 1882417402. [Google Scholar]
  46. American Industrial Hygiene Association. Biosafety Reference Manual, 2nd ed.; AIHA: Washington, DC, USA, 1986; ISBN 978-0-932627-65-0. [Google Scholar]
  47. Rao, C.Y.; Burge, H.A.; Chang, J.C.S. Review of Quantitative Standards and Guidelines for Fungi in Indoor Air. J. Air Waste Manag. Assoc. 1996, 46, 899–908. [Google Scholar] [CrossRef]
  48. Rafferty, P.J. (Ed.) American Industrial Hygiene Association Technical Committee on Indoor Environmental Quality the Industrial Hygienist’s Guide to Indoor Air Quality Investigations; AIHA: Fairfax, VA, USA, 1996; pp. 31–32. [Google Scholar]
  49. Wanner, H.; Verhoeff, A. Report No. 12: Biological Particles in Indoor Environments; Commission of the European Communities: Luxembourg, 1994. [Google Scholar]
  50. Bowser Technical Inc. Testing of Older Houses for Microbiological Pollutants; Canada Mortgage and Housing Corporation: Ottawa, ON, Canada, 1991. [Google Scholar]
  51. Etkin, D.S. Indoor Air Quality Update: Biocontaminants in Indoor Environments; Cutter Information Corp.: Arlington, MA, USA, 1994. [Google Scholar]
  52. Binnie, P.W.H. Chapter 3: Biological pollutants in the indoor environment. In Indoor Air Pollution; Kay, J.G., Keller, G.E., Miller, J.F., Eds.; Lewis Publishers: Chelsea, MI, USA, 1990. [Google Scholar]
  53. Indoor Air Quality Association, Inc. Indoor Air Quality Standard #95-1 Recommended for Florida; Indoor Air Quality Association, Inc.: Longwood, FL, USA, 1995. [Google Scholar]
  54. Malmberg, P. Microorganisms. In Criteria Documents from the Expert Group; Beije, B., Lundberg, P., Eds.; Arbets Milio Institutet: Solna, Sweden, 1991; pp. 39–69. [Google Scholar]
  55. Heida, H.; Bartman, E.; van der Zee, S.C. Occupational exposure and indoor air quality monitoring in a composting facility. AIHAJ 1995, 56, 39–43. [Google Scholar] [CrossRef]
  56. New York City Department of Health. Guidelines on Assessment and Remediation of Stachybotrys atra in Indoor Environments. In Proceedings of the International Conference, Saratoga Springs, NY, USA, 6–7 October 1994. [Google Scholar]
  57. United States Occupational Safety and Health Administration. Indoor Air Quality-Proposed Rule. Notice of Proposed Rulemaking; U.S. Government Publishing Office: Washington, DC, USA, 1994; Volume 59, pp. 15968–16039. [Google Scholar]
  58. World Health Organization WHO Regional Publications European Series, No. 31: Indoor Air Quality: Biological Contaminants; Report on a WHO Meeting; WHO: Copenhagen, Denmark, 1988.
  59. Dehaene, S. The neural basis of the Weber-Fechner law: A logarithmic mental number line. Trends Cogn. Sci. 2003, 7, 145–147. [Google Scholar] [CrossRef]
  60. Piasecki, M.; Kostyrko, K. Development of Weighting Scheme for Indoor Air Quality Model Using a Multi-Attribute Decision Making Method. Energies 2020, 13, 3120. [Google Scholar] [CrossRef]
  61. AS/NZS 2107:2000. Acoustics—Recommended Design Sound Levels and Reverberation Times for Building Interiors; Australian Standards: Sydney, Australia, 2000. [Google Scholar]
  62. Hunt DRG. Predicting artificial lighting use—A method based upon observed patterns of behaviour. Lighting Res. Technol. 1980, 12, 7–14. [Google Scholar] [CrossRef]
  63. PN-B-02151-2:2018-01 Akustyka Budowlana–Ochrona Przed Hałasem w Budynkach–Część 2: Wymagania Dotyczące Dopuszczalnego Poziomu Dźwięku w Pomieszczeniach; Polish Standards PKN: Warsaw, Poland, 2018. (In Polish)
  64. PN EN 12464-1:2012 Light and Lighting-Lighting of Work Places-Part 1: Indoor work. The European Committee for Standardization CEN. Available online: https://sklep.pkn.pl/pn-en-12464-1-2012p.html (accessed on 1 November 2020).
  65. Watanabe, T. Pictorial Atlas of Soil and Seed Fungi: Morphologies of Cultured Fungi and Key to Species, 3rd ed.; CRC Press: Cleveland, OH, USA, 2010. [Google Scholar]
  66. Kozicki, M.; Wiejak, A.; Piasecki, M.; Abram, A. Identification of MVOCs Produced by Coniophora puteana and Poria placenta Growing on WPC Boards by Using Subtraction Mass Spectra. Int. J. Environ. Res. Public Health 2019, 16, 2499. [Google Scholar] [CrossRef] [PubMed] [Green Version]
  67. Mancini, F.; Nastasi, B. Energy Retrofitting Effects on the Energy Flexibility of Dwellings. Energies 2019, 12, 2788. [Google Scholar] [CrossRef] [Green Version]
  68. Ortiz, M.; Itard, L.; Bluyssen, P.M. Indoor environmental quality related risk factors with energy-efficient retrofitting of housing: A literature review. Energy Build. 2020, 221, 110102. [Google Scholar] [CrossRef]
  69. Steidl, T.; Krause, P. Moisture transport in cellular concrete walls with the connector for thermal insulation. Period. Polytech. Civ. Eng. 2018, 62, 986–991. [Google Scholar]
  70. Kisilewicz, T. On the role of external walls in the reduction of energy demand and the mitigation of human thermal discomfort. Sustainability 2019, 11, 1061. [Google Scholar] [CrossRef] [Green Version]
  71. Krause, P.; Nowoświat, A.; Pawłowski, K. The Impact of Internal Insulation on Heat Transport through the Wall: Case Study. Appl. Sci. 2020, 10, 7484. [Google Scholar] [CrossRef]
  72. Firląg, S.; Piasecki, M. NZEB Renovation Definition in a Heating Dominated Climate: Case Study of Poland. Appl. Sci. 2018, 8, 1605. [Google Scholar] [CrossRef] [Green Version]
Figure 1. Case study buildings—No. 3 is the Faculty of Environmental and Energy of the Cracow University of Technology (FEEE) façade and orientation at Campus and building No. 8—the Faculty of Architecture (FA)—where additional analogous tests were also performed.
Energies 13 06051 g001
Figure 2. Cross-section through a building wall; not insulated (left side) and insulated from inside with Epatherm system (right side). The lower figures show the vapor pressure charts, calculated using PN-EN ISO 13788: 2013-05 (where Ps—saturated vapor pressure, P—actual vapor pressure, location—Cracow, climatic data—average temperature and humidity for the coldest month).
Energies 13 06051 g002
Figure 3. Demonstrative cross-section of the Faculty of Environmental and Energy Engineering of the Cracow University of Technology where indoor environmental test were performed. Section A—spaces on the upper floor that were not subjected to energy retrofitting. Section B—cellar spaces subjected to energy retrofitting. (the blue X indicates the measurement points located in zones after thermal modernization of the building, red X—measurement points in the non-modernized spaces).
Energies 13 06051 g003
Figure 4. Photographs before, during and after the energy retrofitting process of selected cellar spaces.
Energies 13 06051 g004
Figure 5. Logarithmic regression of user dissatisfaction (PD) developed based on the recommended values from several literature resources.
Energies 13 06051 g005
Figure 6. Material collected from the non-energy-retrofitted upper-floor room in Rose Bengal Agar (RBA) and Sabouraud Glucose Agar (SGA) mediums post-incubation.
Energies 13 06051 g006
Figure 7. The percentage share of identified mold species in energy-retrofitted spaces by medium (RBA or SGA).
Energies 13 06051 g007
Figure 8. The percentage share of identified mold species found in non-energy-retrofitted rooms by medium (RBA and SGA).
Energies 13 06051 g008
Figure 9. Material from insulated room 1 in an SGA and an RBA medium post-incubation.
Energies 13 06051 g009
Figure 10. The results of the percentage of dissatisfied with thermal comfort (ISO 7730) in the space of case study building where the thermal modernization was performed (blue line) and in the space without retrofitting s (red line) during the summer test period (16–22 September 2020, no heating and cooling applied). The x-axis shows the experiment time (hh: mm).
Energies 13 06051 g010
Figure 11. Thermal comfort test results. PMV (blue line) and PD indicators (red line) for a space subjected to energy retrofitting using the Epatherm System during the winter test period (10–13 January 2020, heating season). The x-axis shows the time [hh: mm].
Energies 13 06051 g011
Figure 12. Thermogram of the cellar space subjected to wall insulation application (a), thermogram of the cellar space without wall insulation (b) (winter period).
Energies 13 06051 g012
Figure 13. Comfort parameters by vote method, before and after the energy retrofit.
Energies 13 06051 g013
Table 1. Technical properties of the climate panel.
Technical PropertyValue
Dry density220 kg/m3
Porosity90% by volume
Thermal conductivity coefficient 0.059 W/m·K
Water vapor permeability coefficient 3
pH12
Table 2. Summary of quantitative standards and guidelines for fungi in the air by governmental and private organizations used by authors to convert recommended values on the Predicted number of dissatisfied users (PD).
IAQ
Impact Level
PDPN-89
[44]
ACGIH
[45]
AIHA
[46,47,48]
CEC
[49]
CHMC
[50]
CIC
[51]
HBI
[52]
IAQA
[53]
NHW
[54]
NI
[55]
NC
[56]
USSHA
[57]
WHO
[58]
low10% 100 100100 150150 150
moderate25%30001000 1000500200750 500500 1000500
high50% 1000
very high75%5000
health effects100%10,000 10,000 10,000
Note: PN-89: Polish Standard (Polska Norma), ACGIH: American Conference of Governmental Industrial Hygienists, AIHA: American Industrial Hygiene Association, CEC: Commission of the European Communities, CHMC: Canada Mortgage and Housing Corporation, CIC: Cutter Information Corp., HBI: Healthy Buildings International, IAQA: Indoor Air Quality Association, NHW: National Health and Welfare (Canada), NI: Northern Ireland Air Quality Index, NC: New York City Department of Health, USSHA: United States Occupational Safety and Health Administration and WHO: World Health Organization.
Table 3. Sensors and their Measurement Data.
Sensor TypeRangeScaleAccuracy
Temperature FHAD46–20 °C to 50 °C0.01 °C±0.5 °C
Humidity FHAD460–100%0.1%±5%
Air velocity FVAD150.01–10 m/s0.01 m/s±2%
Radiant temperature FIAD430–50 °C0.01 °C±2%
Table 4. Volatile organic compounds (VOCs) and CO2 Sensors and their Measurement Data.
Sensor TypeRangeScaleAccuracy
VOCs PID detector10−20,000 ppb1 ppb±20%
CO2 detector FYAD000−50001 ppm±0.6%
Table 5. Results of measured indoor environment parameters (inputs to IEQ sub-components calculation) in non-retrofitted spaces and retrofitted and averaged values for winter (10–13 January 2020) and summer (16–22 September 2020).
SpaceIAQqualityTCindexACcindexLindex
∆CO2
(ppm)
TVOC
(µg/m3)
HCHO
(µg/m3)
CFU
(CFU/m3)
PMV
(–)
va
(m/s)
Iclo
(clo)
M
(met)
LAeq
(dB)
LDesign
(dB)
Emin
(lux)
non-retrofitted
(winter)
251 ± 3550 ± 1107.2 ± 11330 ± 360−1.180.1 ± 0.0511.242 ± 340225 ± 25
non-retrofitted
(summer)
212 ± 3na *6.8 ± 1na−1.170.2 ± 0.050.71.1na40375 ± 25
non-retrofitted
averaged
232 ± 3550 ± 1107.0 ± 11330 ± 360−1.170.2 ± 0.050.91.142 ± 340300 ± 25
retrofitted
(winter)
268 ± 3340 ± 706.2 ± 153 ± 160.050.1 ± 0.0511.236 ± 340225 ± 25
retrofitted
(summer)
281 ± 3na6.4 ± 1na−0.610.2 ± 0.050.71.1na40350 ± 25
retrofitted
averaged
275 ± 3340 ± 706.3 ± 153 ± 16−0.260.2 ± 0.050.91.136 ± 340287 ± 25
* “na”—not assessed.
Table 6. List of predicted occupant satisfaction indexes SIi for non-retrofitted and retrofitted spaces of a building (summer and winter).
IAQCO2IAQTVOCIAQHCHOIAQCFUΣIAQindeTCindexAccindexLindexIEQindex
Space(%)(%)(%)(%)(%)(%)(%)(%)(%)
non-retrofitted
(winter)
92 ± 171 ± 1894 ± 1152 ± 2757 ± 1967 ± 396 ± 791 ± 778 ± 20
non-retrofitted
(summer)
93 ± 1na *94 ± 11nana67 ± 3na97 ± 780 ± 20
non-retrofitted
average
92 ± 171 ± 1894 ± 1152 ± 2757 ± 1967 ± 396 ± 795 ± 779 ± 20
retrofitted
(winter)
91 ± 161 ± 1894 ± 11100 ± 2792 ± 1995 ± 3100 ± 791 ± 794 ± 20
Retrofitted
(summer)
91 ± 1na94 ± 11nana87 ± 3na97 ± 793 ± 20
retrofitted
average
91 ± 161 ± 1894 ± 11100 ± 2792 ± 1991 ± 3100 ± 795 ± 794 ± 20
* “na”—not assessed.
Table 7. List of spore counts by test point (* FEEE—case study building, FA—similar campus building).
MediumSPACE (CFU/m3)
Energy-Retrofitted Cellar
FEEE *
Non-Retrofitted Spaces
FEEE *
Non-Retrofitted Cellar FA *
1234123
RBA59510021880845370
SGA2575853015601105710
Table 8. Partition surface swab results for the spaces under study.
FungiRoom
Energy-Retrofitted
Cellar
FEEE
Non-Retrofitted Cellar
FA
Non-Retrofitted Spaces
FEEE
123123
RBASGARBASGARBASGARBASGARBASGARBASGA
Aspergillus sp.------------
Aspergillus niger-+----------
Aspergillus versicolor------+-++++--
Aspergillus ochraceus---------++--
Penicillium sp.--++----++++--
Chaetomium sp.--------++++--
Paecilomyces variotti+-----------
Trichoderma sp.++----------
“++”—considerable colony growth; “+”—growth of individual colonies; “-”—no fungal growth.
Table 9. Average VOC values for rooms subjected to energy retrofitting with the use of the Epatherm internal thermal insulation system (FEEE).
Measurement 12345Average Value
RH (%)36.436.236.236.136.136.2
VOCs (ppb)120160140200110146
VOCs (µg/m3) *280370320460250340
* The conversion from ppb was done using isobutylene equivalent.
Table 10. Average VOC values for rooms that were not subjected to energy retrofitting with the use of the Epatherm internal thermal insulation system (FEEE).
Measurement 12345Average Value
RH (%)42.442.642.242.742.442.5
VOCs (ppb)260240210240240238
VOCs (µg/m3)600550480550550550
Table 11. Average VOC values for rooms that were not subjected to energy retrofitting with the use of the Epatherm internal thermal insulation system (FA CUT).
Measurement 12345Average Value
RH (%)40.440.640.240.740.440.5
VOCs (ppb)160140210180160170
VOCs (µg/m3)370320480410370390
Table 12. Increase of the comfort parameters in the context of thermal modernization of indoor spaces—by using the IEQ (computational) method and a questionnaire (Vote) method.
∆ΣIAQindex∆TCindex∆Accindex∆Lindex∆IEQindex
Method(%)(%)(%)(%)(%)
IEQ (measurement + sensory curves) +35%+24%+4%0%+15%
Survey (vote) +38%+33%+13%0%+23%
Publisher’s Note: MDPI stays neutral with regard to jurisdictional claims in published maps and institutional affiliations.

