Abstract
An ejector is a simple mechanical device that can be integrated with power generation or the refrigeration cycle to enhance their performance. Owing to the complex flow behavior in the ejector, the performance prediction of the ejector is done by numerical simulations. However, to evaluate the performance of an ejector integrated power cycle or refrigeration cycle, the need for simpler and more reliable thermodynamic models to estimate the performance of the ejector persists. This research, therefore, aims at developing a single mathematical correlation that can predict the ejector performance with reasonable accuracy. The proposed correlation relates the entrainment ratio and the pressure rise across the ejector to the area ratio and the mass flow rate of the primary flow. R141b is selected as the ejector refrigerant, and the results obtained through the proposed correlation are validated through numerical solutions. The comparison between the analytical and numerical with experimental results provided an error of less than 8.4% and 4.29%, respectively.
1. Introduction
An ejector is a simple mechanical device that uses the low pressure created by the expansion of high-pressure motive fluid (primary) and generates a vacuum, which is then used to entrain and subsequently compress a secondary fluid [1]. The widespread application of an ejector includes: the removal of ash from flue gases [2]; in desalination plants [3]; solid oxide fuel cells [4]; refrigeration machines [5]; fueling of hydrogen vehicles [6]; and power generation cycle [7]. Ejectors could be integrated into various energy conversion processes to improve the energy efficiency, and have been actively researched since the 1950s [8]. However, the ejector-assisted refrigeration systems, or the ejector expansion refrigeration cycle (EERC), have gained the most interest, due to their superior performance, operational flexibility, and ease of control [9]. Recently, the interest in ejector-assisted refrigeration machines has been greatly renewed, since they can be operated using low-grade heat [10,11].
In an EERC, the ejector is either applied to replace the mechanical compressor, as in a steam jet cooling system, or reduce the irreversibility during the throttling process by harnessing the kinetic energy released during the process [9]. In the latter case, the kinetic energy is utilized to raise the suction pressure higher than the evaporation pressure, thereby reducing the compression power. A schematic of a typical ejector expansion refrigeration cycle (EERC) and the corresponding pressure enthalpy (P-h) diagram is shown in Figure 1 [12,13]. A 17% increase in coefficient of performance (COP) has been reported using EERCs [13]. In contrast to the conventional refrigeration machine, in an EERC, the expansion valve is replaced by an ejector. Instead of throttling the high-pressure refrigerant (motive fluid) from the condenser, it is expanded in the convergent divergent (CD) primary nozzle of the ejector. The expansion of the refrigerant in the CD generates a vacuum and entrains the refrigerant from the evaporator (secondary fluid). The two streams subsequently mix in the mixing chamber, undergo a shock wave, and are fed into a diffuser to increase the pressure of the mixed stream. The ejector pre-compresses the working fluid to back pressure in the EERC, and, consequently, reduces the compression load [9].
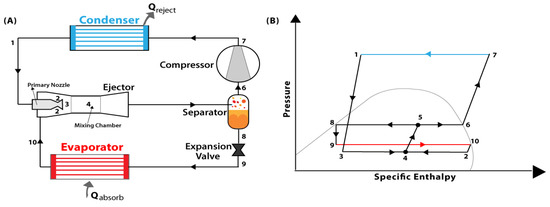
Figure 1.
(A): Illustration of schematic of Ejector expansion refrigeration cycle (EERC); (B): Shows corresponding pressure enthalpy (P-h) diagram for EERC cycle.
The ejector is at the core of the EERC, and an integral step in the design and performance estimation of an EERC is the modeling of the ejector. The performance of the ejector is quantified in terms of two main global parameters; (i) entrainment ratio, and (ii) compression pressure ratio. The entrainment ratio is the ratio of secondary fluid flow rate to the primary (motive) fluid flow rate, while the compression pressure ratio reflects the pressure gain of the secondary fluid [14]. Many thermodynamic models were developed to predict the ejector performance. Huang et al. [15] pioneered the development of a 1D model for the prediction of ejector performance. The model was based on ideal gas assumption, isentropic flow relations with constant isentropic efficiency, and the constant value for specific heat, and showed 15% deviation from the experimental results. Over time, many improved models to estimate the ejector performance have been developed and proposed [9]. In the Huang model, the choice of isentropic efficiencies is the major source of error, therefore, Haghparast et al. [16] replaced the isentropic efficiencies with polytropic efficiency to improve the model accuracy. Selvaraju et al. [17] proposed another analysis code that induces the effect of friction in the ejector, which is normally neglected by its predecessors. The accuracy of the 1D analytical model has been improved; nonetheless, they are based on assumptions of ideal gas flow and normal shock, which does not reflect the actual flow behavior in the ejector [9].
The fluid flow through the ejector is compressible and supersonic, involving a series of complex flow interactions, such as shock wave–boundary layer interaction and flow mixing [18]. The 1D analytical models do not incorporate the complex flow interactions occurring in the ejector; however, the complex flow structure plays a significant role in estimating the performance of the ejector [18]. Therefore, various researchers [12,18] employed computational fluid dynamics (CFD) models to better visualize the fluid flow and provide a detailed description of complex fluid flow inside the ejector. These models essentially solve the Reynolds-averaged Navier-Stokes (RANS) equation by using turbulence models and numerical methods [19]. Desevaux et al. [20] used a standard k-ε turbulence model in FLUENT to study the ejector flow. However, their study was based on ideal gas assumption, and underpredicted the back pressure by about 20%. Del Valle et al. [21] presented a CFD model that considered real gas properties, and the results showed better agreement with the experimental results. Han et al. [22] utilized the CFD model to comprehensively investigate the mechanism of boundary layer separation in the ejector and its effect on ejector performance. Their study concluded that either a too small or too big mixing chamber diameter can induce boundary layer separation, which is the main cause of back flow in the ejector. Elbarghthi et al. [23], as well, employed CFD to explore the performance of an EERC with alternative refrigerants, such as R-1234ze(E) and R-1234yf. An insightful review of system and component level numerical modeling of ejector was done by Little et al. [24], in which they highlighted that the pathway to improving the ejector analysis is the advance modeling of turbulence effects and the phase changes.
The 1D, as well as CFD, analysis of ejectors have been continuously evolving. Although the 1D models pose certain limitations, however, they are readily adaptable and compatible for the system level analysis of EERCs. The constant isentropic efficiencies are a major source of discrepancies in the 1D analytical models. Therefore, to improve the choice of isentropic efficiencies for the sizing and performance prediction of the ejector, Haghparast et al. [16] used CFD tools to approximate the isentropic efficiencies. In their study, the appropriate efficiencies are extracted from the CFD model, and subsequently used in the 1D model to estimate the ejector performance. Riaz et al. [12] extended the same integration of CFD tools and 1D models to design and optimize the low-grade waste heat driven ejector refrigeration system. Rogié et al. [25] utilized a similar technique in the investigation of the ejector as a potential replacement of expansion valve in the hydrogen fueling station to minimize the energy expenditure and the fueling time. The CFD analysis provides more credibility in the analysis results; however, they lack the ability to be readily integrated for a system level analysis. The varying operating conditions leading to high computation and time requirements make CFD models unfit for real time implementation in the practical systems [18,19].
The CFD models considerably improve the quality of ejector analysis; however, they are focused on the component level study and, hence, are not compatible for the performance analysis of a complete system. On the other hand, the accuracy of 1D models for ejectors is still questionable. Therefore, in this study, empirical correlations, based on experimental data of Huang at al. [15], have been developed to predict ejector performance parameters. The study describes how the performance of an ejector is mainly governed by two parameters: (i) area ratio of the initial CD nozzle and the mixing chamber, and (ii) the ratio of motive fluid inlet pressure to the secondary inlet pressure. Therefore, a multivariate polynomial regression technique is applied to predict the entrainment ratio and compression pressure ratio of the ejector as a function of major performance influencing parameters. Furthermore, a CFD model is developed to investigate the ejector performance. Zhu et al. [26] explored the ejector flow by using experimental and numerical methods. Their study investigated four turbulence models and found out the k-ε model agrees best with measurements for predictions of mass flow rates, which is adopted in this study. The CFD model is validated against the experimental results. The validated CFD model is subsequently used to evaluate the accuracy of the results calculated using the empirical correlations. The empirical correlations have the advantage of easy integration with the overall system model, and facilitate the real time implementation of ejectors into practical refrigeration systems.
2. Ejector Description and Modeling
In the following section, the 1D model of ejector analysis, with the necessary assumptions, is given. Subsequently, the development and implementation of the numerical (CFD) model is also discussed in detail, with the focus on geometry construction, meshing, selection of turbulence model, and the related FLUENT settings.
2.1. Mathematical Solution of Ejectors
The thermodynamic models are the early models developed to understand and estimate the ejector performance [27]. Basically, these 1D and 2D mathematical models analytically solve the gas dynamic relations for compressible flow to model the flow field inside the ejector [28]. Although these mathematical models provide a certain level of understanding of fluid flow through the ejector, these models are still far behind in fully explaining the ejector flow field, because of involvement of certain flow discrepancies, such as normal shock waves, primary and secondary flow mixing, and boundary layer separation, as well as use of isentropic coefficients [29]. These flow features obstruct the development of detailed models that could fully analyze the ejector flow, as then the complexity of governing equations go beyond the capability of analytical procedures. The existing analytical models simulate the flow by making various assumptions such that the governing system of equations is simplified [15]. All these models are used to evaluate the ejector performance in terms of global flow parameters, such as entrainment ratio (ω) and compression ratio (Pc) [12]. The geometry of an ejector is shown in Figure 2. The important boundary conditions include throat area of primary nozzle (At), area of mixing chamber (A3), and the inlet pressures of motive fluid (Pg) and secondary fluid (Pe).
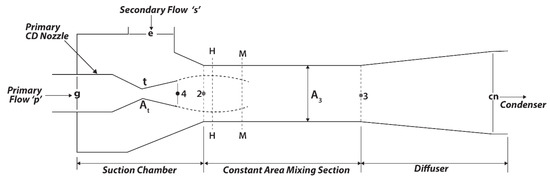
Figure 2.
Ejector schematic.
In this study, the 1D thermodynamic model of Huang et al. [15] is utilized for describing the performance of the ejector at various values of Pg corresponding to saturated vapor temperature from 351 K to 368 K, which lies within the range of ejector refrigeration machinery. The various geometrical specifications of ejector that were used in this study are given in Table 1.

Table 1.
Geometrical specifications of ejector.
The system of equations used to solve the analytic ejector model shown in Figure 2 are summarized in Table 2, with the flowing assumptions.
Table 2.
Conventional calculation procedure.
- The working fluid acts as an ideal gas, having constant specific heat (Cp) and specific heat ratio (γ).
- Steady, adiabatic, and 1D flow.
- Negligible kinetic energy at secondary flow inlet, primary nozzle inlet, and diffuser exit.
- Use of isentropic relations and constant mixing chamber efficiency.
- The primary and secondary fluid flow mixes at hypothetical throat located within constant area section (Section 2–3).
- Constant pressure mixing (PpH = PsH).
- Choking of entrained flow at hypothetical throat and Mach number of MsH = 1 is assumed.
- Adiabatic ejector walls.
The limitations of abovementioned analytical model include (a) constant values of isentropic coefficients and isentropic efficiencies of various components, and (b) the procedure for analytically solving the governing equations, mentioned above, is an iterative process.
2.2. Mathematical Solution of Ejectors
In the present study, a systematic approach was proposed to develop a simple method to calculate the optimal values of ω and Pc without the need of iterations. A regression analysis was conducted to identify the likely relation between ejector performance parameters and ejector operating conditions and geometrical specifications. To correlate the inputs (A3, At, Pg, Pe) with outputs (ω and CP), regression equations were developed using the least square method. As ω and Pc are two dependent variables, two regression equations were proposed, which required both area ratio (A3/At) and pressure ratio (Pg/Pe) as an input (independent variables). The relationship between dependent variable ω with A3/At and Pg/Pe is shown Figure 3.
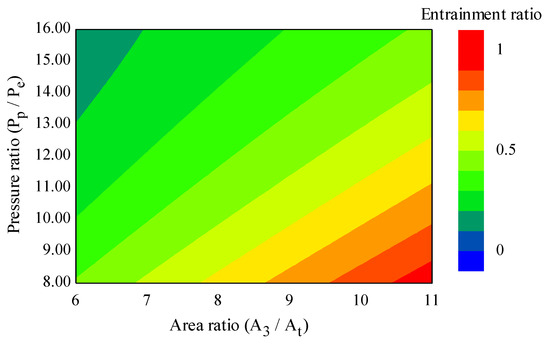
Figure 3.
Relation between entrainment ratio (ω) with area (A3/At) and pressure ratio (Pg/Pe).
The figure clearly shows a nonlinear relation between the ω with Pg/Pe and A3/At, and there exists a negative nonlinear association between ω and Pg/Pe, that is, decreasing the value of Pg/Pe results in increased entrainment ratio. Similarly, the association between the other dependent variable (Pcn) and independent variables is also shown by Figure 4. Each graphical representation shows that the ejector performance parameters are highly influenced under the variations in inlet flow pressures (Pg, Pe) and ejector geometry (A3, At).
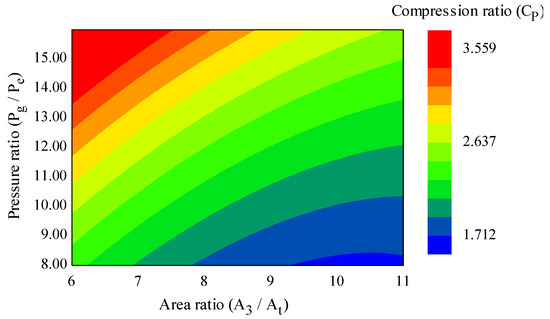
Figure 4.
Relation between compression ratio (Cp) with area ratio (A3/At) and pressure ratio (Pg/Pe).
The correlations were developed using the experimental data available in the study conducted by Huang et al. [15], and is provided in Appendix A. This data includes experimentally determined values of ω, compression ratio (Pcn/Pe), A3/At, and Pg/Pe. An empirical correlation of second-degree polynomial (that predicts ejector performance in terms of ω as a function of A3/At and Pg/Pe), was developed using polynomial regression techniques because of the existence of the nonlinear behavior among the predictor and response variables, as shown in Figure 3 and Figure 4. Using a forward selection method, a second-degree polynomial, in terms of area ratio and pressure ratio, was selected. The general equation with second-degree polynomial [30] in the present case becomes:
where y: dependent variable; x: independent variable; β0: intercept; β1 and β2: linear effect parameters; β11, β22: quadratic effect parameters; β12: interaction parameter; and ε: error. The above equation can be represented in terms of specific independent variables, as given below:
The above expression is also termed as response surface [31] where β0, β1, β2, β11, β2, and β12 are coefficient parameters of the equation. These equation parameters were found by applying the least square approach on the matrix form of the above equations, which generated the following matrix relation:
where the matrix [X] contained n values of all the independent variables (A3/At and Pg/Pe), and matrix [Y] contained all n values of dependent variable (ω) associated with specific values of independent variables. The above matrix expression was then solved in MATLAB, and the following empirical correlation was obtained:
Similarly, the second empirical correlation for predicting the compression ratio was obtained following the same procedure, except that, due to the linear relation between the response and predictor variables, the general regression equation is shown below, and the values of coefficients were calculated as explained above and the developed empirical equation is also shown below [30]. In the later section, both empirical equations are validated against the CFD model developed, to predict ejector performance at varying ejector specifications.
Figure 5 shows a comparison between performance evaluation of ejector done through the conventional 1D thermodynamics model and the empirical correlations. The figure clearly demonstrates how the complex solution procedure of the 1D model can be replaced by a single-step empirical correlation.
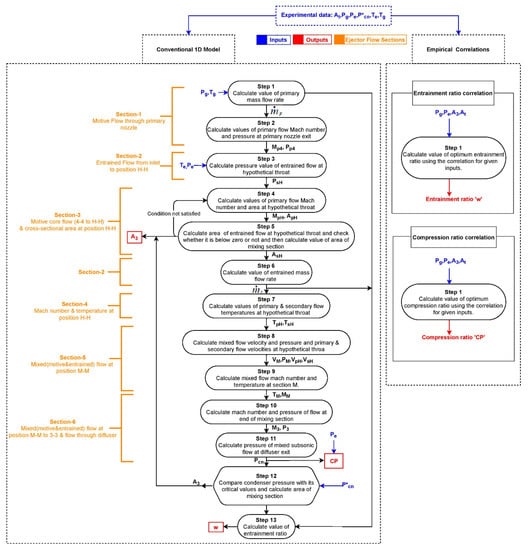
Figure 5.
Comparative flowchart of ejector performance analysis 2.3. Computational fluid dynamics (CFD) model development.
CFD is a robust tool that helps in better visualization of ejector flow phenomena, such as supersonic flow, flow mixing, shock trains, and boundary layers, as discussed above. In this study, a CFD model has been developed, utilizing the commercially available simulation package ANSYS FLUENT 2019. The software package uses finite volume techniques, that are based on discretization of governing equations, by dividing the physical geometry into smaller elements, forming a control volume mesh. Originally, the fluid flow through the ejector is essentially unsteady in a 3D space, mainly due to the turbulent flow nature. However, by utilizing the RANS equations, which are used for determining averaged values of flow quantities by time averaging over long intervals [32], the problem is assumed to be steady and axisymmetric, providing acceptable level of accuracy in both global and local flow phenomena [33]. Therefore, in this study, the ejector is modeled utilizing axisymmetric geometry, as literature studies have shown that a 2D axisymmetric model will produce identical results to a 3D flow model, but with less computation effort [34]. By utilizing axis symmetric condition, 2D governing equations defined in terms of radial components are solved using a finite volume discretization method, with second-order upwind scheme [12]. These axisymmetric equations for simulating ejector flow include standard conservation equations of energy, mass, and momentum, as used in studies by Zhang et al. [35] and Bartosiewicz et al. [36].
Discretization is an integral part of a numerical study. The accuracy and quality of results of any CFD model is highly influenced by the mesh density. A well-refined mesh is a necessity to have negligible discretization error. A mesh independence study was performed by refining the mesh size, and results showing variation of entrainment ratio with number of cells is given in Figure 6. It can be seen that when the number of cells are increased further from 500,000 to 600,000 for a structured mesh, the entrainment ratio rises only by 0.1%, and, therefore, mesh density of 500,000 cells is shortlisted in this study as a tradeoff between accuracy of results and corresponding computation effort (time). Furthermore, use of structured mesh allows much better control over mesh quality, and quadrilateral elements are used for meshing the fluid domain. The visualization of flow domain is shown in Figure 7. The mesh quality at the onset of mixing of primary and secondary fluid is refined to capture the complex flow interaction and oblique shocks. After the mixing, the mixed flow undergoes normal shock, which reduces the flow velocity from supersonic to subsonic [37]. The magnified view of mixing region and normal shock is also given in Figure 7.
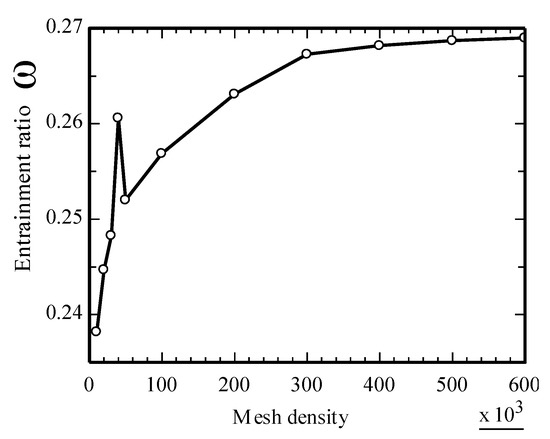
Figure 6.
Mesh independence study.
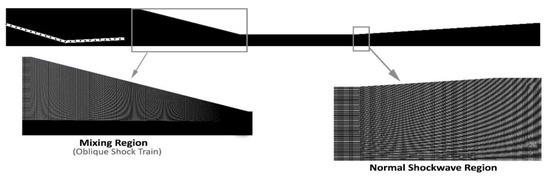
Figure 7.
Final mesh with magnified regions (to shown refined mesh at critical flow locations).
Generally, a density-based solver is recommended widely in the literature for simulating compressible fluid flows. However, the recent studies show that a pressure-based solver is also equally capable of solving compressible flows in less time than a density-based solver [28]. Hence, a pressure-based solver with coupled algorithm for pressure–velocity coupling is selected. The stagnation pressure boundary condition was applied at both the primary and secondary inlet. The CFD study was performed using experimental data of Huang et al. [15], and for R141b working fluid, the thermodynamic properties were obtained from the REFPROP v9.1.
The solution of RANS equations involves various turbulent fluid models, and proper selection of these models highly influences the flow behavior inside the ejector. Two turbulence models are shortlisted through the literature: k-ε (k epsilon) and k-ω (k omega) [28]. Among the two models, the k-ω model is widely recommended in the literature, as compared to the k-ε model, because the former provides a more accurate global and local flow feature estimate than the latter [38]. In addition, the k-ε model requires higher number of iterations, and provides poor performance, as compared to the k-ω-sst (k omega sheer stress transport) model in terms of convergence, thermal, and flow field prediction [39]. Also, according to various other CFD studies [26,40], the k-ω-sst model provides better prediction for shock wave location and intensity. Hence, in this paper, a CFD study was conducted using a k-ω-sst turbulence model for all simulations, and summary of numerical setup adopted, boundary conditions detail, and mesh employed is provided in Table 3. The convergence criteria were satisfied typically around 1500 iterations when all the residuals fell below 1 × 10⁻⁶.
Table 3.
CFD model setup summary.
2.3. CFD Model Validation
For validating the CFD model, the geometry (AA, AB, AC, AD) from already published experimental work [15] is utilized, where Figure 8 shows fixed geometrical configuration [41] and values of variable parameters, such as At, A4, and A3, are taken from Table 1.
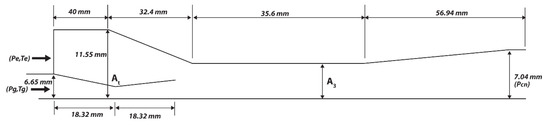
Figure 8.
General geometrical configuration.
Under these geometrical specifications and experimental operating conditions (Pg: 0.4–0.604 MPa, Pe: 0.04–0.047 MPa and PC), the developed CFD model is employed to validate the results obtained through empirical correlation of entrainment ratio and compression ratio. In addition, these comparisons provide the information about the reliability of the developed correlations.
3. Results
For validation, five different geometries were simulated from Huang et al.’s paper, with the same boundary conditions. Simulations were performed, and the Mach number contours and pressure contours are shown in Figure 9 and Figure 10, respectively.
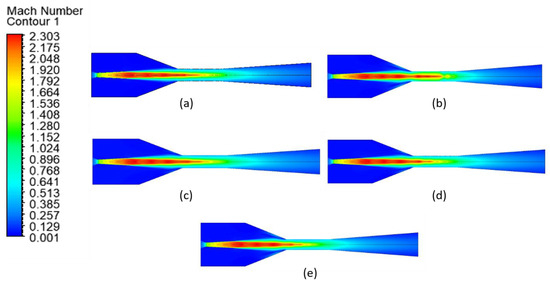
Figure 9.
Mach number contours (a) AD Geometry Pe = 0.047 MPa, Pg = 0.538 MPa; (b) AA Geometry Pe = 0.047 MPa, Pg = 0.538 MPa; (c) AD Geometry Pe = 0.04 MPa, Pg = 0.465 MPa; (d) AC Geometry Pe = 0.04 MPa, Pg = 0.465 MPa; and (e) AB Geometry Pe = 0.04 MPa, Pg = 0.465 MPa.
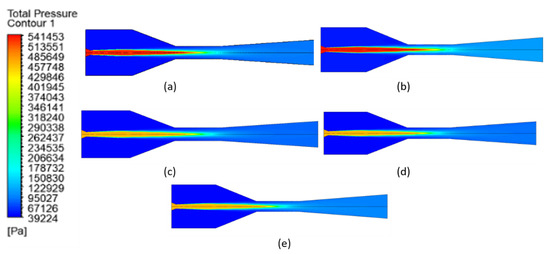
Figure 10.
Total pressure contours (a) AD Geometry Pe = 0.047 MPa, Pg = 0.538 MPa; (b) AA Geometry Pe = 0.047 MPa, Pg = 0.538 MPa; (c) AD Geometry Pe = 0.04 MPa, Pg = 0.465 MPa; (d) AC Geometry Pe = 0.04 MPa, Pg = 0.465 MPa; and (e) AB Geometry Pe = 0.04 MPa, Pg = 0.465 MPa.
From Mach number contours, it is evident that flow in ejectors is a very complex phenomenon that includes shock waves, oblique shock waves, and turbulent effects. The figure shows the varying flow conditions along the different sections of ejector geometry. Initially, flow enters the convergent part of the primary converging diverging (CD) nozzle, where the flow decelerates until it achieves the choking condition (Ma = 1) at the contraction (throat) of the CD nozzle. The motive flow, while passing through the divergent section of the nozzle, accelerates and continues accelerating, even after exiting the primary nozzle, which is as per the assumption made for the analytical solution of the ejector. After the two flows (primary and secondary) mix together in the mixing section, the velocities of these flows sum up into a single averaged velocity (of mixed flow) along the ejector length. The mixed flow undergoes a normal compression shock wave, which transforms the supersonic flow (Ma > 1) to subsonic (Ma < 1). This mixed flow is then fed into a diffuser, where it is further compressed until it attains condenser pressure.
The secondary flow is accelerated and is then entrained by the motive flow, due to the formation of shear layer between primary and secondary flows, under the influence of high-velocity gradient in between the motive and entrained flow at the CD nozzle exit, as also observed in Figure 9, where the velocity transforms to dark blue, followed by a light blue, and finally to yellow. After the motive flow exits the primary nozzle, it slows down, due to its interaction with the entrained flow, starting from the outer boundary of flow, and, consequently, the entrained flow gets accelerated. As the flow passes through the constant area mixing section, more uniformity in color is observed, which points to good flow mixing.
The variation in flow pressure along the ejector centerline is shown in Figure 10. The motive flow, as it passes through the CD nozzle, undergoes a sudden drop in pressure while it remains steady inside the constant area mixing section. Inside the mixing section, the frictional effects slightly reduce the flow velocity, which, in turn, increases the pressure of flow. At the end, when this fluid (supersonic) is fed into a diffuser, the pressure drops due to the supersonic flow condition, followed by an abrupt and rapid rise of pressure due to the occurrence of normal shock wave, which brings the supersonic flow to subsonic state. The deviation between values of entrainment ratio obtained through the CFD model, empirical correlations, and experimental data are shown in Figure 11.
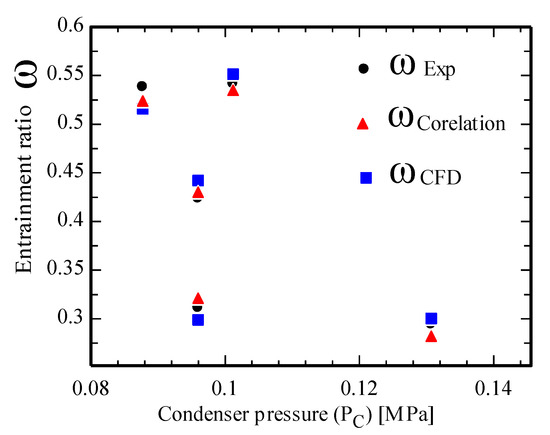
Figure 11.
Validation of empirical correlation of ω through the CFD model.
The comparison of empirical correlation and the experimental data is shown in Figure 12, where the maximum deviation from experimental results is 8.40%.
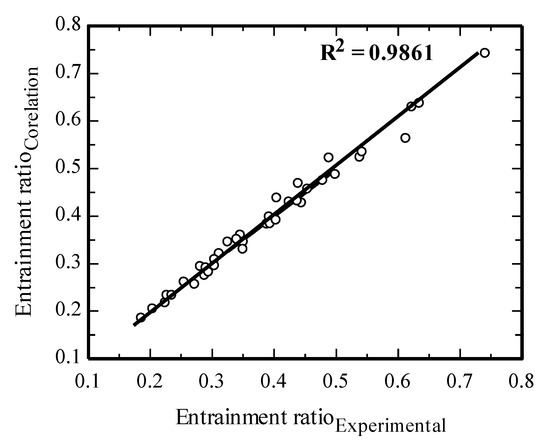
Figure 12.
Validation of empirical correlation.
3.1. Case Study: Simple Refrigeration Machine
A simple refrigeration machine, as shown in Figure 13, was designed and parametrically investigated for a case study. The system is designed for a generator temperature (TPri) and evaporator temperature (TEva) of 70–100 °C and 10–20 °C, respectively. The ambient sink is considered for condenser, so the condensing temperature (TCond) is fixed to 40 °C. The working fluid is taken as R141b, thus the developed correlations are valid. The conditions are summarized in Table 4. For the case study, the refrigeration capacity (QCool) is fixed to 300 W. Using the known QCool and TEva, the msec can be calculated. Subsequently, the correlations are applied to calculate mPri and PCond. The calculation procedure is summarized in Table 5. After solving the system, the coefficient of performance (COP) can be calculated. The pumping work was too small, and is, therefore, neglected in calculating the COP.
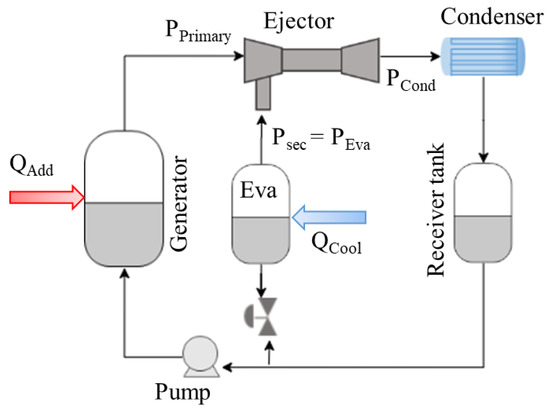
Figure 13.
Schematic for simple refrigeration system.
Table 4.
Specifications of refrigeration system.
Table 5.
Summary of calculation procedure.
3.2. COP Variation with Generation Temperature and the Evaporation Temperature
The TEva and TPri have a significant impact on the COP of the system, shown in Figure 13. Both can vary, depending on the heat source and the target temperature. For the system shown in Figure 13, the QAdd can be supplied using any low-grade heat source, such as waste heat or the solar energy [39]. Furthermore, PEva is governed by the required target temperature and can also vary, depending on the requirement. Therefore, a parametric study with respect to TEva and TPri was conducted, and the results are shown in Figure 14. As can be seen from the figures, higher values of TPri and TEva both favor the performance of the proposed design. The results are rather obvious, since the increase in evaporation or generation temperature both reduce the load on a refrigeration machine. However, the investigation demonstrates the ease of parametric investigation using empirical correlations for the ejector.
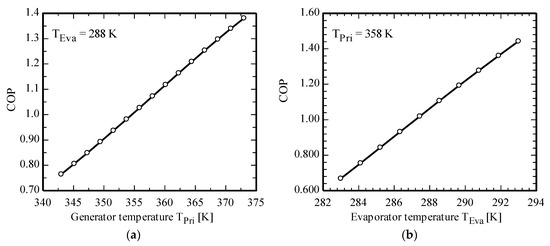
Figure 14.
The figure (a) depicts the influence of TEva on system coefficient of performance (COP). The figure (b) displays the influence of TPri on system coefficient of performance (COP).
4. Conclusions
The interest in ejector-assisted refrigeration systems has been rekindled, since these compact devices can be operated using low-grade heat. The ejector is one of the crucial components in the ejector-assisted machines, and the need for a reliable model for estimating ejector performance persists. However, the ejector flow is comprehensible, and involves complex flow features like normal shock wave and boundary layer interaction, and, so far, all the 1D thermodynamic models are rather complex and lack the adequate accuracy. Therefore, this study proposed an empirical correlation to predict the performance of an ejector operated with R141b in the range of 0.4–0.604 MPa primary pressure and 0.040–0.047 MPa secondary pressure. The correlation can predict both global flow parameters of ejectors, i.e., entrainment ratio and compression ratio, with an accuracy of 8.4%, and 6.3%, respectively. Furthermore, due to the complex flow behavior in the ejector, a k-ω CFD model was developed. The model was validated against the experimental results. Using the CFD model, Mach number and pressure contours were plotted. The results show that the maximum error in the CFD was 4.29%. Moreover, the validity of correlation was also studied, with the validated CFD results also shown. In the end, a case study was shown that successfully demonstrated the ease of using the correlations for the design of an ejector-assisted refrigeration machine. A parametric study was conducted that concluded that both high primary fluid temperature and evaporation temperature increase the performance of the machine.
Author Contributions
Conceptualization: H.A.M., Z.R. and B.L.; data curation: H.A.M., H.M.A., Z.R., J.C. and M.I.; formal analysis: H.A.M., H.M.A., B.L., M.M. and M.S.; funding acquisition: B.L. and M.I.; investigation: H.A.M., H.M.A., Z.R. and M.I.; methodology: H.A.M., H.M.A. and M.M.; project administration: B.L. and Y.-J.B.; resources: B.L. and Y.-J.B.; software: H.A.M., H.M.A. and Z.R.; supervision: Z.R., B.L. and Y.-J.B.; validation: J.C., M.S. and M.S.B.; visualization: M.M. and M.S.B.; writing—original draft: H.A.M., H.M.A. and Z.R.; writing—review and editing: B.L., Y.-J.B. and M.I. All authors have read and agreed to the published version of the manuscript.
Funding
This work was supported by the Development Program of the Korea Institute of Energy Research (KIER) (C0-2447), (C0-2410) and by the National Research Council of Science & Technology (NST) grant by the Ministry of Science and ICT, Republic of Korea (No. CRC-15-07-KIER).
Conflicts of Interest
The authors declare no conflict of interest.
Nomenclature
| D | Diameter |
| A | Area, m2 |
| Cp | Fluid specific heat at constant pressure, KJ kg−1 K−1 |
| Cv | Fluid specific heat at constant volume, KJ kg−1 K−1 |
| γ | Ratio of specific heats (Cp/Cv) |
| R | Specific gas constant, KJ kg−1 K−1 |
| a | Sonic velocity, ms−1 |
| V | Fluid velocity, ms−1 |
| M | Mach number |
| m | Mass flowrate, kgs−1 |
| h | Enthalpy, KJ kg−1 |
| Pg | Fluid pressure at ejector primary nozzle inlet, MPa |
| Pe | Fluid pressure at ejector suction inlet, MPa |
| Pcn * | Ejector critical back pressure, MPa |
| T | Temperature, K |
| Tg | Fluid temperature at ejector primary nozzle inlet, K |
| Te | Fluid temperature at ejector suction inlet, MPa |
| Tcn * | Saturated vapor temperature corresponding to Pcn *, K |
| Tgs | Saturated-vapor temperature corresponding to Pg, K |
| H | Hypothetical throat position |
| ƞ | Isentropic efficiency coefficient |
| φ | Coefficient representing flow losses |
| Superscripts | |
| * | Ejector critical operation mode |
| Subscripts | |
| cn | Condenser, Ejector exit |
| e | Entrained flow suction port |
| g | Primary nozzle inlet |
| M | Mixed flow |
| t | Primary nozzle throat |
| p4 | Primary fluid at nozzle exit |
| sH | Entrained flow at hypothetical throat |
| pH | Primary flow at hypothetical throat |
| 1 | Motive nozzle throat |
| 2 | Constant area section Entrance |
| 3 | Constant area section Exit |
| 4 | Primary Nozzle Exit |
Appendix A
| Geometry | Area Ratio (A3/At) | Expansion Ratio (Pg/Pe) | Compression Ratio (Pc/Pe) | Entrainment Ratio (ω) |
| AA | 6.44 | 10 | 2.56 | 0.3257 |
| 6.44 | 11.62 | 2.84 | 0.288 | |
| 6.44 | 13.45 | 3.18 | 0.2246 | |
| 6.44 | 15.1 | 3.54 | 0.1859 | |
| 6.44 | 9.89 | 2.45 | 0.3398 | |
| 6.44 | 11.44 | 2.76 | 0.2946 | |
| 6.44 | 12.85 | 3.05 | 0.235 | |
| EG | 6.77 | 15.1 | 3.41 | 0.2043 |
| AB | 6.99 | 10 | 2.3 | 0.3922 |
| 6.99 | 11.62 | 2.66 | 0.3117 | |
| 6.99 | 13.45 | 3.04 | 0.2718 | |
| EC | 7.26 | 15.1 | 3.17 | 0.2273 |
| 7.26 | 12.85 | 2.74 | 0.304 | |
| AG | 7.73 | 10 | 2.26 | 0.4393 |
| 7.73 | 11.62 | 2.54 | 0.3883 | |
| 7.73 | 13.45 | 2.95 | 0.304 | |
| 7.73 | 15.1 | 3.15 | 0.2552 | |
| 7.73 | 8.51 | 1.93 | 0.6132 | |
| 7.73 | 9.89 | 2.17 | 0.479 | |
| 7.73 | 11.44 | 2.45 | 0.4034 | |
| 7.73 | 12.85 | 2.69 | 0.3503 | |
| ED | 8.25 | 15.1 | 3 | 0.2902 |
| AC | 8.29 | 10 | 2.09 | 0.4889 |
| 8.29 | 11.62 | 2.38 | 0.4241 | |
| 8.29 | 13.45 | 2.67 | 0.3488 | |
| 8.29 | 15.1 | 2.91 | 0.2814 | |
| EE | 9.17 | 15.1 | 2.71 | 0.3505 |
| 9.17 | 12.85 | 2.31 | 0.4048 | |
| AD | 9.41 | 10 | 1.91 | 0.6227 |
| 9.41 | 11.62 | 2.18 | 0.5387 | |
| 9.41 | 13.45 | 2.47 | 0.4446 | |
| 9.41 | 15.1 | 2.66 | 0.3457 | |
| 9.41 | 8.51 | 1.7 | 0.7412 | |
| 9.41 | 9.89 | 1.91 | 0.635 | |
| 9.41 | 11.44 | 2.14 | 0.5422 | |
| 9.41 | 12.85 | 2.33 | 0.4541 | |
| 9.83 | 15.1 | 2.6 | 0.3937 | |
| 9.83 | 12.85 | 2.22 | 0.4989 | |
| EH | 10.64 | 15.1 | 2.45 | 0.4377 |
References
- Li, A.; Yuen, A.C.Y.; Chen, T.B.Y.; Wang, C.; Liu, H.; Cao, R.; Yang, W.; Yeoh, G.H.; Timchenko, V. Computational study of wet steam flow to optimize steam ejector efficiency for potential fire suppression application. Appl. Sci. 2019, 9, 1486. [Google Scholar] [CrossRef]
- Nadig, R. Evacuation systems for steam surface condensers: Vacuum pumps or steam jet air ejectors? In ASME 2016 Power Conference Collocated with the ASME 2016 10th International Conference on Energy Sustainability and the ASME 2016 14th International Conference on Fuel Cell Science, Engineering and Technology; American Society of Mechanical Engineers Digital Collection: Charlotte, NC, USA, 2016. [Google Scholar]
- Pourmohammadbagher, A.; Jamshidi, E.; Ale-Ebrahim, H.; Dabir, B.; Mehrabani-Zeinabad, M. Simultaneous removal of gaseous pollutants with a novel swirl wet scrubber. Chem. Eng. Process. Process Intensif. 2011, 50, 773–779. [Google Scholar] [CrossRef]
- Liu, J.; Wang, L.; Jia, L.; Xue, H. Thermodynamic analysis of the steam ejector for desalination applications. Appl. Therm. Eng. 2019, 159, 113883. [Google Scholar] [CrossRef]
- Vincenzo, L.; Pagh, N.M.; Knudsen, K.S. Ejector design and performance evaluation for recirculation of anode gas in a micro combined heat and power systems based on solid oxide fuel cell. Appl. Therm. Eng. 2013, 54, 26–34. [Google Scholar] [CrossRef]
- Genc, O.; Timurkutluk, B.; Toros, S. Performance evaluation of ejector with different secondary flow directions and geometric properties for solid oxide fuel cell applications. J. Power Sources 2019, 421, 76–90. [Google Scholar] [CrossRef]
- Chen, J.; Jarall, S.; Havtun, H.; Palm, B. A review on versatile ejector applications in refrigeration systems. Renew. Sustain. Energy Rev. 2015, 49, 67–90. [Google Scholar] [CrossRef]
- Xia, J.; Wang, J.; Zhou, K.; Zhao, P.; Dai, Y. Thermodynamic and economic analysis and multi-objective optimization of a novel transcritical CO2 Rankine cycle with an ejector driven by low grade heat source. Energy 2018, 161, 337–351. [Google Scholar] [CrossRef]
- Chunnanond, K.; Aphornratana, S. Ejectors: Applications in refrigeration technology. Renew. Sustain. Energy Rev. 2004, 8, 129–155. [Google Scholar] [CrossRef]
- Elbel, S.; Lawrence, N. Review of recent developments in advanced ejector technology. Int. J. Refrig. 2016, 62, 1–18. [Google Scholar] [CrossRef]
- Besagni, G.; Mereu, R.; Inzoli, F. Ejector refrigeration: A comprehensive review. Renew. Sustain. Energy Rev. 2016, 53, 373–407. [Google Scholar] [CrossRef]
- Riaz, F.; Lee, P.S.; Chou, S.K. Thermal modelling and optimization of low-grade waste heat driven ejector refrigeration system incorporating a direct ejector model. Appl. Therm. Eng. 2020, 167, 114710. [Google Scholar] [CrossRef]
- Lucas, C.; Koehler, J. Experimental investigation of the COP improvement of a refrigeration cycle by use of an ejector. Int. J. Refrig. 2012, 35, 1595–1603. [Google Scholar] [CrossRef]
- Aligolzadeh, F.; Hakkaki-Fard, A. A novel methodology for designing a multi-ejector refrigeration system. Appl. Therm. Eng. 2019, 151, 26–37. [Google Scholar] [CrossRef]
- Huang, B.J.; Chang, J.M.; Wang, C.P.; Petrenko, V.A. A 1-D analysis of ejector performance. Int. J. Refrig. 1999, 22, 354–364. [Google Scholar] [CrossRef]
- Haghparast, P.; Sorin, M.V.; Nesreddine, H. Effects of component polytropic efficiencies on the dimensions of monophasic ejectors. Energy Convers. Manag. 2018, 162, 251–263. [Google Scholar] [CrossRef]
- Selvaraju, A.; Mani, A. Analysis of an ejector with environment friendly refrigerants. Appl. Therm. Eng. 2004, 24, 827–838. [Google Scholar] [CrossRef]
- Aidoun, Z.; Ameur, K.; Falsafioon, M.; Badache, M. Current Advances in Ejector Modeling, Experimentation and Applications for Refrigeration and Heat Pumps. Part 1: Single-Phase Ejectors. Inventions 2019, 4, 15. [Google Scholar] [CrossRef]
- Aidoun, Z.; Ameur, K.; Falsafioon, M.; Badache, M. Current Advances in Ejector Modeling, Experimentation and Applications for Refrigeration and Heat Pumps. Part 2: Two-Phase Ejectors. Inventions 2019, 4, 16. [Google Scholar] [CrossRef]
- Desevaux, P.; Marynowski, T.; Khan, M. CFD prediction of supersonic ejectors performance. Int. J. Turbo Jet Engines 2006, 23, 173–182. [Google Scholar] [CrossRef]
- Del Valle, J.G.; Sierra-Pallares, J.; Carrascal, P.G.; Ruiz, F.C. An experimental and computational study of the flow pattern in a refrigerant ejector. Validation of turbulence models and real-gas effects. Appl. Therm. Eng. 2015, 89, 795–811. [Google Scholar] [CrossRef]
- Han, Y.; Wang, X.; Sun, H.; Zhang, G.; Guo, L.; Tu, J. CFD simulation on the boundary layer separation in the steam ejector and its influence on the pumping performance. Energy 2019, 167, 469–483. [Google Scholar] [CrossRef]
- Elbarghthi, A.F.; Mohamed, S.; Nguyen, V.V.; Dvorak, V. CFD Based Design for Ejector Cooling System Using HFOS (1234ze (E) and 1234yf). Energies 2020, 13, 1408. [Google Scholar] [CrossRef]
- Little, A.B.; Garimella, S. A critical review linking ejector flow phenomena with component-and system-level performance. Int. J. Refrig. 2016, 70, 243–268. [Google Scholar] [CrossRef]
- Wen, C.; Rogie, B.; Kærn, M.R.; Rothuizen, E. A first study of the potential of integrating an ejector in hydrogen fuelling stations for fuelling high pressure hydrogen vehicles. Appl. Energy 2020, 260, 113958. [Google Scholar] [CrossRef]
- Zhu, Y.; Jiang, P. Experimental and numerical investigation of the effect of shock wave characteristics on the ejector performance. Int. J. Refrig. 2014, 40, 31–42. [Google Scholar] [CrossRef]
- He, S.; Li, Y.; Wang, R.Z. Progress of mathematical modeling on ejectors. Renew. Sustain. Energy Rev. 2009, 13, 1760–1780. [Google Scholar] [CrossRef]
- Croquer, S.; Poncet, S.; Aidoun, Z. Turbulence modeling of a single-phase R134a supersonic ejector. Part 1: Numerical benchmark. Int. J. Refrig. 2016, 61, 140–152. [Google Scholar] [CrossRef]
- Tashtoush, B.M.; Moh’d A, A.N.; Khasawneh, M.A. A comprehensive review of ejector design, performance, and applications. Appl. Energy 2019, 240, 138–172. [Google Scholar] [CrossRef]
- Rawlings, J.O.; Pantula, S.G.; Dickey, D.A. Applied Regression Analysis: A Research Tool; Springer Science & Business Media: Berlin/Heidelberg, Germany, 2001. [Google Scholar]
- Sinha, P. Multivariate polynomial regression in data mining: Methodology, problems and solutions. Int. J. Sci. Eng. Res. 2013, 4, 962–965. [Google Scholar]
- Honra, J.; Berana, M.S.; Danao, L.A.M.; Manuel, M.C.E. CFD Analysis of Supersonic Ejector in Ejector Refrigeration System for Air Conditioning Application. In Proceedings of the World Congress on Engineering, London, UK, 5–7 July 2017; Volume 2. [Google Scholar]
- Carrillo, J.A.E.; de La Flor, F.J.S.; Lissén, J.M.S. Single-phase ejector geometry optimisation by means of a multi-objective evolutionary algorithm and a surrogate CFD model. Energy 2018, 164, 46–64. [Google Scholar] [CrossRef]
- Pianthong, K.; Seehanam, W.; Behnia, M.; Sriveerakul, T.; Aphornratana, S. Investigation and improvement of ejector refrigeration system using computational fluid dynamics technique. Energy Convers. Manag. 2007, 48, 2556–2564. [Google Scholar] [CrossRef]
- Zhang, H.; Wang, L.; Jia, L.; Wang, X. Assessment and prediction of component efficiencies in supersonic ejector with friction losses. Appl. Therm. Eng. 2018, 129, 618–627. [Google Scholar] [CrossRef]
- Bartosiewicz, Y.; Aidoun, Z.; Desevaux, P.; Mercadier, Y. Cfd-experiments integration in the evaluation of six turbulence models for supersonic ejector modeling. Integr. CFD 2003, 1, 450. [Google Scholar]
- Hanafi, A.S.; Mostafa, G.M.; Waheed, A.; Fathy, A. 1-D mathematical modeling and CFD investigation on supersonic steam ejector in MED-TVC. Energy Procedia 2015, 75, 3239–3252. [Google Scholar] [CrossRef]
- Besagni, G.; Inzoli, F. Computational fluid-dynamics modeling of supersonic ejectors: Screening of turbulence modeling approaches. Appl. Therm. Eng. 2017, 117, 122–144. [Google Scholar] [CrossRef]
- Besagni, G.; Mereu, R.; Chiesa, P.; Inzoli, F. An Integrated Lumped Parameter-CFD approach for off-design ejector performance evaluation. Energy Convers. Manag. 2015, 105, 697–715. [Google Scholar] [CrossRef]
- Mohamed, S.; Shatilla, Y.; Zhang, T. CFD-based design and simulation of hydrocarbon ejector for cooling. Energy 2019, 167, 346–358. [Google Scholar] [CrossRef]
- Scott, D.; Aidoun, Z.; Bellache, O.; Ouzzane, M. CFD simulations of a supersonic ejector for use in refrigeration applications. In Proceedings of the International Refrigeration and Air Conditioning Conference at Purdue, Paper 927. West Lafayette, IN, USA, 14–17 July 2008. [Google Scholar]


Publisher’s Note: MDPI stays neutral with regard to jurisdictional claims in published maps and institutional affiliations. |
© 2020 by the authors. Licensee MDPI, Basel, Switzerland. This article is an open access article distributed under the terms and conditions of the Creative Commons Attribution (CC BY) license (http://creativecommons.org/licenses/by/4.0/).