Article

Hydrodynamic Performance of a Hybrid System Combining a Fixed Breakwater and a Wave Energy Converter: An Experimental Study

1
Key Laboratory of Ministry of Education for Coastal Disaster and Protection, Hohai University, Nanjing 210098, China
2
School of Mechanical Engineering, Shandong University, Ji’nan 250100, China
3
State Key Laboratory of Mechanics and Control of Mechanical Structures, Nanjing University of Aeronautics and Astronautics, Nanjing 210016, China
*
Author to whom correspondence should be addressed.
Energies 2020, 13(21), 5740; https://doi.org/10.3390/en13215740
Submission received: 7 October 2020 / Revised: 26 October 2020 / Accepted: 28 October 2020 / Published: 2 November 2020

Abstract

:
In this paper, a hybrid system integrating a fixed breakwater and an oscillating buoy type wave energy converter (WEC) is introduced. The energy converter is designed to extract the wave power by making use of the wave-induced heave motions of the three floating pontoons in front of the fixed breakwater. A preliminary experimental study is carried out to discuss the hydrodynamic performance of the hybrid system under the action of regular waves. A scale model was built in the laboratory at Hohai University, and the dissipative force from racks and gearboxes and the Ampere force from dynamos were employed as the power take-off (PTO) damping source. During the experiments, variations in numbers of key parameters, including the wave elevation, free response or damped motion of the floating pontoons, and the voltage output of the dynamos were simultaneously measured. Results indicate that the wave overtopping and breaking occurring on the upper surfaces of floating pontoons have a significant influence on the hydrodynamic performance of the system. For moderate and longer waves, the developed system proves to be effective in attenuating the incident energy, with less than 30% of the energy reflected back to the paddle. More importantly, the hydrodynamic efficiency of energy conversion for the present device can achieve approximately 19.6% at the lowest wave steepness in the model tests, implying that although the WEC model harnesses more energy in more energetic seas, the device may be more efficient for wave power extraction in a less energetic sea-state.

1. Introduction

The possibility of generating electrical power from water waves has been recognized since the late 18th century, and there are countless ideas for devices to extract the power. In recent years, with global attention being drawn to climate change and the rising level of CO2, the research into harnessing energy from waves is stimulated again, and the wave energy is expected to play a meaning role in reducing the world’s fossil fuels dependency. As of now, a large number of concepts for wave energy conversion have been proposed, and thousands of wave energy extracting techniques have been patented in the world. Despite the large variation in design, wave energy converters (WECs) are generally categorized into either shoreline, nearshore, or offshore devices according to their locations [1]. Among them, shoreline devices have the advantage of being close to the utility network, are easy to maintain, and have a reduced likelihood of being damaged under extreme weather. However, developing shoreline WECs poses a number of challenges for engineers and researchers, e.g., lower wave power in shallow water, preservation of coastal scenery, and requirements on shoreline geometry and geology. For some devices, the tidal range can also be an issue.
To overcome the challenges listed above, abundant studies have been performed to promote the performance and hence the commercial competitiveness of wave power devices in the global energy market. Some of them have progressed significantly with a promising energy conversion, e.g., Limpet [2], Seawave Slot-Cone Generator (SSG) [3], and Tapchan [4]. Nevertheless, the industrialization of wave energy exploitation is still considerably limited by the high cost, and therefore more technological improvements and experience are needed to ensure competitive prices and long-term survival for WECs. Recently, the idea of integrating WECs into coastal structures or offshore wind energy facilities to leverage cost-sharing benefits has attracted wide attention and been recognized to be a feasible solution to reduce the cost. As a kind of widely used protective structure in coastal and offshore engineering, breakwaters offer excellent conditions for the integration with WECs as they are often deployed in similar marine environmental conditions [5]. In addition, breakwaters and WECs are functionally complementary, as the former are commonly used to dissipate incident waves or reflect them back to sea, while the latter extract wave energy from incoming waves for power generation. Based on these advantages, kinds of breakwater–WEC systems have been proposed and studied in both numerical and experimental manners. For example, He et al. [6] experimentally investigated the hydrodynamic performance of floating breakwaters with and without pneumatic chambers that provided the potential for simultaneous wave energy conversion by installing Wells turbines. Vicinanza and Frigaard [3] developed a novel WEC named Seawave Slot-Cone Generator, making use of wave run-up or overtopping water along maritime sheltering structures, and then conducted laboratory tests to investigate the influence of wave loading on energy conversion. Ning et al. [7] introduced an oscillating buoy (OB) type wave energy converter integrated with a vertical pile-restrained floating breakwater (FB). The capture width ratio (CWR) of the breakwater–OB system can be up to 24% while the transmitted waves were restricted in an effective manner at the same time. Based on the similar idea with Ning et al. [7], Ma et al. [8] evaluated the parametric effect of a PTO system on an integration system of an OB wave energy device with a pile-restrained floating breakwater, especially considering the viscous effect.
Among the aforementioned hybrid systems, the systems integrating breakwaters and OB type WECs are more favorable in less energetic seas such as China Seas, due to the modular and compact design of the systems and their variable size [9]. Meanwhile, the standing waves formed in front of breakwaters are beneficial to the improvement of the energy conversion efficiency through the magnification of wave amplitude. As one of these types of devices, Martinelli et al. [10] proposed a hybrid structure consisting of an “active” floating breakwater, coupled with a new type of wave energy converter, named ShoWED. The efficiency of ShoWED was estimated up to 26% in the laboratory, taking advantage of the reflected waves from the breakwater. Similarly, Peng et al. [11] proposed a float-type shoreline wave energy converter coupled with a breakwater. The developed WEC was proved, via an experimental manner, to be effective in dissipating the incident wave energy, especially for longer waves, and be able to extract wave energy at a meaningful rate from regular waves. Aiming at a broad range of effective frequency (for transmission coefficient, Kt < 0.5 and capture width ratio, CWR > 20%), Ning et al. [12] proposed a wave energy converter–type breakwater equipped with dual pontoon-power take-off system. Experimental results revealed that the transmission coefficient of the system was smaller in relative longer waves, and the capture width ratio of the system was improved. Further, Zhao et al. [13] proposed an integrated breakwater–WEC system, which was composed of an array of a heaving oscillating buoy and a fixed breakwater. Detailed experiments were undertaken to investigate the heave-response-amplitude operator, the wave force on the WEC devices, and the transmission coefficient of the breakwater–WEC system. More recently, Zhang et al. [14] proposed a dual-floater hybrid system consisting of a floating breakwater and an oscillating-buoy type WEC and investigated its performance using a numerical wave tank. It was found that the wave energy conversion efficiency of the hybrid system could be improved by increasing the draft and width of the WEC and decreasing the distance between the WEC and the breakwater. Krishnendu and Balaji [15] integrated a wave energy converter with a vertical porous chambered breakwater. The average power generation performance of the wave energy converter was found to increase by 20% after integrating it with the chambered breakwater. From the above-mentioned studies, the superposition of the incident wave and reflected wave can prove to be able to enhance the performance of the WECs deployed in the weather side of a breakwater or a seawall. Meanwhile, it is also confirmed to be vital for a hybrid system to take into account both of the effectiveness of the WEC and the performance of the breakwater, and then find a strategy to broaden the effective frequency range, as suggested by Ning et al. [12].
In this study, we propose a hybrid system combining a fixed breakwater and a wave energy converter, as shown in Figure 1. The wave energy converter consists of three box-type floating pontoons located in front of the breakwater, working under the principle of an OB type WEC. The floating pontoons are restrained close to each other and only have one degree of freedom, namely, heave. The working principle is described in the schematic sketch of the hybrid system (see Figure 1). The basic idea is to install on the floating pontoons an additional mechanism for wave energy extraction, which may effectively harvest, or at least dissipate, the incoming wave energy. When subjected to water waves, the floating pontoons heave up and down along with the time-varying external force, and drive the alternator for electricity generation. If dangerous weather, which could potentially threaten the safety of the device, is predicted, the floating pontoons can sink into the sea to a safe position, being filled with water. The pontoons can then be brought back to working condition once it is considered to be safe again, similar to the survival strategies adopted by the pitching vertical cylinder [16] and the Oyster [17]. According to the theory of standing wave, the wave amplitude is strengthened to the largest extent at the front wall of the breakwater, and the amplification of amplitude reduces gradually along the up-wave direction. Therefore, the mechanisms for power conversion are installed only on the two floating pontoons nearest the breakwater (also called the damped floaters), while the one furthest from the breakwater (also called the undamped floater) is free to move in vertical direction. Meanwhile, the three floating pontoons are designed to have different drafts, such that their top surfaces can form a stepped plane, inducing wave breaking and more viscosity dissipation. The undamped floater is the heaviest, so its depth of immersion is the largest, making the wave overtopping more likely to happen on its top surface. In contrast, the damped floating pontoons are lighter and thus have smaller draft compared to the undamped one; therefore, their response amplitude under the action of waves is relatively larger, able to drive the electricity generators for a meaningful energy conversion.
One of the objectives of this study is to integrate a breakwater with a WEC for functional complementation and cost-sharing. For a hybrid breakwater–WEC system, preliminary investigation under regular waves is often necessary to examine its performance [18,19,20]. Thereby, the hydrodynamic characteristics of the developed system for wave energy extraction from regular waves and for wave attenuation are investigated in an experimental manner. A physical model with scale ratio of 1:10 is constructed and used to analyze the process of complicated interactions of nonlinear waves with the present hybrid system. Via the measurements taken during the experiment tests, a parametric study of the hydrodynamic coefficients (including reflection and dissipation coefficients) and the hydrodynamic efficiency for energy conversion of the proposed integrated system can be performed. Notably, to improve the performance of a WEC, two aspects are usually considered, namely, the WEC mechanical efficiency and hydrodynamic performance, while this study mainly focuses on the latter. Though the PTO force from realistic alternators and mechanisms can be simulated, as suggested by Brito et al. [21], it is beyond the scope of this study and may be considered as research topics for further investigation in the future. At present, the electricity generation module and relevant mechanisms are replaced with dynamos and transmission gears in laboratory experiments, for the sake of simplification, as shown in Figure 2.

2. Experimental Investigation

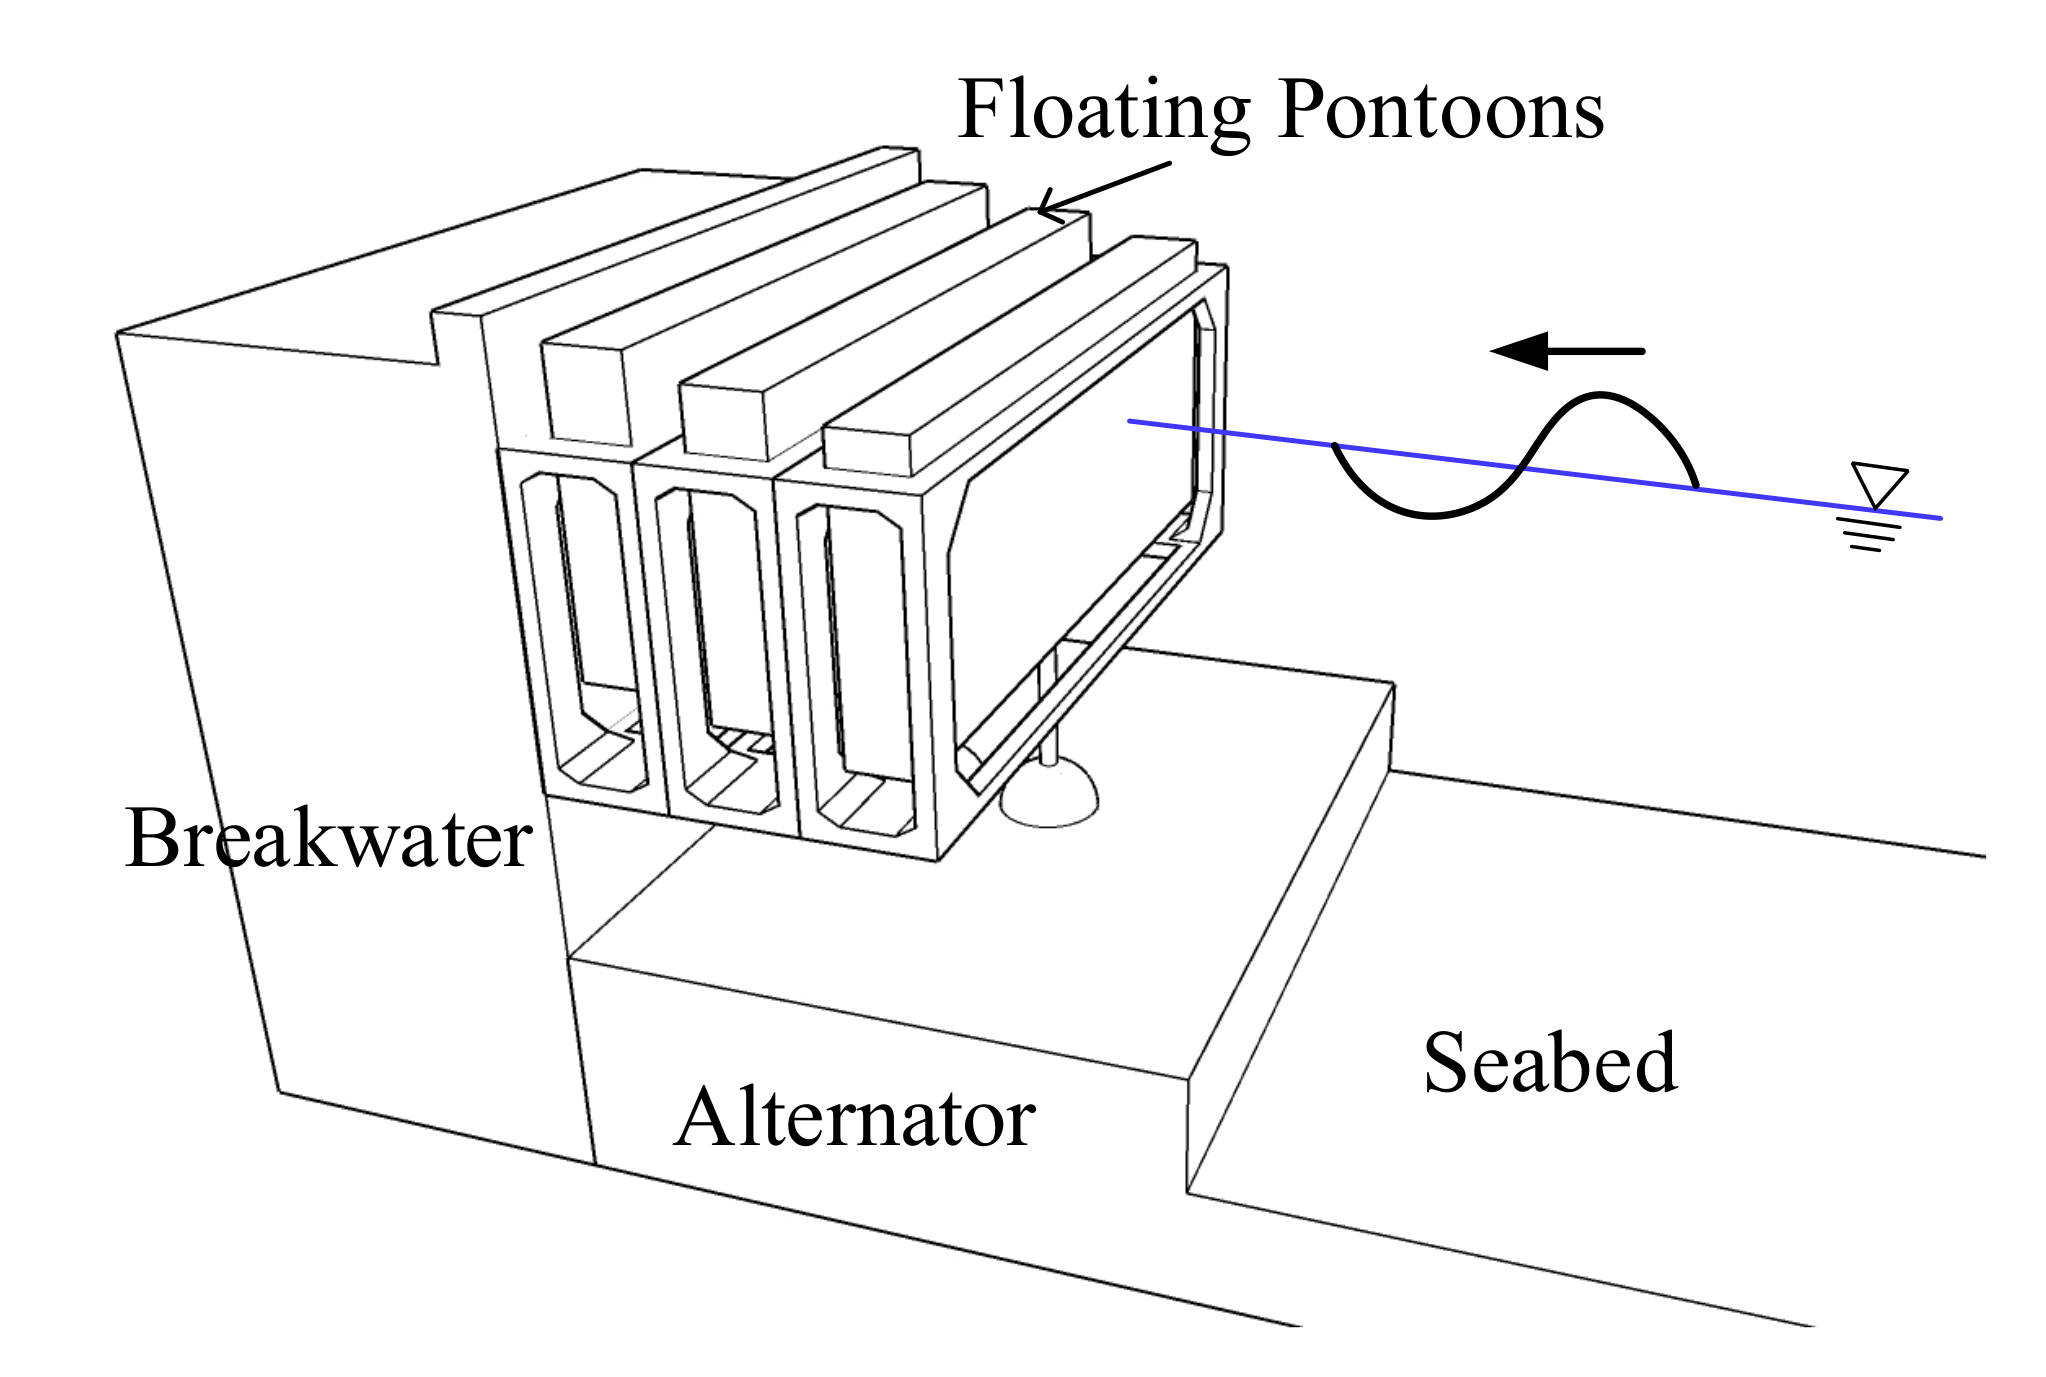
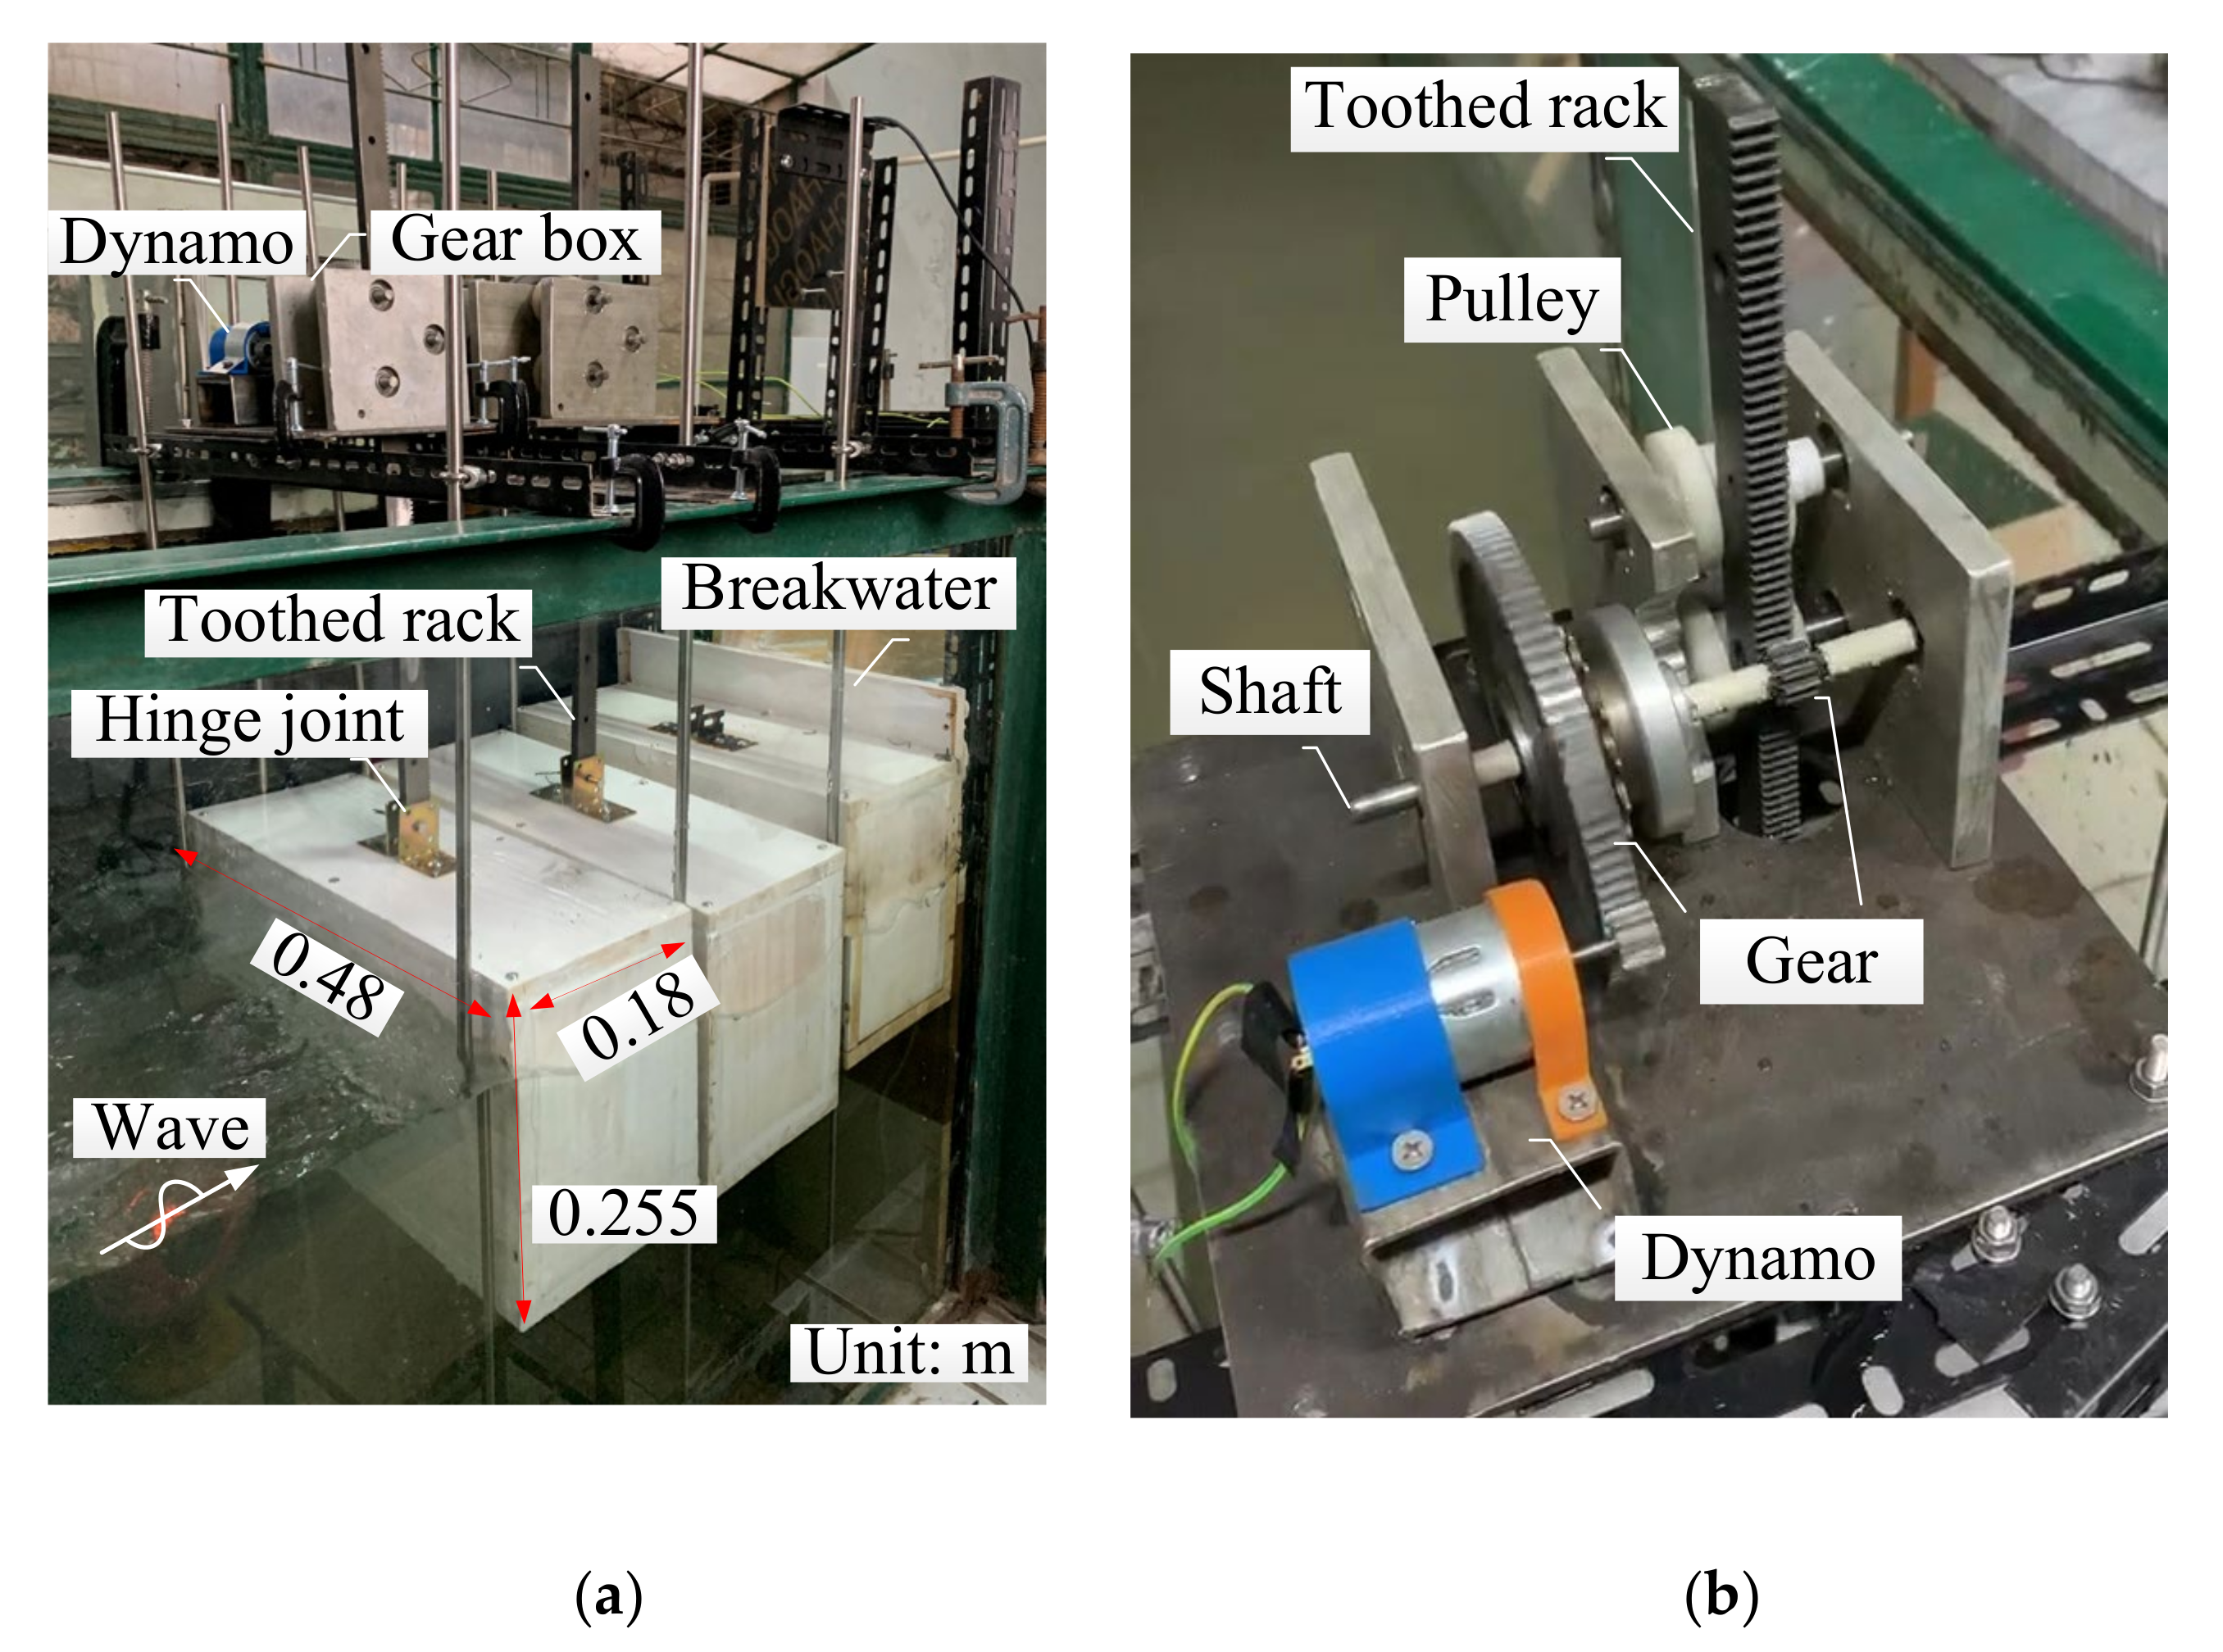
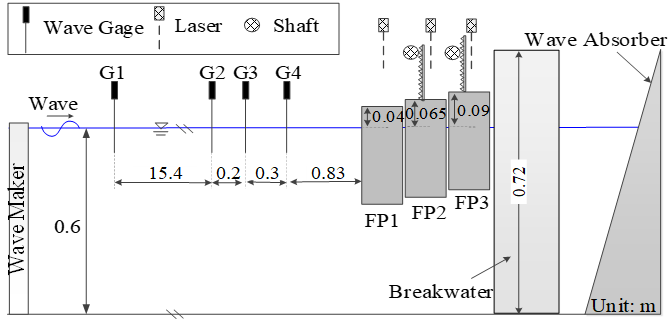
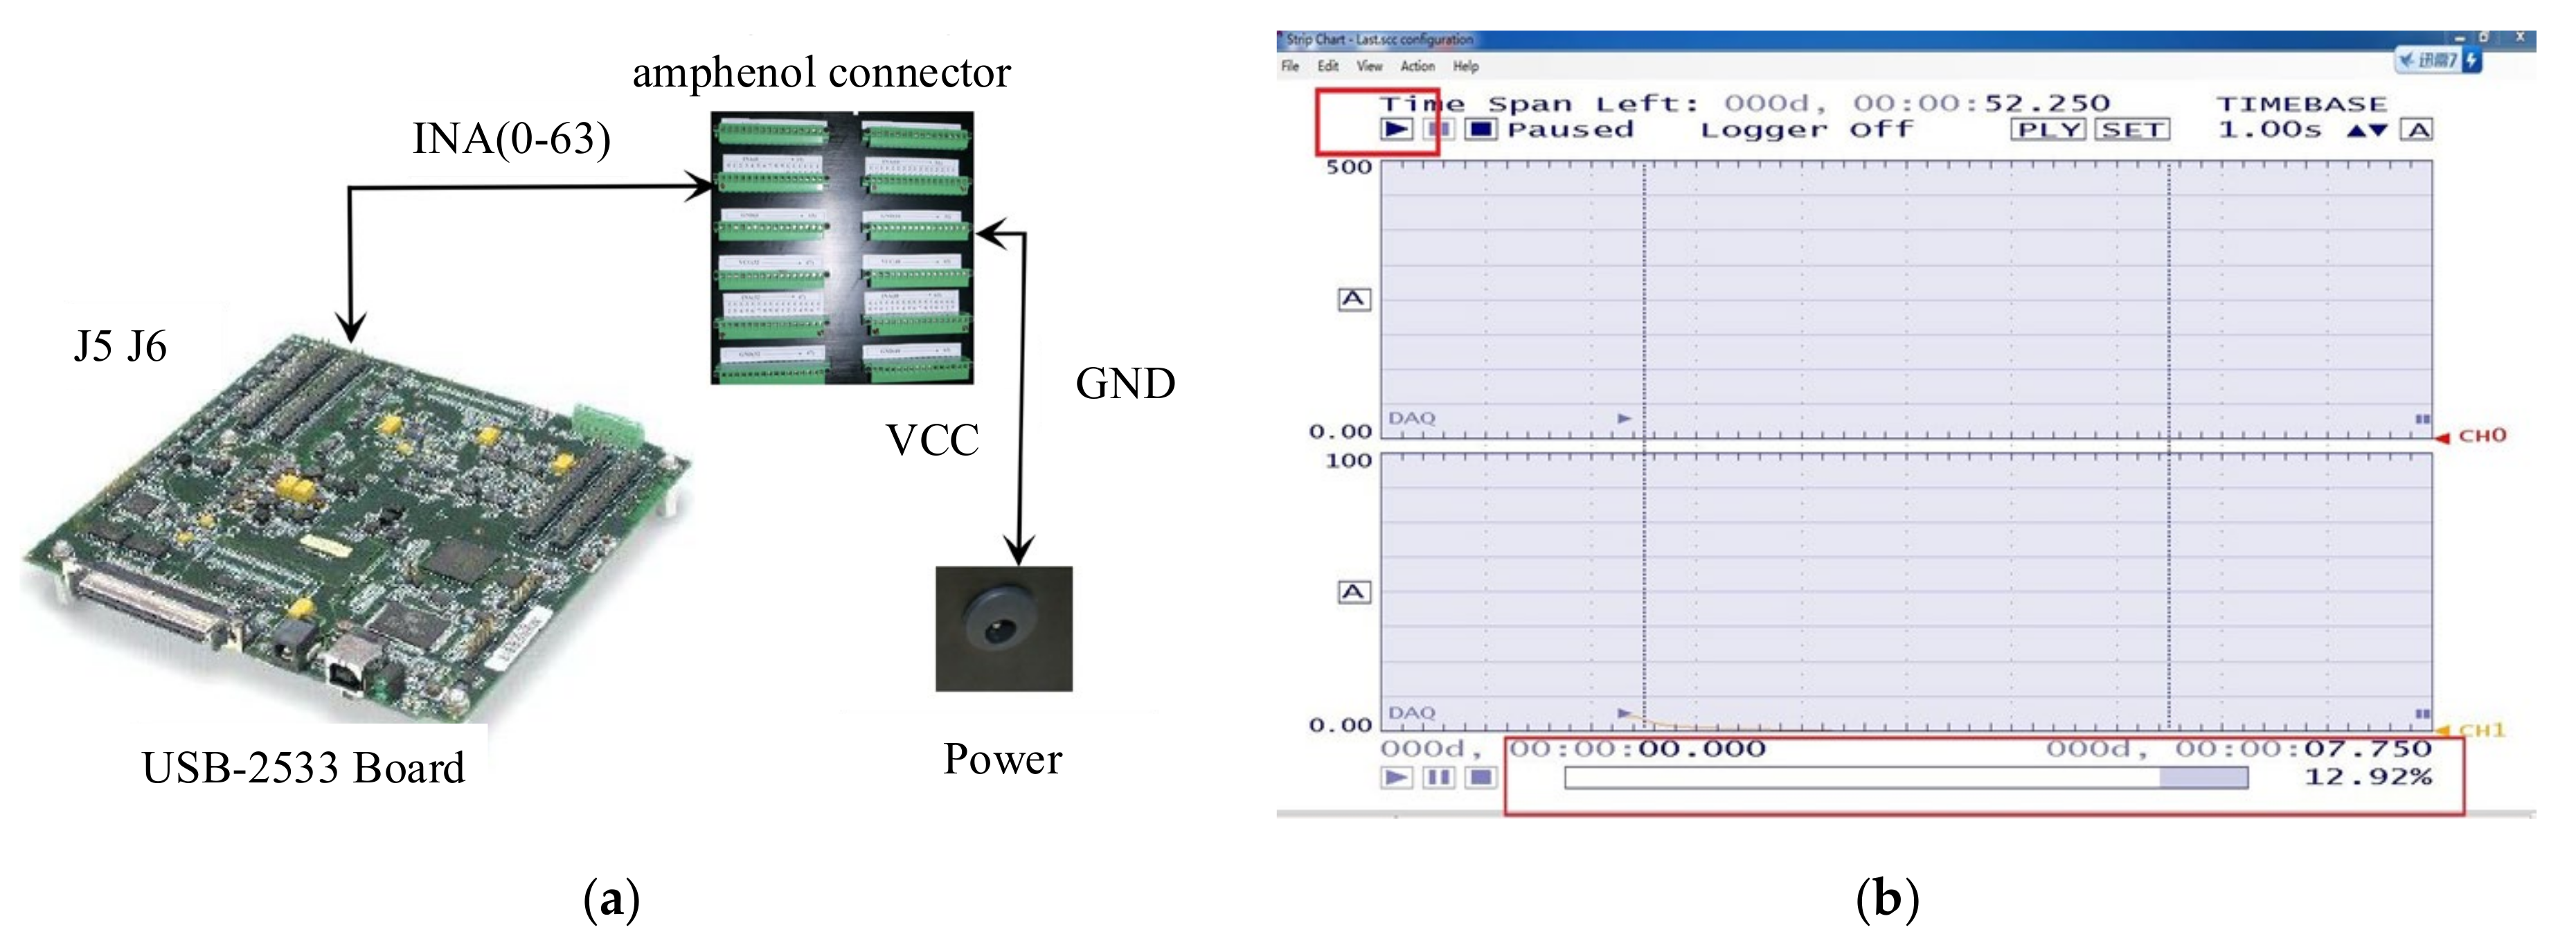
2.1. Experimental Setup

The experiments were carried out in a two-dimensional wave tank at the Key Laboratory of Ministry of Education for Coastal Disaster and Protection, Hohai University, China. The dimensions of the wave tank were 32 m in length, 0.5 m in width, and 0.9 m in depth. A piston-type unidirectional wave maker was installed at one end of the wave channel and a wave absorber was located at the other end to reduce the wave reflection. The physical model was installed close to the wave absorber to guarantee that the wave–structure interaction processes can be recorded without the impact of re-reflection waves from the wave maker. The overall experimental setup is described in Figure 3.
Froude scaling was used to infer prototype results for the physical tests because the gravitational effects were predominant over the viscosity and surface tension, maintaining the acceleration constant for the model and the prototype. Then, a geometrical similarity scale of 1:10 for the model was determined according to the dimensions of the experimental facilities and the prototypes. Accordingly, parameters such as wave height, water depth, and the dimensions of the floating pontoons scaled linearly (1/10), whereas wave period and velocities scaled as 1 / 10 . Figure 2a shows the floating pontoons installed in the wave flume and gives their dimensions in the unit of m.
The floating pontoons in experiments were made of wood and filled with foam material and metal blocks, so their weights and drafts can be adjusted conveniently. In this study, the masses of the three floating pontoons (FP1, FP2, and FP3 in Figure 3) were 18.58, 16.42, and 14.26 kg, respectively. During the experiments, the floating pontoons were restricted using a slick frame that was made up of stainless steel rods, with an assumption that the friction between the wetted surfaces of floaters and the rods can be neglected. The spacing among the floaters was approximately 1 cm due to the presence of the frame installed to guarantee the heave motion. In addition, to avoid unnecessary friction and possible collisions, a 1 cm clearance was set between each side of the floating pontoons and the flume wall, and the impact of this clearance proved to be relatively limited within a few wave periods during our experiments. Consequently, the floaters were believed to move only in heave when stimulated by the incoming waves in our tests.
For the sake of convenience, the PTO system (i.e., alternator) in Figure 1 was moved to the opposite position, that is, above the wave tank in the model tests, which made it easier for the installation of measurement equipment and avoided extra fees for waterproof, as shown in Figure 2 and Figure 3. Accordingly, hinge joints and toothed racks were set at the upper planes of floating pontoons to connect with the gear boxes and then drive the dynamos (see Figure 3b). In this manner, the meshing engagement, which converted the alternating heave motions of floaters into a rotary motion of the shaft, between the toothed rack and the axially fixed gear can be achieved. Then, the PTO damping force can act on the floating pontoons perfectly. Note that, since the main concern of this study is the hydrodynamic performance of the floating pontoons in harnessing the wave energy, the impact of the alternator in Figure 1 is simplified to the summation of the dissipative force from racks and gearboxes, including the sliding friction force, and the Ampere force from dynamos, as shown in Figure 4. By means of no-load measurement test, the mean values of the dissipative forces Td acting on the floaters FP2 and FP3 are estimated to be approximately 0.61 and 0.55 kgf, respectively. Meanwhile, the real-time voltage output of dynamos in the model was measured using a data acquisition box, as shown in Figure 5.
The cases of experiments are divided into two groups: one group is characterized with the same wave steepness, and the other one use an alternative variable, namely, wave height. All experiments were conducted for regular waves, with the still water depth h fixed at 0.6 m, while the wave period Ti ranged from 0.73 to 2.06 s. The selected wave periods correspond to full-scale wave periods from 2.31 to 6.51 s, which basically covers the dominant wave period range of the oceans near China [22]. In total, as summarized in Table 1 and Table 2, 39 cases were conducted in the experiments, with conditions that primarily encompass those under which the WEC in the integrated system is expected to be productive in the ocean. In each experimental run, the wave surface elevations in front of the floating pontoons were recorded using several capacitance-type wave gages shown in Figure 6. Four wave gages were mounted in a line in front of the float to trace the incident and reflected wave time series. The motion response of the floaters was recorded using the laser system, which was also used by Rahman et al. [23]. Discrete values at sampling frequency of 1.0 kHz of these time variations were stored in PC and used for further analysis. The zero-down crossing method was employed to determine individual waves for a wave-by-wave analysis. In addition to the laser system and wave gauge measurements, the motions of the floaters and the interaction process between water waves and structures were also recorded using a video camera. For each case in the tables, the physical test was repeated three times, and the measurements of each repeat were taken over 6–11 wave cycles before the re-reflected waves returned from the wave maker. After removing noise from the measurements, the data of the three repeated test runs were averaged for the calculation of output power and other parameters. The relative positions of pulleys, toothed racks and gears, shaft and flexible couplings were checked after each test to ensure that the junctions were connected properly.

2.2. Data Analysis

Frequency domain analysis was carried out making use of the wave time series at G2, G3, and G4. The three gages method [24] was used to separate the incident wave height Hi and reflection wave height Hr. The coefficient of reflection Kr was defined as Hr/Hi, and a sensitivity analysis of Kr was conducted using the methodology from Chang [25]. The relative error is (Rp-R)/R, Rp being the estimated reflection coefficient and R the specified reflection coefficient. In laboratory measurements, the error is generally less than 3% in accordance with the requirement of engineering practice. Then the amplitudes of water surface fluctuations at the three wave gages in front of the floaters were presumptively overestimated or underestimated by 3%. Accordingly, eight over- and underestimates were considered to investigate the accuracy of Kr in experimental measurements. The relative error was shown with respect to wave period, as seen in Figure 6. Note that, the relative error of estimated reflection coefficient was fairly small (under 6.8%), indicating a good reliability and accuracy in assessing the reflection coefficient.
Meanwhile, the incident wave power, Pwave, for a given floater width was estimated as [26]:
P wave = 1 16 ρ gH i 2 B b L i T i 1 + 4 π h L i sin h ( 4 π h L i )
where Ti is the wave period, ρ is the water density (1000 kg/m3), g is the gravitational acceleration (9.81 m/s2), Hi is the incident wave height, Bb is the width of the floater (0.48 m), Li is the wave length, and h is the undisturbed water depth.
Further, the average output power Pout can be estimated by summing the energy consumed by the dissipative force Td and the instantaneous power Pdynamo generated by dynamos, with respect to one wave period.
P out = 1 T i t t + T i P dynamo + T d × Δ z dt = 1 T i t t + T i U dynamo 2 R FP + T d × Δ z dt
where Pdynamo is the instantaneous power generated by dynamos, Td is the dissipative force from racks and gearboxes, ∆z is the vertical displacement of the floater, Udynamo is the real-time voltage output of dynamos, RFP is the dynamo load.
Then, the hydrodynamic efficiency Khydro for elementary energy extraction of the hybrid system is defined as Pout/Pwave, and the dissipation coefficient Kd is defined as the ratio between the dissipated energy and the energy of incident wave. The dimensionless coefficients are related as follows:
K r 2 + K hydro + K d = 1
Note that Kd includes the energy loss due to the viscous effects, such as the vortex generation and shedding at the edge of floating pontoons and the strong wave deformations, but not the energy absorbed by the PTO system.

3. Results and Discussion

For the present integrated system, the breakwater function must be taken into account while improving the wave energy utilization function. Thereby, there are two aspects to be considered for the developed hybrid system, namely, the wave attenuation and the wave energy extraction. In the following sections, experimental data are analyzed and discussed in time and frequency domains, and the effects of wave steepness and wave period on the hydrodynamic performance of the present device are highlighted.

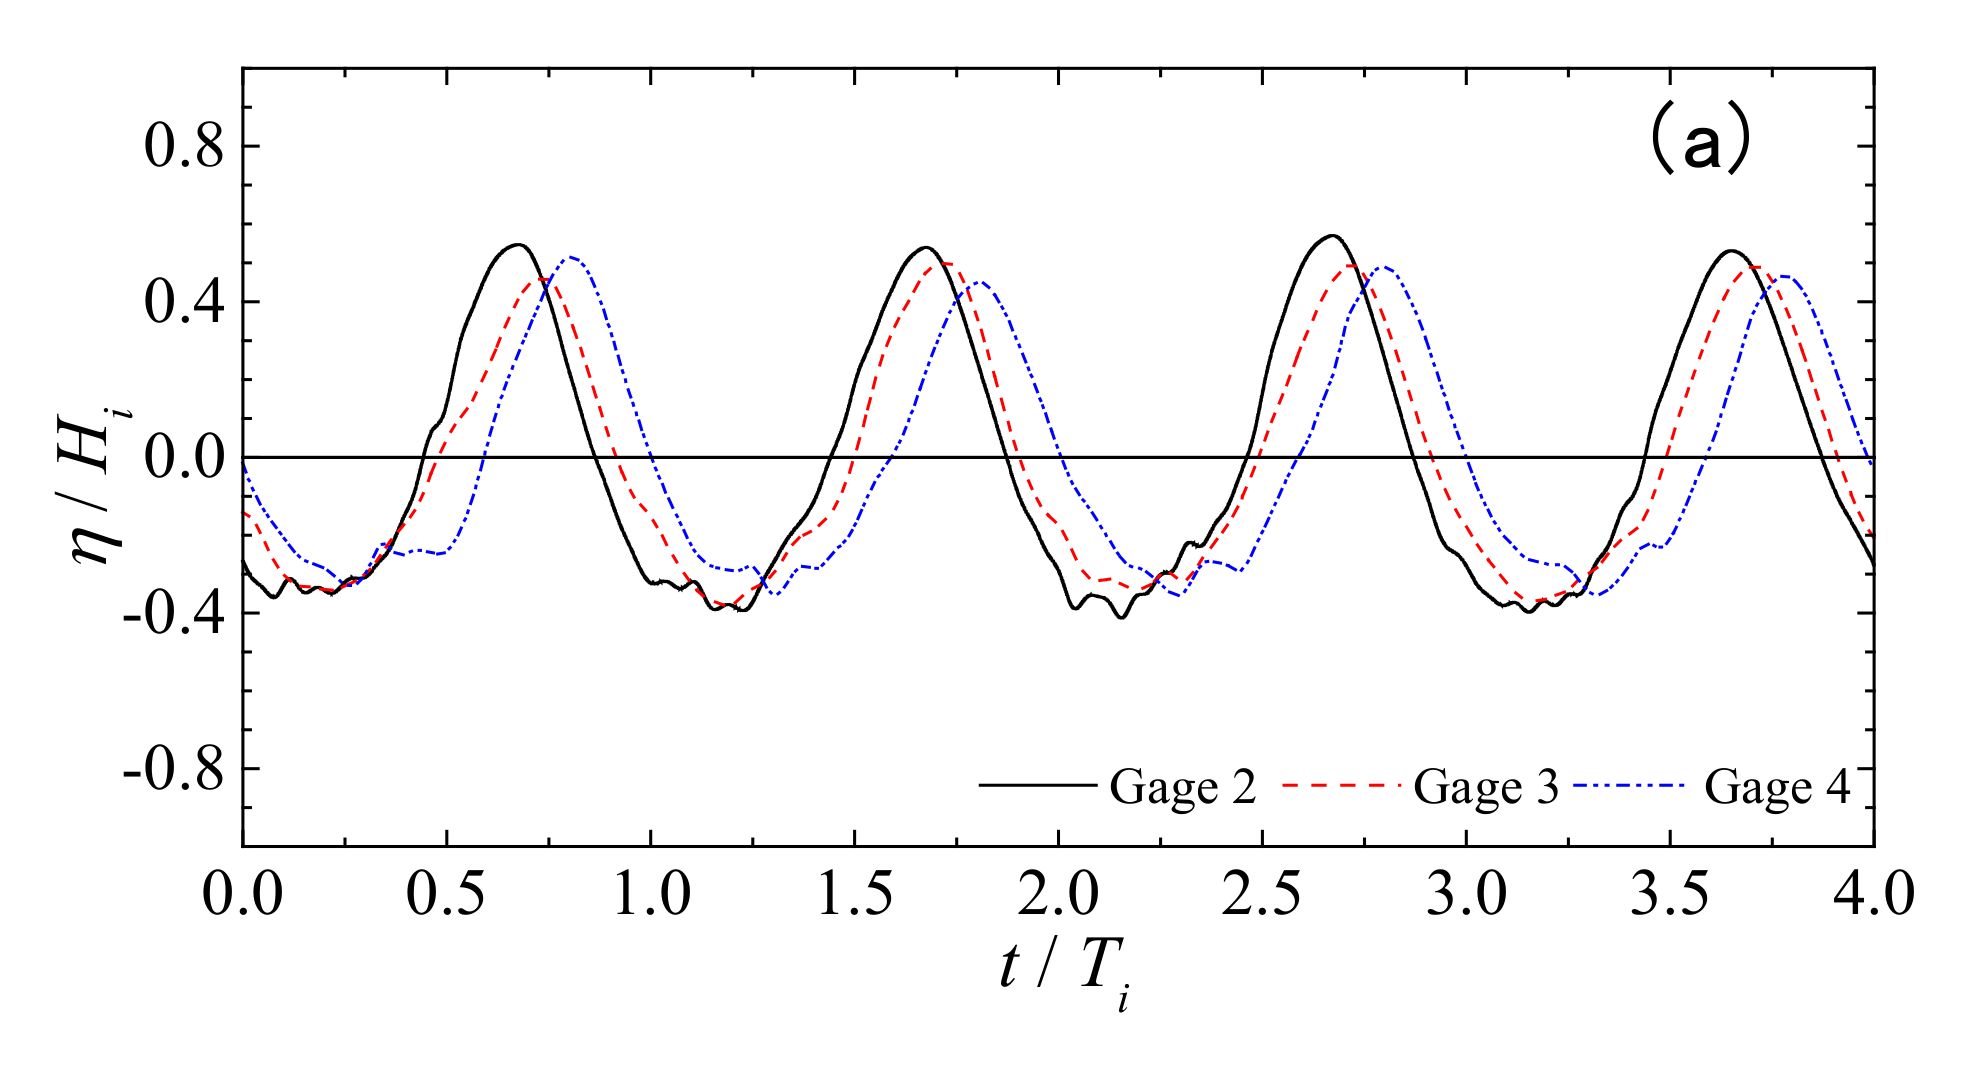
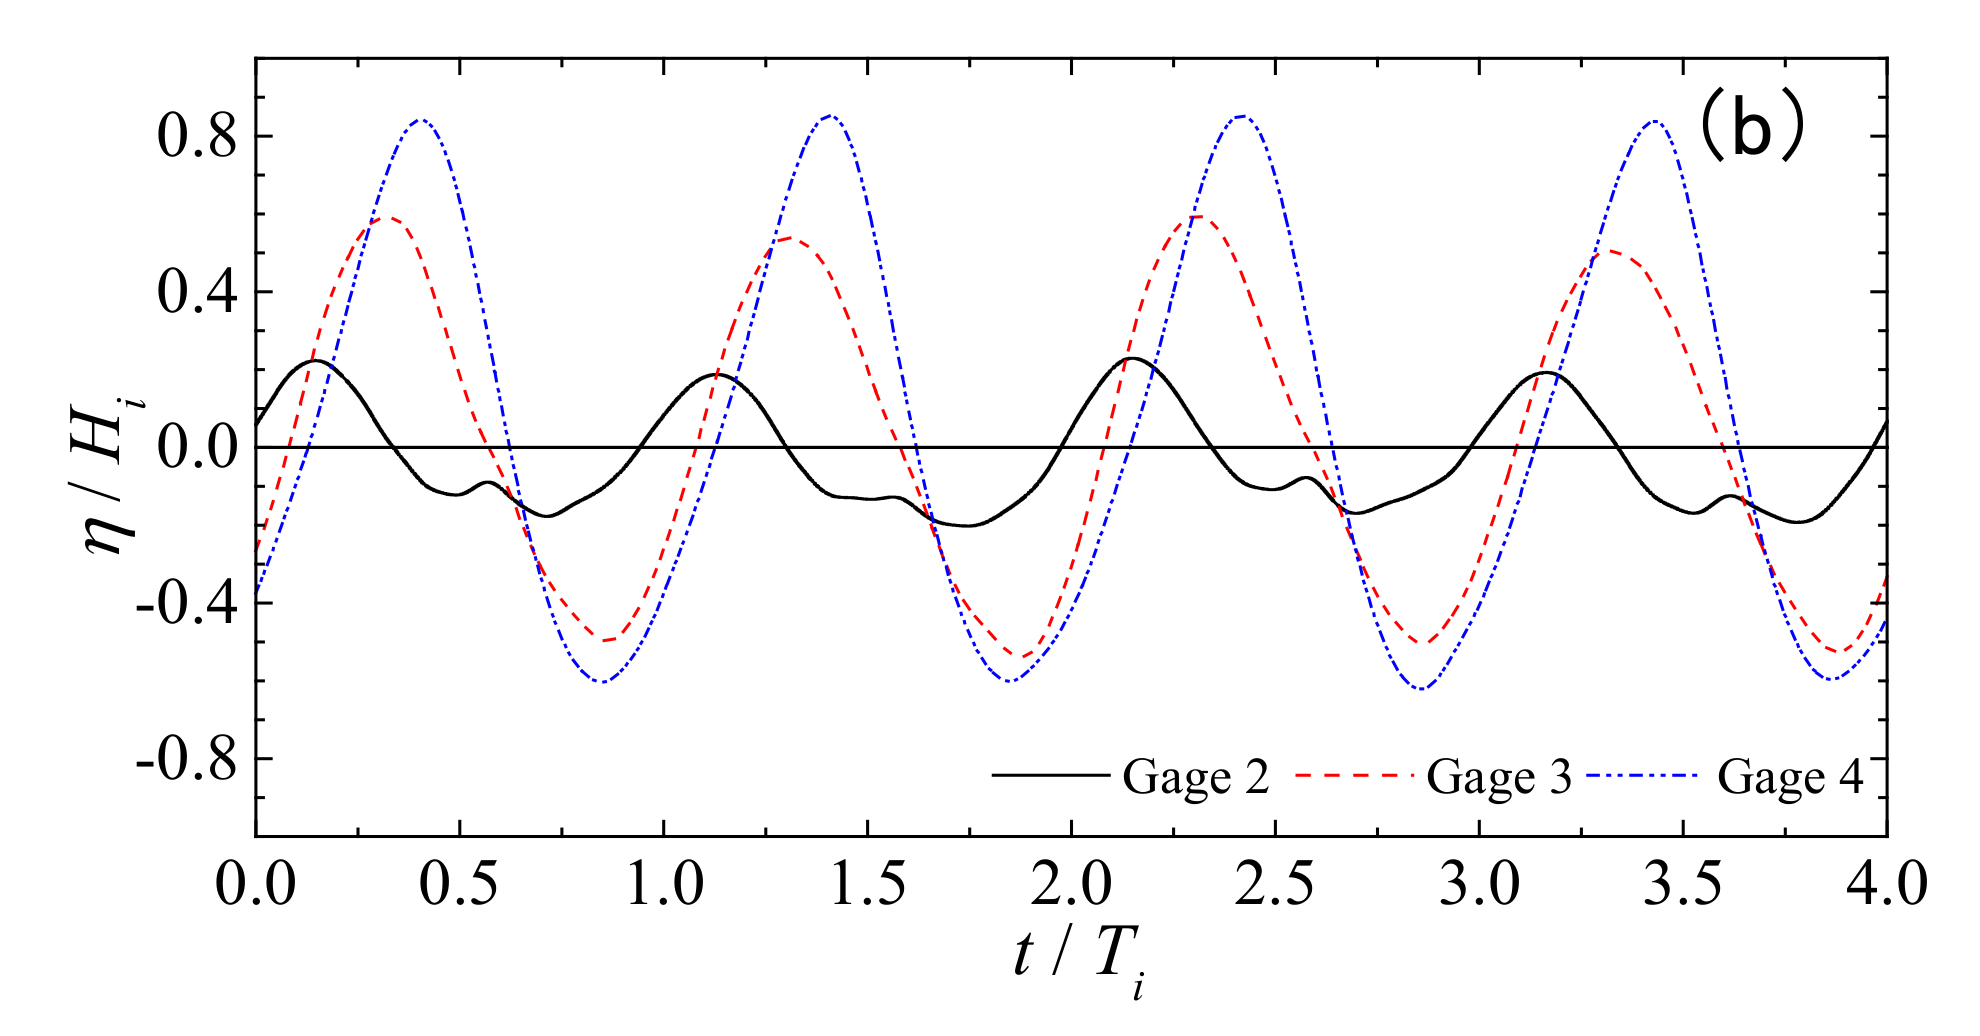
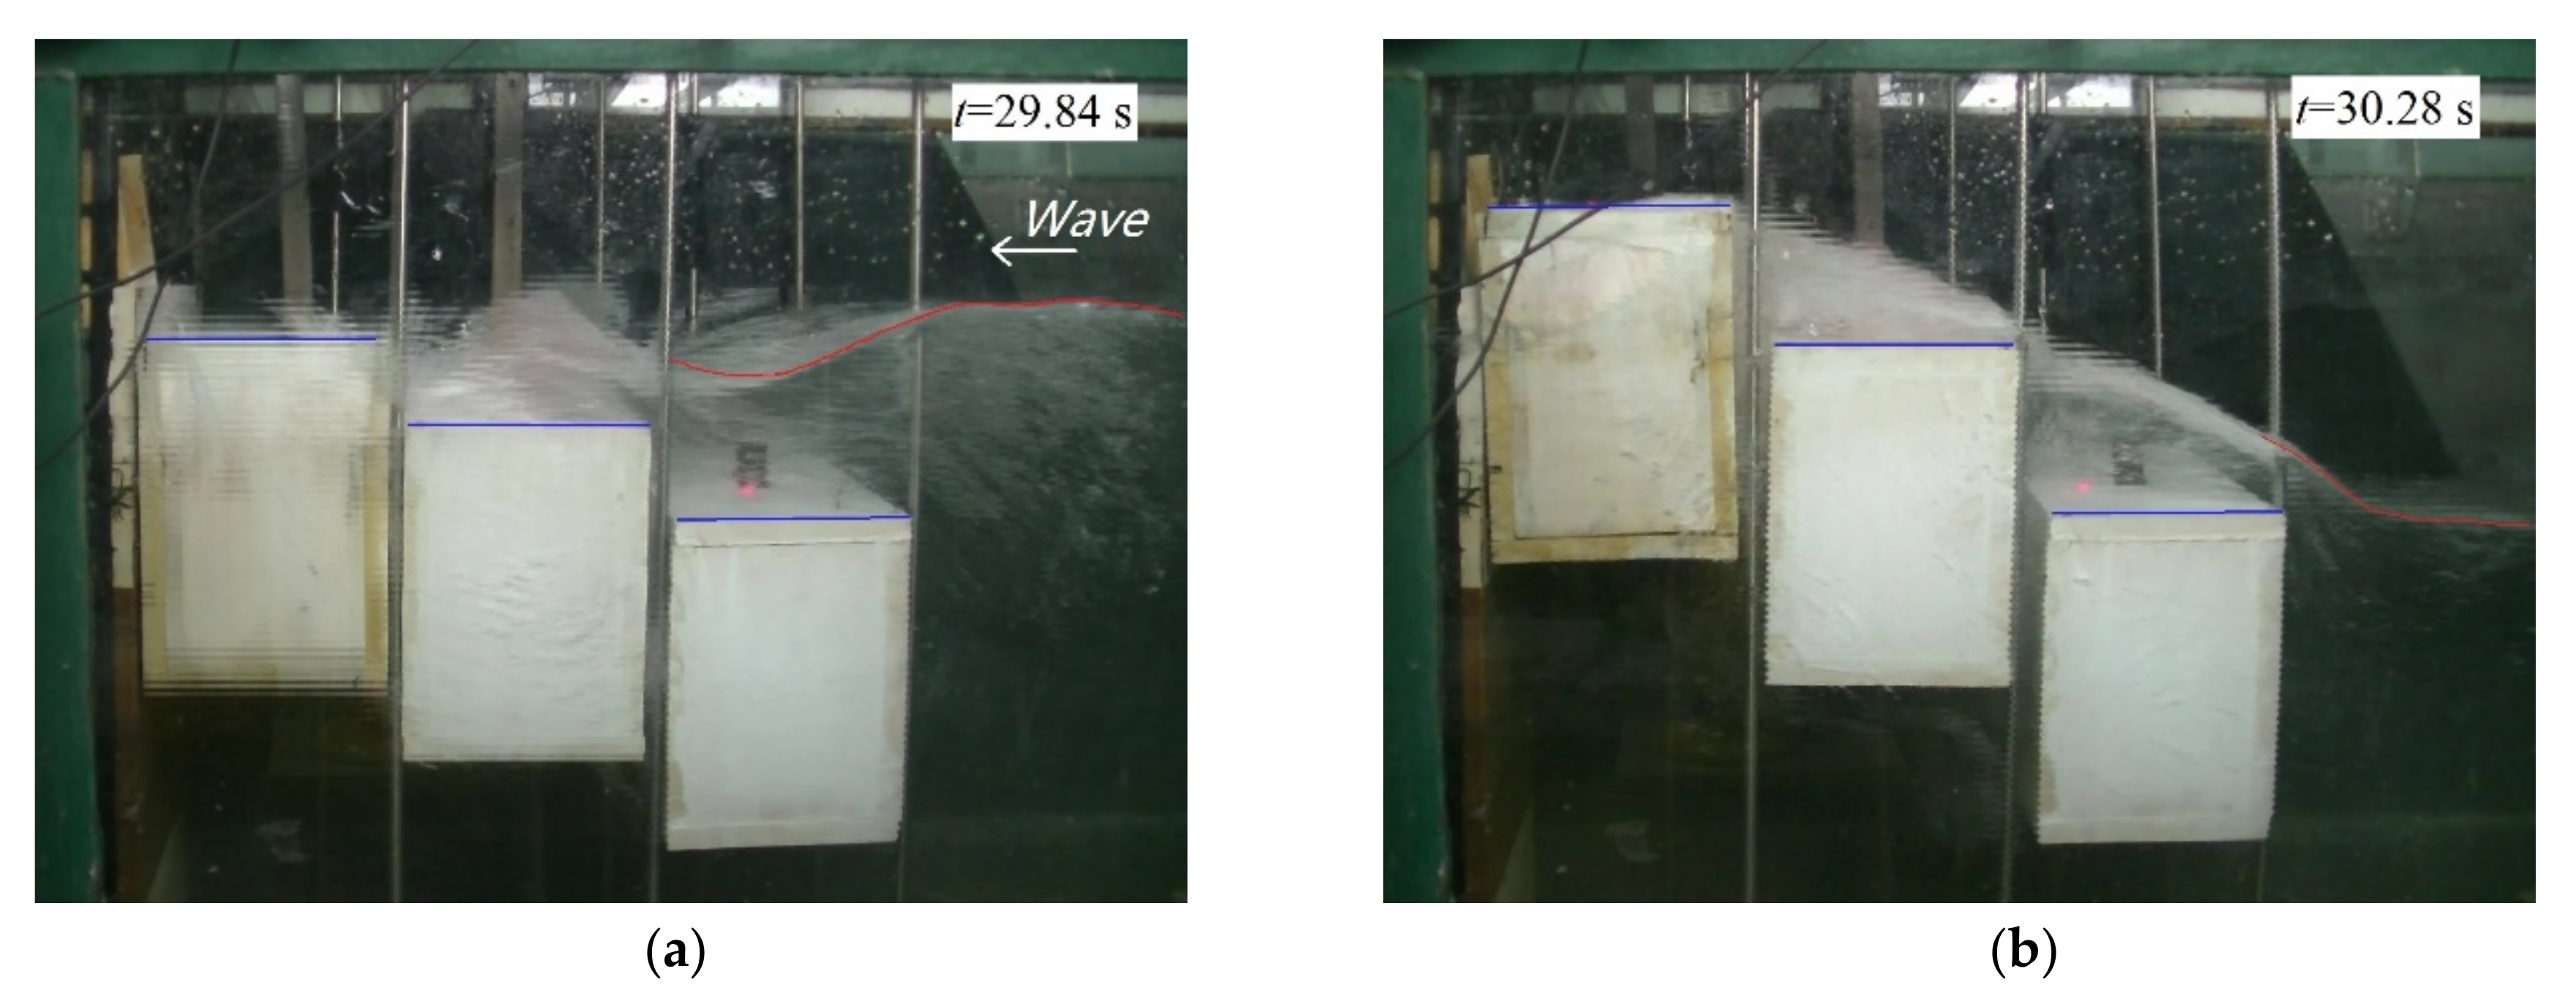
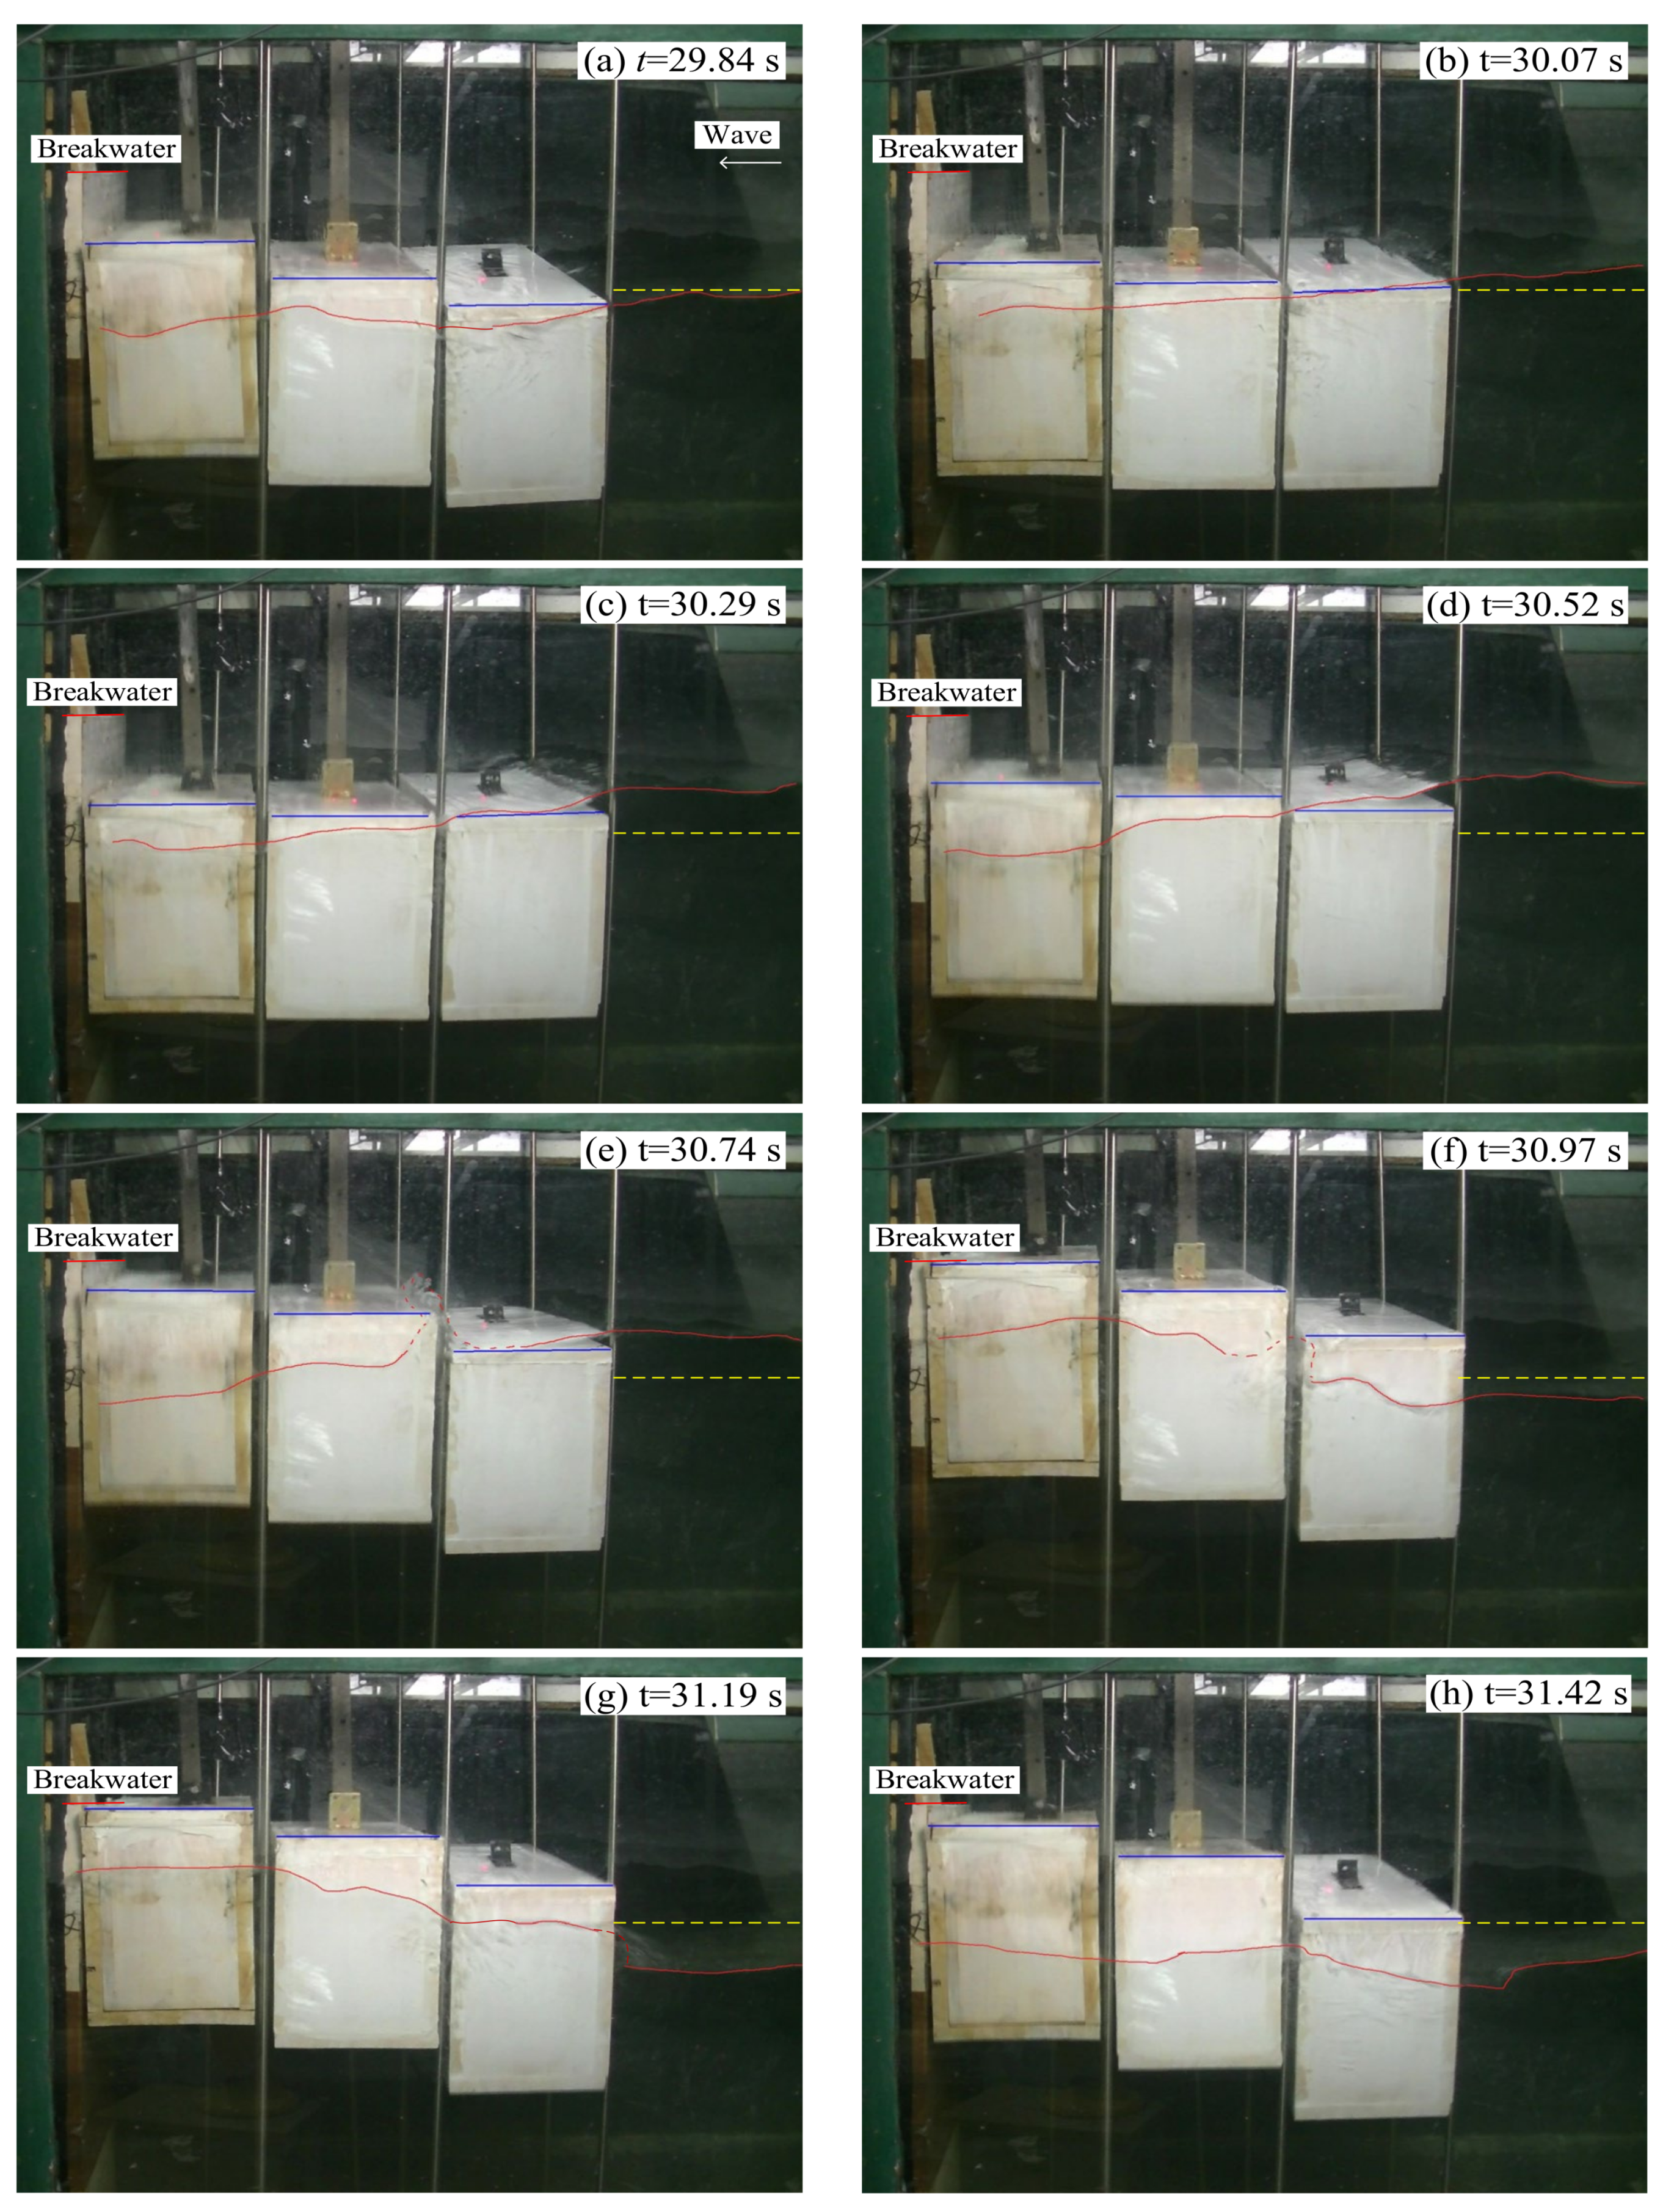
3.1. Free Water Surface

In experiments, various wave steepness and wave height values were employed for testing the physical model, as previously mentioned. When Hi/Li is equal to 0.06 or the wave height is large for shorter waves, the incident wave is nonlinear, and deformations of the water waves occur after interacting with the proposed breakwater–WEC system. By making use of the data recorded by wave gages, the fluctuations in free surface elevations upwave the floating pontoons can be compared and analyzed. Figure 7 presents the variations of free surface elevations for two cases with the same wave steepness but different wave period. For the longer wave of Ti = 1.8 s, as shown in Figure 7a, the nonlinearity of the incident wave can be recognized, and the wave is reflected moderately. The reflection coefficient is estimated to be 0.19 using the three gages method mentioned earlier. The wave amplitudes at gages 2–4 are similar with the incoming wave; whereas perturbations are found at the wave trough, which may be caused due to the strong wave deformations during the process of wave–structure interaction. The phase difference among these three time histories is observed to be diminutive since the spacing of wave gages is relatively short compared to the wavelength (Li = 3.82 m). In contrast, the wave surface profiles at gages 2–4 are considerably affected by the evolved reflected waves for the shorter wave (Ti = 1.05 s), and a standing wave may form in front of the floaters, as verified by Koutandos et al. [27]. According to the theory of standing wave, the superposition of two waves moving in opposite directions (the incident wave and reflected in this study) will strengthen the vertical movement of water at some positions (called antinodes), and cause water to have the least displacement in vertical direction at some other points (called nodes). At gage 2, the wave amplitude is attenuated because it is close to the nodes, while the wave amplitude at gage 4 is enlarged as it is near the antinodes. Moreover, the nonlinearity of the water waves is enhanced during the process of interacting with the hybrid system, and higher harmonic occurs, as can be seen in the figure. After separating the reflected wave from the incident wave, the reflection coefficient for the case in Figure 7b is calculated to be 0.64.
Due to the difficulty in directly measuring the free surface elevations above the floating pontoons, the video records of experiments were used for further analysis of wave deformations in time domain. Figure 8 shows the snapshots of the interaction between the nonlinear water wave and floaters for the same case in Figure 7a, with Ti = 1.8 s and Hi/Li = 0.06. In Figure 8a, the wave overtopping and breaking are observed since the wave is large enough to get over the top surface of floater FP1. Eventually, the overtopping water further restricts the upward motion of FP1, and the upper planes of the three floaters form a stepped plane when the wave crest arrives. To some extent, this stepped plane acts as a wave-absorbing slope for wave energy dissipation, inducing complex wave deformations and strong vortices near the corners of floaters. Consequently, in Figure 8b, the floaters FP2 and FP3 reach relatively high positions after a quarter of the period. The top surface of FP3 is even higher than that of the breakwater at t = 30.28 s, effectively reducing the wave overtopping rate across the whole hybrid system. At this time, the wave breaking results in a plurality of mixing air–fluid, as seen in the figure, and dissipates a considerable portion of the incoming wave energy. After removing the dissipated and converted energy from the incident power, we can conclude that the reflected energy only accounts for a small portion of the total energy compared to the other items. This result also coincides with the calculation of Kr = 0.19 for the case in Figure 7a and Figure 8. Conversely, for shorter waves, such as the wave in Figure 7b, the wave height is too small to cause massive wave overtopping even though the wave steepness is high (Hi/Li = 0.06). Therefore, the energy dissipation is limited at higher frequency and, accordingly, the wave reflection is prominent in these cases.

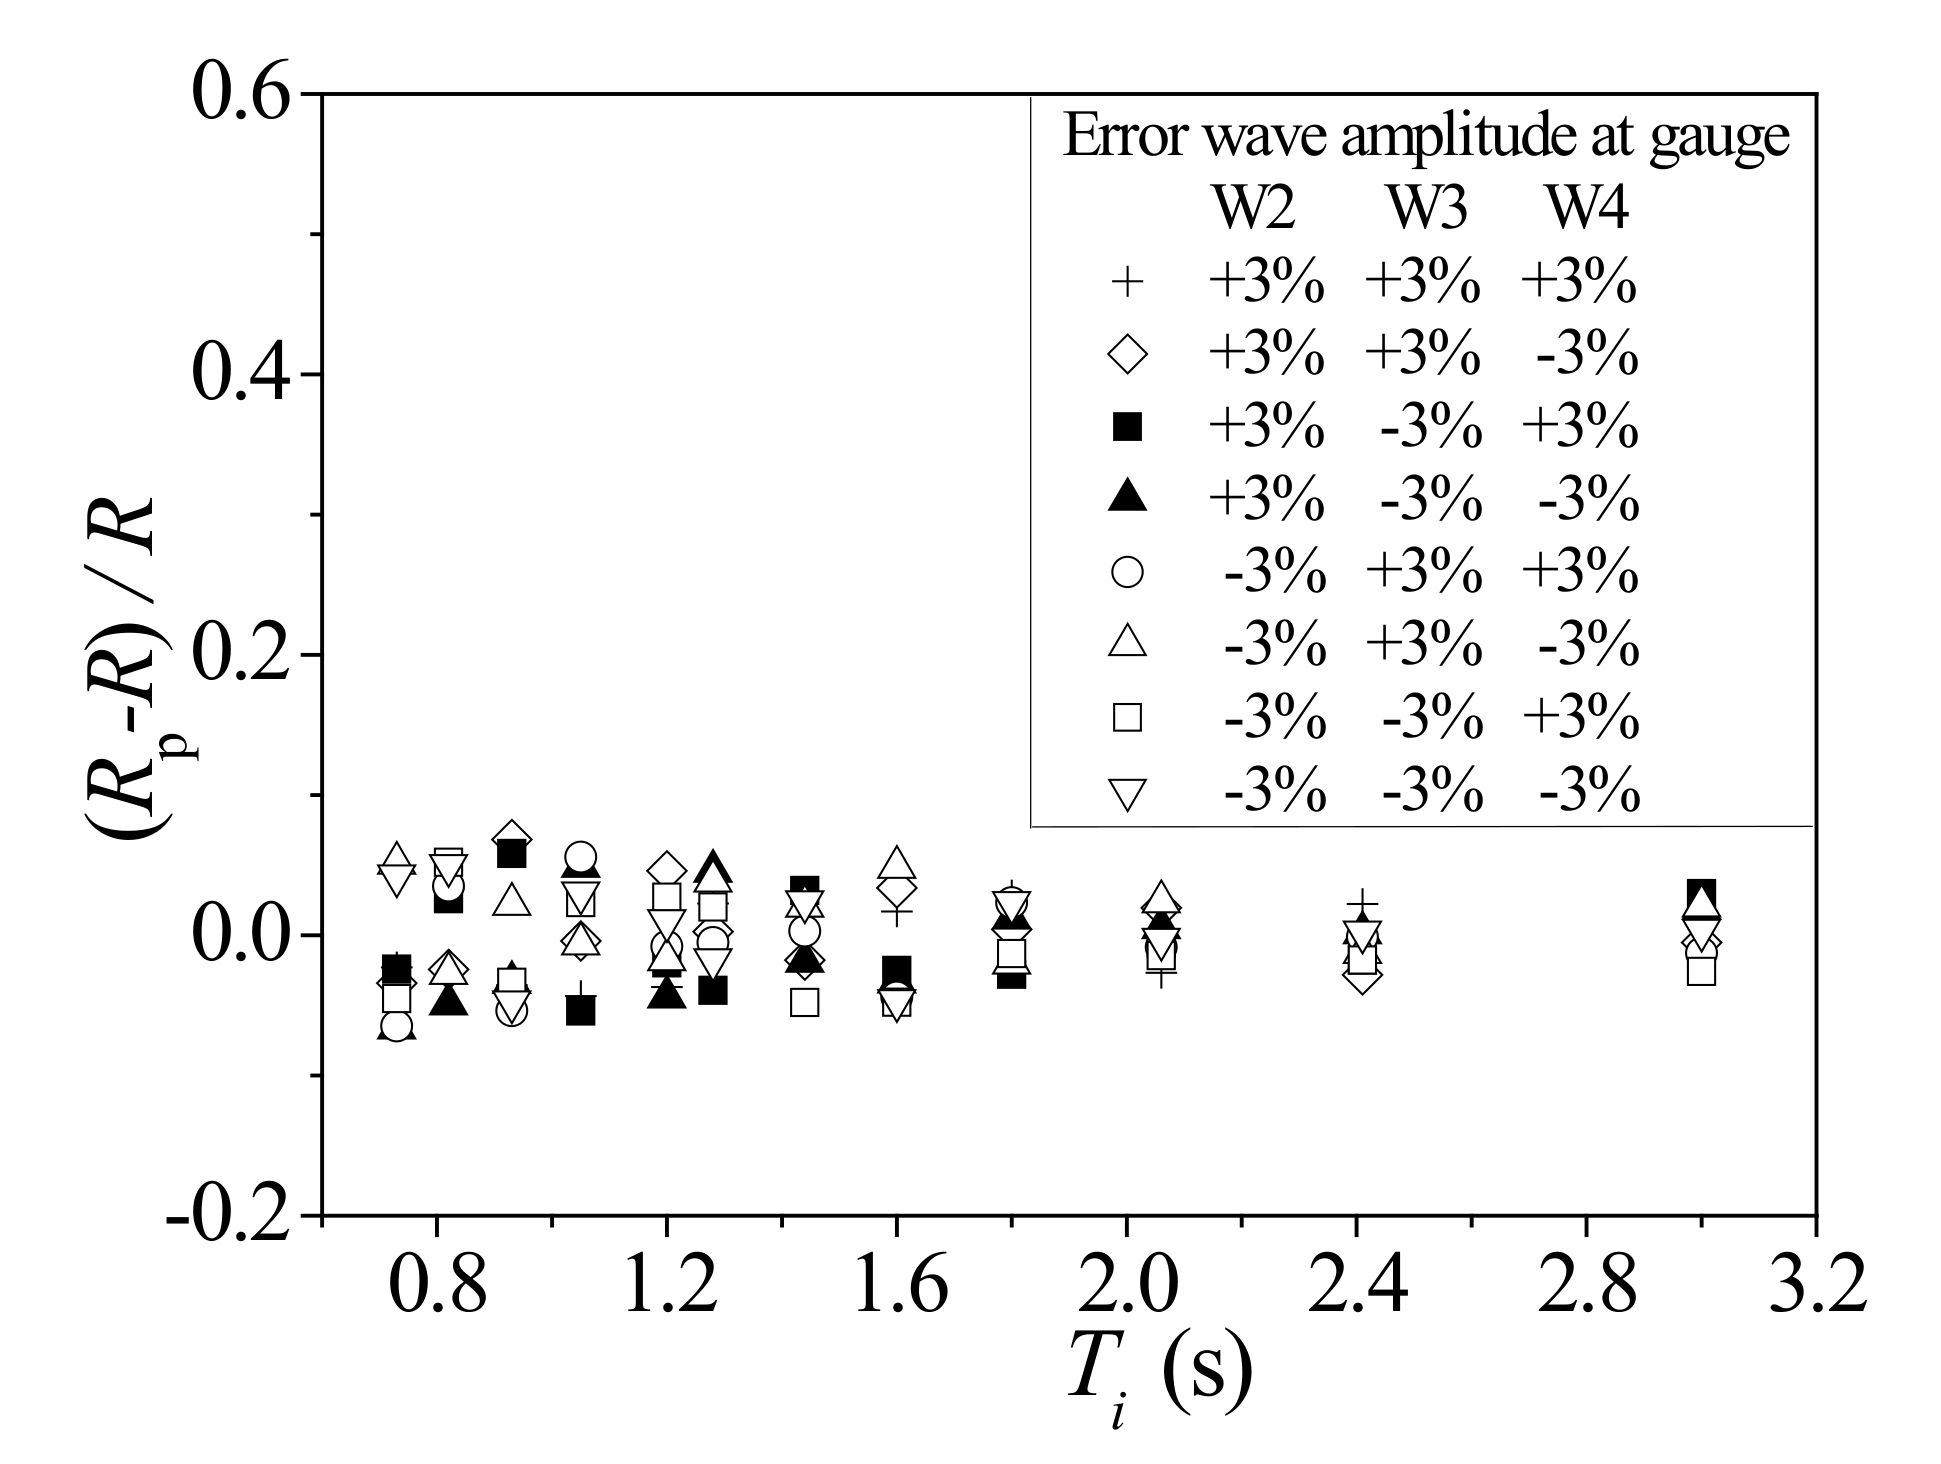
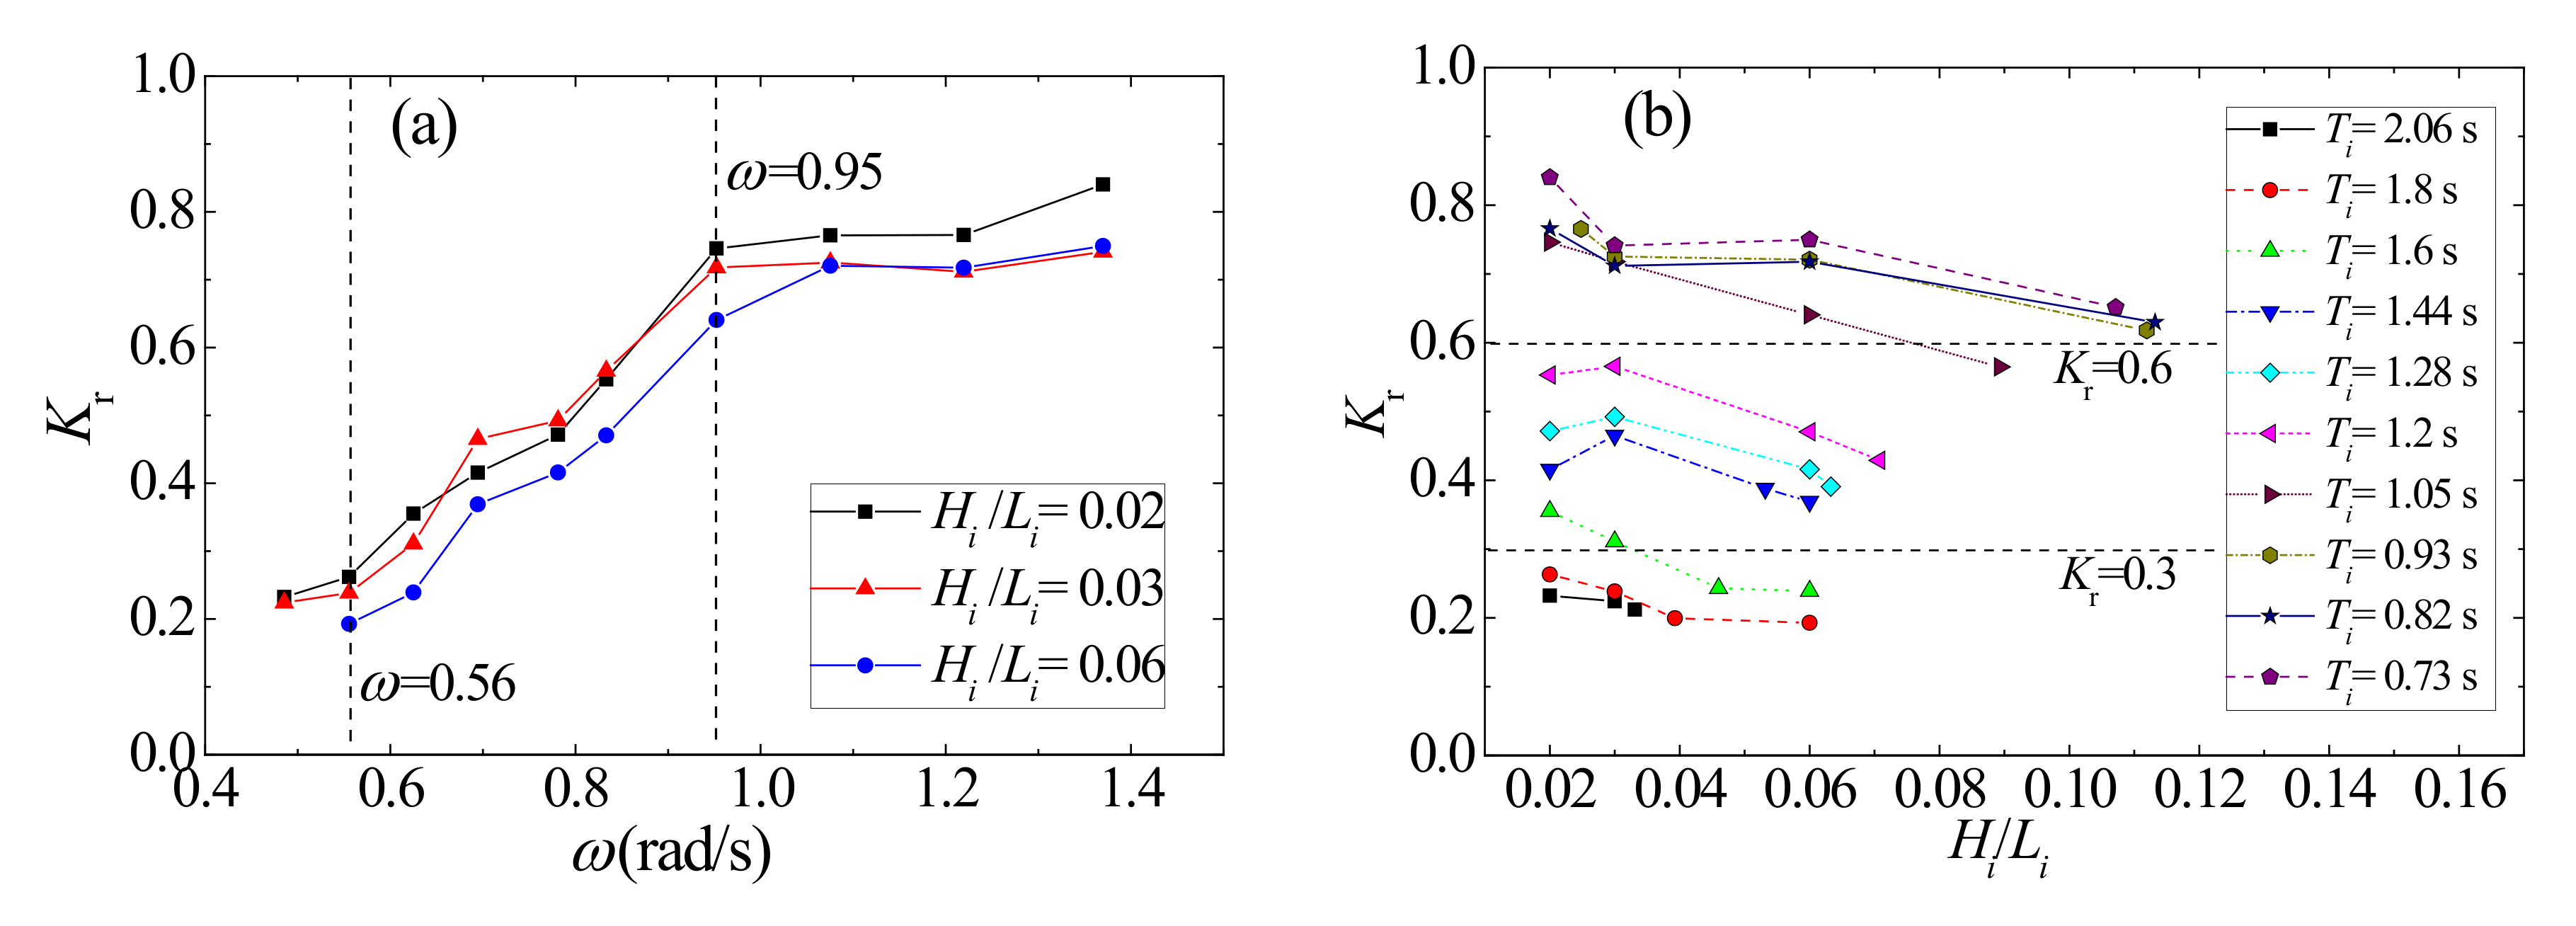
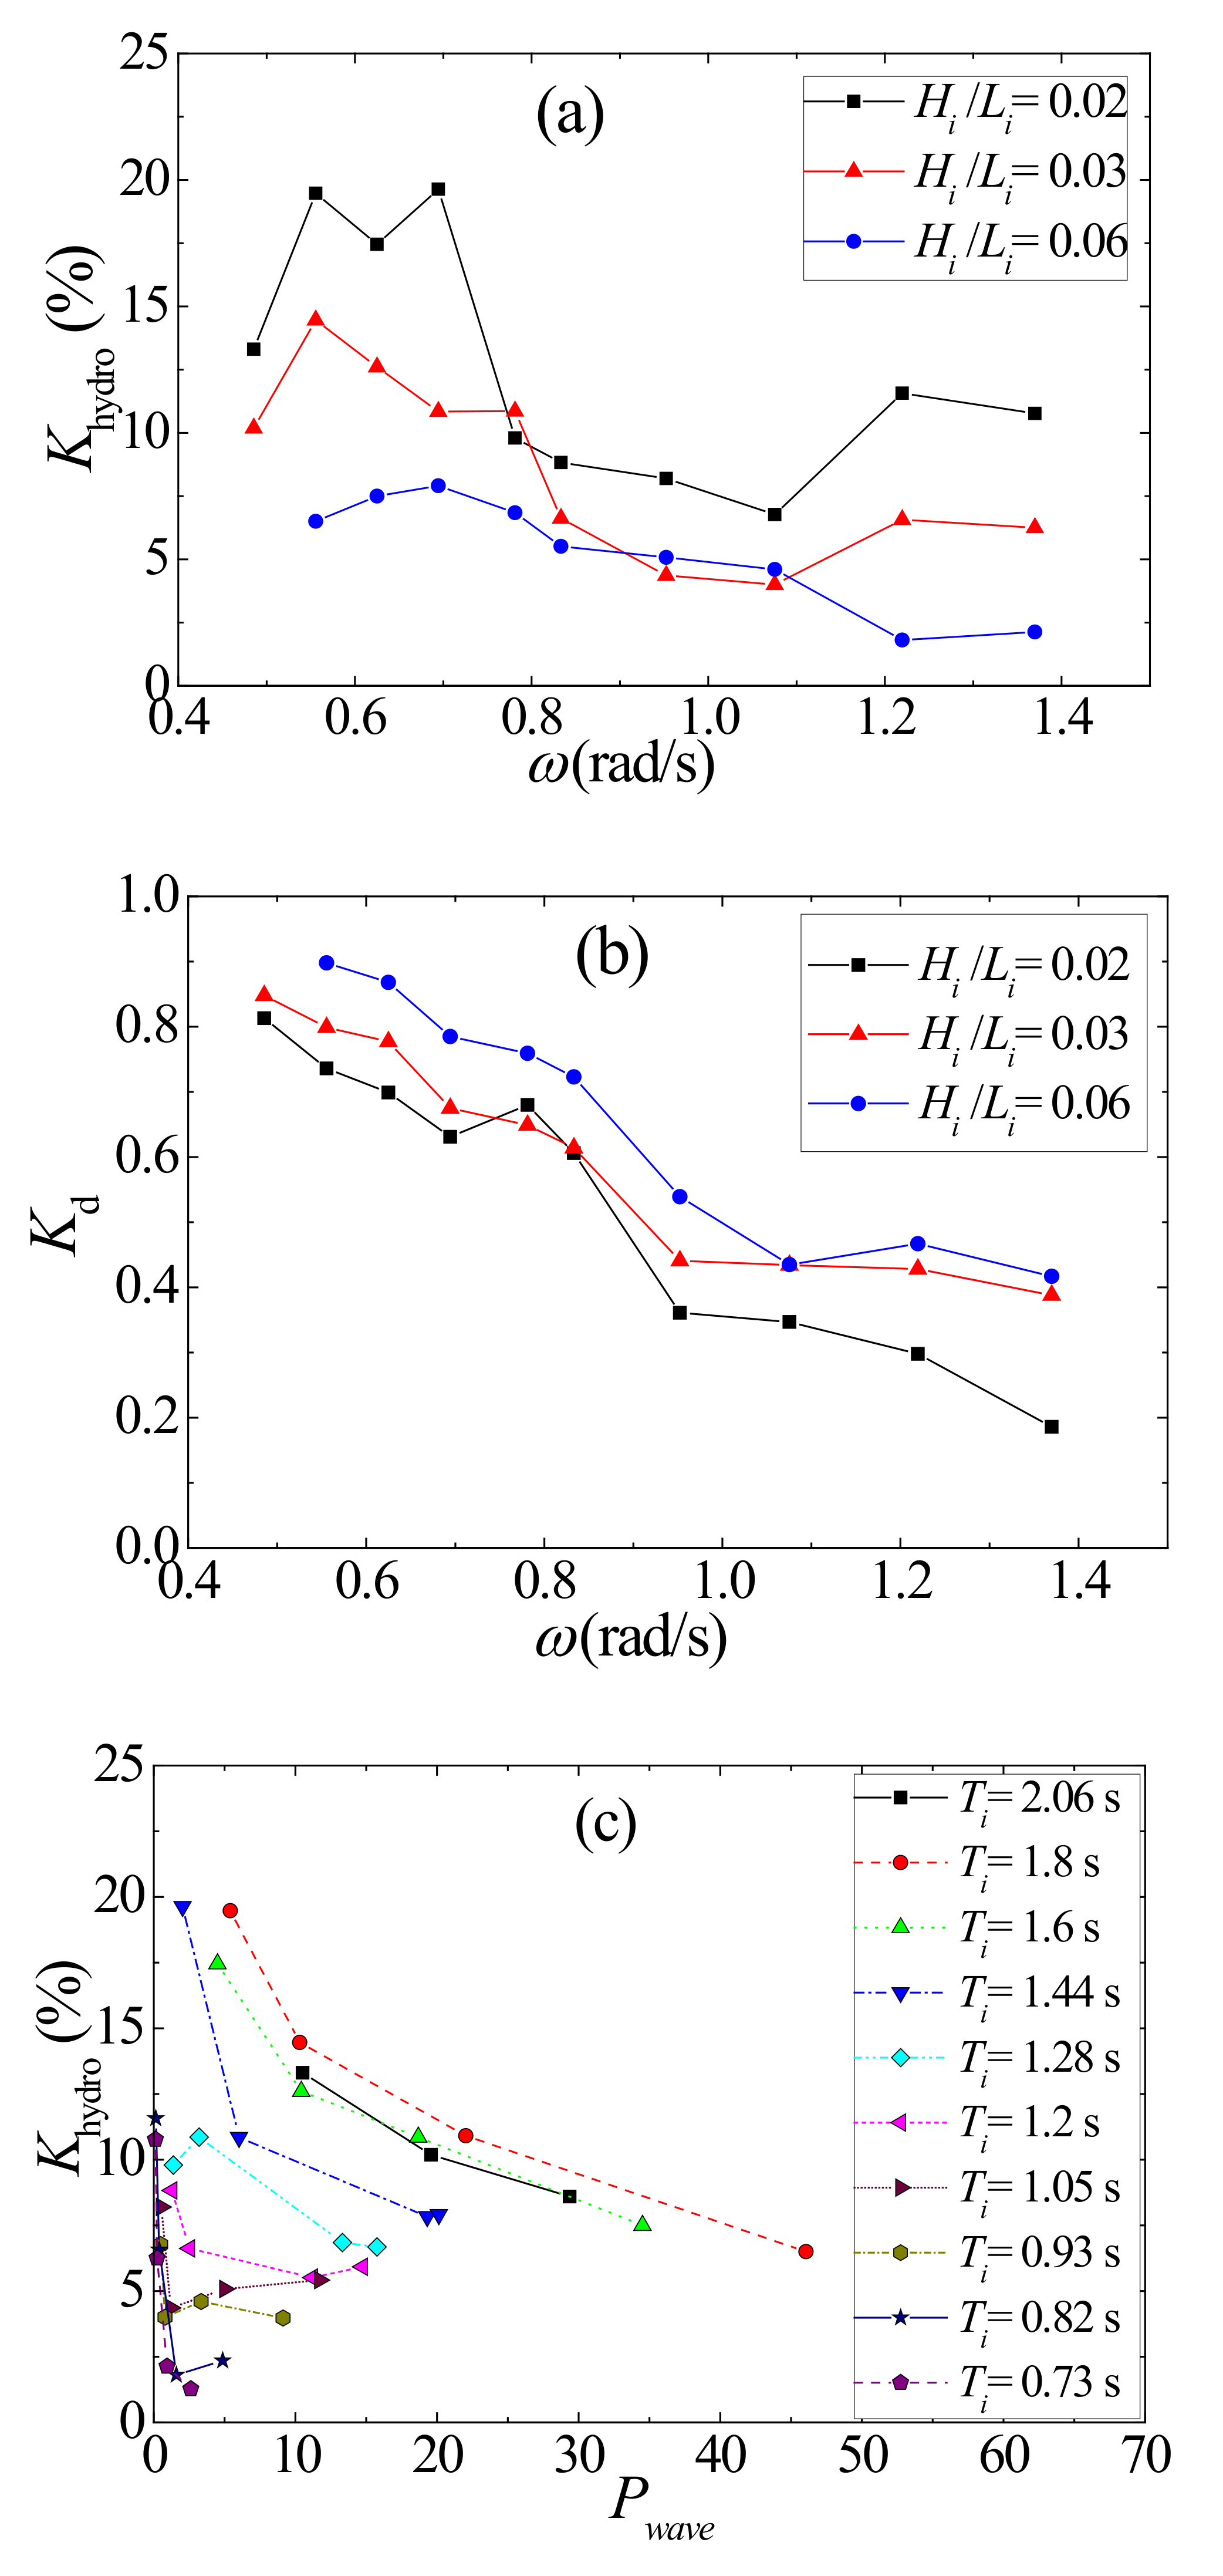
3.2. Evaluation of Wave Reflection Coefficient

The coefficient of reflection Kr for the incident wave was plotted in Figure 9 as functions of wave frequency ω and wave steepness Hi/Li, respectively. In the figure, the effects of wave steepness and wave period on wave reflection are emphasized. The understanding of wave reflection characteristics may provide information about the wave energy dissipation performance of the hybrid breakwater–WEC system. Similarly, the contribution of wave energy extraction to wave attenuation can be studied by analyzing the variations of Kr in the figure.
In Figure 9, the PTO damping and water depth are kept constant during all the tests. Figure 9a shows the results of the cases in Table 1, each line representing the tests with an invariable wave steepness. Roughly speaking, the proposed integrated system attains bigger value of the reflection coefficient with increasing wave frequency over the range of wave periods tested, though the increment is relatively small at wave frequency greater than 0.95 or lower than 0.56. Based on the work in [28], the heave exciting force acting on a 2-D floating box decreases significantly with increasing wave frequency, highly restricting the motions of the floaters, especially for the heaviest one, namely, floater FP1. Then the effect of standing waves becomes prominent in the area in front of FP1 because the relatively stationary floaters act as a wall that is very efficient in reflecting waves. Consequently, the reflection coefficient is relatively high for the present device in shorter period waves of ω ≥ 0.95. Nevertheless, the situation becomes quite different and complicated when wave frequency becomes lower than 0.95. At moderate frequencies (0.56 < ω < 0.95), the wave height is larger than that of shorter waves for the same wave steepness, causing the wave overtopping to be more likely to occur. In particular, for the present hybrid system, the nonlinear wave deformations will be further encouraged taking advantage of the stepped plane formed by the top surfaces of floaters, as discussed earlier. As the wave crest arrives at floater FP1, the wave overtopping and breaking occur simultaneously due to the drastically decreased water depth on the floater, consuming a significant fraction of the wave energy by viscous effect. This phenomenon can also be understood as a rapid shoaling process and the relevant characteristics can be observed in Figure 8. As the value of ω decreases within the range of 0.56–0.95, Kr also decreases rapidly, implying that the influence of nonlinear wave–structure interaction on wave reflection becomes more and more important. Until frequency is smaller than 0.56, the declining rate of Kr tends to slow down. The minimum value of Kr is observed to be about 0.2 for the case with a wave frequency equal to 0.56 and a wave steepness of 0.06. The average value of Kr under longer waves is 0.23 as the majority of the incoming energy is dissipated and converted by the proposed integrated device while only a small part of the wave power is reflected back to the sea.
Based on the data in Figure 9a, the results of the cases in Table 2 are added and illustrated in Figure 9b. The impact of wave steepness on wave reflection is emphasized for the waves of various wave periods. In general, a higher value of Hi /Li results in reduced reflected wave energy in most cases. According to the wave theory, the waves with higher wave steepness values are of stronger nonlinearity, so they are more likely to deform or even break during the interaction process with structures. Then, the incident wave energy is fairly dissipated by viscidity with the relatively larger wave force and stronger nonlinearity. Therefore, less energy is reflected back toward the source of the wave (e.g., out to sea, or back towards the paddle) when wave steepness is larger. From the point of view of period, the performance of the present system in reflecting waves can be generally classified into three categories according to Kr value, namely, high reflection for shorter waves, low reflection for longer waves and the moderate one for medium waves. Furthermore, the results in Figure 9 lead us to conclude that the ratio of reflected energy to the incoming wave energy is less than 30% in medium and longer waves. This feature is of great significance for practical engineering applications in the waters with specified requirement in wave height, such as the harbors facing the issue of harbor resonance. It is also noteworthy that the influence of resonance phenomenon on the variations in Kr is not evident for the developed device although the floaters oscillate under a heave motion. Normally, for a single-pontoon WEC coupled with a fixed breakwater or seawall, resonance occurs when the period of the incoming wave is similar with the nature period of the floating structure. At the moment, a large part of wave power is transformed via the oscillating floater and the reflection coefficient is the lowest within the whole range of wave period, as has been discussed by Peng et al. [10], Zhao and Ning [29], and Zhang et al. [13]. However, unlike the single-pontoon type WECs, the proposed integrated device employs three floaters rather than just one, and in particular, these floaters are distinct from each other in terms of weight, draft, and natural frequency. As a result, the interactions between the incident waves and the present device is more complex, as described earlier, with a number of factors that must be considered, such as the resonance of floaters, standing wave formation, wave overtopping, and breaking on the upper plane of floats. Especially for the longer waves that contain huge power, the performance of the developed system in decreasing wave reflection is more preferable in comparison with that of either a single FB (Kr = 0.31–0.45, in [23]) or a single-float WEC plus a breakwater (Kr = 0.46–0.63, in [11]). Therefore, this characteristic can be regarded as one of the main advantages of the developed hybrid system, offering a promising solution for the wave controlling of longer waves.

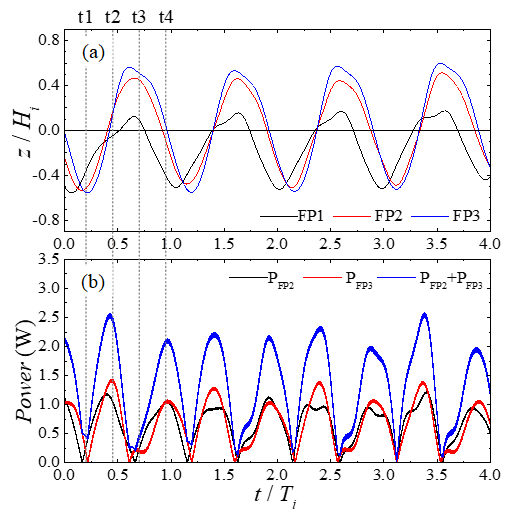
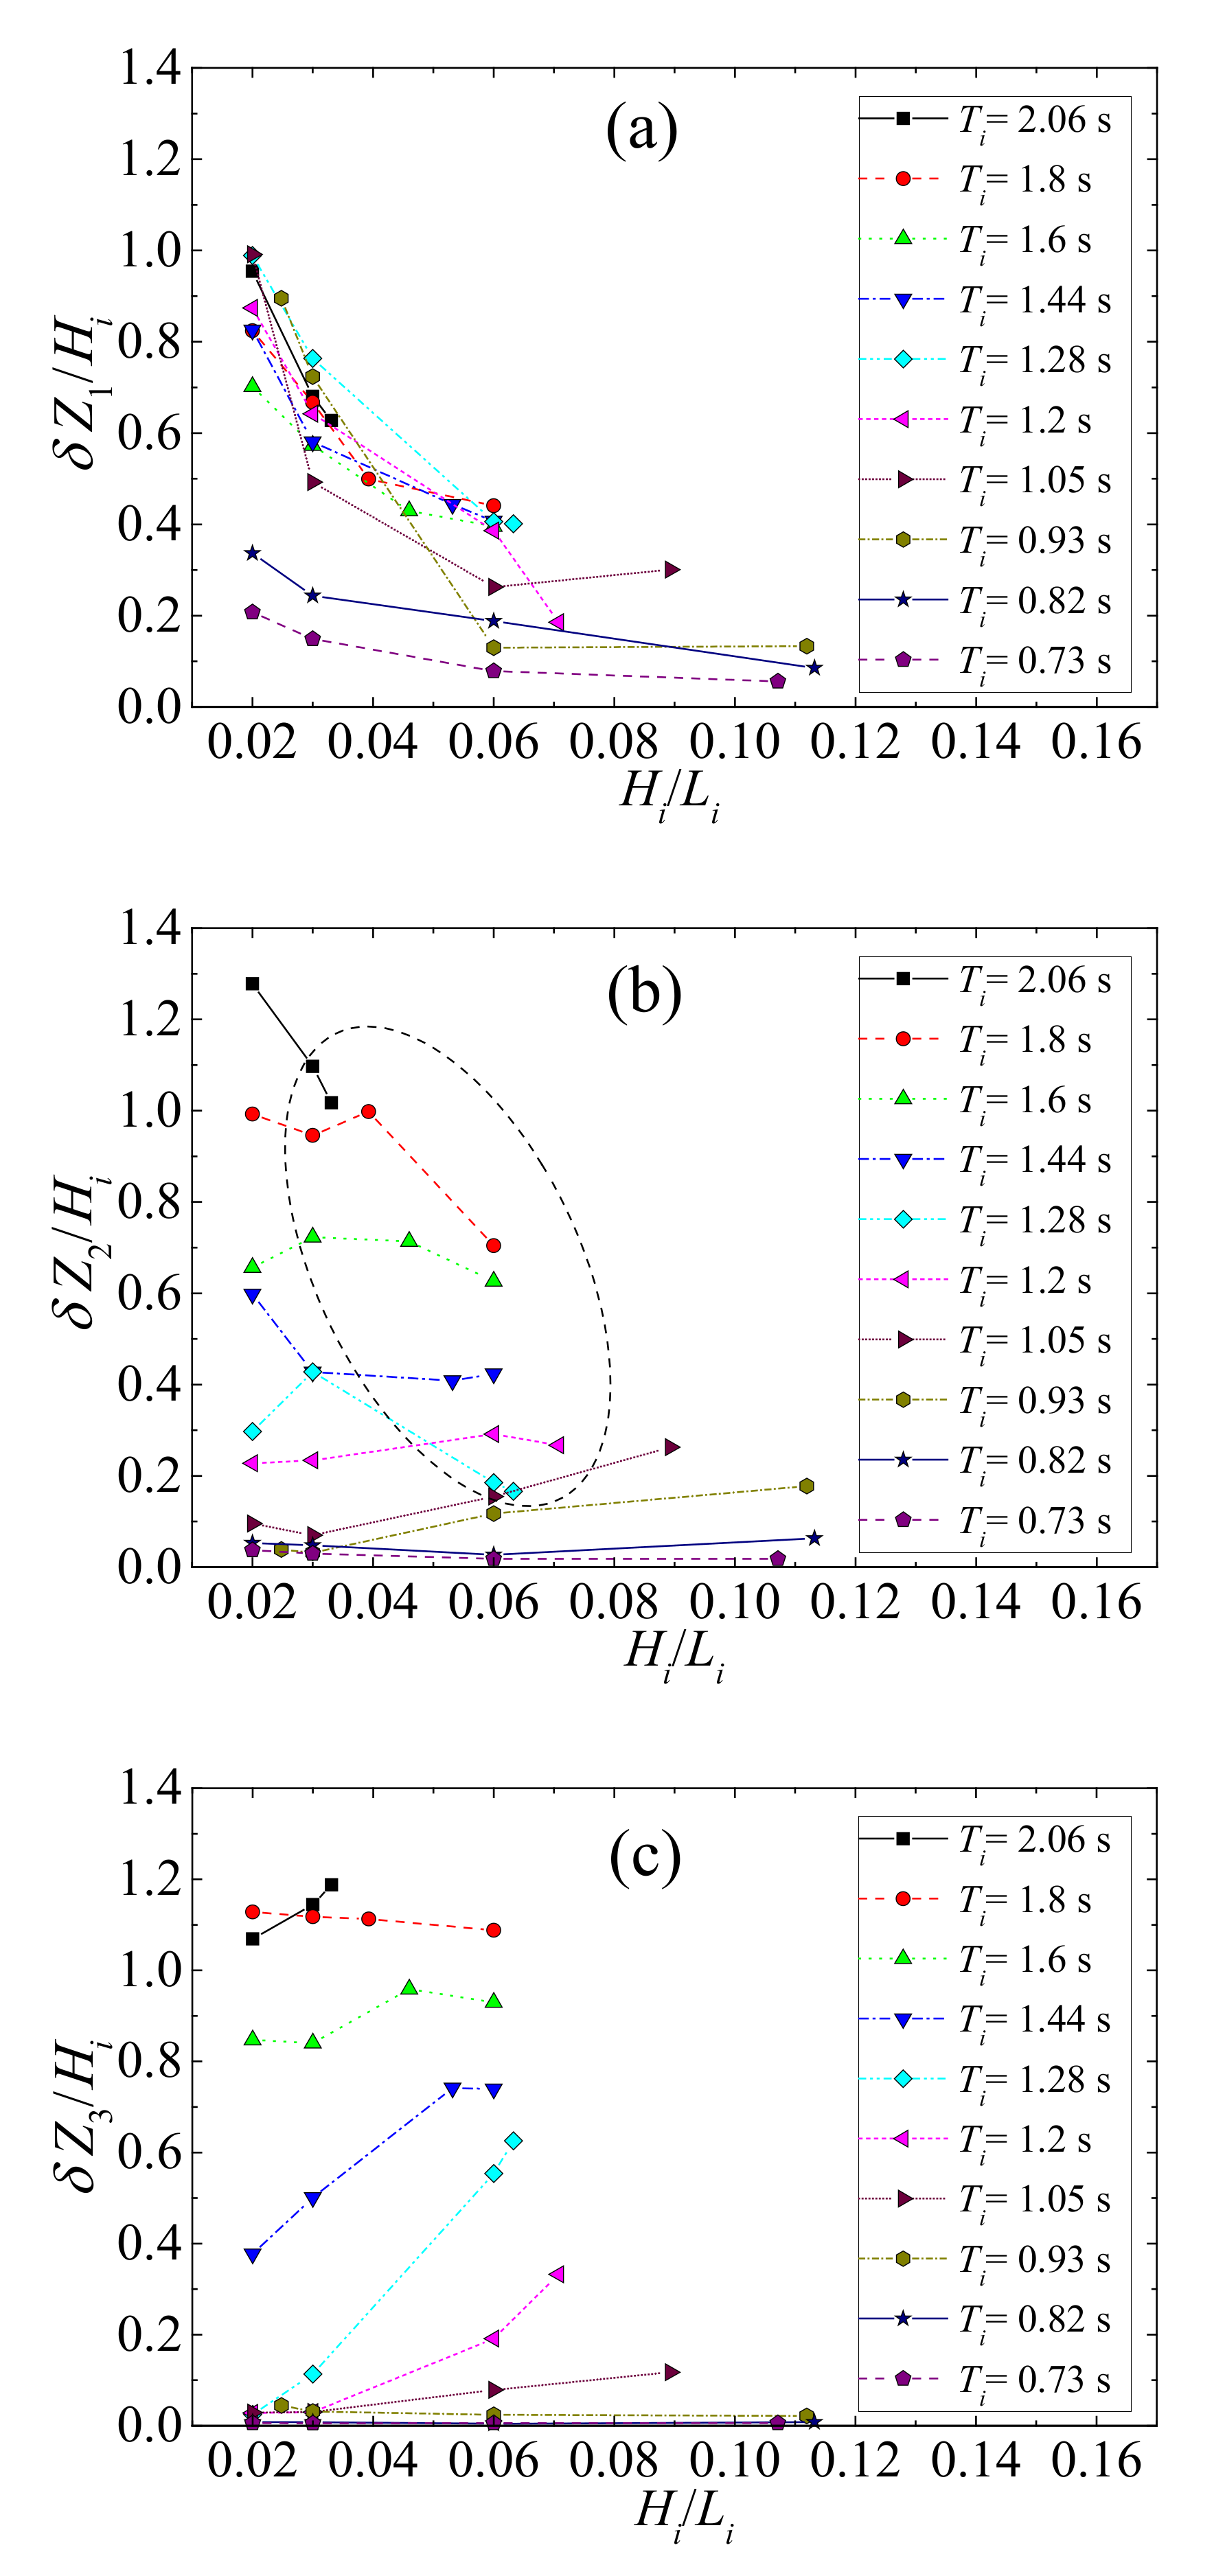
3.3. Dynamic Response of the Floaters

For the developed hybrid device, the wave power is extracted directly via the heave motion of the floaters in front of the breakwater. Thus, the dynamic response of the floaters to the varying wave forces is of great importance for wave energy conversion. Figure 10 shows the motions of the floaters and the instantaneous output power of floaters FP2 and FP3 as a function of dimensionless time for four wave cycles. The four dotted lines mark different time instants, namely, t1–t4, thus highlighting the results more clearly. In Figure 10a, the nondimensional displacements of the floaters FP1, FP2, and FP3 (see Figure 3) are depicted for the physical test with Ti = 1.08 s, Hi/Li = 0.03, and h = 0.6 m. Note that, the initial elevations of the floaters have been removed in the figure, and the presented positive value indicates a higher position than the initial one in still water, whereas the negative value means a lower position. Basically, the variations of displacements are periodic, as the external excitation force from the water waves is periodic. For floater FP1, the wave overtopping and breaking significantly affect FP1′s dynamic response, as discussed previously, causing the floater to be lower than the initial position most of the time. Moreover, a close examination reveals that there is a phase difference among the motions of floaters. More specifically, the phase of the displacement of floater FP1 is 0.1–0.2 π earlier than those of FP2 and FP3. This feature may attribute to two reasons primarily: one is the fact that floater FP1 is the first to respond when the wave approaches the hybrid device; the other is that floaters FP2 and FP3 are damped by the damping force that counteracts part of the exciting force from waves, being disadvantageous to the quick response of floaters. Based on the results in Figure 10a, the response amplitudes of various floaters can be estimated and compared. Although floater FP1 is undamped, its motion amplitude is much smaller than those of the other two floaters damped by the PTO force. On the one hand, this fact may be due to the larger weight of floater FP1 compared to the others, which makes it difficult to accelerate and decelerate quickly under wave actions; on the other hand, the aforementioned slamming force due to wave breaking acting on the top of the floater may also make a contribution. More importantly, the instantaneous output power can be measured and estimated for each floater, and the results are presented in Figure 10b. In the figure, the instantaneous power varies periodically, and the peak value of the total power is approximately 2.63 W. At t1 and t3, the celerities of the floaters are close to the minimum value; consequently, the output power values fall into a valley twice within one wave period, differing from the variations in the motions of floaters. By contrast, at t2 and t4, the floaters obtain the top speed during the reciprocating motion; as a result, two peaks in the instantaneous output power appear over one cycle, but these peaks have different values because the motion state of the floaters changes under the wave troughs and crests. Then, the average output power of the WEC can be calculated conveniently by Equation (2) making use of the data in Figure 10b, and the estimated results are described in the next section.
For a more detailed description of the process of wave–structure interaction, Figure 11 shows a series of snapshots from the video recorded during the experiments within one wave cycle, including the maximum elevation (f) and the minimum elevation (b) of the floaters. Notably, the moments from t1 to t4 in Figure 10 correspond to the phases applied in Figure 11b,d,f,g, respectively, and a yellow dotted line is added to indicate the calm water level. Analyzing the moving pattern of the floaters, along with the water surface deformations, can help to give insight on the hydrodynamic response of the floaters. According to Figure 9, the reflection coefficient for the present case is 0.24, suggesting that the reflected energy is less than 6% of the incident one; thereby, the dynamics of the floaters are mainly affected by the incoming waves rather than the waves reflected from the breakwater. In Figure 11a, it can be seen that floater FP1 arrives at the minimum position ahead of the other floaters, while the nearby water level has just returned to the initial level from a lower elevation. Then, under the action of gravity acceleration, Floaters FP2 and FP3 keep moving downwards and approach the lowest positions at t = 30.07 s, as can be seen in Figure 11b, and the difference in height among floaters decreases accordingly. At the same time, floater FP1 starts accelerating upwards undertaking the combined effect of hydrodynamic and hydrostatic pressures. However, its movement velocity is smaller than that of the nearby up-wave water surface; consequently, on the forepart of floater FP1, wave overtopping starts to form due to a higher elevation of the free surface compared to that of the floater top. As the wave front approaches the physical model, the wave overtopping further develops at t = 30.29 s, which, to some extent, deceases the acceleration of floater FP1. Meanwhile, floaters FP2 and FP3 are near their lowest locations and start to accelerate in the opposite direction. Next, in Figure 11d, as the wave crest arrives at the front wall of the model, the volume of the water on the upper plane of floater FP1 increases rapidly. Accordingly, the celerity of floater FP1 begins to decrease under the impact of wave overtopping, which can also be confirmed in Figure 10a. In addition, referring to Figure 10a and Figure 11d,f, the wave crest is observed on the top of floater FP1 at t2 (i.e., t = 30.52 s), while the floater reaches the topmost position of its vertical displacement at t3 (i.e., t = 30.97 s). Thereby, it can be concluded that floater FP1 moves vertically out of phase by approximately π/2 with the incoming wave. The out-of-phase vertical motion of the floater creates strong vortices and therefore causes more energy dissipation [27,30]. At the same time, floaters FP2 and FP3 continue travelling upwards and their elevations become higher than that of floater FP1. Gradually, at t = 30.74 s, a stepped wave absorbing slope is formulated by the upper planes of the three floaters, with the discrepancy in their elevations being enlarged. More remarkably, the overtopping wave is seen to break on the top of floater FP1, as shown in Figure 11e, with a red dotted line indicating the area of the mixing of water and air. As the floaters rise to their maximum positions at t = 30.97 s, their movement speeds are at a minimum, near the stationary state, whereas the gradient of the stepped slope becomes the largest. In the meantime, the free water surface at the offshore side crosses the origin again and obtains a relatively high velocity toward the seabed. As a consequence, the floaters start to move in the reverse direction owing to the descending wave forces, and the disparity among their elevations becomes smaller from Figure 11g–h. At t = 31.42 s, the moving speeds of floaters are close to the peak values in the downward direction, and the water surface elevation at floater FP1 decreases to a valley value. Additionally, it is also noteworthy that, in the last two snapshots, a backward flow is observed at the offshore side of the device, which may be caused due to the water blocked by the floater FP2.
The nondimensional response amplitudes of the floaters are shown in Figure 12 as functions of the wave steepness for various wave periods. The kinematical characteristics of these floating pontoons are different from each other due to the varying locations, weights, and drafts, as discussed previously. In general, the variation trend of response amplitude for floater FP1 is distinct from those for floaters FP2 and FP3. When subjected to shorter waves (Ti < 1.05 s) or medium waves (1.05 s ≤ Ti < 1.6 s) at a lower wave steepness, floater FP1 oscillates in a larger heave motion than the rear two floaters. However, as wave period or wave steepness increases, the dimensionless responses of floaters FP2 and FP3 become stronger than that of the front pontoon, under the influence of a large wave height. In Figure 12a, the value of the response amplitude can be up to approximately 1.0 for the medium and longer waves at the smallest wave steepness. Once wave overtopping occurs on the top of floater FP1 at large wave heights, the motion of the floater will be significantly limited, as seen in Figure 10, and the amplitude will decrease dramatically. In contrast, for floaters FP2 and FP3, the external wave force is too small to overcome the damping force from the PTO system in shorter waves; therefore, the response amplitudes are less than 0.1. As the period of incoming wave increases, the motions of floaters FP2 and FP3 are stimulated and eventually, their amplitudes exceed that of floater FP1 in longer waves. One reason for this fact is that floaters FP2 and FP3 are lighter than floater FP1, implying a quick acceleration under wave actions; another reason is that, according to the standing wave theory, the rear two floaters are closer to the antinode at the breakwater where the amplitude of water surface is the maximum. It is also noted that, even for the floater in the middle (that is, floater FP2 in this study), the motion can be affected considerably if the wave height is large enough to induce an impact force on it, such as in the cases circled in Figure 12b. Therefore, it is crucial to investigate the effect of the elevations of floaters on their dynamic response for the developed hybrid system, and this will be an important topic for further research in the future.

4. Wave Energy Conversion

The average output power of the present system can be estimated by Equation (2) using the data in Figure 10b. In the calculation, the average output powers of floating pontoons FP1 and FP2 are added up to get an overall power Pout. In Figure 13a,b, the experimental results of Pout are shown as functions of wave frequency and incident wave power, respectively, while water depth and PTO damping are kept constant. Generally, the value of Pout is higher when the incoming wave power is high (with a large period or high wave steepness), as shown in Figure 13a. The highest average output power is approximately 3.0 W, with a Ti of 1.8 s and a Hi /Li of 0.06. In Figure 13b, all the cases in Table 1 and Table 2 are included, with the same maximum value of Pout (3.0 W) for the incoming wave energy of 46.1 W. Roughly speaking, the average output power is proportional to the incident wave energy at all the wave periods. Meanwhile, it is interesting to note that, for the same level of incident wave power, a larger wave period does not always indicate a higher output power. For instance, the energy converted by the developed hybrid system with Ti = 2.06 s is lower than that at Ti = 1.8 s, as is evident in the figure. This characteristic reminds us of the importance of considering the joint distribution of Hi and Ti for the design of the hybrid device, even though the wave energy density is given.
Though the average output power of the WEC in the hybrid system is described in Figure 13, another important indicator, namely, the hydrodynamic efficiency Khydro for wave energy conversion, must be discussed, especially when assessing the applicability of the present device in real seas [31]. The variation of the hydrodynamic efficiency calculated by Khydro = Pout/Pwave is depicted in Figure 14. Similar to the results of output power, the values in Figure 14 are also the sum of the powers produced by two floating pontoons, evaluating the wave energy device as a whole. Meanwhile, the dissipation coefficient Kd is estimated by Equation (3) making use of the values in Figure 8a and Figure 14a, and the results are illustrated in Figure 14b to aid the understanding of wave energy transmission. First, the effects of wave period and wave steepness on Khydro and Kd are highlighted for various wave conditions. For shorter waves with (ω > 1.1) at a lower wave steepness (0.02 or 0.03), the hydrodynamic efficiency of the system is acceptable though the average power output is very small in these cases. One possible reason for this feature is that these waves are not sufficiently high to induce wave overtopping on the floaters, thereby avoiding the energy loss due to wave breaking and viscous dissipation, as is evident in Figure 14b. However, as the wave period increases (0.75 < ω < 1.1), the interactions among the floats, breakwater, and waves result in abundant turbulence and vortexes and promote energy consumption, to a large extent; therefore, although the wave reflection coefficient is smaller than that in shorter waves, the wave energy is harnessed in a less efficient way. With further increase of wave period, the ratio of the harnessed energy to the summation of reflected energy and energy loss rises considerably, so the hydrodynamic efficiency returns to the favorable values at lower frequencies (ω < 0.75), as depicted in Figure 14a. In addition, more remarkable, we observed that increasing the wave steepness exerts a negative influence on the energy conversion performance for most wave frequencies. In the theory for linear waves, the energy conversion efficiency is expected to be independent of the incident wave height Hi. However, the nonlinearity of wave interaction with floating bodies is closely related to the value of wave steepness [14]. For waves with a large value of Hi/Li, strong nonlinear wave deformations occur during the wave–structure interaction and the consequent energy loss significantly affects the energy conversion efficiency. This feature was also reported and discussed by Ning et al. [12] in the research of an integrated WEC-FB device, of which the working principle is somehow similar with the present one.
In addition, the variation of Khydro as a function of incident wave power Pwave is shown in Figure 14c, with all cases in Table 1 and Table 2 included. It can be seen that Khydro shows a decreasing tendency with increasing Pwave in most situations, implying that the energy conversion efficiency of the present device is better in less energetic seas than in seas with a high level of wave power. By comparing the results in Figure 13b and Figure 14c, it is found that although the output power is more satisfactory when the incoming wave energy is high, the energy conversion efficiency is far less than the maximum value (19.6%); in contrast, when the device is in a less energetic state, the efficiency is more promising, though the output power is low. This fact may be ascribed to the viscosity dissipation during wave deformations, as the velocity potential of water particles is proportional to the wave amplitude for a fixed wave period, causing more complex nonlinear behaviors of wave–structure interaction that govern the turbulent field and the flow pattern around the floaters. Similar characteristics were also discussed for a surging WEC by Folley et al. [32] and for a float-type WEC by Peng et al. [11]. As a consequence of this characteristic, the developed hybrid device may present a higher efficiency in the less energetic sea-states, therefore reducing the disparity in energy conversion between the more and less energetic sea-states and promoting the potential load factor. In practical application, the device is expected to work in real seas with a wide range of periods and varying dominant wave frequencies over seasons; thereby, the determination of the response bandwidth is of great significance for the overall performance of the hybrid system.
As can be seen in Figure 14, the highest hydrodynamic efficiency is approximately 19.6% and achieved in waves with a wave steepness equal to 0.02. Admittedly, the performance of the present system in energy conversion is barely satisfactory, though the power capture results in the model tests may be conservative due to the greater viscous effects at the model scale than those at the prototype scale [16]. The relatively low energy conversion efficiency can mainly be ascribed to three aspects. Firstly, high level of energy loss is caused in experiments, especially for longer waves, due to the wave overtopping and strong nonlinear deformations of water surface on the upper planes of floaters, which favors the wave attenuation but disadvantages the energy extraction. In practical applications, this characteristic may be favorable for ensuring specific areas, such as port areas, to satisfy the relevant requirements on wave height, whereas it is disadvantageous for achieving a good performance in energy conversion. In the next step, the authors will optimize the configuration of the system by a parametric study focusing on the drafts and shapes of floaters, to find a compromise between the function of energy converter and the breakwater function, avoiding benefiting only one side at the expense of the other. The secondary possible reason is the application of a simple constant PTO damping rather than a well-estimated optimal damping according to the wave conditions and the structural features of the device. For a typical WEC making use of the heave motion of floaters, the optimal damping under a given wave frequency can be calculated based on the properties of floaters, as suggested by Sun et al. [33]. Under a suitable PTO damping force, the WEC may operate in a more efficient manner without modifying the geometry [7]. Thereby, the effect of PTO damping on the performance of the present hybrid system will be investigated in the future, and then the function of PTO system will be appropriately designed. Last but not the least, the hydrodynamic efficiency Khydro may be underestimated as the tests are conducted in a 2D wave flume, while the 3D effects cannot be taken into account, as pointed out by Isaacson and Nwogu [34]. For the present system, it is possible to take advantage of the so-called “point absorber effect” [35,36], whereby the device can extract energy from a fraction of a wavelength on either side in 3D tests; this may increase the wave power capture factor and make the device more attractive in real seas. By making use of the same effect for a single near-shore OWSC, Folley et al. [37] succeed in making the absorption width larger than the physical width of the paddle. Thus, the applicability and performance of the developed hybrid system are expected to improve with a large-scale model in 3D physical tests, though the present maximum capture ratio is relatively unsatisfactory.

5. Conclusions

In this study, two-dimensional experiments were performed in a wave tank to investigate the hydrodynamics and water wave interactions with a hybrid system combining a fixed breakwater and a wave energy converter consisting of three floating pontoons. The wave elevations, heave motions of the floaters, and the output power produced by the PTO damping component were simultaneously measured. The wave reflection coefficient, dissipation coefficient, average output power, and the hydrodynamic efficiency for energy conversion of the developed device were examined for varying wave conditions.
Regarding the wave field modifications caused by the studied breakwater–WEC system, the recorded temporal and spatial changes in the free surface elevation around the floating pontoons were presented in the time domain. Complex wave deformations, which dissipate energy from the waves, occurred due to wave overtopping and breaking caused by the breakwater and the heaving floaters. Frequency domain analysis confirmed that the investigated device leads to a favorable reduction in the incident energy for medium and longer waves, with less than 30% of the wave energy reflected in the model tests.
Moreover, the dynamic responses of the floaters were analyzed using the data recorded by the laser system and the snapshots of wave–structure interaction from the experiments. For floater FP1, the response amplitude under wave actions was considerably restricted in larger waves as the wave overtopping and breaking were more likely to occur on its top surface, whereas floaters FP2 and FP3 were restrained due to the difficulty in surpassing the resistance from PTO damping when the system was deployed in shorter waves. As a consequence, the floaters oscillated in different patterns when subjected to water waves, and their upper planes formed a stepped wave-absorbing slope in front of the breakwater, making a great contribution to the wave attenuation.
Most importantly, the wave energy conversion was estimated and discussed based on the WEC response, energy dissipation, and the power output of the PTO damping component. For the present integrated system, the hydrodynamic efficiency of wave energy conversion can be up to 19.6% when the wave period is 1.44 s and the wave steepness is 0.02. Meanwhile, the results indicate that the incident wave height has a greater influence on the power conversion than on the reflection coefficient and dissipation coefficient. Additionally, although encouraging results of average output power were attained in cases with higher incident energy, a careful examination of the energy conversion efficiency reveals that the wave power may not be extracted in an efficient way.
It should be noted that this study examined the hydrodynamic performance of the developed hybrid system only in regular waves. The main effort here is focused on the feasibility of the model test for the studied breakwater–WEC device and its hydrodynamic efficiency in primary power conversion under various wave conditions. Based on the results of this paper, a more sophisticated PTO system may be included in the next stage of research to investigate the effects of PTO damping and irregular ocean waves, and the efficiency of the model may be improved, to a certain extent, within a wide frequency band. Additionally, the wave loading on the system under extremely severe weather and the corresponding protective measures are research topics worth further investigation.

Author Contributions

W.P. carried out the laboratory investigation and prepared the manuscript by interpreting the results. Y.Z. and X.Y. established the physical model and conducted the laboratory experiments. J.Z. and R.H. developed the theory and discussed the results. Y.L. and R.C. contributed to the manuscript preparation. All authors have read and agreed to the published version of the manuscript.

Funding

The research was funded by National Natural Science Foundation of China (U1706230, 51709095), the Fundamental Research Funds for the Central Universities (2019B11814), National Natural Science Foundation of China (51675265), and Natural Science Foundation of Jiangsu, China (BK20160864).

Conflicts of Interest

The authors declare no conflict of interest.

References

  1. Cruz, J. Ocean Wave Energy Current Status and Future Perspectives; Springer: Berlin/Heidelberg, Germany, 2008. [Google Scholar]
  2. Alcorn, R.; Beattie, W. Observations of time domain data on the wells turbine in the Islay wave-power plant. In Proceedings of the 8th International Offshore and Polar Engineering Conference, Montreal, QC, Canada, 24–29 May 1998; pp. 12–18. [Google Scholar]
  3. Vicinanza, D.; Frigaard, P. Wave pressure acting on a seawave slot-cone generator. Coast. Eng. 2008, 55, 553–568. [Google Scholar] [CrossRef]
  4. Tjugen, K. TAPCHAN ocean wave energy project at Java, updated project status. In Proceedings of the Second European Wave Energy Conference, Lisbon, Portugal, 8–10 November 1995; pp. 42–43. [Google Scholar]
  5. Vicinanza, D.; Di Lauro, E.; Contestabile, P.; Gisonni, C.; Lara, J.L.; Losada, I.J. Review of innovative harbor breakwaters for wave-energy conversion. J. Waterw. Port Coast. Ocean Eng. 2019, 145, 18. [Google Scholar] [CrossRef]
  6. He, F.; Huang, Z.H.; Law, A.W.K. Hydrodynamic performance of a rectangular floating breakwater with and without pneumatic chambers: An experimental study. Ocean Eng. 2012, 51, 16–27. [Google Scholar] [CrossRef]
  7. Ning, D.; Zhao, X.; Göteman, M.; Kang, H. Hydrodynamic performance of a pile-restrained WEC-type floating breakwater: An experimental study. Renew. Energy 2016, 95, 531–541. [Google Scholar] [CrossRef]
  8. Ma, Z.; Mao, Y.; Cheng, Y.; Zhai, G. Effect of the PTO Damping Force on the 2D Oscillating Buoy Wave Energy Converter Integrated into a Pile-Restrained Floating Breakwater. Iran. J. Sci. Technol. Trans. Mech. Eng. 2020, 44, 961–973. [Google Scholar] [CrossRef]
  9. Zhao, X.L.; Ning, D.Z.; Zou, Q.P.; Qiao, D.S.; Cai, S.Q. Hybrid floating breakwater-WEC system: A review. Ocean Eng. 2019, 186, 106126. [Google Scholar] [CrossRef]
  10. Martinelli, L.; Ruol, P.; Favaretto, C. Hybrid structure combining a wave energy converter and a floating breakwater. In Proceedings of the 26th International Ocean and Polar Engineering Conference, Rhodes, Greece, 26 June–1 July 2016; pp. 622–628. [Google Scholar]
  11. Peng, W.; He, R.; Zhang, J.; Xu, T. Wave tank experiments on the power capture of a float-type wave energy device with a breakwater. J. Renew. Sustain. Energy 2018, 10, 054501. [Google Scholar] [CrossRef]
  12. Ning, D.; Zhao, X.; Zhao, M.; Kang, H. Experimental investigation on hydrodynamic performance of a dual pontoon-power take-off type wave energy converter integrated with floating breakwaters. Proc. Inst. Mech. Eng. Part M J. Eng. Marit. Environ. 2019, 233, 991–999. [Google Scholar] [CrossRef]
  13. Zhao, X.L.; Ning, D.Z.; Liang, D.F. Experimental investigation on hydrodynamic performance of a breakwater-integrated WEC system. Ocean Eng. 2019, 171, 25–32. [Google Scholar] [CrossRef]
  14. Zhang, H.M.; Zhou, B.Z.; Vogel, C.; Willden, R.; Zang, J.; Geng, J. Hydrodynamic performance of a dual-floater hybrid system combining a floating breakwater and an oscillating-buoy type wave energy converter. Appl. Energy 2020, 259, 114212. [Google Scholar] [CrossRef]
  15. Krishnendu, P.; Balaji, R. Hydrodynamic performance analysis of an integrated wave energy absorption system. Ocean Eng. 2020, 195, 106499. [Google Scholar] [CrossRef]
  16. Flocard, F.; Finnigan, T.D. Laboratory experiments on the power capture of pitching vertical cylinders in waves. Ocean Eng. 2010, 37, 989–997. [Google Scholar] [CrossRef]
  17. Whittaker, T.; Folley, M. Nearshore oscillating wave surge converters and the development of Oyster. Phil. Trans. R. Soc. A 2012, 370, 345–364. [Google Scholar] [CrossRef] [PubMed] [Green Version]
  18. Michailides, C.; Angelides, D.C. Modeling of energy extraction and behavior of a Flexible Floating Breakwater. Appl. Ocean Res. 2012, 35, 77–94. [Google Scholar] [CrossRef]
  19. Zheng, S.M.; Zhang, Y.L.; Iglesias, G. Coast/breakwater-integrated OWC: A theoretical model. Mar. Struct. 2019, 66, 121–135. [Google Scholar] [CrossRef]
  20. Peng, W.; Huang, X.; Fan, Y.; Zhang, J.; Ren, X. Numerical analysis and performance optimization of a submerged wave energy converting device based on the floating breakwater. J. Renew. Sustain. Energy 2017, 9, 044503. [Google Scholar] [CrossRef]
  21. Brito, M.; Teixeira, L.; Canelas, R.B.; Ferreira, R.M.; Neves, M.G. Experimental and numerical studies of dynamic behaviors of a hydraulic power take-off cylinder using spectral representation method. J. Tribol. 2018, 140, 021102. [Google Scholar] [CrossRef]
  22. Shi, J.; Zheng, J.H.; Zhang, C.; Joly, A.; Zhang, W.; Xu, P.F.; Sui, T.; Chen, T. A 39-year high resolution wave hindcast for the Chinese coast: Model validation and wave climate analysis. Ocean Eng. 2019, 183, 224–235. [Google Scholar] [CrossRef]
  23. Rahman, M.A.; Mizutani, N.; Kawasaki, K. Numerical modeling of dynamic responses and mooring forces of submerged floating breakwater. Coast. Eng. 2006, 53, 799–815. [Google Scholar] [CrossRef]
  24. Mansard, E.P.D.; Funke, E.R. The measurement of incident and reflected spectra using a least squares method. In Proceedings of the 17th International Conference on Coastal Engineering, ASCE, Sydney, Australia, 23–28 March 1980; pp. 154–172. [Google Scholar]
  25. Chang, H.-K. A three-point method for separating incident and reflected waves over a sloping bed. China Ocean Eng. 2002, 16, 499–511. [Google Scholar]
  26. McCormick, M.E. Ocean Engineering Wave Mechanics; Wiley-Interscience: New York, NY, USA, 1973. [Google Scholar]
  27. Koutandos, E.; Prinos, P.; Gironella, X. Floating breakwaters under regular and irregular wave forcing: Reflection and transmission characteristics. J. Hydraul. Res. 2005, 43, 174–188. [Google Scholar]
  28. Drimer, N.; Agnon, Y.; Stiassnie, M. A simplified analytical model for a floating breakwater in water of finite depth. Appl. Ocean Res. 1992, 14, 33–41. [Google Scholar]
  29. Zhao, X.; Ning, D. Experimental investigation of breakwater-type WEC composed of both stationary and floating pontoons. Energy 2018, 155, 226–233. [Google Scholar]
  30. Tolba, E.R.A.S. Behaviour of Floating Breakwaters under Wave Action. Ph.D. Thesis, Suez Canal University, Ismaïlia, Egypt, 1998. [Google Scholar]
  31. Budar, K.; Falnes, J. A resonant point absorber of ocean-wave power. Nature 1975, 256, 478–479. [Google Scholar]
  32. Folley, M.; Whittaker, T.; Henry, A. The effect of water depth on the performance of a small surging wave energy converter. Ocean Eng. 2007, 34, 1265–1274. [Google Scholar]
  33. Sun, S.Y.; Sun, S.L.; Wu, G.X. Fully nonlinear time domain analysis for hydrodynamic performance of an oscillating wave surge converter. China Ocean Eng. 2018, 32, 582–592. [Google Scholar]
  34. Isaacson, M.; Nwogu, O.U. Wave loads and motions of long structures in directional seas. J. Offshore Mech. Arct. Eng. 1987, 109, 126–132. [Google Scholar]
  35. Flocard, F.; Finnigan, T.D. Increasing power capture of a wave energy device by inertia adjustment. Appl. Ocean Res. 2012, 34, 126–134. [Google Scholar]
  36. Têtu, A.; Ferri, F.; Kramer, M.B.; Todalshaug, J.H. Physical and Mathematical Modeling of a Wave Energy Converter Equipped with a Negative Spring Mechanism for Phase Control. Energies 2018, 11, 23. [Google Scholar]
  37. Folley, M.; Whittaker, T.; Osterried, M. The oscillating wave surge converter. In Proceedings of the 14th International Offshore and Polar Engineering Conference, Toulon, France, 23–28 May 2004; pp. 189–193. [Google Scholar]
Figure 1. Schematic diagram of the hybrid system combining a fixed breakwater and a wave energy converter.
Energies 13 05740 g001
Figure 2. Schematic diagram of the physical model and its installation in the wave tank: (a) general view of the whole model; (b) general view of the gear box and dynamo.
Energies 13 05740 g002
Figure 3. A sketch of the experimental setup.
Energies 13 05740 g003
Figure 4. Wave height measurement system (CBY-II) (a) data acquisition module, (b) wave gages.
Energies 13 05740 g004
Figure 5. Data acquisition box for recording the data from laser sensors and dynamos (a) composition diagram, (b) operation interface.
Energies 13 05740 g005
Figure 6. Estimated reflection coefficient for eight conditions of over- or underestimated wave amplitudes.
Energies 13 05740 g006
Figure 7. Recorded surface elevations in front of the breakwater–WEC (wave energy converter) system (a) Ti = 1.8 s, h = 0.6 m, Hi/Li = 0.06, Li = 3.82 m; (b) Ti = 1.05 s, h = 0.6 m, Hi/Li = 0.06, Li = 1.68 m.
Energies 13 05740 g007aEnergies 13 05740 g007b
Figure 8. Snapshots of the wave–structure interaction for the case of Ti = 1.8 s, h = 0.6 m, Hi/Li = 0.06, Li = 3.82 m: (a) t = 29.84 s; (b) t = 30.28 s.
Energies 13 05740 g008
Figure 9. Wave reflection coefficients with various wave frequencies and wave steepness values: (a) effect of wave frequency; (b) effect of wave steepness.
Energies 13 05740 g009
Figure 10. Dynamics and instantaneous output powers of the floaters. (Ti = 1.8 s, h = 0.6 m, Hi/Li = 0.03): (a) motion; (b) output power.
Energies 13 05740 g010
Figure 11. Snapshots of the wave–structure interactions during experiments. (Ti = 1.8 s, h = 0.6 m, Hi/Li = 0.03): (a) t = 29.84 s; (b) t = 30.07 s; (c) t = 30.29 s; (d) t = 30.52 s; (e) t = 30.74 s; (f) t = 30.97 s; (g) t = 31.19 s; (h) t = 31.42 s.
Energies 13 05740 g011
Figure 12. Nondimensional response amplitudes of the floaters: (a) FP1; (b) FP2; (c) FP3.
Energies 13 05740 g012
Figure 13. Average output power of the hybrid system with different wave frequency and incident wave power values: (a) effect of wave frequency; (b) effect of incident wave power.
Energies 13 05740 g013
Figure 14. Variations of hydrodynamic efficiency and dissipation coefficient as functions of wave frequency and incident wave power: (a) effect of wave frequency on hydrodynamic efficiency; (b) effect of wave frequency on energy dissipation coefficient; (c) effect of incident wave power on hydrodynamic efficiency.
Energies 13 05740 g014
Table 1. Cases of experiment series A.
Wave Period Ti (s)Water Depth h (m)Wave Steepness Hi/LiDynamo Load RFP (Ω)
0.73; 0.82; 0.93;
1.05; 1.20; 1.28;
1.44; 1.60; 1.80
0.60.02; 0.03; 0.065.0
2.060.60.02; 0.035.0
Table 2. Cases of experiment series B.
Wave Period Ti (s)Water Depth h (m)Wave Height Hi (m)Dynamo Load RFP (Ω)
0.730.60.095.0
0.820.60.125.0
0.93; 1.05; 1.20;
1.28; 1.44; 1.60;
1.80; 2.06
0.60.155.0
Publisher’s Note: MDPI stays neutral with regard to jurisdictional claims in published maps and institutional affiliations.

