Article

Conventional and Advanced Exergy and Exergoeconomic Analysis of a Spray Drying System: A Case Study of an Instant Coffee Factory in Ecuador

by
Diana L. Tinoco-Caicedo
1,2,*,
Alexis Lozano-Medina
2 and
Ana M. Blanco-Marigorta
2
1
Facultad de Ciencias Naturales y Matemáticas, Escuela Superior Politécnica del Litoral, 090903 Guayaquil, Ecuador
2
Department of Process Engineering, Universidad de las Palmas de Gran Canaria, 35017 Las Palmas de Gran Canaria, Spain
*
Author to whom correspondence should be addressed.
Energies 2020, 13(21), 5622; https://doi.org/10.3390/en13215622
Submission received: 14 September 2020 / Revised: 19 October 2020 / Accepted: 23 October 2020 / Published: 27 October 2020
(This article belongs to the Special Issue Enhancement of Industrial Energy Efficiency and Sustainability)

Abstract

:
Instant coffee is produced worldwide by spray drying coffee extract on an industrial scale. This production process is energy intensive, 70% of the operational costs are due to energy requirements. This study aims to identify the potential for energy and cost improvements by performing a conventional and advanced exergy and exergoeconomic analysis to an industrial-scale spray drying process for the production of instant coffee, using actual operational data. The study analyzed the steam generation unit, the air and coffee extract preheater, the drying section, and the final post treatment process. The performance parameters such as exergetic efficiency, exergoeconomic factor, and avoidable investment cost rate for each individual component were determined. The overall energy and exergy efficiencies of the spray drying system are 67.6% and 30.6%, respectively. The highest rate of exergy destruction is located in the boiler, which amounts to 543 kW. However, the advanced exergoeconomic analysis shows that the highest exergy destruction cost rates are located in the spray dryer and the air heat exchanger (106.9 $/h and 60.5 $/h, respectively), of which 47.7% and 3.8%, respectively, are avoidable. Accordingly, any process improvement should focus on the exergoeconomic optimization of the spray dryer.

1. Introduction

Instant coffee is one of the most commonly consumed drinks worldwide; around 118 billion dollars of it were sold in the global market in 2019. The worldwide market for instant coffee has high growth expectations: projected to grow by 11.6% in the next 5 years [1]. Coffee has a high concentration of antioxidants [2], vitamins B, and minerals [3]. It benefits physical performance and stimulates the central nervous system [4]. Coffee is sold as whole bean, ground coffee, instant coffee, coffee pods, and capsules. Among these, instant coffee is quickly becoming popular all over the world because of cheaper transportation and convenience in preparation, which increases its demand among urban consumers [5]. Many industrial-scale plants have been established around the word to produce this kind of coffee.
The production process of instant coffee powder begins with roasting the coffee beans and grinding them. Later, they pass through a liquid solid extraction. The extracted liquid is then concentrated and, finally, it is spray dried. The drying process reduces the amount of water in the coffee and allows its shelf-life to be increased. This operation requires the most energy resources [6], and is also considered highly exergy-destructive [7]. Spray dryers are considered to be limiting units within a productive process, and one of the operations with the highest exergy improvement potential [8]. A previous study has demonstrated that the exergy efficiency of spray dryers is lower than that of other drying technologies such as tray dryers, continuous dryers, heat pump assisted dryers, fluidized bed dryers, solar dryers, freeze dryers, vacuum dryers, and flash dryers [7].
Exergy analysis has become an important tool for the assessment of different energy-intensive industrial processes, such as spray drying [9]. These analyses have allowed for the identification of the components with the highest exergy losses, the avoidable exergy losses, and the operational conditions, which most affect the irreversibility of the systems. Erbay et al. [10] used a pilot-scale spray dryer on white cheese slurry to demonstrate experimentally that parameters like atomization pressure and drying air temperature can affect the exergetic efficiency of the spray dryer. Another study of the same scale for the drying of cherry puree showed that drying agents could reduce the exergy destruction rate of the process [11]. Some studies were done at a laboratory scale. One lab-scale study, evaluated the exergetic efficiency of spray drying of photochromic dyes and obtained efficiency below 4% [12]. Further, Aghbashlo et al. [13] studied the influence of parameters such as air and feed flow rate in the exergy destruction rate of the spray drying of microencapsulation of fish oil. Only two studies have been done on industrial-scale spray dryers, and both took place in a powdered milk factory. The first analyzed each step of the production process and concluded that the spray dryer was one of the most exergy destructive components (2196 kW) [14]. In the second study, Camci et al. [15] analyzed a spray drying system with solar collectors for preheating the drying air in a closed loop, resulting in an increase of the exergetic efficiency to 22.6%.
However, although the exergetic analysis identifies the location and magnitude of the thermal energy losses, it has limitations given that it can not quantify the cost of those losses. Furthermore, an exergy analysis is not conclusive about which components should have investment priority in order to reduce the exergy losses [16]. In order to complete an exergy analysis, an exergoeconomic analysis can be applied, which combines exergy and economic principles at the component level to identify the real cost sources in a thermal system [17]. Since the thermodynamic considerations of exergoeconomics are based on the exergy concept, the term exergoeconomics can also be used to describe the combination of exergy analysis and economics [18]. Exergoeconomic analysis has been applied in different industrial processes in order to minimize the economic losses due to irreversibility, and, consequently, provide the added benefit of reducing production costs of the entire complex energy system. Few conventional exergoeconomic analyses of different drying technologies on both the pilot and industrial scale have been found in the literature; they focused on the production of pasta [19], tea leaves [20], powdered cheese [21], and powdered milk [22,23]. Of these, only the last two refer to spray drying technology at an industrial scale. These exergoeconomic analysis performed were useful for the evaluation of the economic viability of the proposed improvements to the spray dryer in a powdered milk factory. Erbay et al. [21] also performed an exergoeconomic analysis on a pilot-scale spray dryer for cheese powder and concluded that some investments should be made in order to reduce the operational cost rates by increasing exergetic efficiency of the process.
Although the exergy and exergoeconomic analyses allow for the quantification of the exergetic and cost losses, they do not provide sufficient information about which losses are avoidable; this information is essential for industrial plants to make decisions about improvement potential. Advanced exergoeconomic analysis is a proposed tool that has been applied to different industrial processes in order to quantify the avoidable and unavoidable economic losses and determine the potential for improvement [24]. However, there have not been any studies that apply an advanced exergoeconomic analysis in spray-drying technology in order to quantify this kind of exergy destruction.
The aim of the present work is to carry out a conventional and advanced exergy and exergoeconomic analysis on the spray drying process of instant coffee at a factory in Guayaquil, Ecuador in order to quantify total operating cost rates at a component level and split into avoidable and unavoidable parts. There are two main novelties in this study: first, real data from an instant coffee plant in operation have been used; second, an advanced exergoeconomic analysis on the spray-drying system of an instant coffee plant has been applied for the first time. This analysis will be a valuable decision-making tool for the factory for future improvements focused on operational cost reduction, and sustainability increase.

2. Materials and Methods

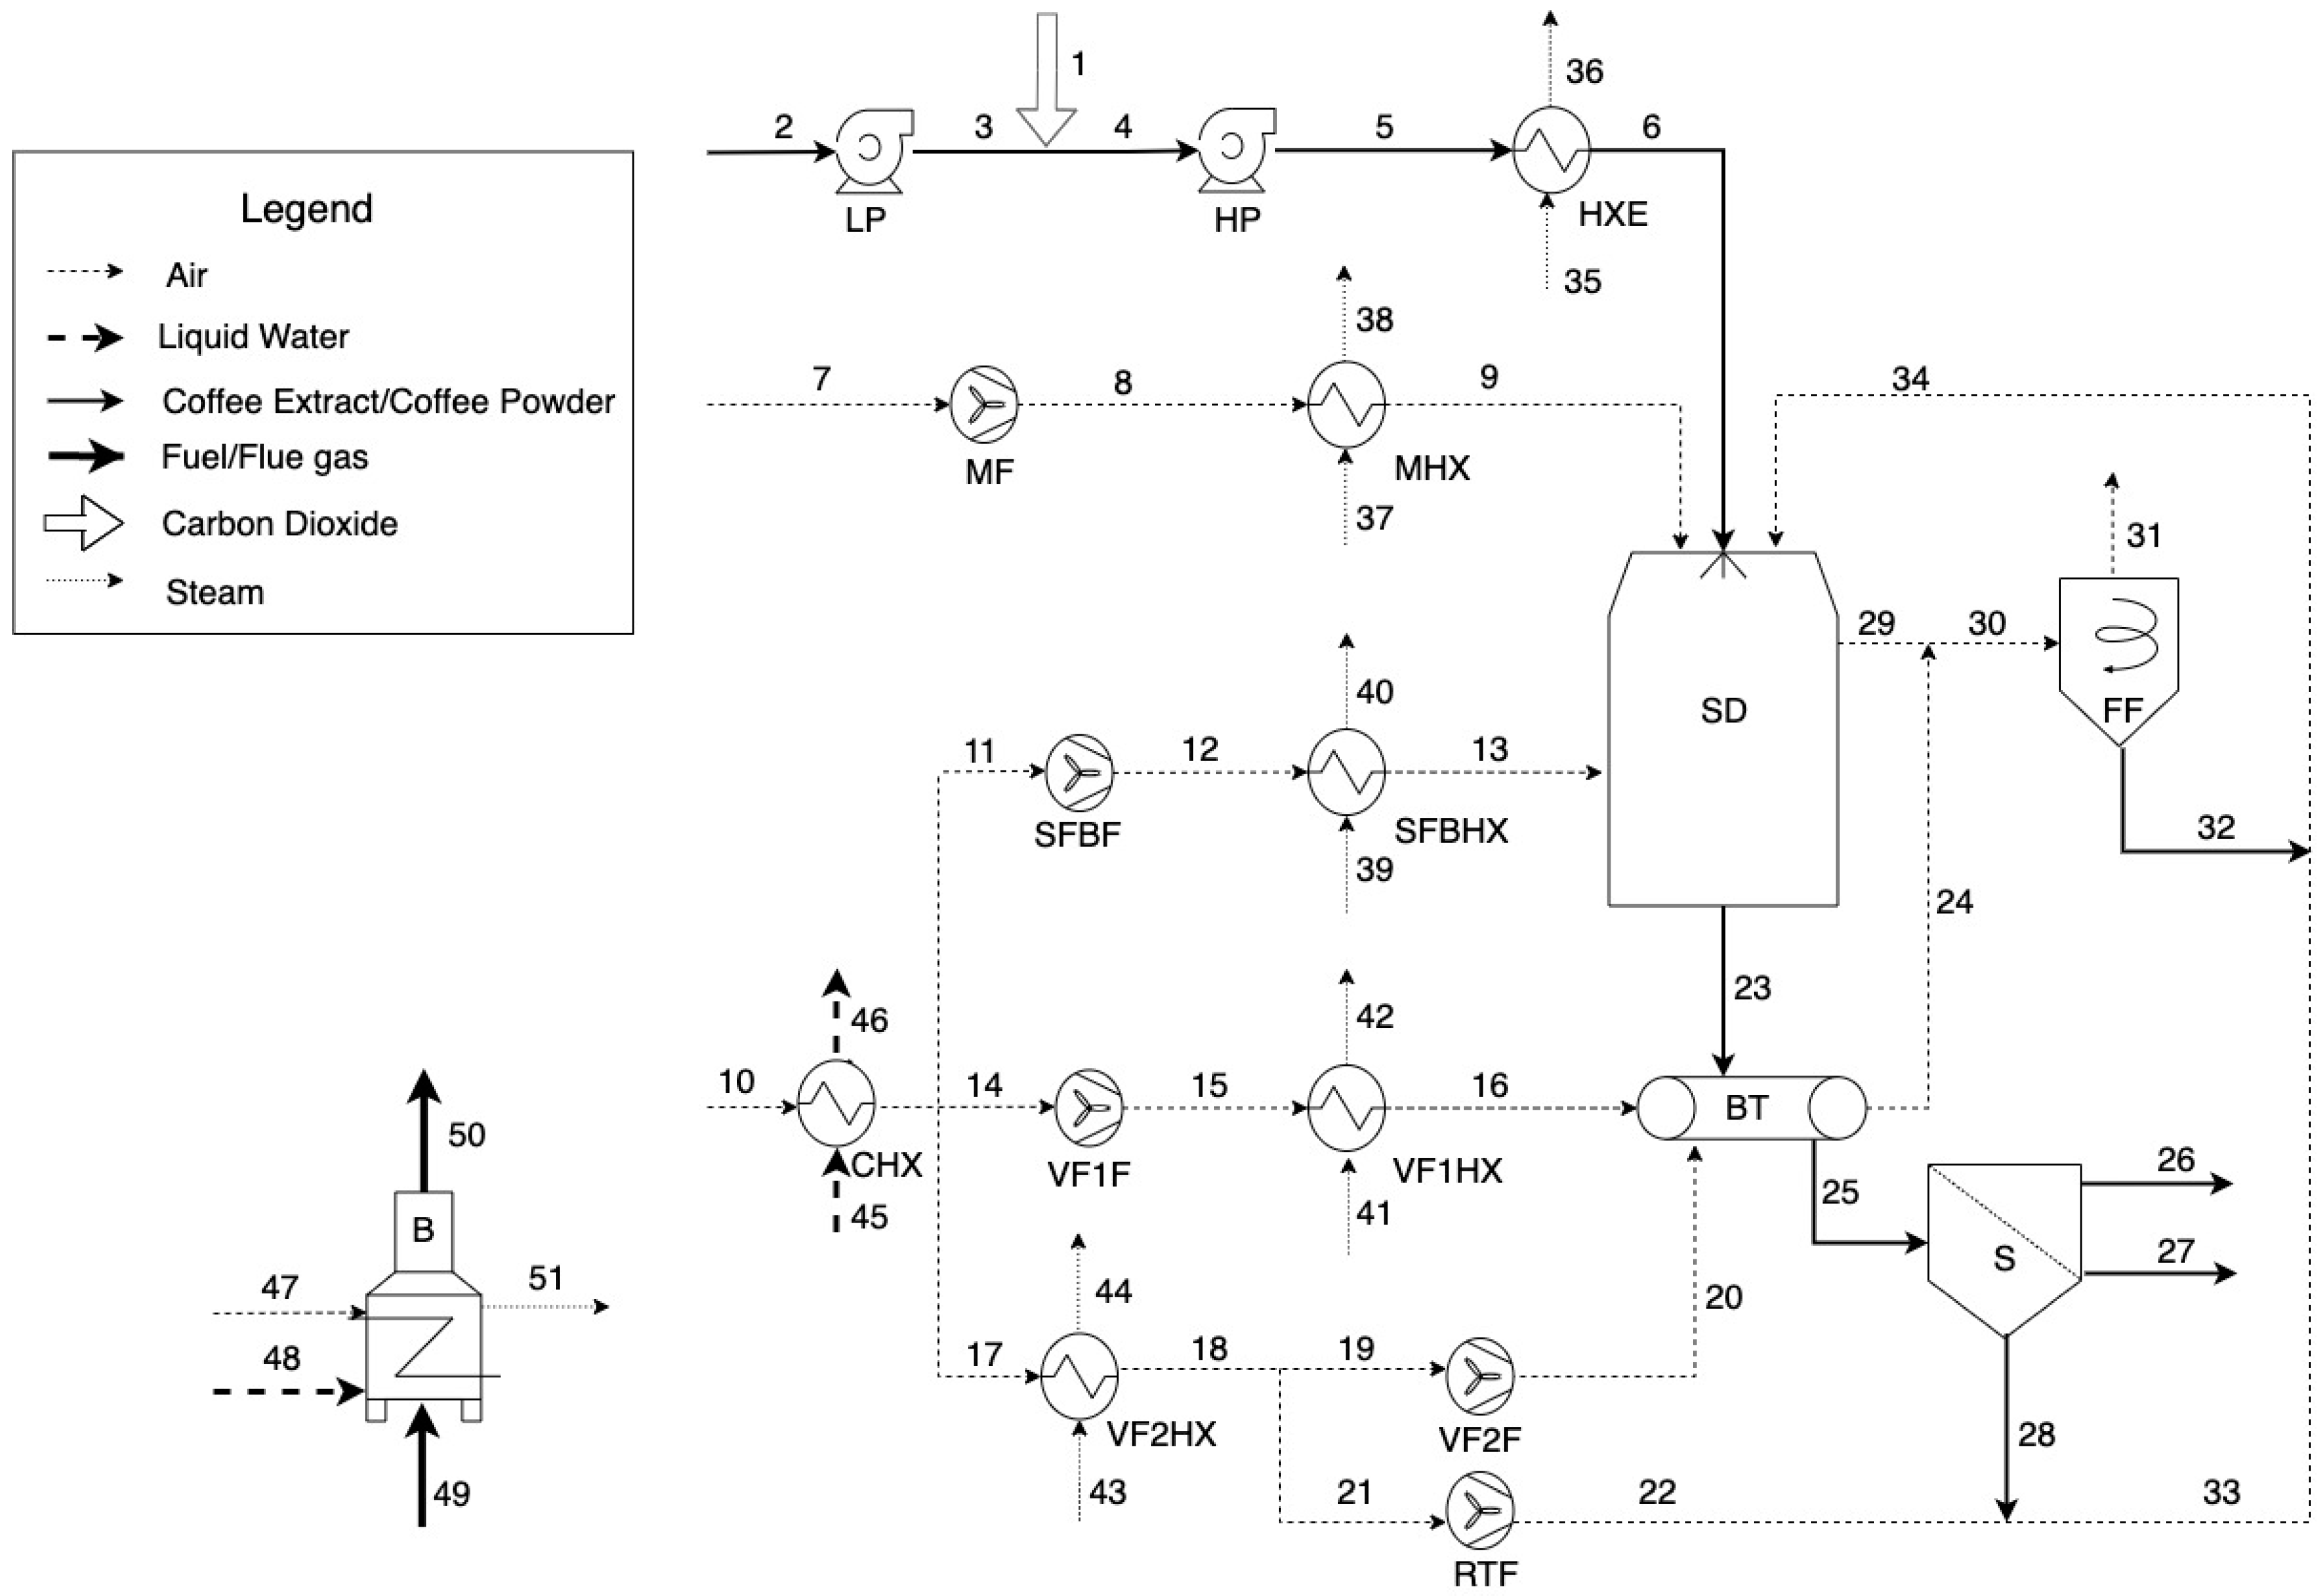
2.1. System Description

The instant coffee was dried in an industrial scale spray drying system. Figure 1 illustrates a schematic diagram of the process. The coffee extract (44% m/m of soluble coffee) comes from a storage tank that had a temperature of 12 °C. A flow rate of 528 kg/h of coffee extract (stream 2) was pumped by a low-pressure pump (LP) and mixed with 7.4 kg/h of carbon dioxide (stream 1). Then it was pumped by a high-pressure pump (HP) into a heat exchanger unit (HXE) where steam increased its temperature to 32 °C. The coffee extract (stream 6) was sprayed by a nozzle into the drying unit (SD), which is at vacuum pressure. A flow rate of 9922 kg/h of ambient air (stream 7) was heated by the main heat exchanger (MHX) using steam until it reached the temperature of 180 °C. A flow rate of 4002 kg/h of ambient air (stream 10) with an absolute humidity of 0.02 kg water/kg dry air was dehumidified to 8 × 10⁻³ kg water/kg dry air by a cooler (CHX) and then a fraction of it (stream 11) was heated and distributed in order to maintain a fluidized bed in the bottom of the spray dryer. The dried instant coffee produced with a humidity of about 3% m/m (stream 23) was then collected on a belt (BT), where two streams of dehumidified air at 85 °C (stream 16) and 27 °C (stream 20) were used to gradually cool the coffee and prevent it from agglomerating. Then the instant coffee (stream 25) was passed through vibratory screen (S) in order to obtain the required particle size. The fraction of instant coffee with the smallest particle size (stream 28) was recirculated to the process using dried air at 27 °C (stream 22) while the biggest particle size of instant coffee (stream 27) was considered waste. The humidified air (stream 29) that exits the spray dryer was passed through a cyclone separator (FF) to remove solid coffee particles. These solid particles (stream 32) were recirculated into the process and the humidified air (stream 31) was released to the environment.
To develop the process modeling, the following assumptions were made:
  • The process was at a steady state condition.
  • The coffee extract was modeled as a solution with a constant concentration of soluble solids from Coffea arabica beans.
  • The heat losses from the components were neglected.
  • The pressure losses in the pipes, heat exchangers, bag filter, and spray dryer were neglected.
  • The properties of the incoming air were considered as constants.

2.2. Exergy Analysis

The analysis of the spray drying system was performed by using the engineering equation solver (EES) software for the formulation of mass, energy, and exergy balances for each component. In their general form, they are, respectively:
i n m ˙ i n o u t m ˙ o u t = 0
i n h i n m ˙ i n o u t h o u t m ˙ o u t + W ˙ k + Q ˙ k = 0
k E ˙ q , k + W ˙ k + i n E ˙ i n o u t E ˙ o u t E ˙ D , k = 0
The exergy rate, specific exergy, physical exergy, kinetics exergy, and potential exergy were calculated using Equations (4)–(8). Table 1 shows the expressions of both fuel and product exergy of each component.
E ˙ = m ˙ e
e = e P H + e C H + e K N + e P T
e P H = ( h h 0 ) T 0 ( s s 0 )
e P T = g z
e K N = v 2 2
The velocities of different streams were estimated by the Bernoulli relationship, Equation (9), where γ is the specific heat ratio and ρ is the density of the stream.
v 2 2 + ( γ γ 1 ) P ρ = ( γ γ 1 ) P 0 ρ 0
For the streams that had soluble coffee solids as part of their compositions, Equations (10) and (11) were used to determine the thermodynamic properties such as entropy and enthalpy. The cp value was obtained from Burmester et al. [25]. The dead state conditions have been taken as T0 = 27.5 °C and P0 = 101.13 kPa.
h h 0 = c p ( T T 0 )
s s 0 = c p ln ( T T 0 ) R l n ( P P 0 )
The composition for the different states of the system is shown in Table 1. This information was used to calculate the different thermodynamic properties.
For the calculation of chemical exergy of each state point that has soluble coffee solids and water, Equation (12) [17] was used. The concentration of water and coffee in equilibrium with the environment ( x i e ) was chosen as the dead state of reference. Those values were obtained from previous studies on Arabica coffee by Yao et al. [26]. For the calculation of the chemical exergy of each state point that has soluble coffee solids, water, and air, Equation (13) [17] was used, where x i is the mole fraction of the different substances.
e C E C H = R T 0 x i ln ( x i e x i )
e m i x C H = x i e i c h + R T 0 x i ln ( x i )
The chemical exergy of air for the different moisture content in air was calculated using an expression from Wepfer et al. [27], according to Equation (14), where w o and w are mole fraction of water vapor at environmental conditions and operational conditions, respectively.
e a i r C H = 0.2857 c p , a i r T o l n [ [ 1 + 1.6078 w o 1 + 1.6078 w ] ( 1 + 1.6078 w ) [ w w o ] 1.6078 w ]
The exergy balance can also be formulated as Equation (15).
E ˙ F , k E ˙ P , k = E ˙ D , k E ˙ L , k
where E ˙ F , k corresponds to the fuel exergy, E ˙ P , k is the product exergy, E ˙ D , k is the destroyed, exergy and E ˙ L , k is the exergy loss. The exergy of the fuel and the exergy of the product for each single component were formulated following Lazzareto and Tsatsaronis rules [28] and they are shown in Table 2.
For the total system the exergetic efficiency was calculated as the sum of the product exergy rates divided by the sum of the fuel exergy rates.
Other interesting parameters involved in an exergy analysis were the relative exergy destruction ( y D , k * ) , which represents the relationship between the destroyed exergy of a component and the total destroyed exergy of the system, as shown in Equation (16) [17]. The exergy destruction ratio ( y D , k ), which relates the destroyed exergy of a component with the total fuel exergy of the system, is shown in Equation (17). The exergetic efficiency ( n e x , k ), which represents the amount of exergy that is useful in relation to the fuel exergy in the component, is shown in Equation (18).
y D , k * = E ˙ D , k E ˙ D , t o t
y D , k = E ˙ D , k E ˙ F , t o t
n e x , k = E ˙ P , k E ˙ F , k

2.3. Advanced Exergy Analysis

In order to obtain the real potential of improvement of each component, the avoidable and unavoidable parts of the exergy destruction were calculated. The unavoidable part of the exergy destruction ( E ˙ D , k U N ) would be the exergy that will inevitably be destroyed, due to technological limitations, no matter how much capital is invested, and can be calculated by using Equation (19) [29], where ( E ˙ D / E ˙ P ) k U N is the relationship between the exergy destruction and exergy product rates estimated using the unavoidable conditions for each component.
E ˙ D , k U N = E ˙ P , k ( E ˙ D E ˙ P ) k U N
Values of the unavoidable and real operation conditions of the components are summarized in Table 3, and were assumed according to previous studies [14,30]. For the spray dryer, the minimum air flow required to supply the energy for water evaporation was calculated as an avoidable condition [31].

2.4. Exergoeconomic Analysis

The exergoeconomic analysis consists of the formulation of a cost balance and its auxiliary equations at a component level, for each component of the process. The general cost balance [17] is shown in Equation (20) where c o u t and c i n represent the costs of the outflows and inflows respectively, c w , k represents the cost rate related with the work and Z ˙ k represents the investment cost of each component. Table 2 shows the cost balance of each component present in the system.
k c q , k E ˙ q , k + c w , k W ˙ k + i n c i n E ˙ i n o u t c o u t E ˙ o u t c D , k E ˙ D , k + Z ˙ k = 0
The cost balance can be written in terms of the fuel and product formulation [28] as is shown in Equations (21) and (22).
C ˙ P , k = C ˙ F , k + Z ˙ k C ˙ D , k
c P , k E ˙ P , k = c F , k E ˙ F , k + Z ˙ k C ˙ D , k
where C ˙ P , k is the product cost rate, C ˙ F , k is the fuel cost rate, and C ˙ D , k is the cost rate associated with the destroyed exergy for each component.
The exergy destroyed in the k-th component has an associated cost rate C ˙ D , k that can be calculated in terms of the cost of the additional fuel ( c F , k ) that needs to be supplied to this component to cover the exergy destruction and to generate the same exergy flow rate of the product, when E ˙ P , k stay constant (Equation (23)) [17]. Table 4 shows the cost balance of each component present in the system.
C ˙ D , k = c F , k E ˙ D , k
There are some non-energetic costs used in the calculations of the cost balance of each component. In the boiler, the fuel used to generate vapor was fuel oil 6. The price of the liquid fuel (stream 49) was $1.07 per gallon [32]. The potable water (stream 48) had a cost of $0.53 per cubic meter [33]. The price of carbon dioxide (stream 1) injected into the coffee extract was $24.22 per kg.
The variable Z ˙ k was calculated as the sum of capital investment ( Z ˙ k C I ) and operation and maintenance costs ( Z ˙ k O M ) for each component, as is shown in Equation (24) [17].
Z ˙ k = Z ˙ k O M + Z ˙ k C I
The capital investment for each component can be calculated by using Equation (25) [17]:
Z ˙ k C I = P E C k C R F τ
where P E C k is the purchase price of the kth component and τ is the number of annual operating hours (24 h per day, 365 days per year). It was assumed that the ordinary annuities transaction occurs at the end of each time interval, thus the CRF (capital recovery factor) could be obtained using Equation (26) [17], where i e f f is the interest rate (10%), and n is the lifetime of the system (20 years).
C R F = i e f f ( 1 + i e f f ) n ( 1 + i e f f ) n 1
The rate of operation and maintenance costs ( Z ˙ k O M ) can be calculated by using Equation (27). The operation and maintenance cost (OMCk) of each component is determined by using Equation (28), which is a close approximation used by Bejan et al [17]. The constant-escalation levelization factor (CELF) was determined by using Equation (29), which depends on the factor k O M C defined by Equation (30) [17]. For the nominal escalation rate ( r O M ), it was assumed that all costs except fuel costs and the values of by-products change annually with the constant average inflation rate of 4% [17].
Z ˙ k O M = O M C k C E L F O M τ
O M C k = 0.2 P E C k
C E L F O M = k O M C ( 1 k O M C n ) C R F ( 1 k O M C )
k O M C = 1 + r O M 1 + i e f f
For a better interpretation of the results, the exergoeconomic factor ( f k ) and relative cost difference ( r k ) were determined. The first factor represents the relationship between the investment cost and the total operating cost rate, while the r k represents the increase of the specific exergy cost in a component divided by the specific exergy cost of the fuel.
f k = Z ˙ k Z ˙ k + C ˙ D , k
r k = c P , k c F , k c F , k

2.5. Advanced Exergoeconomic Analysis

The unavoidable ( C ˙ D , k U N ) and avoidable cost ( C ˙ D , k A V ) associated with exergy destruction were calculated using Equations (33) and (34). The unavoidable ( Z ˙ k U N ) and avoidable investment cost rates ( Z ˙ k A V ) were calculated by using Equations (35) and (36). The relation between the investment cost rate and the exergy product rate ( Z ˙ k / E ˙ P ) k U N was estimated by using the unavoidable cost conditions presented in Table 4. For the heat exchangers, a Pro/II ® simulator was used to estimate the new heat transfer area based on the minimum temperature difference.
C ˙ D , k U N = c F , k E ˙ D , k U N
C ˙ D , k A V = C ˙ D , k C ˙ D , k A V
Z ˙ k U N = E ˙ P , k ( Z ˙ k E P ˙ ) k U N
Z ˙ k A V = Z ˙ k Z ˙ k U N

3. Results and Discussions

3.1. Conventional Exergy Analysis

The parameters of the exergetic analysis were calculated for each state throughout the entire studied system. Table 5 shows the flow rate ( m ˙ ), temperature (T), pressure (P), specific chemical exergy (eCH), specific physical exergy (ePH), specific kinetic exergy (eKN), and exergy rate ( E ˙ ) of each stream.
The exergy rate of the fuel ( E ˙ F ) and the product ( E ˙ P ), the exergetic ( n e x ) and energetic ( n e n ) efficiencies, and the exergy destruction ratios ( y D , k and y D , k ) were calculated for each component in the system. The results are summarized in Table 6. The components with the highest exergy fuel rates were the B, the MHX, and the SD. The MHX is the component with the highest exergetic efficiency (38.9%), followed by the boiler (37%). There is a big difference between the exergetic and the energetic efficiencies of the majority of the components, and consequently the overall system also exhibited the same behavior. Therefore, despite the energy efficiency of the system (the conservation of the quantity of energy) being 67.8%, the overall exergy efficiency (the quality of that energy) was only 33.3%. Similar results were obtained in a study on the spray drying process in an industrial scale ceramic factory, in which the energetic efficiency was found to be between 43% and 87% [34], and the exergetic efficiency was between 12% and 64% [35]. However, in a pilot-scale study of spray drying of cherry puree the energetic and exergetic efficiencies were only 3.2% and 0.7%, respectively [11]. This, along with laboratory-scale studies [10,12,36], demonstrates that pilot-scale and laboratory-scale studies do not accurately represent the energetic and exergetic performances of the industrial-scale spray drying process.
Figure 2 shows the fuel and product exergy rate of the overall system, and the destroyed exergy rate of each component. The results show that the components that had electric energy as the main fuel exergy source such as the vibrating screen, belt, and fans had the lowest impact on the exergetic destruction. This occurs because the electric energy was used for mechanical operations, instead of being used as a heat source. The exergy destruction ratio (yD) was lower than 5% for these components. These results were similar to other studies that determined an exergy destruction ratio lower than 2% for the compressors and pumps in a CCHP system [37]. Furthermore, in a yogurt plant the devices that required electric energy accounted for less than 5% of the total exergy destruction [38].
Conversely, the boiler destroyed 39.4% of the overall fuel exergy rate. This percentage was similar to other plants where the boiler was used as an auxiliary supply of steam. For instance, in a factory, which produces ghee, the boiler has the highest exergy destruction ratio 39% [39]. This is because the main purpose of this component is to convert a high-quality energy (chemical energy of fuel oil) to a low-quality energy (heat).
The MHX also has a high exergy destruction rate, despite having one of the highest exergetic efficiencies. The air heater used in this process was a steam-heated type, which is one of the most used in food industry, it had an exergy efficiency of 38.9% and a high specific exergy destruction of 287 kJ per kg of heated air, with a minimum temperature difference of 12 °C. There are other types of air heaters that could reduce the exergy destruction rate and the minimum temperature difference such as a system with a heat exchanger that uses geothermic fluid. A previous study showed that this kind of heat exchanger has an exergy efficiency of 42% and specific destruction exergy of 57.5 kJ per kilogram of heated air with a minimum temperature difference of 5 °C [40]. Another type of air heater was one that uses electric energy as the source of heat. A previous study on the spray drying of photochromic dyes determined that the exergy efficiency of this kind of heater was 16.4% [12], this has the lowest exergy efficiency because it is transforming high quality energy (electric energy) to low quality energy (heat).
The SD also affects the performance of the overall system, since it has one of the highest rates of exergy destruction at 595 kJ/kg of evaporated water. Previous studies by Bühler et al. [31] found that the spray dryer is a highly exergy-destructive component in a powdered milk factory. Similarly in a large dairy factory producing primarily milk powder, they obtained an exergy destruction rate of 1345 kJ/kg of evaporated water [14]. In a ceramic plant, the exergy destruction rate was 1111.4 kJ/kg of evaporated water [35].

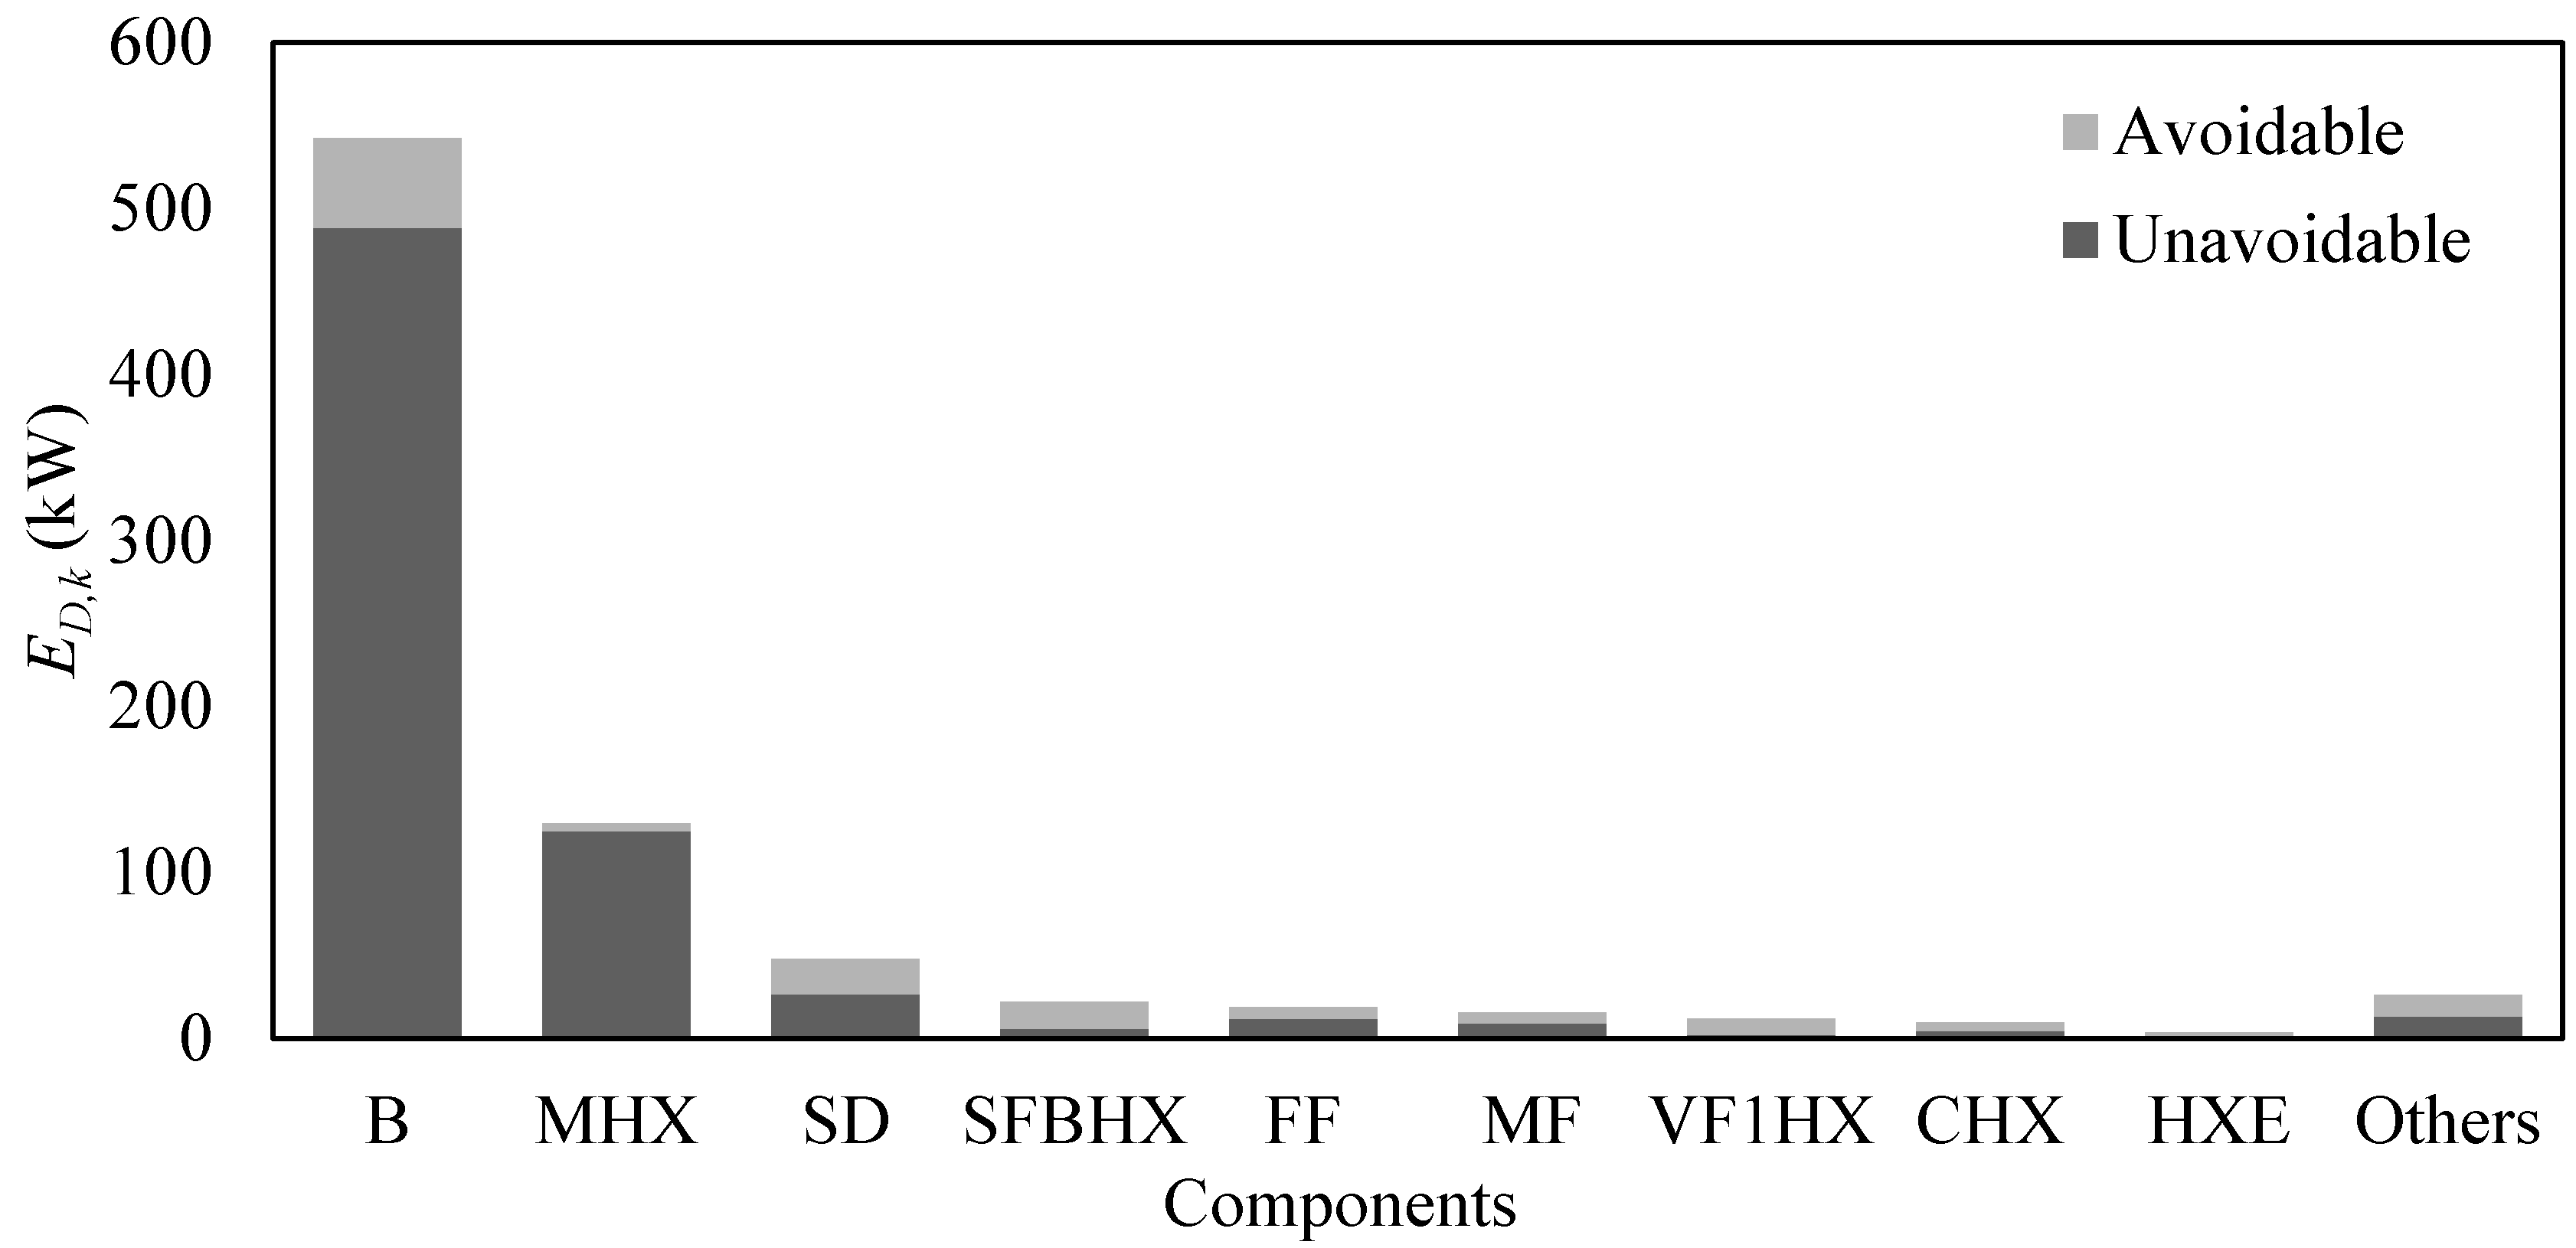
3.2. Advanced Exergy Analysis

In order to determine the avoidable and unavoidable fractions of the exergy destruction rate, it was split at a component level by considering the unavoidable thermodynamic inefficiency conditions listed in Table 3. Figure 3 shows that the components with the highest avoidable exergy destruction rates. Even though the MHX had one of the highest exergy destruction rates, more than 96% of the MHX destroyed exergy was unavoidable, this is because the real operational conditions were close to the unavoidable ones.
Conversely, the B and the SD were responsible for 38% (54 kW) and 15% (21 kW) of the total avoidable exergy destruction rate, respectively. Vuckovic et al. [30] and Bühler [14] found similar results for the boiler in an industrial energy supply plant (16.4%) and the spray dryer for a milk processing factory (16.5%), respectively.
Structural changes in spray drying systems have been studied as an alternative to reduce avoidable exergy destruction rates. Walmsley et al. [22] concluded that a closed drying air loop for the recovery of heat waste in a spray drying system for the production of powdered milk could achieve a reduction of 14.4% of steam used. This reduction would consequently reduce the avoidable exergy destruction rate for the system. In addition, Camci et al. [15] determined that the exergy destruction rate could decrease by 11% when solar collectors for preheating the drying air were used.

3.3. Conventional Exergoeconomic Analysis

The conventional exergoeconomic analysis was carried out at a level component and it is presented in Table 7 different indicators such as the specific fuel cost (cF), the destruction exergy cost rate ( C ˙ D ), the exergoeconomic factor (fk), the relative cost difference ( r k ), and the total operating cost rate ( C ˙ D + Z ˙ k ) in descending order.
The results show that the two highest total operating cost rates ( Z ˙ k + C ˙ D ) were from the SD followed by the MHX, meaning that the influence of these components on the total costs associated with the overall system was significant. Interesting results are presented, because although the B had a higher avoidable exergy destruction rate than the SD and MHX, the specific cost rate was higher in the SD than in the B, thus making the SD the component that had the greatest influence on the total operating cost rate. In contrast, the fans, the pumps, and the vibrating stream were the three components that contributed least to the total operating cost rate. Similar results were obtained by an exergoeconomic analysis in a corn dryer, where the drying chamber represented more than 98% of the total operational costs [41].
Furthermore, although the percentage relative cost differences for components such as the B (7%), SD (2%), and MHX (1%) were found to be low, their exergy destruction cost rates were high. The MHX and the SD had exergoeconomic factors of 1.6% and 3.3%, respectively, which means that the exergetic efficiency of these components must increase in order to reduce the overall system cost. Similar results were found in other drying technologies such as gas engine-driven heat pump dryer and a ground-source heat pump food dryer, which had exergoeconomic factors of 25% [42] and 14.6% [43], respectively. Another previous study on a pilot-scale spray dryer for the production of cheese powder, concluded similarly that in order to reduce the operational cost in spray drying systems, the exergy efficiency in the drying chamber should be increased even though this would require an increment in the capital investment [21].

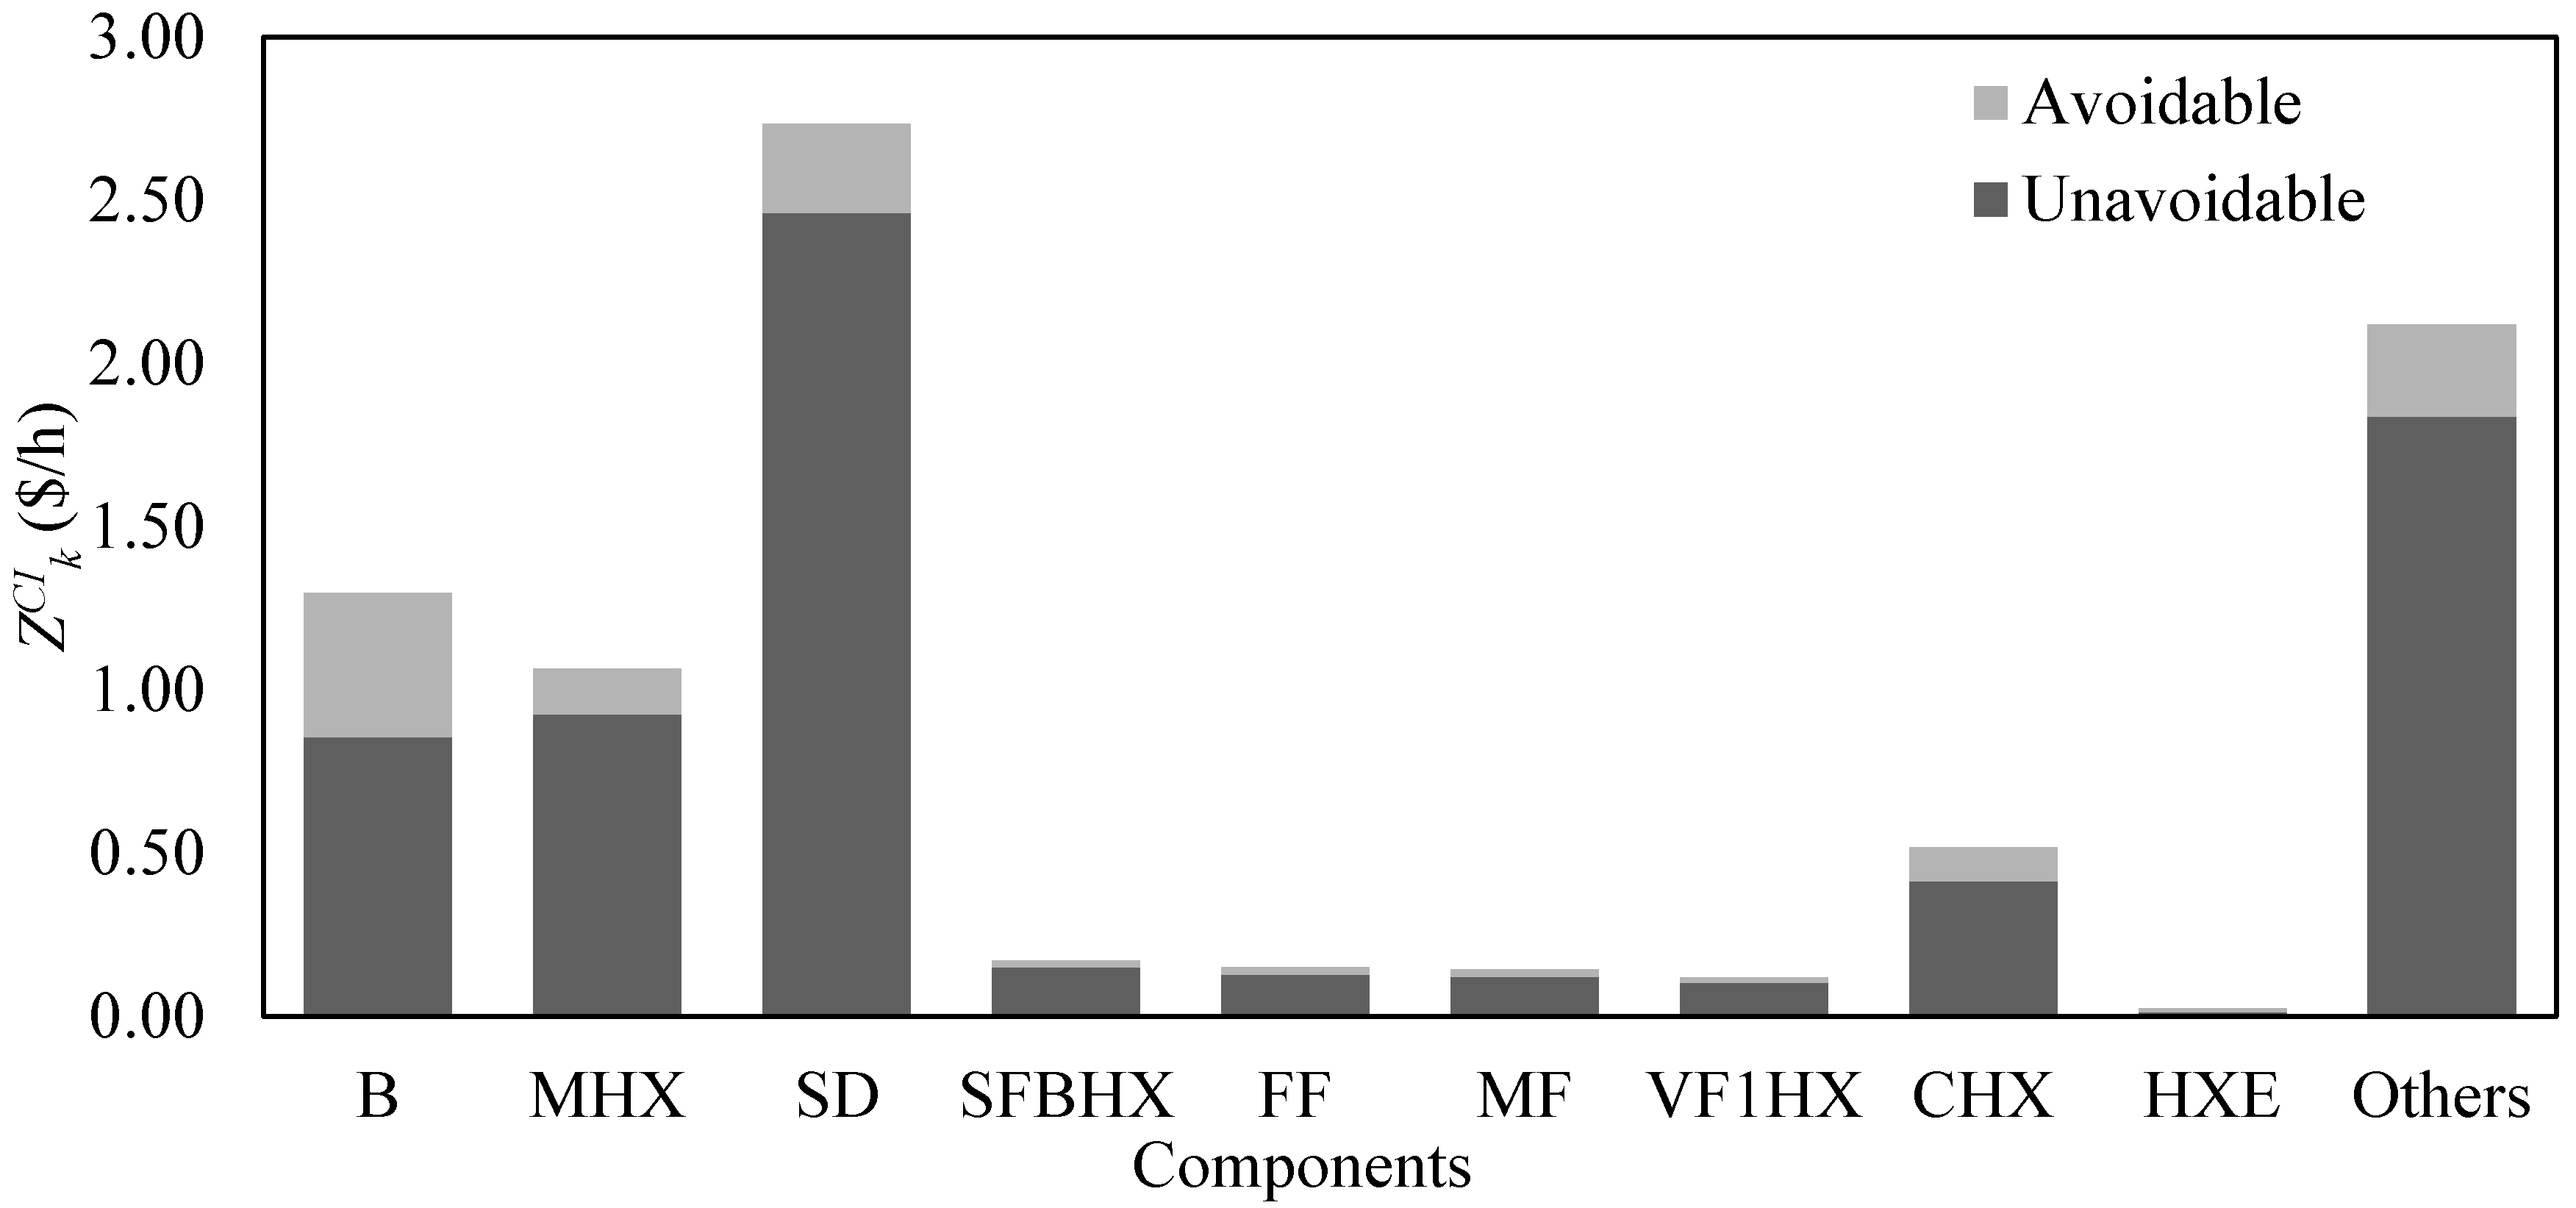
3.4. Advanced Exergoeconomic Analysis

In order to determine the system’s potential of improvement for the reduction of the overall operational cost, an advanced exergoeconomic analysis was performed. In Figure 4, the avoidable ( C ˙ D , k A V ) and unavoidable ( C ˙ D , k U N ) cost of exergy destruction, and the avoidable ( Z ˙ k A V ) and unavoidable ( Z ˙ k U N ) investment cost rates of the different components of the system are presented.
As it is shown in Figure 4 the combined avoidable investment cost rates of the B, the SD and the MHX, represents only 10.2% of the overall investment cost rate and less than 1% of the overall operational cost rate. These results show that the improvement potential for the investment cost rate of the SD and the MHX was low.
On the other hand, the avoidable exergy destruction cost rate for the overall system represents 30% of the operational cost and 31% of the overall destruction cost. Only three advanced exergoeconomic analyses have been done in drying systems, but all of them were performed on heat pump dryers [44,45]. These previous studies reported that 46% and 74% of the overall destruction cost were avoidable. This indicates that spray drying process could have lower improvement potential than the heat pump drying process.
In Figure 5, the avoidable and unavoidable exergy destruction cost rates are presented at a component level. It is shown that the B and MHX had high unavoidable exergy destruction cost rate, combined they represented 49% of the total unavoidable exergy destruction. A previous advanced exergoeconomic analysis in a power plant showed similar results for the boiler: around 90% of the destruction cost rate was unavoidable [46].
Other components such as fans, pumps, and the vibrating screen had also low avoidable cost rates associated with exergy destruction (accounting for less than 1% of the total avoidable cost), which means that any improvement in these components will not significantly reduce the total operating cost. This result is also shown in other food drying systems where the components that require electric energy have avoidable costs that represent less than 1% of the total cost [45].
Conversely, although the B has the highest avoidable exergy destruction rate, the spray dryer has the highest avoidable exergy destruction cost rate ($47.7/h), which represents 73% of the overall avoidable destruction cost rate of the process. A previous study on a pump food dryer similarly concluded that 68.6% of the destruction cost rates were avoidable in the drying chamber [47]. These results imply that the SD had the highest level of improvement potential. A reduction of the exergy destruction rate in the spray dryer could reduce the total cost of the overall system by 22%.

4. Conclusions

According to the aim of this study, we developed conventional and advanced exergy and exergoeconomic analyses of a spray drying system of instant coffee for the first time, using real operational data. The components of the system where analyzed individually. The advanced analysis was found to be useful for quantifying the flow costs in the process and also for identifying which components have the greatest potential for improvement in order to make the overall system more cost effective.
According to the analysis and discussion, the following conclusions were obtained:
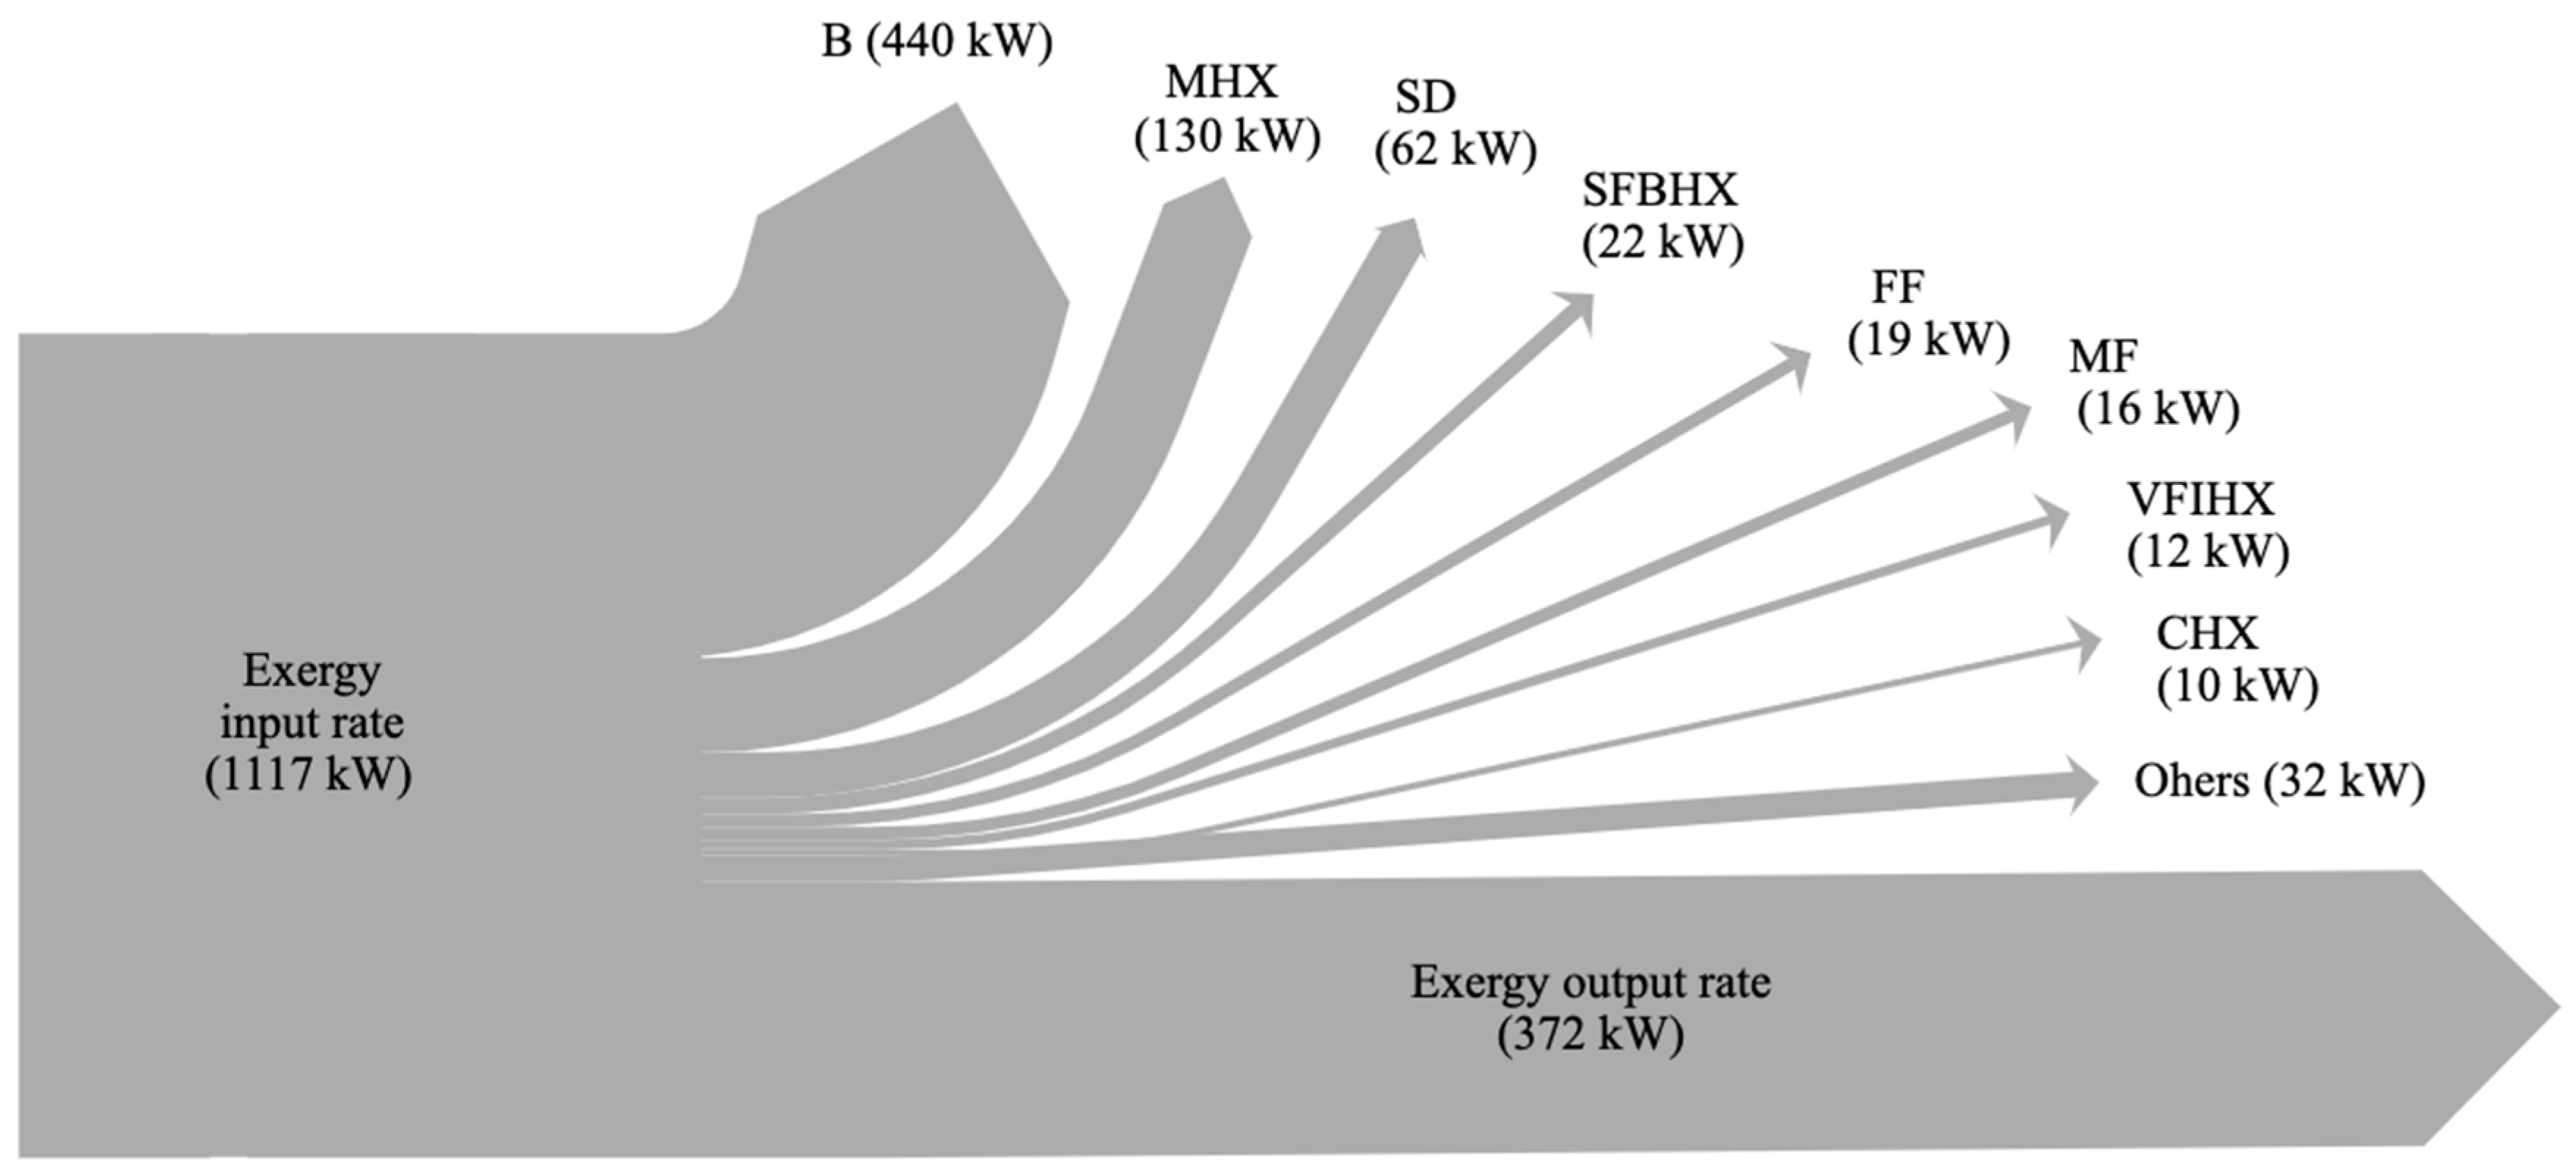
  • The overall energy and exergy efficiencies of the spray drying system were calculated as 71% and 33% respectively, where the B had the highest exergy destruction rate, but most of it (90%) was unavoidable exergy destruction.
  • The conventional exergoeconomic analysis allows for the quantification of the overall operational cost rate ($207.9/h); more than 70% of that cost rate was due to the SD and the MHX.
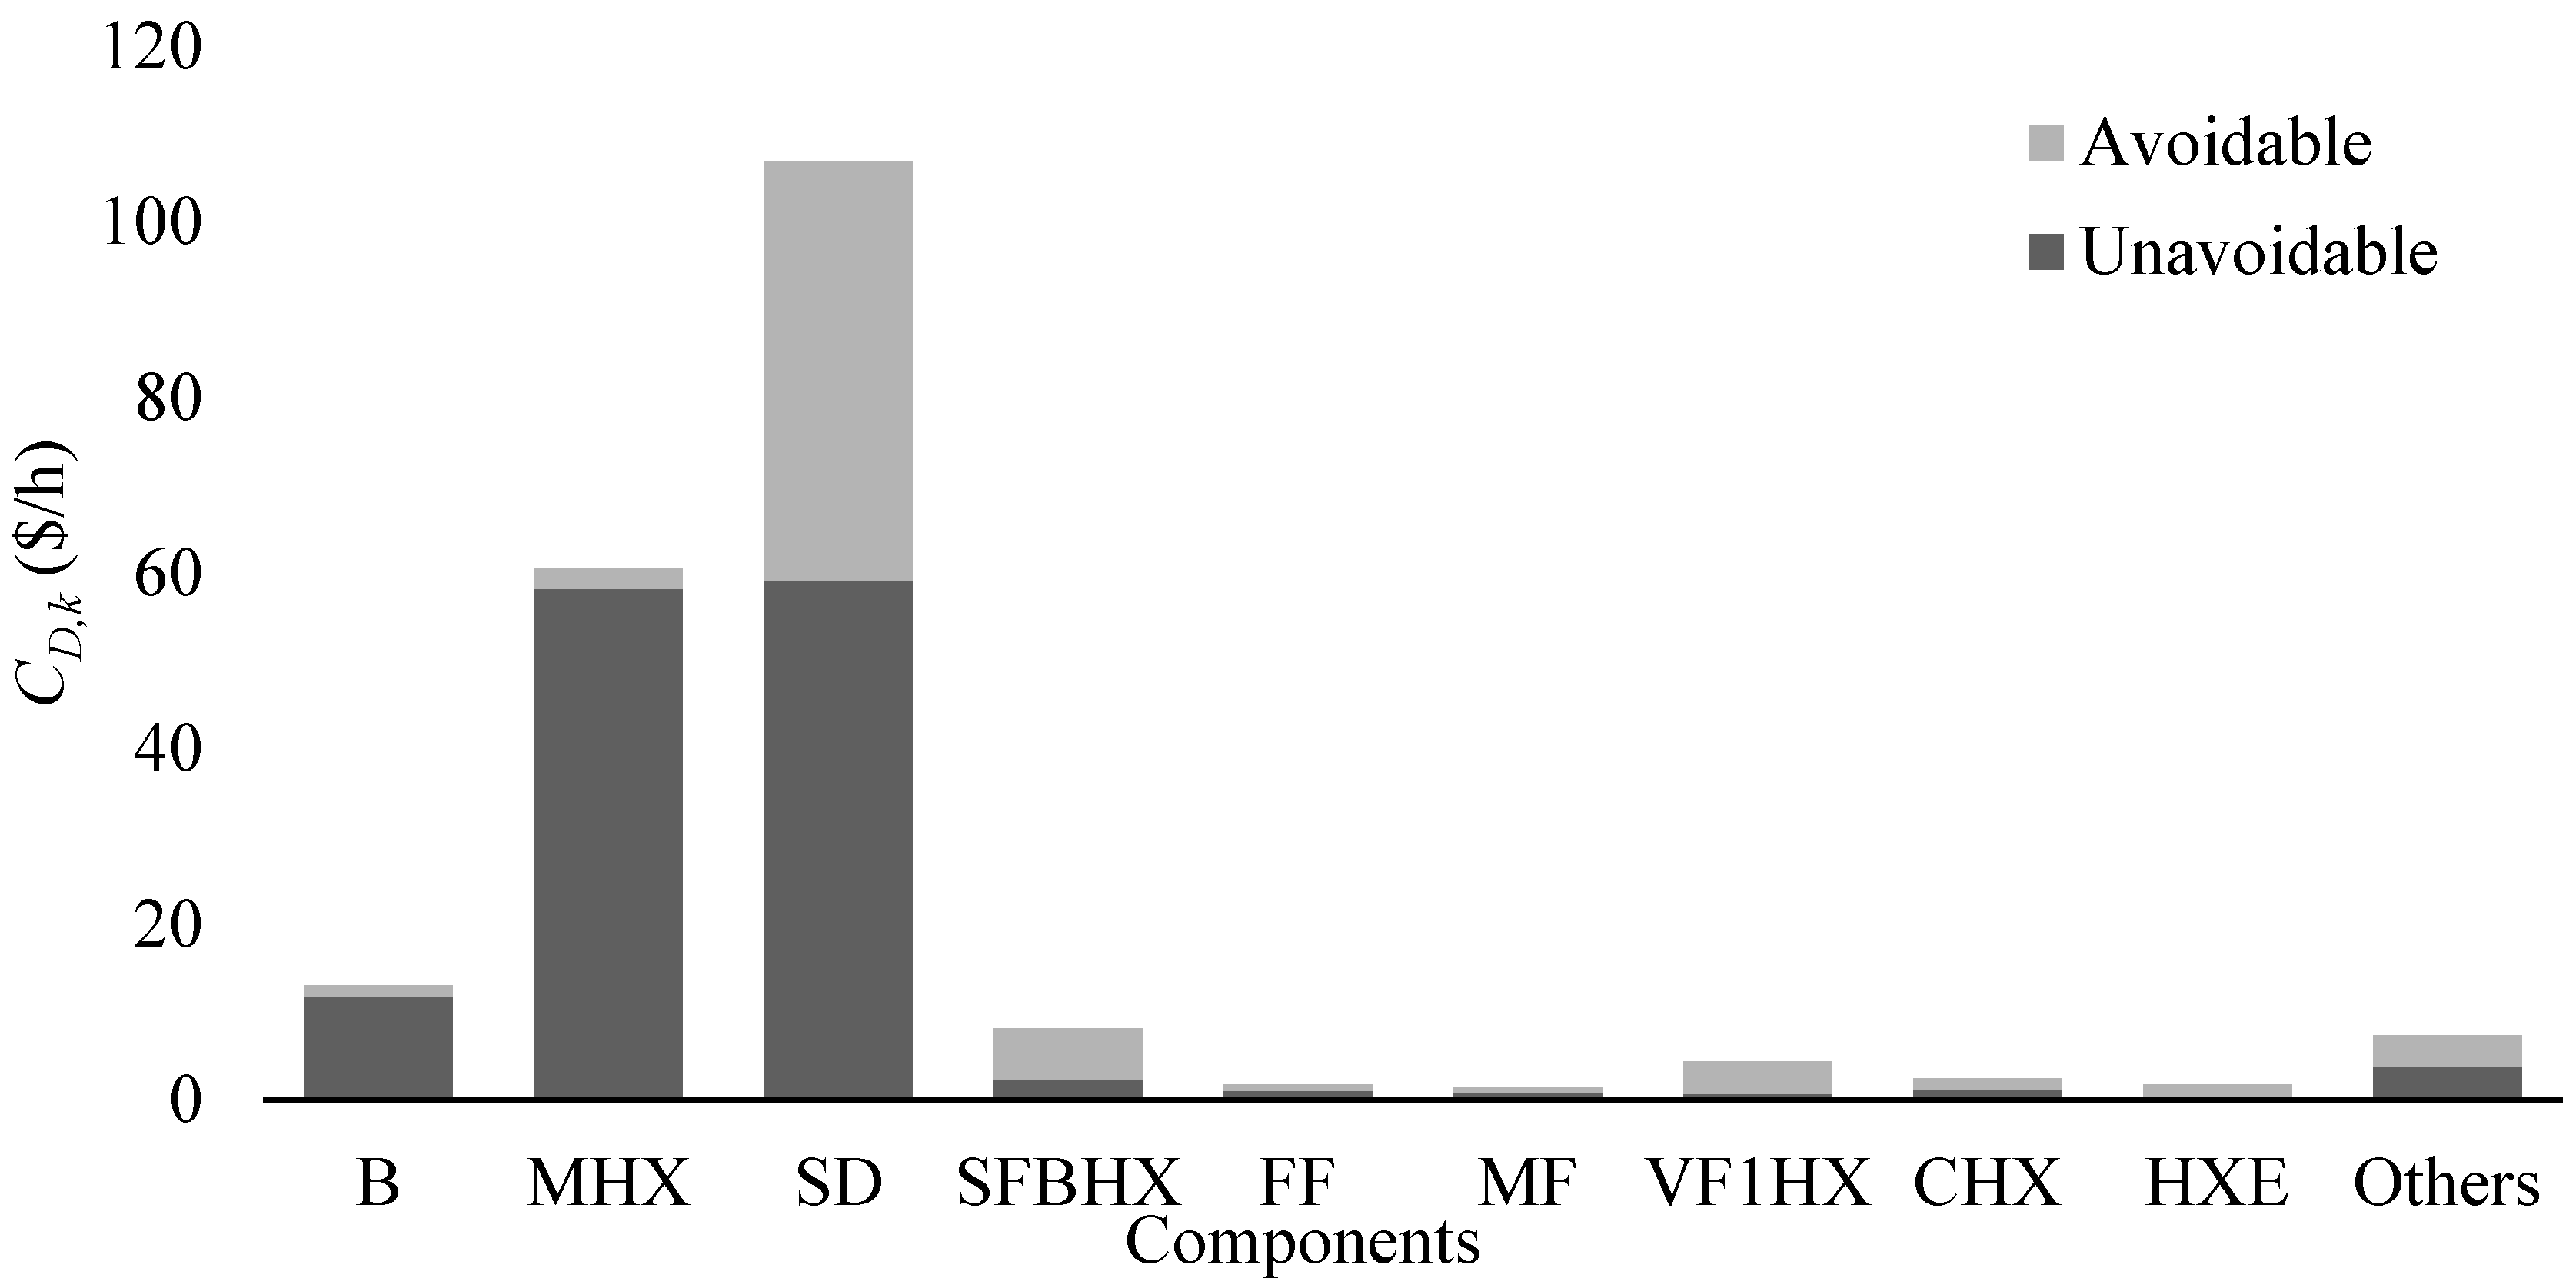
  • The exergoeconomic factor allowed for the identification of the SD and MHX as the sources with the highest cost rate. More than 97% of the operating cost rate of the SD and the MHX were due to a high exergy destruction rate; of all the components in the studied system, these components were the most exergy destructive. The cost rates of the exergy destruction for the SD and the MHX were 106.9 $/h and 60.5$/h, respectively.
  • The advanced exergoeconomic analysis revealed that 33% of the exergy destruction cost rate of the overall system was avoidable. Additionally, it established that 70% of the avoidable exergy destruction cost rate was located in the SD, demonstrating that this was the component with the highest improvement potential.
Finally, based on the results obtained in this analysis, the following recommendations were made for the plant: It would be useful to reduce the exergetic destruction cost rate of the SD and the MHX, by performing a parametric study and implementing structural changes within an exergoeconomic optimization in order to obtain fk values as close to 50% as possible [48]. Further studies are necessary to analyze the interdependence of the SD and the rest of the system’s components, in order to determine the percentage of avoidable costs that can be attributed to the irreversibilities of each component’s operation.

Author Contributions

Conceptualization, investigation and data curation, D.L.T.-C.; methodology, A.M.B.-M.; software and validation, formal analysis, D.L.T.-C. and A.M.B.-M.; writing—original draft preparation, D.L.T.-C.; writing—review and editing, A.M.B.-M.; supervision and project administration, A.L.-M. and A.M.B.-M. All authors have read and agreed to the published version of the manuscript.

Funding

This research received no external funding.

Conflicts of Interest

The authors declare no conflict of interest.

Nomenclature

C ˙ cost rate associated with an exergy stream ($/h)
ydestruction rate
E ˙ exergy rate (kJ/h)
fexergy rate (kJ/h)
iinterest rate
c p heat capacity (kJ/K*kg)
Q ˙ heat flow rate (kJ/h)
Rideal gas constant (kJ/kmol*K)
Z ˙ investment cost rate ($/h)
m ˙ mass flow rate (kg/h)
nlife time of the system
Ppressure (kPa)
rrelative cost difference
y*relative irreversibility
hspecific enthalpy (kJ/kg)
sspecific entropy (kJ/kg)
especific exergy rate (kJ/kg)
Ttemperature (°C)
cunit exergy cost ($/kJ)
w mole fraction of water vapor
W ˙ power (kJ/h)
xmole fraction
Greek letters
Δdifference
γspecific heat ratio
ɳefficiency
ρ air density (kg/m3)
τannual operating hours (h)
Abbreviations
Bboiler
BTbelt
CHXcooler heat exchanger
HXEextract heat exchanger
RFFfine returns fan
SFBFfluidized bed fan
SFBHXfluidized bed heat exchanger
HPhigh pressure pump
LPlow pressure pump
MFmain fan
MHXmain heat exchanger
Nnozzle
PECpurchased equipment cost
SDspray dryer
FFvacuum pump
VF1Fvf1 fan
VF1HXvf1 heat exchanger
VF2Fvf2 fan
VF2HXvf2 heat exchanger
Svibrating screen
Subscripts
conconversion
Dexergy destruction
elecelectric
enenergy
exexergy
Ffuel exergy
ininflow
isisentropic
kkth component
mechmechanical
minminimum
mixmixture
outoutflow
Pproduct exergy
Lloss
totoverall system
othermodynamic environment
Superscripts
AVavoidable
CHchemical
CIcapital investment
KNkinetic
OMoperating and maintenance
PHphysical
PTpotential
UNunavoidable

References

  1. Statista Consumer Market Outlook for Instant Coffee. 2020. Available online: https://www.statista.com/outlook/30010200/100/instant-coffee/worldwide (accessed on 20 May 2020).
  2. Svilaas, A.; Sakhi, A.K.; Andersen, L.F.; Svilaas, T.; Ström, E.C.; Jacobs, D.R.; Ose, L.; Blomhoff, R. Intakes of Antioxidants in Coffee, Wine, and Vegetables Are Correlated with Plasma Carotenoids in Humans. J. Nutr. 2004, 134, 562–567. [Google Scholar] [CrossRef]
  3. Gebhardt, S.; Lemar, L.; Haytowitz, D.; Pehrsson, P.; Nickle, M.; Showell, B.; Holden, J. USDA National Nutrient Database for Standard Reference, Release 21; United States Department of Agriculture Agricultural Research Service: Washington, DC, USA, 2008.
  4. Lucas, M.; Mirzaei, F.; Pan, A.; Okereke, O.I.; Willett, W.C.; O’Reilly, É.J.; Koenen, K.; Ascherio, A. Coffee, Caffeine, and Risk of Depression Among Women. Arch. Intern. Med. 2011, 171, 1571–1578. [Google Scholar] [CrossRef] [Green Version]
  5. Market, A. Global Industry Analysis, Size, Share, Growth, Trends and Forecast 2019–2025. 2019. Available online: https://www.transparencymarketresearch.com/logistics-market.html (accessed on 20 May 2020).
  6. Bhandari, B. Handbook of Industrial Drying; Mujumdar, A.S., Ed.; CRC Press: Boca Raton, FL, USA, 2015; ISBN 978-1-4665-9665-8. [Google Scholar]
  7. Aghbashlo, M.; Mobli, H.; Rafiee, S.; Madadlou, A. A review on exergy analysis of drying processes and systems. Renew. Sustain. Energy Rev. 2013, 22, 1–22. [Google Scholar] [CrossRef]
  8. Johnson, W.P.; Langrish, A.T. Interpreting exergy analysis as applied to spray drying systems. Int. J. Exergy 2020, 31, 120–149. [Google Scholar] [CrossRef]
  9. Johnson, P.W.; Langrish, T.A.G. Exergy analysis of a spray dryer: Methods and interpretations. Dry. Technol. 2017, 36, 578–596. [Google Scholar] [CrossRef]
  10. Erbay, Z.; Koca, N. Energetic, Exergetic, and Exergoeconomic Analyses of Spray-Drying Process during White Cheese Powder Production. Dry. Technol. 2012, 30, 435–444. [Google Scholar] [CrossRef]
  11. Saygı, G.; Erbay, Z.; Koca, N.; Pazir, F. Energy and exergy analyses of spray drying of a fruit puree (cornelian cherry puree). Int. J. Exergy 2015, 16, 315. [Google Scholar] [CrossRef]
  12. Çay, A.; Kumbasar, E.P.A.; Morsunbul, S. Exergy analysis of encapsulation of photochromic dye by spray drying. IOP Conf. Ser. Mater. Sci. Eng. 2017, 254, 22003. [Google Scholar] [CrossRef]
  13. Aghbashlo, M.; Mobli, H.; Madadlou, A.; Rafiee, S. Influence of spray dryer parameters on exergetic performance of microencapsulation processs. Int. J. Exergy 2012, 10, 267. [Google Scholar] [CrossRef]
  14. Bühler, F.; Nguyen, T.-V.; Jensen, J.K.; Holm, F.M.; Elmegaard, B. Energy, exergy and advanced exergy analysis of a milk processing factory. Energy 2018, 162, 576–592. [Google Scholar] [CrossRef] [Green Version]
  15. Camci, M. Thermodynamic analysis of a novel integration of a spray dryer and solar collectors: A case study of a milk powder drying system. Dry. Technol. 2019, 38, 350–360. [Google Scholar] [CrossRef]
  16. Tsatsaronis, G. Definitions and nomenclature in exergy analysis and exergoeconomics. Energy 2007, 32, 249–253. [Google Scholar] [CrossRef]
  17. Bejan, A.; Tsatsaronis, G.; Michael, M. Thermal Design and Optimization; John Wiley & Sons: New York, NY, USA, 1996; Volume 21, ISBN 0471584673. [Google Scholar]
  18. Tsatsaronis, G. Thermoeconomic analysis and optimization of energy systems. Prog. Energy Combust. Sci. 1993, 19, 227–257. [Google Scholar] [CrossRef]
  19. Ozgener, L. Exergoeconomic analysis of small industrial pasta drying systems. Proc. Inst. Mech. Eng. Part A J. Power Energy 2007, 221, 899–906. [Google Scholar] [CrossRef]
  20. Ozturk, M.; Dincer, I. Exergoeconomic analysis of a solar assisted tea drying system. Dry. Technol. 2019, 38, 655–662. [Google Scholar] [CrossRef]
  21. Erbay, Z.; Koca, N. Exergoeconomic performance assessment of a pilot-scale spray dryer using the specific exergy costing method. Biosyst. Eng. 2014, 122, 127–138. [Google Scholar] [CrossRef]
  22. Walmsley, T.G.; Walmsley, M.R.; Atkins, M.J.; Neale, J.R.; Tarighaleslami, A.H. Thermo-economic optimisation of industrial milk spray dryer exhaust to inlet air heat recovery. Energy 2015, 90, 95–104. [Google Scholar] [CrossRef]
  23. Walmsley, T.G.; Walmsley, M.R.W.; Atkins, M.J.; Neale, J.R. Thermo-Economic assessment tool for industrial milk spray dryer exhaust heat recovery systems with particulate fouling. Chem. Eng. Trans. 2014, 39, 1459–1464. [Google Scholar] [CrossRef]
  24. Petrakopoulou, F.; Tsatsaronis, G.; Morosuk, T.; Carassai, A. Advanced Exergoeconomic Analysis Applied to a Complex Energy Conversion System. J. Eng. Gas Turbines Power 2011, 134, 031801. [Google Scholar] [CrossRef]
  25. Burmester, K.; Fehr, H.; Eggers, R. A Comprehensive Study on Thermophysical Material Properties for an Innovative Coffee Drying Process. Dry. Technol. 2011, 29, 1562–1570. [Google Scholar] [CrossRef]
  26. Clément, Y.B.Y.; Benjamin, Y.N.; Roger, K.B.; Clement, A.D.; Kablan, T. Moisture Adsorption Isotherms Characteristic of Coffee (Arabusta) Powder at Various Fitting Models. Int. J. Curr. Res. Biosci. Plant Biol. 2018, 5, 26–35. [Google Scholar] [CrossRef]
  27. Wepfer, W.J.; Gaggioli, R.A.; Obert, E.F. Proper evaluation of available energy for HVAC. ASHRAE Trans. 1979, 85, 214–230. [Google Scholar]
  28. Lazzaretto, A.; Tsatsaronis, G. SPECO: A systematic and general methodology for calculating efficiencies and costs in thermal systems. Energy 2006, 31, 1257–1289. [Google Scholar] [CrossRef]
  29. Tsatsaronis, G.; Park, M.-H. On avoidable and unavoidable exergy destructions and investment costs in thermal systems. Energy Convers. Manag. 2002, 43, 1259–1270. [Google Scholar] [CrossRef]
  30. Vučković, G.D.; Stojiljković, M.M.; Vukić, M.V.; Stefanović, G.M.; Dedeić, E.M. Advanced exergy analysis and exergoeconomic performance evaluation of thermal processes in an existing industrial plant. Energy Convers. Manag. 2014, 85, 655–662. [Google Scholar] [CrossRef]
  31. Cziesla, F.; Tsatsaronis, G.; Gao, Z. Avoidable thermodynamic inefficiencies and costs in an externally fired combined cycle power plant. Energy 2006, 31, 1472–1489. [Google Scholar] [CrossRef]
  32. Petroecuador, E.P. Precios de Venta a Nivel de Terminal para las Comercializadoras Calificadas y Autorizadas a Nivel Nacional. Ep Petroecuador Gerencia de Comericalización Nacional. 2019. Available online: http://bit.ly/2XeM8Zq (accessed on 20 March 2020).
  33. Interagua. Informe Anual 2018–2019; International Water Services (Guayaquil) Interagua C. Ltda: Guayaquil, Ecuador, 2019. [Google Scholar]
  34. Apak. Energy exergy analyses, Turkey (Supervisor: Prof. Dr. Ramazan K€OSE). In A Ceramic Factory, Mechanical Engineering Branche; Engineering Faculty, Dumlupınar University: Kütahya, Turkey, 2007; p. 110. (In Turkish) [Google Scholar]
  35. Utlu, Z.; Hepbasli, A.; Hepbaşlı, A. Exergoeconomic analysis of energy utilization of drying process in a ceramic production. Appl. Therm. Eng. 2014, 70, 748–762. [Google Scholar] [CrossRef]
  36. Kurozawa, L.E.; Park, K.J.; Hubinger, M.D. Spray Drying of Chicken Meat Protein Hydrolysate: Influence of Process Conditions on Powder Property and Dryer Performance. Dry. Technol. 2011, 29, 163–173. [Google Scholar] [CrossRef]
  37. Mohammadi, A.; Ahmadi, M.H.; Bidi, M.; Joda, F.; Valero, A.; Uson, S. Exergy analysis of a Combined Cooling, Heating and Power system integrated with wind turbine and compressed air energy storage system. Energy Convers. Manag. 2017, 131, 69–78. [Google Scholar] [CrossRef]
  38. Jokandan, M.J.; Aghbashlo, M.; Mohtasebi, S.S. Comprehensive exergy analysis of an industrial-scale yogurt production plant. Energy 2015, 93, 1832–1851. [Google Scholar] [CrossRef]
  39. Singh, G.; Singh, P.; Tyagi, V.; Barnwal, P.; Pandey, A. Exergy and thermo-economic analysis of ghee production plant in dairy industry. Energy 2019, 167, 602–618. [Google Scholar] [CrossRef]
  40. Yildirim, N.; Genc, S. Energy and exergy analysis of a milk powder production system. Energy Convers. Manag. 2017, 149, 698–705. [Google Scholar] [CrossRef]
  41. Li, B.; Li, C.; Huang, J.; Li, C. Exergoeconomic Analysis of Corn Drying in a Novel Industrial Drying System. Entropy 2020, 22, 689. [Google Scholar] [CrossRef]
  42. Gungor, A.; Erbay, Z.; Hepbasli, A. Exergoeconomic (Thermoeconomic) Analysis and Performance Assessment of a Gas Engine–Driven Heat Pump Drying System Based on Experimental Data. Dry. Technol. 2012, 30, 52–62. [Google Scholar] [CrossRef]
  43. Erbay, Z.; Hepbasli, A. Exergoeconomic evaluation of a ground-source heat pump food dryer at varying dead state temperatures. J. Clean. Prod. 2017, 142, 1425–1435. [Google Scholar] [CrossRef]
  44. Erbay, Z.; Hepbasli, A. Advanced exergoeconomic evaluation of a heat pump food dryer. Biosyst. Eng. 2014, 124, 29–39. [Google Scholar] [CrossRef]
  45. Gungor, A.; Tsatsaronis, G.; Gunerhan, H.; Hepbasli, A. Advanced exergoeconomic analysis of a gas engine heat pump (GEHP) for food drying processes. Energy Convers. Manag. 2015, 91, 132–139. [Google Scholar] [CrossRef]
  46. Wang, L.; Fu, P.; Yang, Z.; Lin, T.-E.; Yang, Y.; Tsatsaronis, G. Advanced Exergoeconomic Evaluation of Large-Scale Coal-Fired Power Plant. J. Energy Eng. 2020, 146, 04019032. [Google Scholar] [CrossRef]
  47. Erbay, Z.; Hepbasli, A. Assessment of cost sources and improvement potentials of a ground-source heat pump food drying system through advanced exergoeconomic analysis method. Energy 2017, 127, 502–515. [Google Scholar] [CrossRef]
  48. Hamdy, S.; Morosuk, T.; Tsatsaronis, G. Exergoeconomic optimization of an adiabatic cryogenics-based energy storage system. Energy 2019, 183, 812–824. [Google Scholar] [CrossRef]
Figure 1. Process flow diagram of the spray dryer system.
Energies 13 05622 g001
Figure 2. Grassmann’s diagram of the spray drying process.
Energies 13 05622 g002
Figure 3. Irreversibility rate distribution of the main components of the system.
Energies 13 05622 g003
Figure 4. Avoidable and unavoidable investment cost rate of the components of the system.
Energies 13 05622 g004
Figure 5. Avoidable and unavoidable exergy destruction cost rate of the components of the system.
Energies 13 05622 g005
Table 1. Composition of the different states.
StateDescriptionSoluble Solids (kg/kg)Water (kg/kg)Dried Air (kg/kg)
2Coffee extract0.4400.560-
23Soluble Coffee powder0.9700.030-
24Mixture BT0.0010.0090.990
29Mixture SD0.0040.0400.955
33Mixture S0.0380.0080.954
34Mixture FF0.1170.0010.882
Table 2. Definitions of fuel and product exergy for each component.
Component E ˙ P , k E ˙ F , k
LP E ˙ 3 E ˙ 2 W ˙ L P
HP E ˙ 5 E ˙ 4 W ˙ H P
HXE E ˙ 6 E ˙ 5 E ˙ 35 E ˙ 36
MHX E ˙ 9 E ˙ 8 E ˙ 37 E ˙ 38
SFBHX E ˙ 13 E ˙ 12 E ˙ 39 E ˙ 40
VF1HX E ˙ 16 E ˙ 15 E ˙ 41 E ˙ 42
VF2HX E ˙ 18 E ˙ 17 E ˙ 43 E ˙ 44
MF E ˙ 8 E ˙ 7 W ˙ M F
SFBF E ˙ 12 E ˙ 11 W ˙ S F B F
VF1F E ˙ 15 E ˙ 14 W ˙ V F 1 F
VF2F E ˙ 20 E ˙ 19 W ˙ V F 2 F
RFF E ˙ 22 E ˙ 21 W ˙ R F F
FF E ˙ 32 + E ˙ 31 E ˙ 30 W ˙ F F
SD E ˙ 23 E ˙ 6 E ˙ 34 E ˙ 13 + E ˙ 9 E ˙ 29
BT E ˙ 25 E ˙ 23 E ˙ 20 + E ˙ 16 E ˙ 24
S E ˙ 26 + E ˙ 28 E ˙ 25 E ˙ 27 + W ˙ S
B E ˙ 51 E ˙ 48 ( E ˙ 49 + E ˙ 47 ) E ˙ 50
CHX E ˙ 14 + E ˙ 17 + E ˙ 11 E ˙ 10 E ˙ 45 E ˙ 46
Table 3. Assumptions that are considered for real conditions (RC), unavoidable thermodynamic inefficiency conditions (RTI), and unavoidable investment cost conditions (UIC).
ComponentRCRTIUIC
Heat ExchangersΔTmin, HXE = 51ΔTmin, HXE = 30ΔTmin, HXE = 60
ΔTmin, MHX = 12ΔTmin, MHX = 10ΔTmin, MHX = 20
ΔTmin, SFBHX = 69ΔTmin, SFBHX, VFIHX = 20ΔTmin, SFBHX = 80
ΔTmin, VF1HX = 80ΔTmin, VF2HX = 80ΔTmin, VF1HX = 90
ΔTmin, VF2HX = 139ΔTmin, CHX = 4ΔTmin, VF2HX = 145
ΔTmin, CHX = 9ΔTmin, CHX = 15
Pumpsɳis = 60%ɳis = 86%ɳis = 65%
Fɳis = 60%ɳis = 90%0.85 Z ˙ k r e a l
Sɳelec = 78%ɳelec = 90%ɳelec = 78%
BTɳelec = 60%ɳelec = 85%ɳelec = 60%
Bɳcon = 90%ɳcon = 95%0.66 Z ˙ k r e a l
SDAP-Ratio = 18.8AP-Ratio = 8.60.90 Z ˙ k r e a l
Table 4. Cost balance equations and auxiliary equations for exergy costs of the system.
ComponentFuel Cost ExpressionProduct Cost ExpressionAuxiliary Equations
LP C ˙ 3 + W ˙ LP C ˙ 2 + Z ˙ LP -
HP C ˙ 5 + W ˙ HP C ˙ 4 + Z ˙ HP c 4 = c 3 + c 1
HXE C ˙ 6 + C ˙ 36 C ˙ 5 + C ˙ 35 c 36 = c 35 = c 51
MHX C ˙ 9 + C ˙ 38 C ˙ 8 + C ˙ 37 c 38 = c 37 = c 51
SFBHX C ˙ 13 + C ˙ 40 C ˙ 12 + C ˙ 39 c 40 = c 39 = c 51
VF1HX C ˙ 16 + C ˙ 42 C ˙ 15 + C ˙ 41 c 42 = c 41 = c 51
VF2HX C ˙ 18 + C ˙ 44 C ˙ 17 + C ˙ 43 c 44 = c 43 = c 51
MF C ˙ 8 + W ˙ MF C ˙ 7 c 7 = 0
SFBF C ˙ 12 + W ˙ S F B F C ˙ 11 -
VF1F C ˙ 15 + W ˙ VF 1 F C ˙ 14 -
VF2F C ˙ 20 + W ˙ VF 2 F C ˙ 19 c 19 = c 18
RFF C ˙ 22 + W ˙ RFF C ˙ 21 c 21 = c 18
FF C ˙ 31 + C ˙ 32 + W ˙ FF C ˙ 30 c 31 = c 32
SD C ˙ 29 + C ˙ 23 C ˙ 6 + C ˙ 9 + C ˙ 13 + C ˙ 34 c 29 = c 9
BT C ˙ 24 + C ˙ 25 C ˙ 16 + C ˙ 23 c 24 = c 16
S W ˙ S C ˙ 26 + C ˙ 27 C ˙ 25 C ˙ 28 c 28 = c 30 ; c 29 = c 31
B C ˙ 50 + C ˙ 51 C ˙ 47 + C ˙ 48 + C ˙ 49 c 47 = 0 ; c 49 = c 50
CHX C ˙ 11 + C ˙ 14 + C ˙ 17 + C ˙ 46 C ˙ 10 + C ˙ 45 c 10 = 0 ; c 45 = c 46
c 11 = c 14 = c 17
Table 5. Thermodynamic values of the streams.
State m ˙ (kg/h)T (°C)P (kPa) e C H (kJ/kg) e P H (kJ/kg) e K N (kJ/kg) E ˙ (kJ/h)
17.4121013220.220.02383
2528141012.2510.80.06891
3528157502.259.700.56593
4528167501.568.840.55776
55281854001.564.734.05470
65283954001.5613.44.010,045
79922281010.000.000.00
89922281050.010.001.010,286
999221781050.0129.91.0307,205
104002281010.000.000.00
111626151010.0020.270.0436
121626151050.0120.271.02126
131626961050.0126.971.013,031
141100151010.0020.270.0295
151100151050.0120.271.01438
161100851050.0125.021.06665
171276151010.0020.270.0342
181276261010.0020.000.06
191101261010.0020.000.06
201101271050.0120.001.01146
21175261010.0020.000.01
22175271050.0120.001.0182
23209801015.808.246.04202
242203581010.0021.490.03298
25207351015.800.181.01450
270.04301014.180.070.00.04
26200301015.800.020.01163
286.96301015.800.020.040
2912,065961000.0017.452.1114,790
3014,268941000.0036.940.099,094
3114,252941050.0036.940.9111,685
321694100164711.20.026,942
331823010116470.010.026,763
341984010116470.260.927,009
352090704804180.018,231
362090702.5023.90.0537
3780619012504804990.0789,231
3880619012502.5029.00.025,387
39801657004807530.098,620
40801657002.501040.08507
41431657004807530.053,008
42431657002.501040.04581
43101657004807530.012,328
44101657002.501040.01063
4525,43825002.505.130.0194,111
4625,43865002.503.710.0157,878
4795919012504804990.0938,861
4895910412502.5039.30.040,075
492217281010.000.000.00
50772810143,2930.000.03,332,277
51229465010126.03310.0817,815
Table 6. Results of the exergy analysis of all the components of the spray drying system.
Component E ˙ F (kJ/h) E ˙ P (kJ/h) n e x (%) n e n (%) y D , k * y D , k
SD205,44632,85216.093.90.0580.040
LP79202983.827.20.0030.002
HP19,8003071.534.20.0070.005
HXE17,694457625.976.40.0050.003
MHX763,844296,91838.979.40.1740.116
SFBHX90,11410,90612.181.40.0300.020
VF1HX48,427522710.888.60.0160.011
VF2HX11,2643363.069.20.0040.003
MF66,60010,28615.446.30.0210.014
SFBF19,80016908.524.00.0070.005
VF1F14,40011437.922.40.0050.003
VF2F14,40011407.923.30.0050.003
RFF19801819.229.40.0010.001
FF108,00039,53436.651.50.0260.017
CHX36,23310723.027.80.0130.009
B2,514,427898,78635.773.30.6110.374
BT79205466.969.90.0030.002
S36002476.9n/a0.0010.001
Table 7. Results of the thermoeconomic analysis.
ComponentcF ($/kJ) C ˙ D ($/h) Z ˙ k + C ˙ D ($/h) r k fk (%)
SD6.2 × 10−4106.8109.60.022.50
MHX1.3 × 10−460.561.60.011.73
B6.7 × 10−613.114.40.079.03
SFBHX1.0 × 10−48.28.30.022.06
VF1HX1.0 × 10−44.44.60.022.61
BT5.7 × 10−44.24.50.065.71
CHX7.0 × 10−52.43.00.2017.43
HXE1.4 × 10−41.91.90.011.37
VF2HX1.0 × 10−41.11.20.033.17
FF2.6 × 10−51.81.90.057.83
MF2.6 × 10−51.51.60.089.00
HP2.6 × 10−50.51.11.1453.73
RTF2.6 × 10−50.050.23.3078.42
SFBF2.6 × 10−50.50.60.3326.52
VF2F2.6 × 10−50.30.50.4533.02
VF1F2.6 × 10−50.30.50.4533.03
LP2.6 × 10−50.20.41.2155.73
S2.6 × 10−50.10.48.1678.49
Publisher’s Note: MDPI stays neutral with regard to jurisdictional claims in published maps and institutional affiliations.

