Article

Carbon Monoxide Formation during Aerobic Biostabilization of the Organic Fraction of Municipal Solid Waste: The Influence of Technical Parameters in a Full-Scale Treatment System

by
Sylwia Stegenta-Dąbrowska
1,
Peter F. Randerson
2,*,
Sarah R. Christofides
2 and
Andrzej Białowiec
1
1
Institute of Agricultural Engineering, Faculty of Life Sciences and Technology, Wrocław University of Environmental and Life Sciences, 37a Chełmońskiego Str., 51-630 Wrocław, Poland
2
School of Biosciences, Sir Martin Evans Building, Cardiff University, Museum Avenue, Cardiff CF10 3AX, UK
*
Author to whom correspondence should be addressed.
Energies 2020, 13(21), 5624; https://doi.org/10.3390/en13215624
Submission received: 10 September 2020 / Revised: 20 October 2020 / Accepted: 24 October 2020 / Published: 27 October 2020
(This article belongs to the Special Issue Biowaste Management)

Abstract

:
The present study sought to investigate the formation of carbon monoxide (CO) during aerobic biostabilization (AB) of the organic fraction of municipal solid waste (OFMSW) in forced aerated piles. Understanding the factors influencing CO formation may be important not only for safety, but also for environmental and technical reasons. The objective of the study was to determine the effect of the technical parameters of the piles on the concentration of CO in the process gas during AB of the OFMSW in a full-scale waste treatment system: rate of waste aeration (from 3365 to 12,744 m3∙Mg−1), waste mass loads in the pile (from 391 to 702 Mg), thermal conditions, application of sidewalls as an element of pile bioreactor construction, concentration of O2 and CO2 in the waste piles and the duration of the process from 6 to 9 weeks. The temperature and concentration of O2, CO2, CO, CH4 were measured in each pile at weekly intervals. All six reactors provide stable thermal and aerobic conditions, but the presence of CO was observed, ranging from a few to over 2000 ppm, which demonstrated that ensuring optimum conditions for the process is not sufficient for CO to be eliminated. A moderate, non-linear rise in CO concentration was observed along with a rise in the temperature inside the reactors. Concentrations of CO were not highly correlated with those of O2 or CO2. An increase in waste mass loads increased the CO concentration in waste piles, while application of sidewalls decreased CO concentration. Increasing aeration rate had an influence on CO production, and the highest CO concentrations were noted under air flow rate 5.3 m3·Mg−1·h−1.

Graphical Abstract

1. Introduction

Carbon monoxide (CO) emissions arising from the composting of green waste [1], organic waste [2] and the organic fraction of municipal solid waste (OFMSW) [3,4], may be a hazard in the work environment, with the risk of intoxication and even death [3]. Mostly, OFMSW is stabilized in mechanical and biological treatment (MBT) plants [5]. Due to the increasing number of MBT plants in Poland [6], and in Europe more generally (490 facilities [7]), research on the influence of technological parameters on CO formation during the biological stabilization of OFMSW is both important and novel.
To date, studies on emissions from composting have been concerned mainly with carbon dioxide (CO2), methane (CH4) and nitrous oxide (N2O) [8], or have focused only on CH4 [9] or CO2 emissions [10]. Therefore, the knowledge on CO formation during waste composting or aerobic biostabilization (AB) of OFMSW is relatively poor, considering the importance of limiting workers’ exposure to CO.
There are several studies attempting to explain the origin of carbon monoxide from biological processes. Some researchers pursue the hypothesis that carbon monoxide is of physico-chemical and thermo-chemical origin [3,11] and that these two types of CO production pathways can co-exist in material at the same time. However, other studies point out that moisture content or type of material also have an impact on CO emissions [12]. Haarstad et al. [2] noted much larger concentrations of carbon monoxide during aerobic than in anaerobic processes, and Hellebrand and Kalk [13] linked CO release directly to the availability of oxygen.
Research by Hellebrand and Schade (2008) into CO emissions from sterilized and non-sterilized waste does not confirm the role of microorganisms; instead, the authors claim that the process is promoted by increased temperatures and requires oxygen. However, there are studies describing the production of carbon monoxide by strains of bacteria found in piles of composted waste, such as methanogenic bacteria [14] or sulphate-reducing bacteria [15]. Carbon monoxide dehydrogenase, an enzyme present in methanogenic bacteria, may act as a mediator in the reduction of CO2 to CO, but may also be a catalyst in a reverse reaction in which CO is oxidized to CO2 [16]. Research conducted by Phillip et al. [3] confirms this link and points to a high correlation between CO and CO2. Therefore, directly or indirectly, CO formation may be related to respiration activity, as CO2 mostly is a product of biological oxidation. However, aeration of the waste indirectly influences the biological activity, moisture content, transport of vapour, natural ventilation, oxygenation of the pile and temperature distribution [17], all of which finally affect CO formation. The specific influence of these parameters on CO net production is not known.
In full-scale operations, adequate aeration is essential to ensure effective aerobic decomposition of OM. Regulating the intensity of air supply affects heat losses and offers a means of controlling the temperature inside the waste pile. Reactors with intensive aeration systems, used in the biological stabilization of OFMSW, facilitate quick decomposition of organic matter, but may also lead to emissions of undesirable gases [18]. Chadwick et al. [19] have demonstrated that gas emissions depend on process conditions. Emissions of GHGs are affected by various composting parameters, including mechanical agitation, moisture content and temperature [20], the input material, its porosity and pH [21].
Despite this, the effect of technical parameters on carbon monoxide production during the AB of OFMSW is not well known, and the available knowledge of these phenomena and effect of the process conditions comes mainly from experiments involving the composting of animal and plant material. Additionally, the Best Available Techniques for Waste Treatment [22] gives no specific recommendations on the technical parameters for minimising CO production. Therefore, we test the concept that mitigation of CO production during AB of OFMSW may be achieved by modification of aeration rate, waste mass loads, temperature control, and details of the reactor construction.
The present study was conducted to determine the effect of intensity of waste aeration, waste mass load, and reactor construction on the formation of CO during OFMSW biostabilization under full-scale conditions. These hypotheses were tested using the raw data previously published [23].

2. Materials and Methods

As the materials and methods were described in detail by Stegenta-Dąbrowska et al. [23], here we include only the most relevant information.

2.1. Waste Biostabilization Technology

The study was conducted at a municipal waste treatment plant in Poland. Mixed municipal waste was processed initially by mechanical separation due to screening producing a ≤80 mm OFMSW fraction. The entire OFMSW was then loaded via a feeding mechanism and a charging hopper onto trucks transporting the waste to biostabilization sites.
The OFMSW treatment in this facility consisted of AB in piles with forced aeration. To form the piles, waste was placed over three linear aeration channels forming a trapezoidal pile (up to 3 m high, ca 8 m wide, ca 50 m long) and was then covered with a semipermeable membrane held down by means of sand-filled firehoses placed along their long edges. The membrane had three layers: a lower, abrasion-resistant layer in contact with waste; a porous mid-layer (ePTFE), permeable to air and vapour, but not volatile organic compounds, H2S or NH3; and an external protective layer impermeable to liquid water and resistant to UV radiation.
After covering each pile, temperature sensors were inserted, linked by optical fibre cables to a central control unit which also controlled the air blowers. After the pile had been prepared, forced aeration was started to maintain aerobic conditions. Blowers supplied air via three channels running almost the entire length (45 m) beneath each reactor, covered by a perforated cast iron plate and blocked at the far end, ensuring penetration of air through the waste material. Aeration channels also enabled leachate generated during AB to flow out through a water-filled siphon (water height ~60 cm), preventing the escape of air through the leachate collection system. Gaseous and dust pollutants in the process air were retained by passing through the waste mass and semipermeable membrane, and purified process gas then dispersed to atmosphere. At the end of the biostabilization process (after 6 to 9 weeks), the membrane was taken off and the waste removed with a loader, thus ending the waste pile work cycle.

2.2. Methodology

2.2.1. Monitoring the Treatment Piles

As this investigation was conducted at field scale, under the normal regimes for processing OFMSW in which multiple operational parameters vary both in space and time, we adopted the strategy of generating a multivariate set of observations for inductive (hypothesis-generating) data analysis. Six waste piles with different configurations were monitored throughout the AB process in an attempt to determine the effects of aeration rate, waste mass load, and reactor construction on changes in the concentration of process gases, with special attention paid to carbon monoxide. The experimental configuration was as follows:
  • Piles A1 and A2 represented the variant with lower waste mass load ranging from 391 to 465 Mg, and higher aeration rate between 6.6, and 10.7 m3·Mg−1·h−1;
  • Piles B1, B2, C1, and C2 represented the variant with higher waste mass load from 611 to 702 Mg, and lower aeration rate between 4.4, and 6.5 m3·Mg−1·h−1;
  • Piles C1 and C2 differed from A1, A2, B1 and B2 by being confined by brick sidewalls running the length of the pile, over which the membrane was stretched. In piles A1, A2, B1 and B2, the semipermeable membrane covering the piles was attached to the ground by means of firehoses filled with sand. In other respects, piles C1 and C2 were similar to B1 and B2, having similar waste mass load from 626 to 672 Mg, and aeration rate between 4.6, and 6.1 m3·Mg−1·h−1;
  • The duration of the full cycle of AB lasted nine weeks in piles (A1, A2 and B1) and six weeks in the remaining piles (B2, C1 and C2).
The monitoring configuration, and technical parameters of all piles are detailed elsewhere [23].

2.2.2. Material and Course of Experiment

The OFMSW morphological composition had relatively low heterogeneity, confirmed by coefficients of variation not exceeding 7.8% based on raw data from Stegenta-Dąbrowska et al. [23], due to being mechanically screened through a sieve. For each of the six waste piles, procedures for building, initial waste sampling, dismantling, and final sampling were similar. Temperatures and gas concentrations inside the pile were measured at weekly intervals.

2.2.3. Measurements of Waste Properties

Six samples of the OFMSW were taken at both the start and end of the process to characterise its initial and final properties [23]. Sampling and testing procedures, in accordance with Polish standards, included: moisture content (PN-EN 14346:2011), loss on ignition (LOI) (PN-EN 15169:2011), total organic carbon (PN-EN 15936:2013), and morphological composition (PN-93/Z-15006). The total waste mass before and after process was calculated on industrial scales to accuracy ±0.1 Mg. The raw data are available elsewhere [23].

2.2.4. Measurements of Temperature and Gas Distribution in the Piles

Procedures for gas and temperature monitoring inside the waste piles are detailed elsewhere [23]. Gas concentrations within the pile were determined using a tubular stainless-steel perforated probe, lined with a silicone tube through which gas was withdrawn into an electrochemical analyser Kigaz 300 (Kimo Instruments, Chevry-Cossigny, France). The probe unit was sealed to prevent atmospheric air entering, hence gas captured at specific points within the waste pile is directed to the analyser due to negative pressure generated by its internal pump [23]. Temperature at each gas sample point was measured by a thermocouple located at the probe tip. During gas sampling, the semipermeable membrane was removed from the pile.
Measurements were taken at distances of 2.5, 17.5, 32.5 and 47.5 m from the blower (Figure 1), at three heights (H) which differed depending on the size of each pile [23]. Separate measurements were taken on the right and left sides of the pile. In addition, on the left side (looking from the fan position) at each distance point at mid-height, a “deep” measurement was taken to illustrate the concentration of gases at depth within the pile. Locations of gas samples along the length and cross-sections of the pile, (depending on the presence of sidewalls) are detailed in Figure 1 and Stegenta-Dąbrowska et al. [23]. On each sampling occasion, a total of 28 measurements were made within each pile (7 across × 4 along), which represents the spatial variation within each pile. In the dataset given by Stegenta-Dąbrowska et al. [23], the original, unprocessed data are presented. Gas concentrations are recorded as 10,000 or 15,000 ppm for CH4, and 1000 or 5000 ppm for CO, which denote out-of-range values or instrument error. All such data were excluded from the dataset and statistical analyses reported here. It should be noted that the accuracy of CO measurement changes in the range: 0–200 ppm (±5 ppm); 201–2000 ppm (±5%); 2001–8000 ppm (±10%).

2.3. Statistical Data Analysis

A Generalized Additive Model (GAM) was applied to the combined CO data for the waste piles. GAMs are a class of statistical model in which (some of) the usual linear relationships between the response and predictors are replaced by several nonlinear smooth functions to model and capture the nonlinearities in the data
g ( μ ) = b 0 + f 1 ( x 1 ) + f 2 ( x 2 ) + , + f p ( x p )
where g(μ) is the generalized function of CO; f(x1…p) are non-linear functions of predictor variables (mass, aeration etc.).
A GAM was deemed to be the most appropriate model as data exploration showed persistent non-linear relationships between CO and time which were unique to each pile. The purpose of the model was to determine which other predictors influenced these relationships. The time–pile interaction was modelled as a thin-plate regression spline, and the linear predictors aeration, construction (side walls vs. no side walls) and starting mass (high vs. low) were added in all possible combinations. The Akaike Information Criterion was calculated for each model, which were ranked from lowest AIC (best) to highest AIC (worst). The dataset was split into two (piles A1, B1 and C1 in one group, and piles A2, B2 and C2 in the other) and the process was repeated to test the robustness of the conclusions.
Principal component analysis (PCA) was used to understand the variation and correlations among the different parameters of the AB process and to screen for the most important factors influencing CO formation. PCA (a linear dimensionality reduction algorithm) can aid the interpretation of complex multi-factorial relationships by means of simple displays of the major variation among the measured parameters. Initially, a PCA model for the combined data was determined, followed by three separate models for pile pairs A1-A2, B1-B2, and C1-C2. Analyses were made using Statistica 13 (TIBCO Software Inc., Palo Alto, CA, USA) and R statistical software [24,25] with package mgcv [26].

3. Results and Discussion

3.1. Process Effectiveness

The composition of material used in AB influences the changing properties of the waste during the process. In this study, the initial moisture concentration in all piles was ca 40% Stegenta-Dąbrowska et al. [23], which is below the optimum range of 50 to 60% according to Liang et al. [27]. Removal of moisture (61% and 71%) was much greater in piles with lower initial mass (A1 and A2) (Table 1). High moisture removal efficiency could result from the high aeration rate, ca 12,700 m3·Mg−1 Stegenta-Dąbrowska et al. [23], which is close to the recommended rate for waste biodrying [28]. Similar results were achieved by Ermolaev et al. [29] who shortened the length of the composting pile by half, which significantly increased the effectiveness of water removal with the same technical parameters. The use of sidewalls, a decrease in aeration rate [23], and shortening of the process duration in reactors C1 and C2 significantly reduced the moisture removal rate to ca 26% (Table 1). A similar rate of moisture removal was noted for piles B1 and B2, characterized by the highest initial waste mass. The aeration rates in piles B1, B2, C1, and C2 were more suitable for biostabilization than for biodrying. However, removal efficiencies were higher in the present study compared to the process carried out by Mulbry and Ahn [30], in which a decrease of ca 10% was achieved.
The initial organic matter concentration expressed as loss on ignition (LOI) was between 30 and 38% d.m., while initial total organic carbon (TOC) changed from 17.6 to 22.0% [23], which is just over half of that observed by Evangelou et al. [31] and Komilis et al. [32] in large-scale MBT facilities. The longer processing period in piles A1, A2, (9 weeks) greatly increased the removal of organic matter (LOI and TOC) in comparison with piles B2 and C2 (6 weeks) (Table 1). However, pile B1, where the process duration was also 9 weeks, showed a reduced organic matter removal rate, probably related to its higher waste load (Table 1). The presence of sidewalls in pile C2 decreased both LOI and TOC removal (Table 1).
Processing time also influenced the decrease in waste mass (33.6 to 35.8% in 9-week piles, and 25.9 to 27.4% in 6-week piles (Table 1). These results are similar to the average values achieved in similar facilities using municipal waste AB technology in Poland [33]. The lowest removal efficiencies of mass, moisture and organic matter occurred in piles C1 and C2, constructed with sidewalls. (Table 1). In these piles, the fine fraction concentration of the MSW (granulometric size < 20 mm), was exceptionally high (73.7 to 77.0%) [23], compared to other piles (66.3 and 68.4%) and to the average organic fraction of MSW in Poland [33]. This may be due to the side walls inhibiting the efficient penetration of air throughout the waste pile.

3.2. Thermal Conditions of the Process

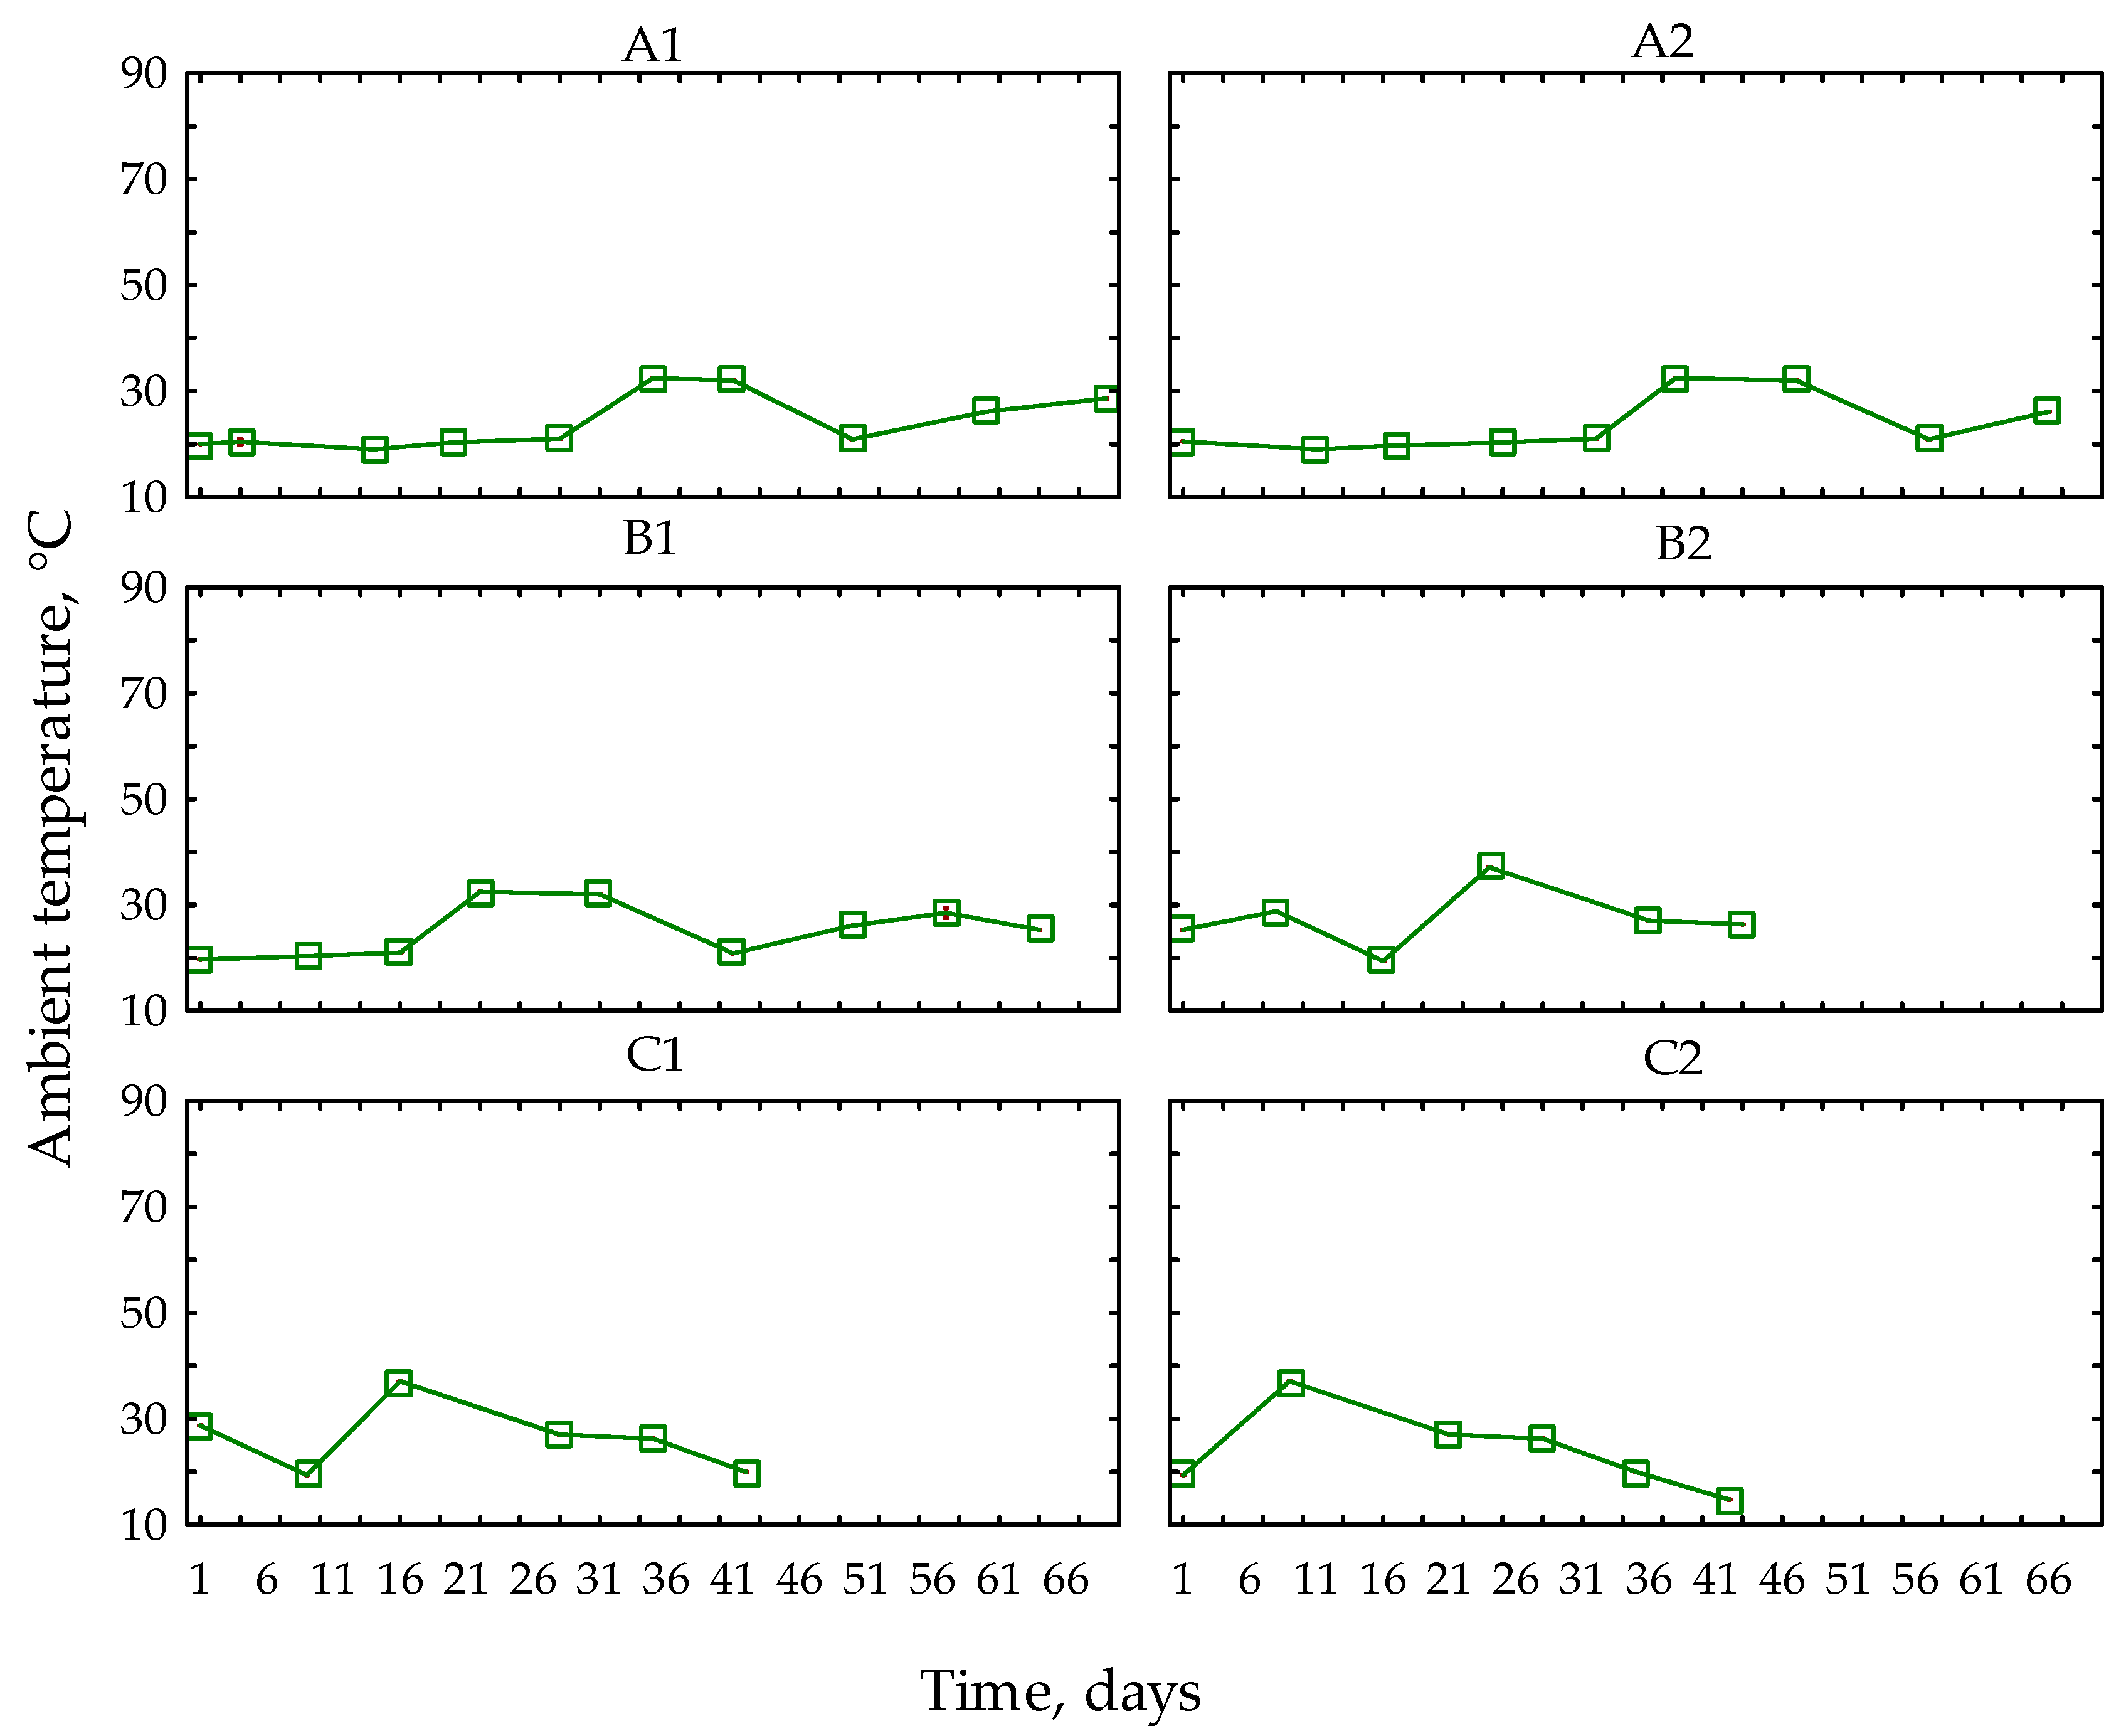
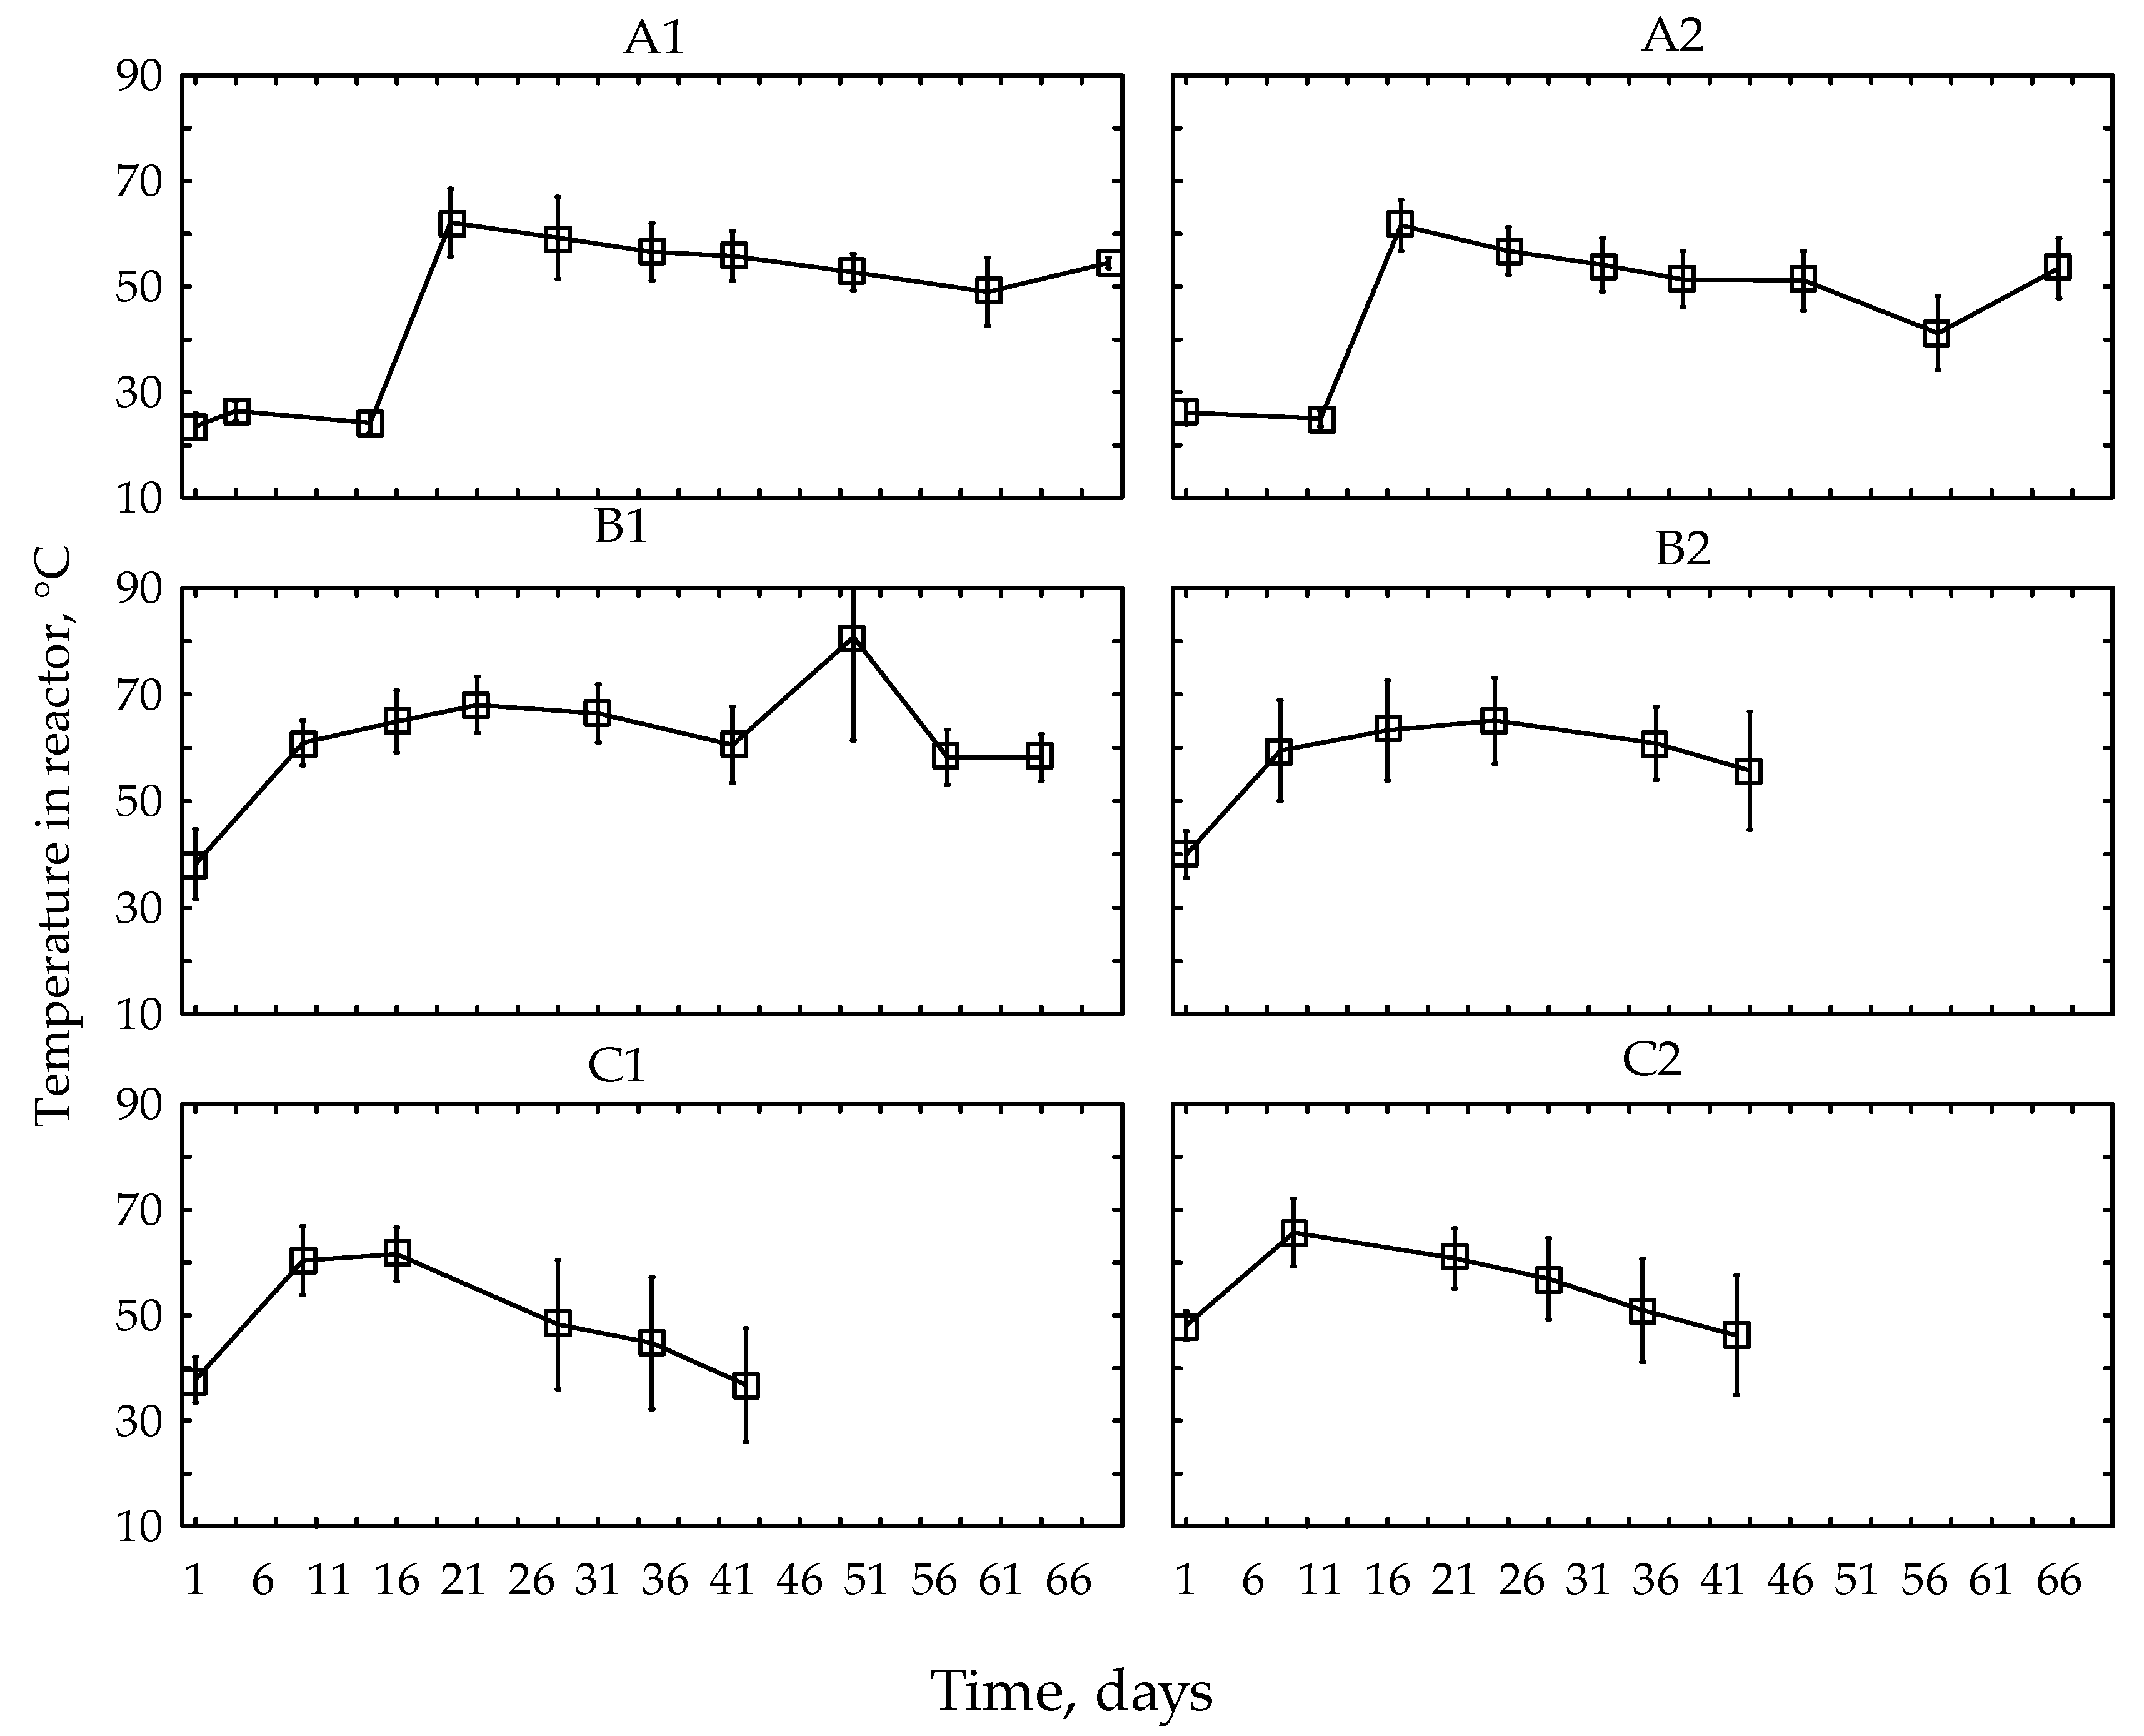
The process was characterized by relatively small variation in temperature within and between the piles, after an initial rise (Figure 2 and Figure 3). During pile construction, ambient temperatures (ca 20 °C) were similar in all cases (Figure 2). The lowest initial temperatures occurred in piles with the lower input waste mass (A1 23 °C; A2 26 °C) (Figure 3), followed by a lag-phase of about two weeks and a sharp rise to over 60 °C. Similar temperature changes were observed in a reactor without forced aeration during tests conducted by Jiang et al. [34]. However, other studies carried out on a much bigger scale [30] showed that static piles may self-heat without the lag-phase. An experiment conducted in similar conditions [29] showed that, despite continuous operation, blowers sometimes fail to maintain the desired temperature. In the case of piles A1 and A2, aeration rate may have been too great during the initial low-temperature phase, dissipating the heat generated by organic matter decomposition and delaying the internal warming. The effect of a temperature decrease in MSW due to increased aeration was also observed by Shen et al. [35].
The remaining piles were characterised by a much higher initial temperature (B1 38.2 °C; to C2 48.1 °C) and a rapid temperature rise by day 9 to 60 °C, similar to the study by Adani et al. [36]. Temperatures in piles C1 and C2 followed the three typical degradation phases (mesophilic; thermophilic; cooling), whereas in A1, A2, B1 and B2 the cooling phases were not observed within the process timescale. This pattern of temperature change is typical in biostabilzation of MSW [36], as well as in composting green waste [37], kitchen waste [38] and duck manure with vermicomposting [39].
The use of sidewalls (e.g., in pile C2) proved to be disadvantageous to maintaining the temperature, causing disruptions in the thermal conditions inside the reactor, which manifested in a lowering of the temperature and acceleration of the cooling phase in comparison with pile B2 with the same waste retention time. In addition, the temperature measured on the last day of the process in C1 was the lowest, ca. 38 °C, while in the remaining piles it was above 48 °C (Figure 3). In all piles, temperatures were mostly below the optimum of 59 °C [40] (Figure A1). The longest period with the optimum temperature was maintained in pile A1 (from the end of the 3rd to 6th week). In pile A2, that point was reached only at the end of the 3rd week. In pile B1 the optimum temperature was achieved in 6th, 8th, and 9th week, while in B2 only in 5th week. In piles C1 and C2, temperatures were optimal only during 2nd to 3rd, and 3rd to 4th weeks, respectively (Figure 3). Temperatures never reached 70 °C, above which biological processes would be inhibited [40].
Differences in aeration activity had an impact on temperature. Increasing the aeration rate led to greater heat production due to enhanced oxidation, but on the other hand, it also increased heat transport from the pile [41]. Reduced organic matter degradation due to lower air supply had a greater influence on pile heat balance than convective heat transport from process air. When total aeration was below 5000 m3·Mg−1 lower temperatures were observed, probably due to slowing down the rate of organic matter degradation. In addition, constructing the reactor with sidewalls (C1, C2) could influence temperature, despite similar aeration. Reducing the waste mass placed in the reactor led to a substantial decrease in the average temperature by ca 15 °C in comparison with the process over the same period but with a higher mass of waste. On the other hand, decreasing the process duration to six weeks in pile B2 did not cause any disruptions in the thermal conditions. The most favourable thermal conditions (slightly above optimal temperature [40]) were achieved when the process lasted nine weeks and with a larger input mass (pile B1).

3.3. Changes in Gas Concentrations during Waste Aerobic Biostabilization

Changes over time in gas concentrations are illustrated graphically and discussed in the following sections. As in the case of temperature measurements above, each point represents the overall average condition within each pile, integrated across the width and along the whole length, as indicated by the sampling scheme in Figure 1.

3.3.1. O2 Concentrations in Waste Piles

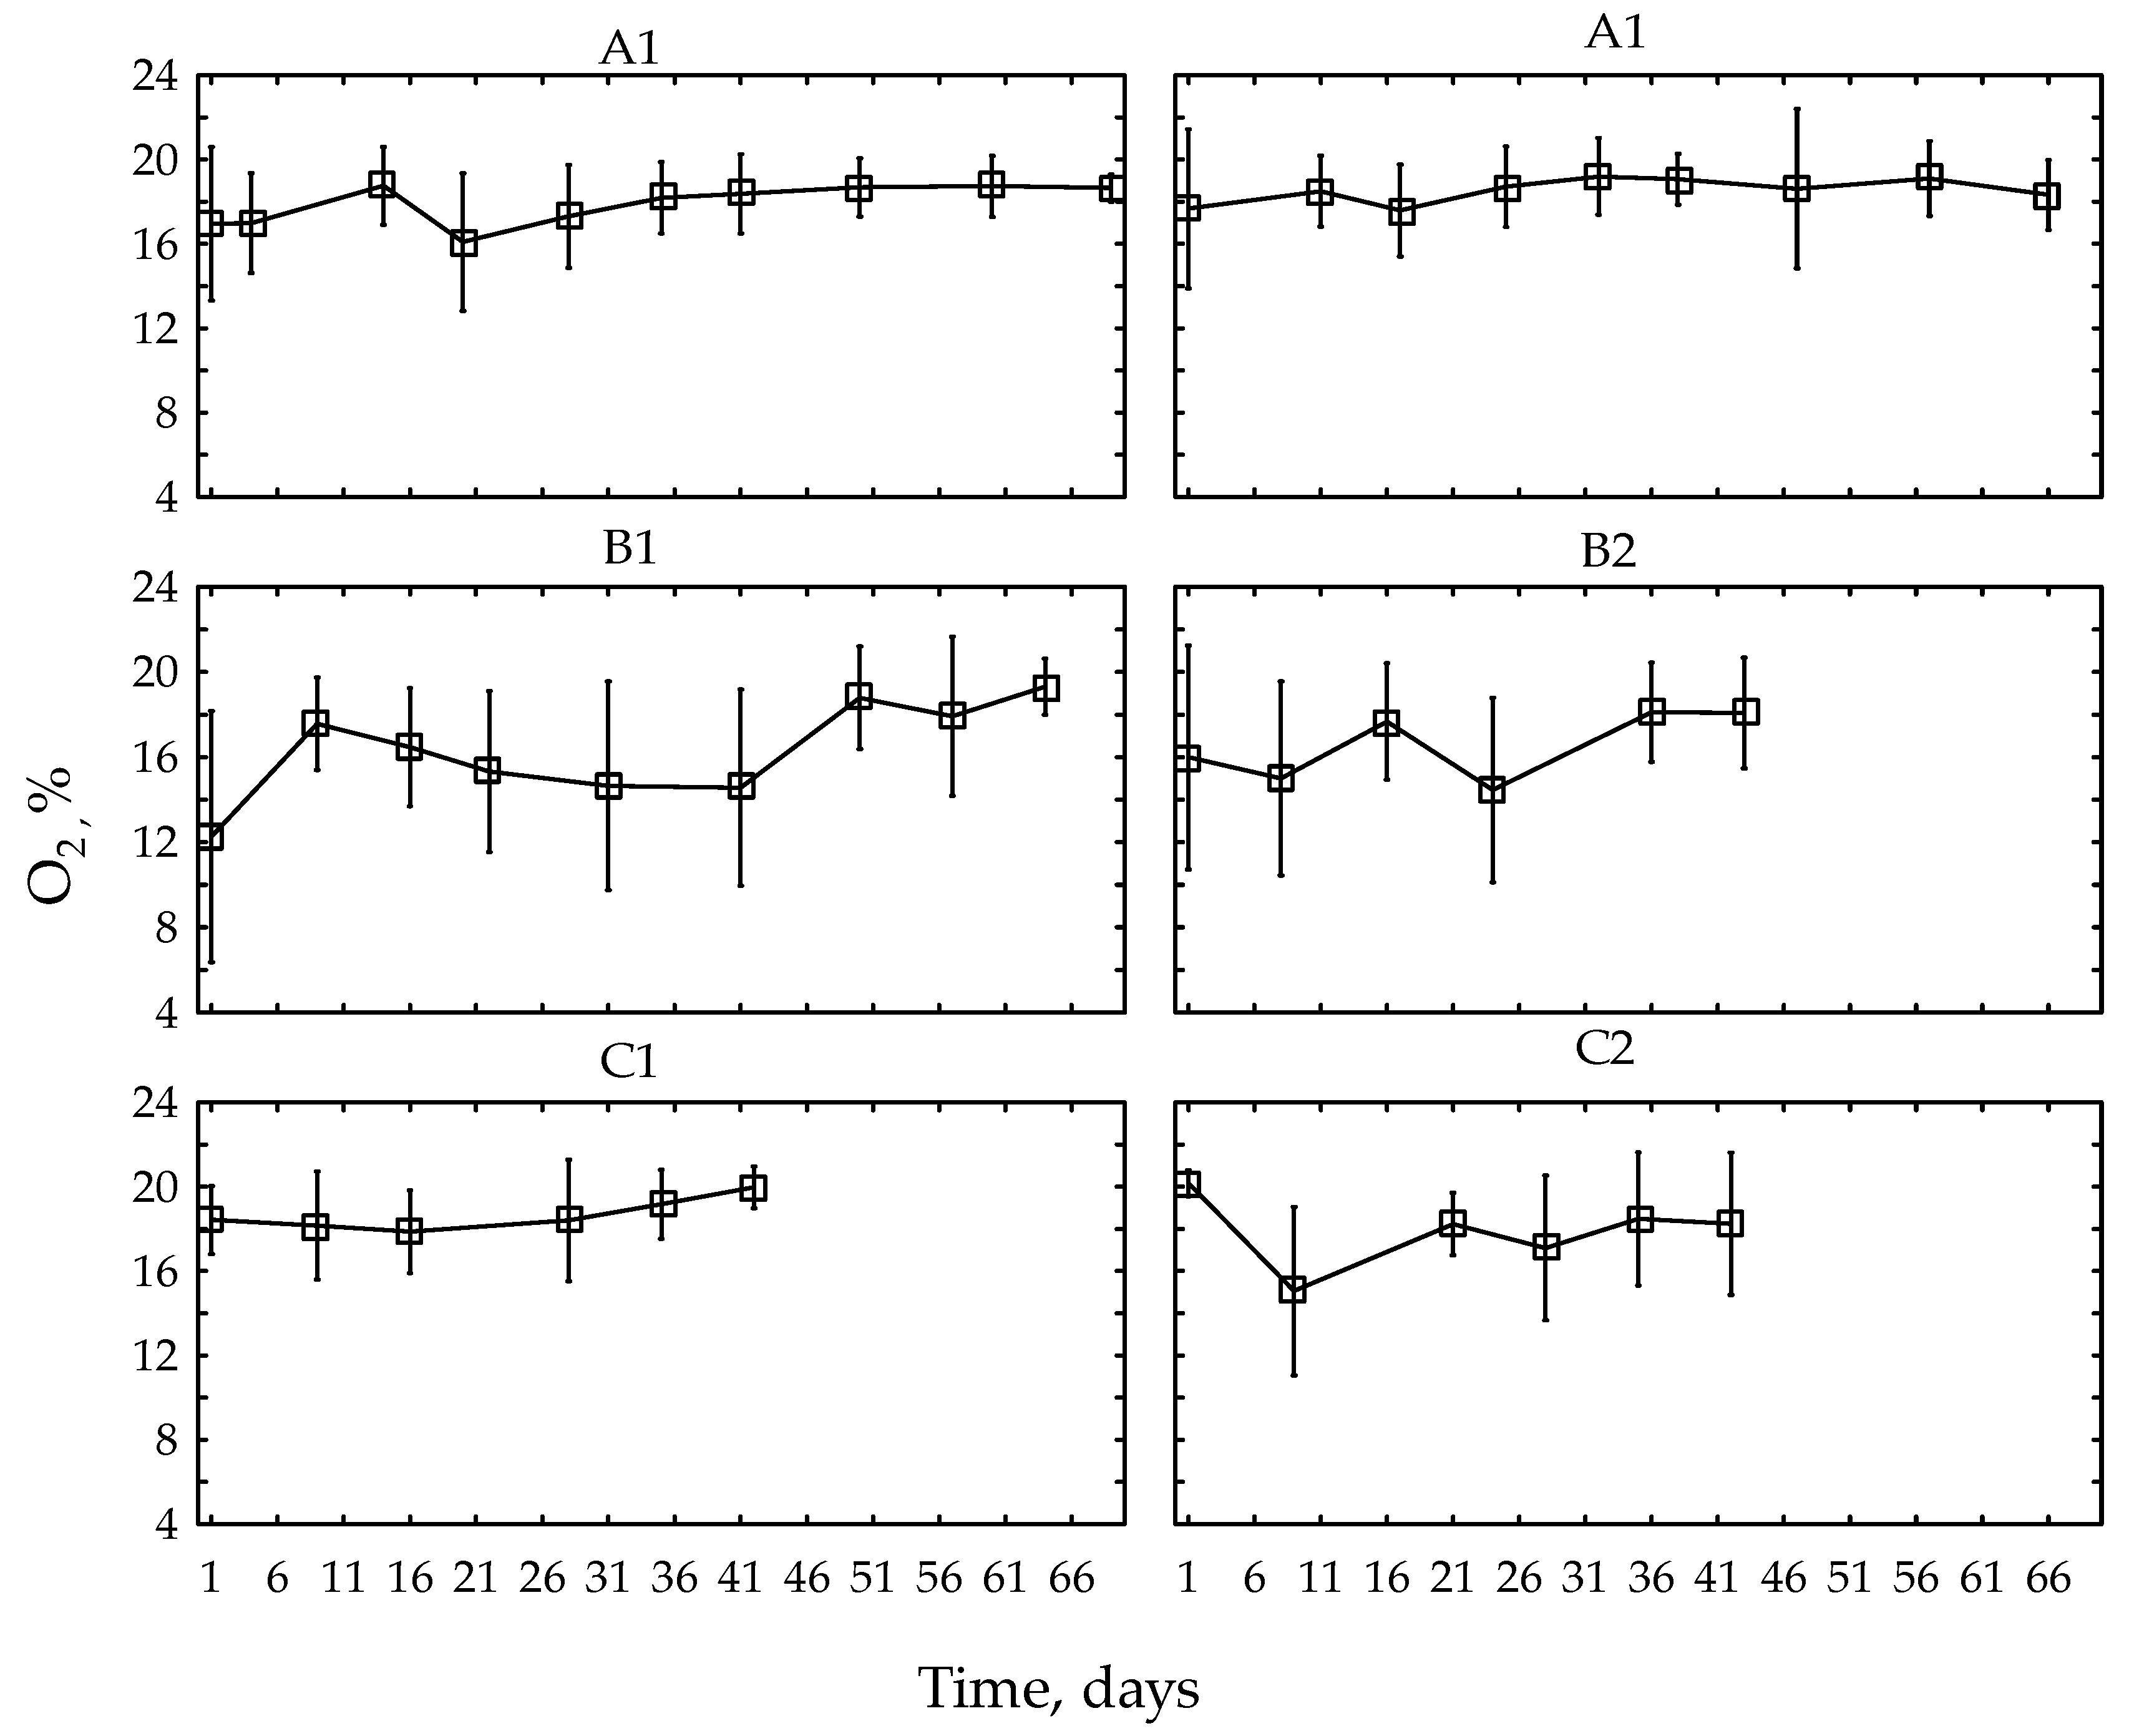
In all piles, aerobic conditions prevailed during the treatment, indicating that the applied aeration rates ensured adequate ventilation within the processing waste mass. Pile B1 showed the lowest initial oxygen concentration, which reflects the most intense phase of biodegradation at the start of the process [34] when oxygen deficits may occur. Slight changes in the average percentage concentration of oxygen during the process usually did not exceed 1%. The greatest average change was observed in pile B1, from 12.3% at the beginning of the week to 19.3% towards the end of the process. In all piles, the process ended with an average O2 concentration above 18% (Figure 4). However, the wide standard deviation bars indicate great variability in the spatial distribution of oxygen within all piles (Figure A1).
The aeration values observed in the study by Stegenta-Dąbrowska et al. [23] were below the recommended [33] value of >10 m3·Mg−1·h−1, but this did not appear to have a negative effect on the concentration of oxygen in the piles. This could be due to the relatively low concentration of organic matter [23].

3.3.2. CO2 Concentration in Waste Piles

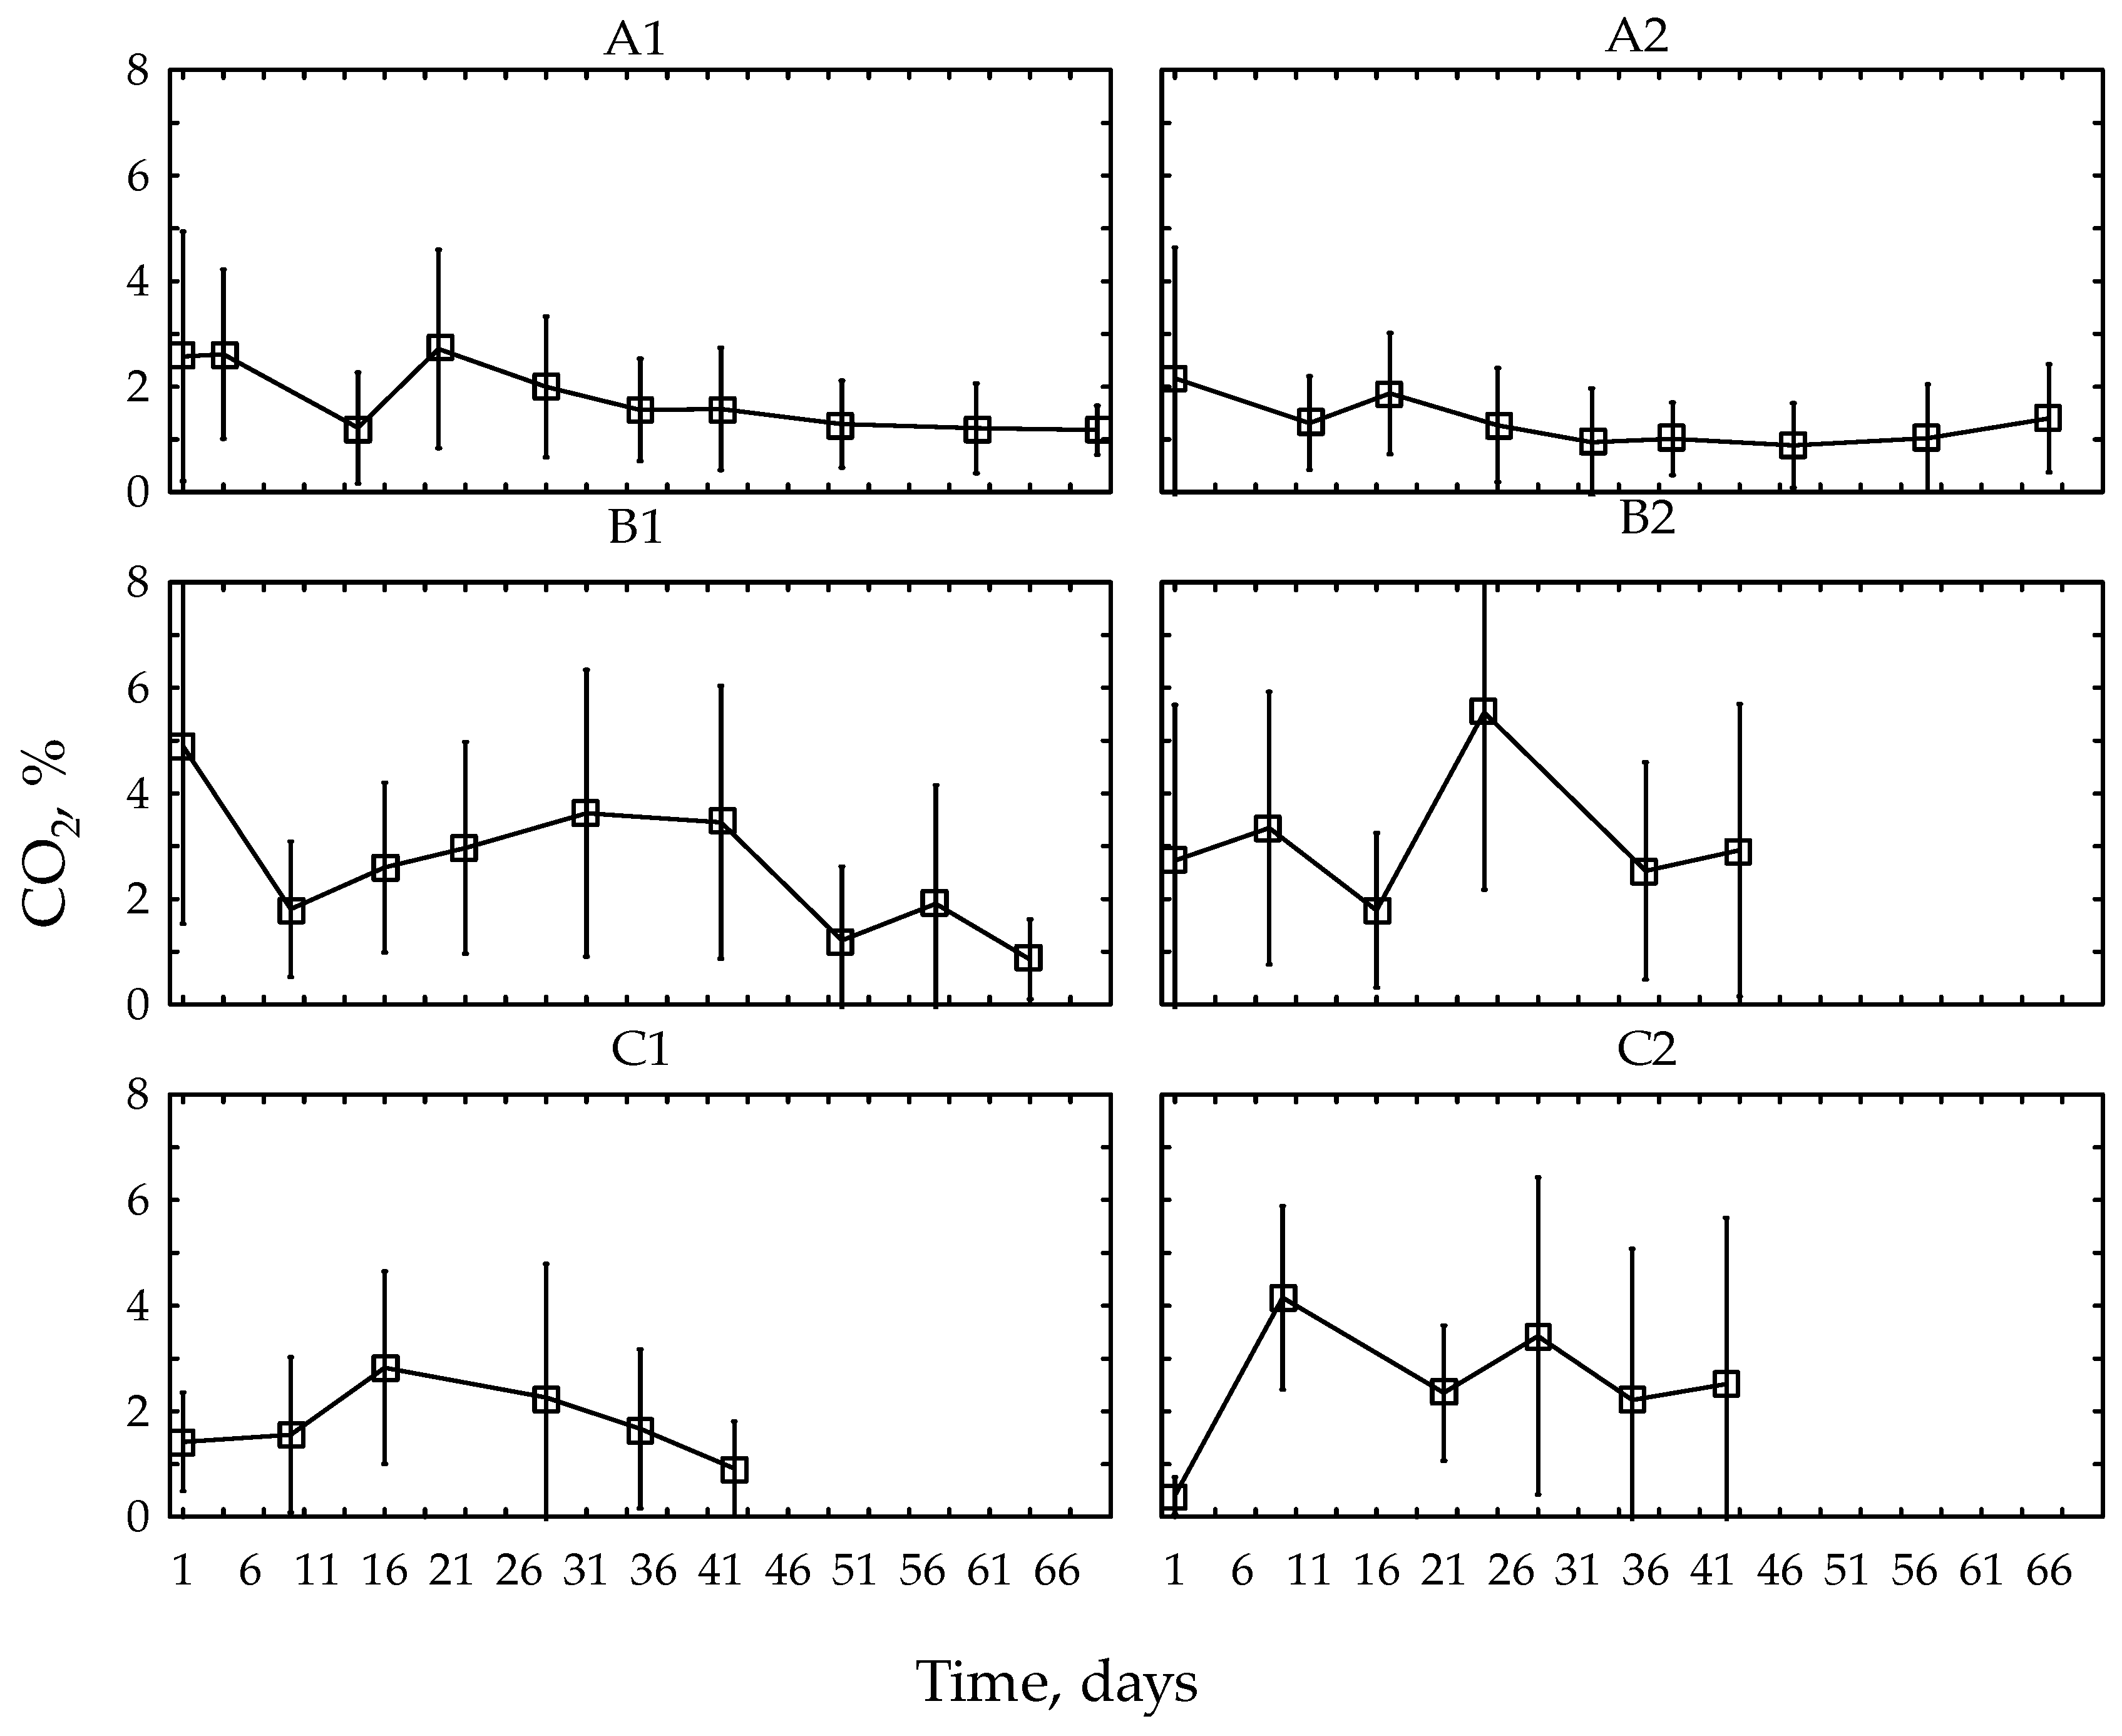
As with O2 concentration, the high variability of the CO2 concentration indicated great spatial heterogeneity of this gas (Figure 5; Figure A1). Average concentrations observed were between 0.4 and 5.5%, with a majority around 2%. The results correspond to those obtained by Clemens and Cuhls [42] from various types of piles composting municipal waste, and by Stegenta et al. [43] from green waste composting. The similar results were also obtained in home composting conditions [44]. There was no observable effect of sidewalls, aeration, or waste mass load on carbon dioxide concentration, which remained low throughout the entire biostabilization process in all piles, corresponding with high O2 concentration, and again confirming that aeration of the piles was consistently high.

3.3.3. CH4 Concentration in Waste Piles

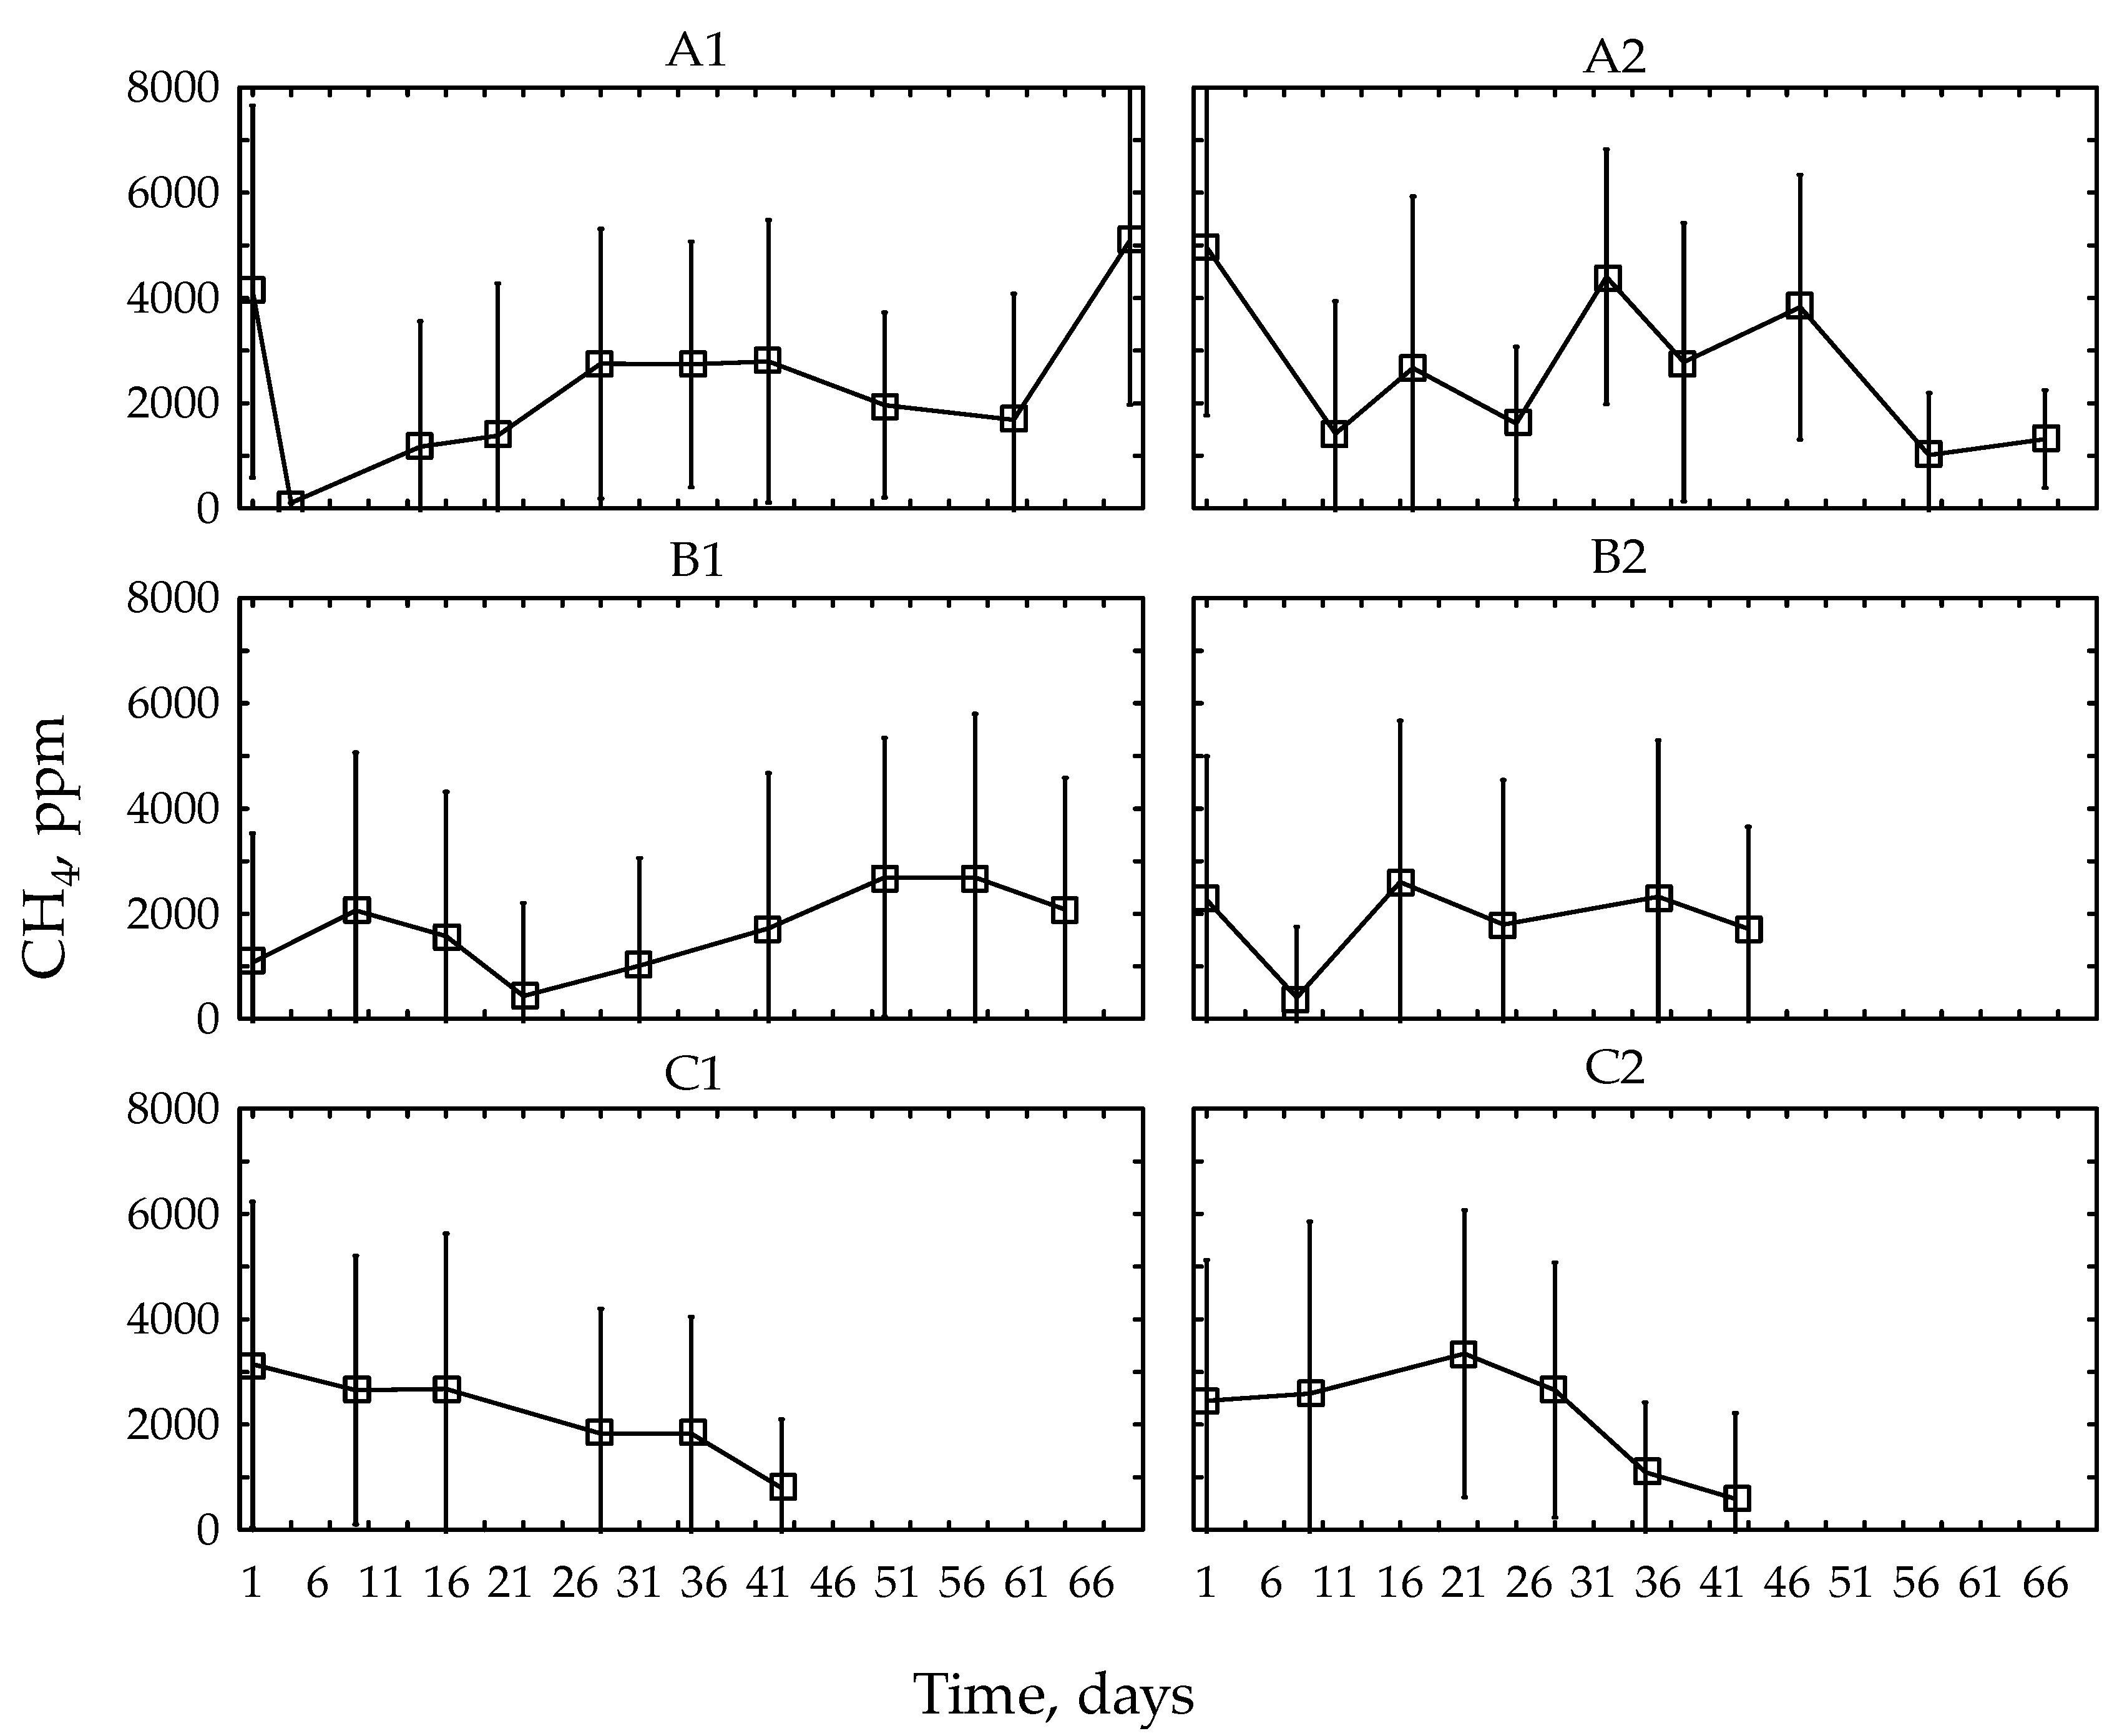
Methane concentrations in the waste piles were characterized by high variability during the entire process (Figure 6; Figure A1), again indicating spatial heterogeneity within the piles. Similarly high differences in methane emissions during municipal waste composting, ranging from 0.12 to 9 kg CH4 per ton of waste were recorded by Colon et al. [45]. Such high variability resulted from the effect of the input material, type of composting system and process efficiency.
The concentration of CH4 increased up to ca. 5000 ppm during the first week (in piles A1, B2, and C1) from the first measurement, after which it decreased over time. Similarly, in an experiment conducted by Fukumoto et al. [46] high methane emissions were observed immediately after the composting process started and the amount of methane decreased progressively. Pile turning led to a renewed increase in the amount of methane. Tests conducted by He et al. [47] during aeration of food waste also revealed the highest CH4 concentration at the beginning of the process. However, the addition of cattle manure (organic matter load) increased methane emissions not only at the beginning but also throughout the entire experiment. Similar tests were carried out on pig manure [48]. It was demonstrated that the addition of straw, enhancing the porosity of the composted material, could lower gas emissions during composting. Methane was produced mostly in the centre of the pile, during the thermophilic stage.
The highest concentration of CH4 in piles B1 and B2 was observed also in the same piles in a case of higher CO2 and lower O2 concentrations. Shortening the duration of the treatment did not have a major impact on methane concentration. The sidewalls in reactors C1 and C2 were much more effective in lowering methane concentration. In contrast, the decreased mass of stabilized waste in reactors A1 and A2 maximized CH4 concentration.
Thompson et al. [49] linked CH4 and CO2 emissions to insufficient pile aeration. According to Zeman et al. [50], on the other hand, optimization of the aeration process may reduce but not stop methane generation, as was also confirmed by the present study. Even with a high degree of aeration of the waste pile, some local anaerobic zones may arise due to the creation of air preferential flow channels. The high variability of measured temperature, O2, CO2, and CH4 may indicate the presence of local anaerobic zones, even when overall levels of oxygen appear to be high.

3.3.4. CO Concentration in Waste Piles

Emissions of CO gas have been observed during the composting of municipal waste [3,23]. CO metabolism during organic matter decomposition is linked to pathways for energy generation and cellular carbon synthesis in, for example, carboxydotrophic bacteria and other microbes, which use CO as their sole source of carbon and energy. In anaerobic environments, CO is produced by acetogens and methanogens, which catalyse the reduction of CO2 to CO with carbon monoxide dehydrogenase (CODH) [51].
In this study, CO concentrations were spatially variable within every pile, and the gas was present throughout the entire process despite optimum thermal and aerobic conditions (Figure 7). The highest average value, exceeding 800 ppm, was noted in the case of pile B2 during the second week of the process (Figure 7).
Lower CO concentrations were recorded in piles A1 and A2 where a smaller quantity of waste was used and in piles C1 and C2, having sidewalls, combined with reduced aeration.
The highest carbon monoxide concentrations were in piles B1 and B2, with higher waste mass loads, and lower aeration rate, nearly twice the levels in A1 and A2, despite the shorter run time. Such high average CO concentrations result from high concentrations observed in the initial 3–4 weeks, although the biostabilization process ended with results similar to those observed in other piles A1, A2, C1 and C2.
The highest concentrations of CO were observed between the second and fifth week of the test. Similar increases in CO emissions were observed by Boldrin et al. [52] during their study on green waste composting and by Andersen et al. [53]. Pile B2 was characterized by the highest CO concentration and highest average temperature. Aeration used in this case was relatively intensive which, as demonstrated by a study conducted by Hellebrand [1], has a huge impact on CO concentrations. Thus, the main CO concentrations in this study coincide with the highest temperatures in the piles, consistent with findings of Phillip et al. [3]. Hence, the authors hypothesize that CO generation has, at least partly, thermo-chemical origins.

3.4. The Influence of Technical Parameters of OFMSW Aerobic Biostabilization

3.4.1. Generalized Additive Model

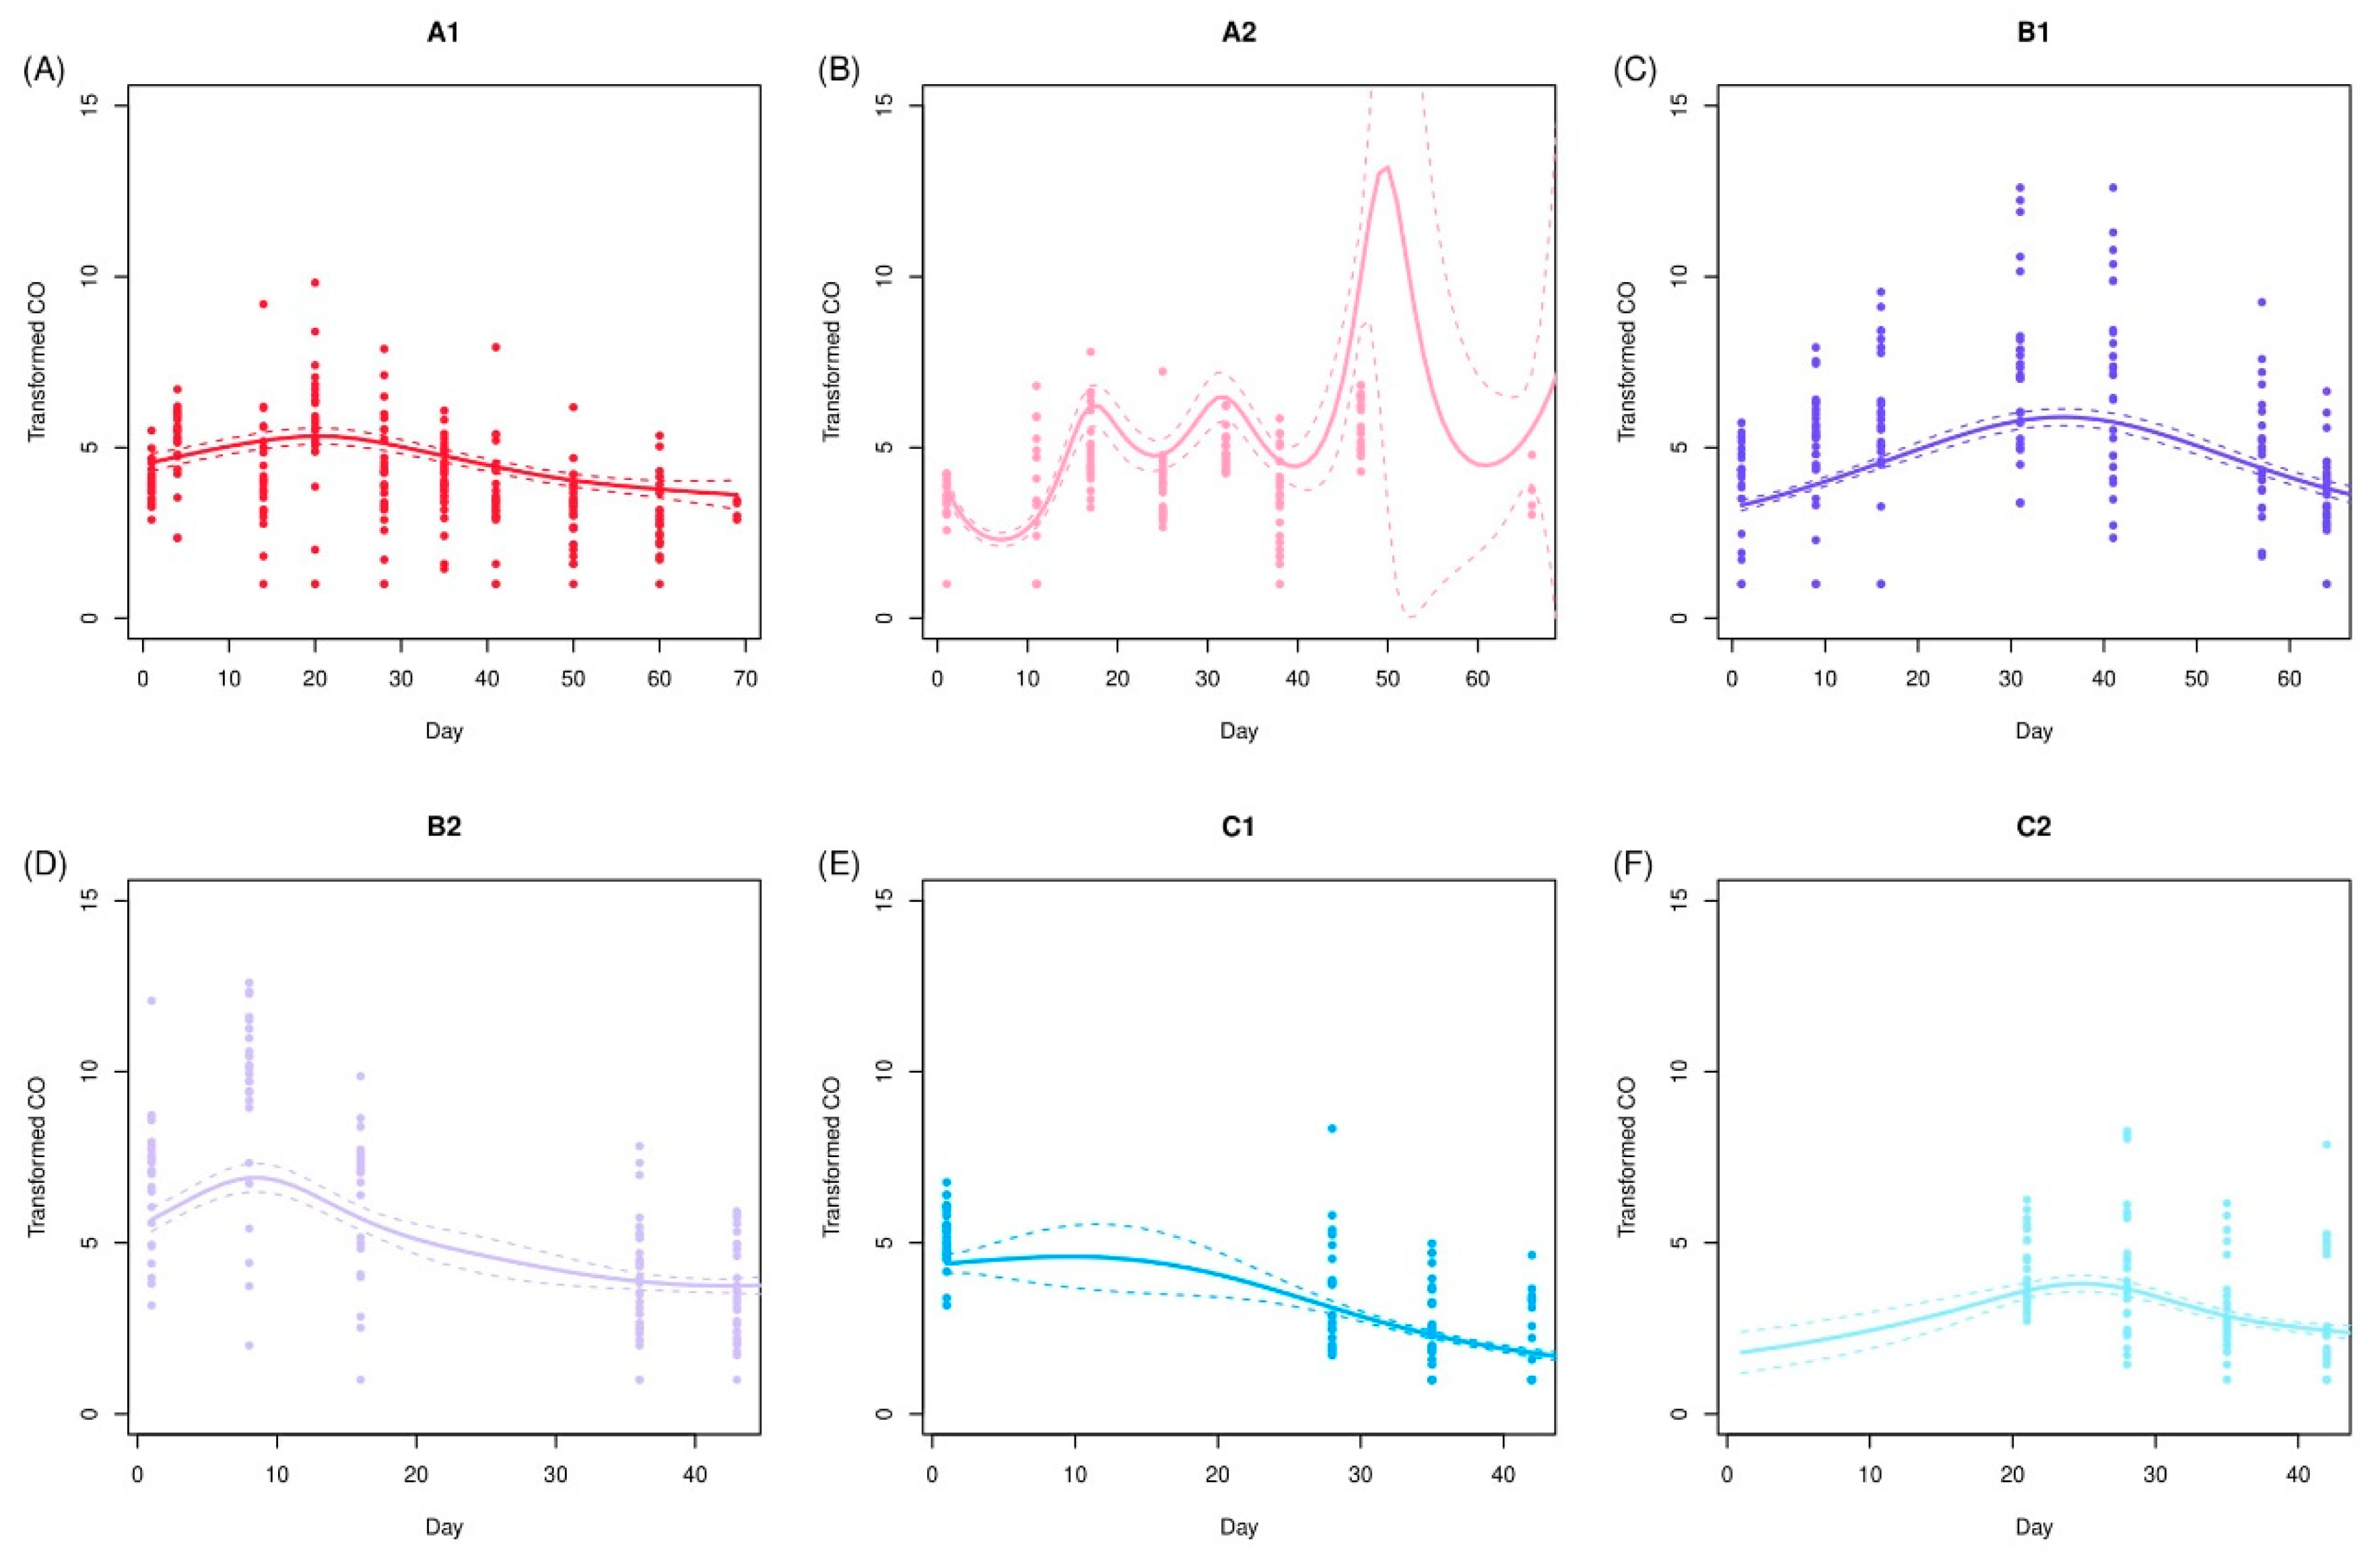
CO data were modelled using Generalized Additive Models (GAMs). All combinations of the linear terms aeration, construction and mass were added to a starting model where the smoothed time–pile interaction was the only predictor, and the models ranked by AIC (Table 2). A consistent pattern emerged when comparing the results from the whole dataset with those when it was split into two subsets. The best three models were always aeration and construction, construction and mass, and aeration and construction and mass, although the order varied. Aeration and mass always performed worse than either of its constituent terms alone. Construction alone always performed the worst, sometimes even worse than the starting model. This indicates that construction was an important feature, but only when aeration and/or mass was taken into account. That aeration and mass were interchangeable in this respect indicates some relationship between them. Figure 8 shows the predictions from the model, which included aeration and construction, as this was the most parsimonious across the whole dataset. Different piles showed different timings for peak emergence of CO (A1, B2, C1 early; A2, B1, C2 later) (Figure 8). A2 showed extreme high variability of CO towards the end (after 45 days) (Figure 8).
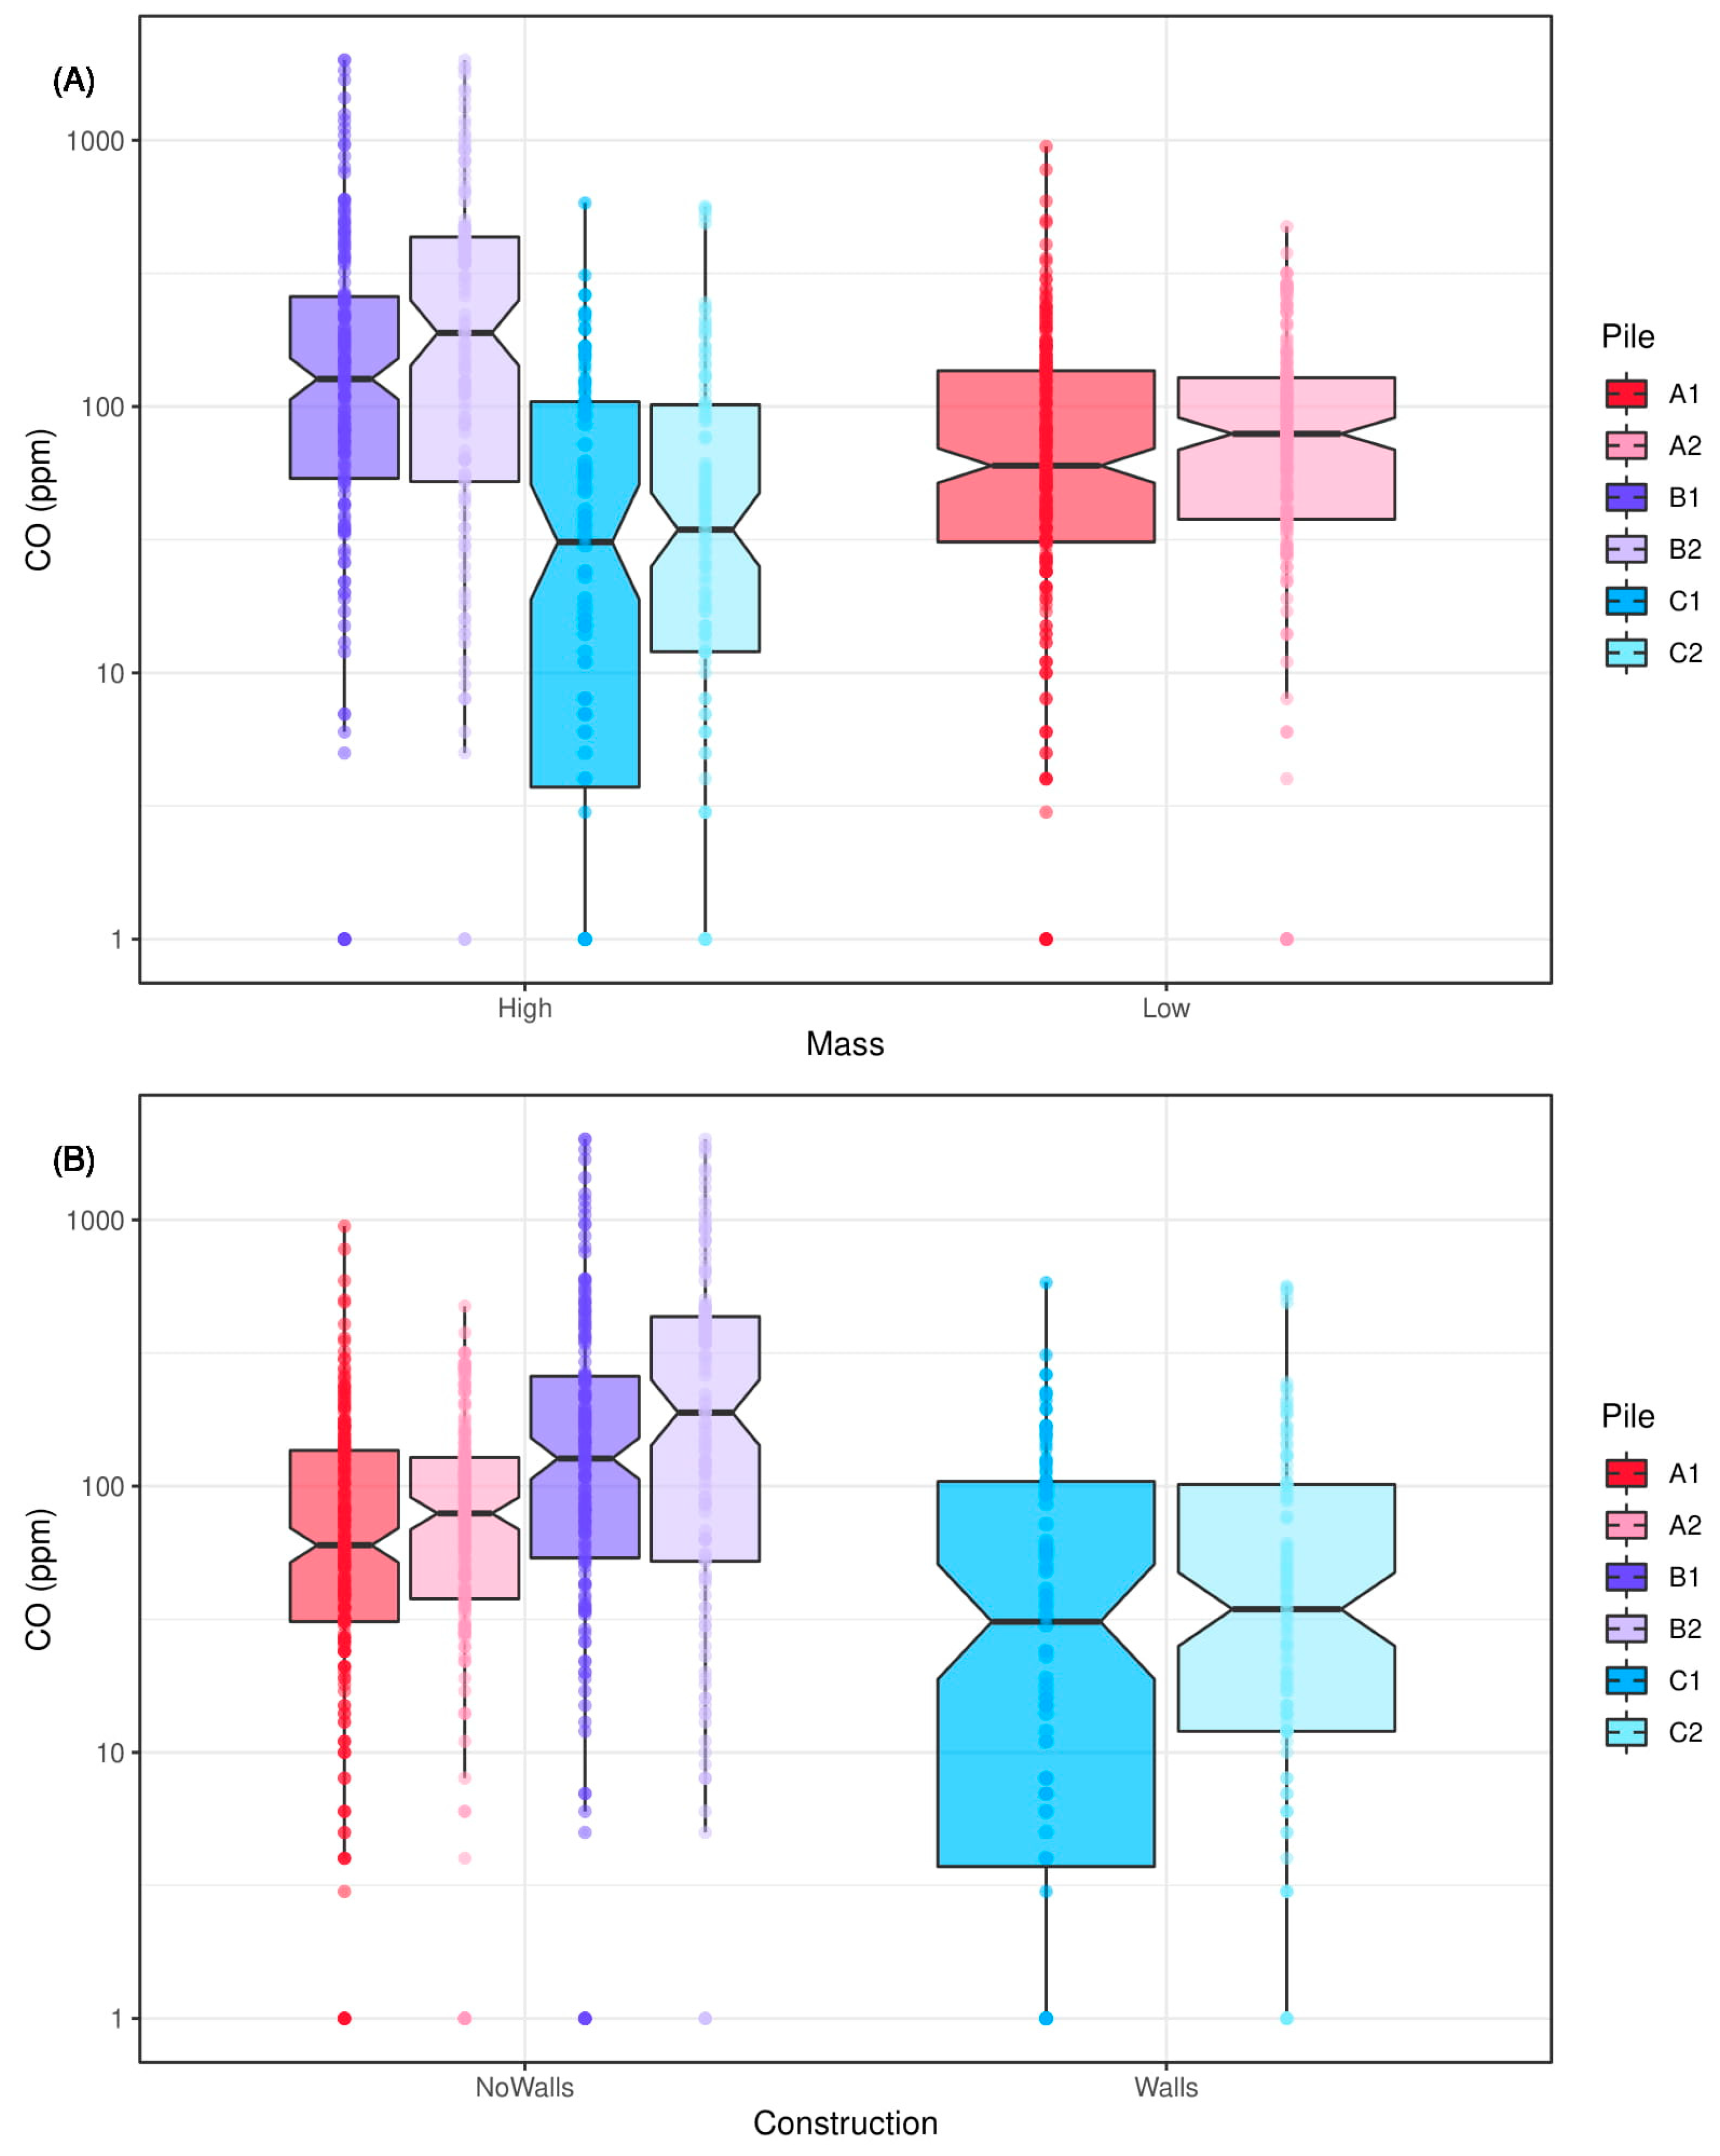
No single pile showed a best/worst situation for minimizing CO release. Some were more variable than others (with some high values), but averages were around 5–10 ppm in all cases. This is shown more clearly in Figure 9, where C1/C2 had the lowest CO mean values and B1/B2 the highest (along with the highest waste mass load). They both had lower aeration rates, due to the smaller surface areas in the case of C piles (sidewalls).

3.4.2. Relationships between CO, Gases and Other Variables in the Biostabilization Process

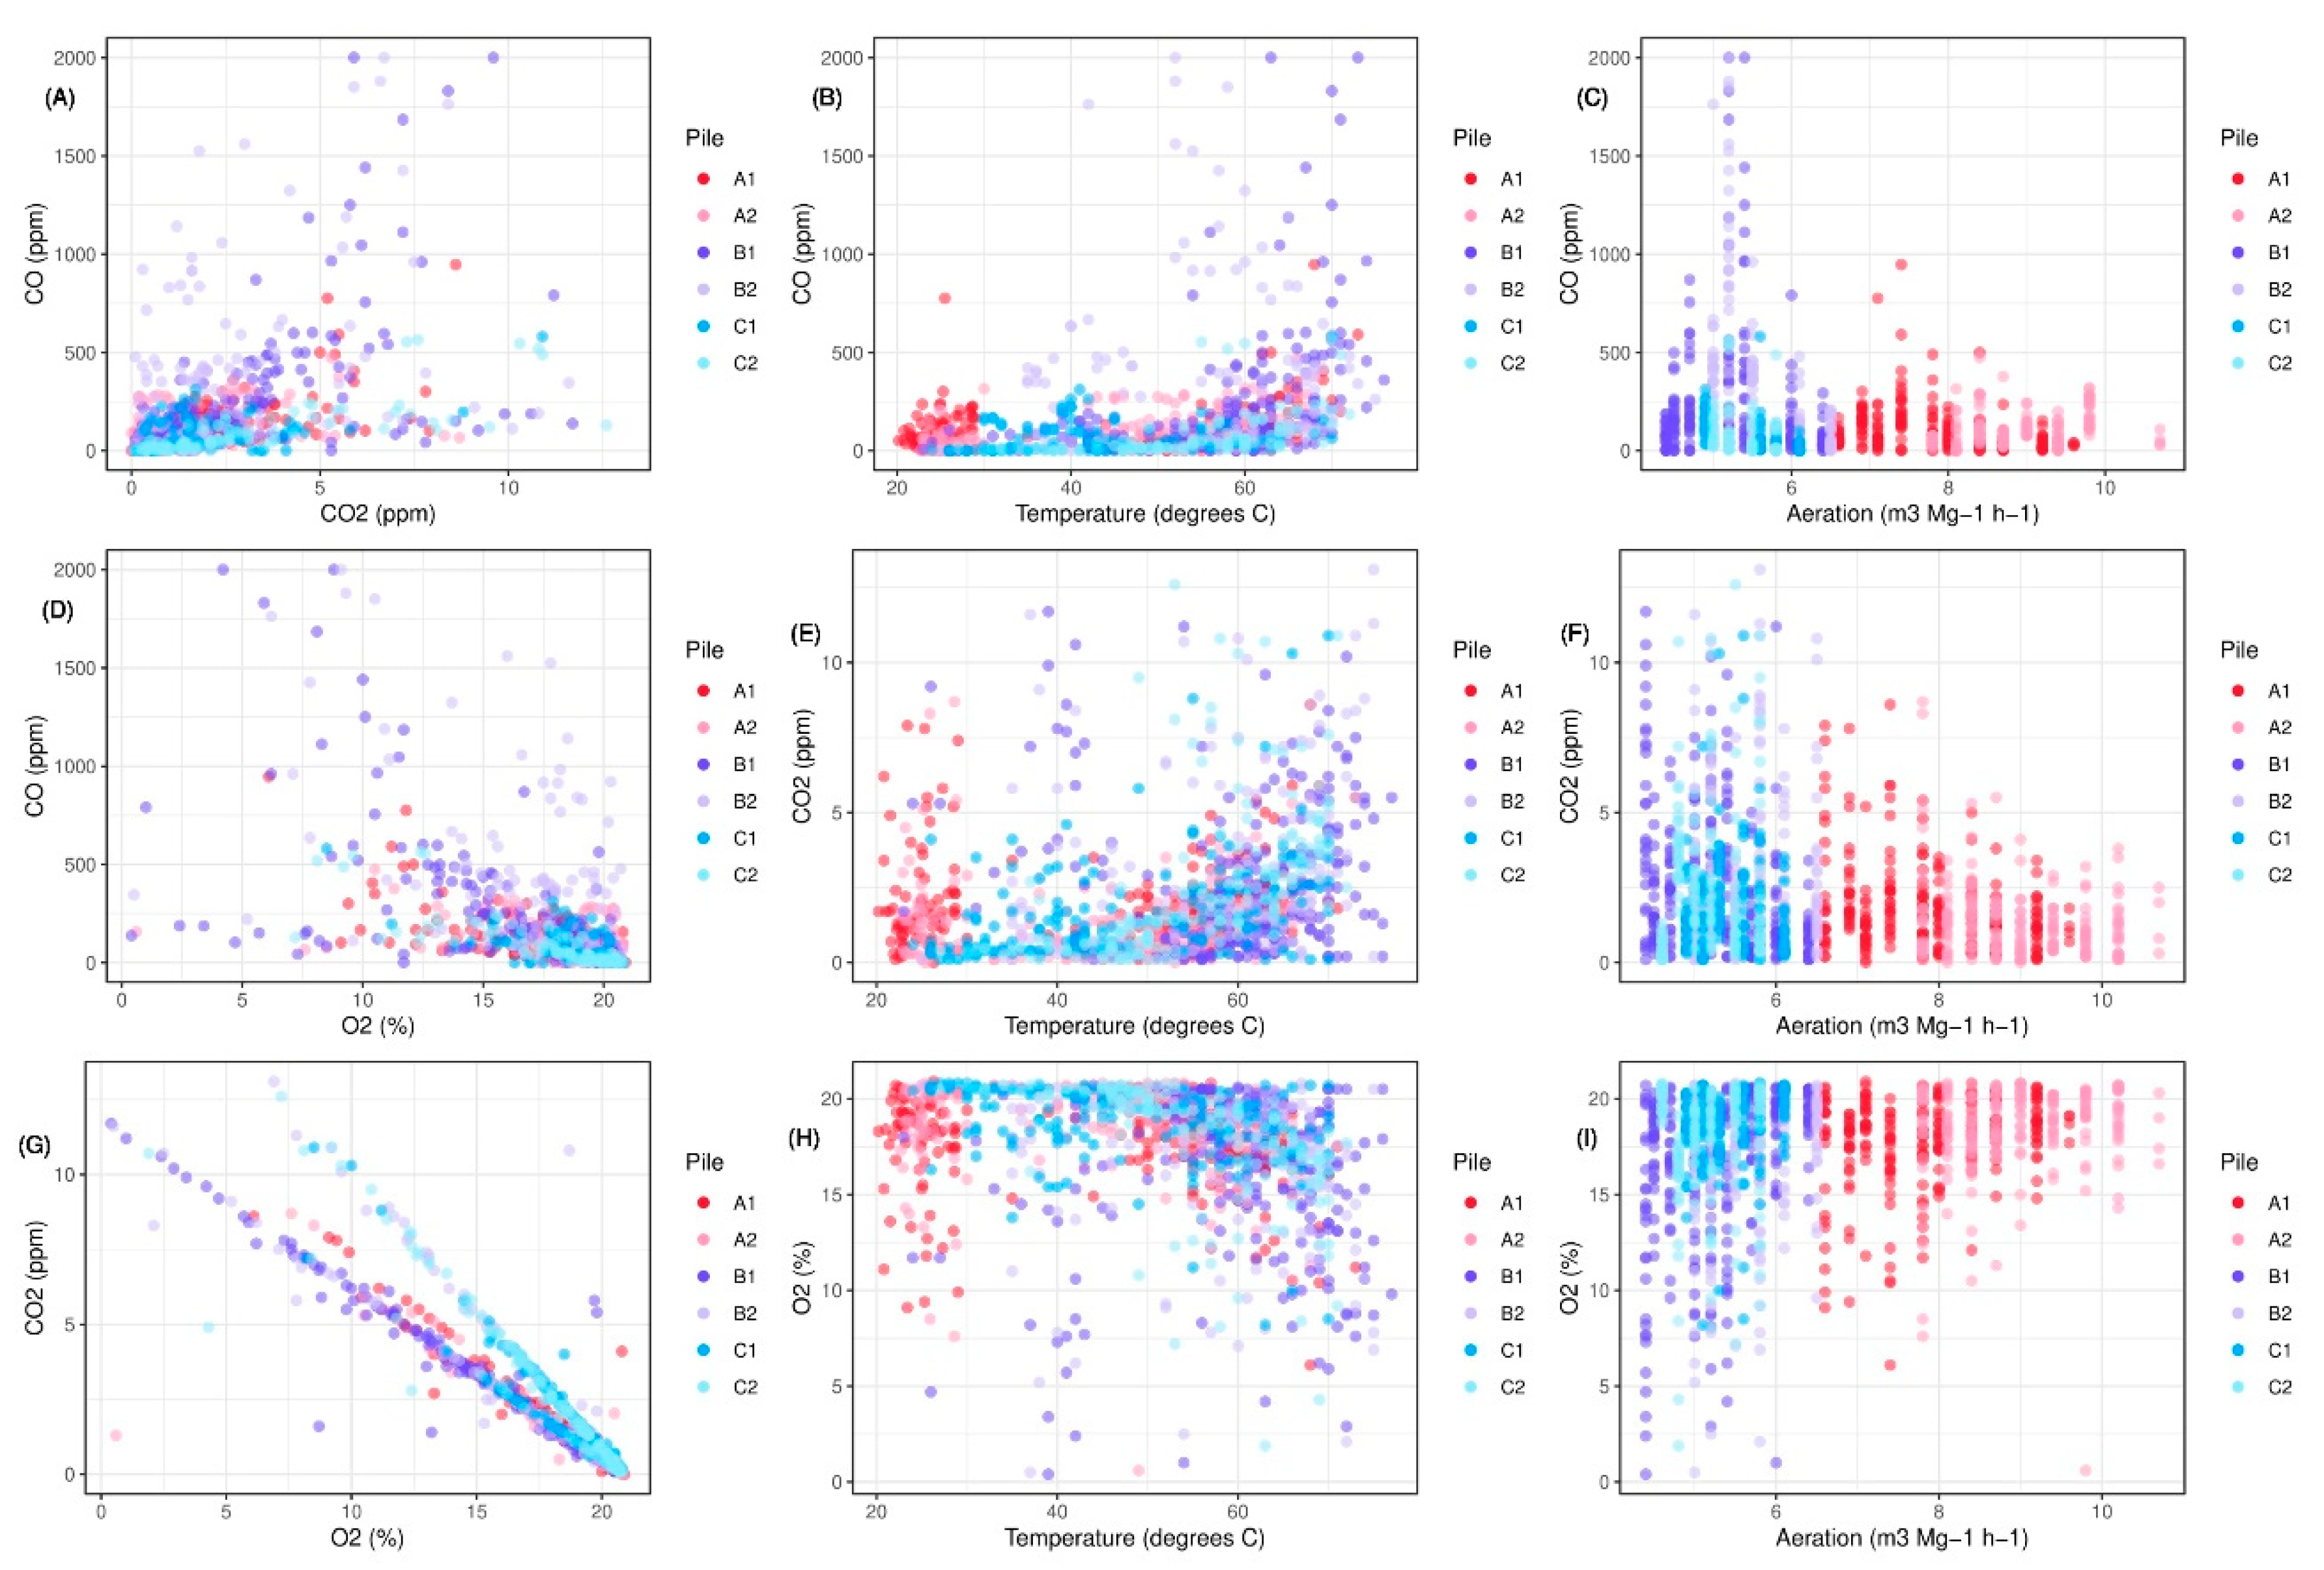
In the present study, a very high, negative correlation between carbon monoxide concentration and oxygen (Figure 10) was found, suggesting that oxygen availability influences carbon monoxide concentration more strongly than temperature. Research conducted by Hellebrand and Kalk [13] has linked carbon monoxide emissions directly to the availability of oxygen in the pile. High concentrations of CO may also be influenced by high activity of microorganisms in the tested material. Authors studying CO emissions from organic materials agree that the effect of microbial activity on CO concentration is significant [3,13,14,15]. The high temperatures > 60 °C prevailing in most piles provided optimal conditions for colonization with CO-metabolizing microorganisms [54], which could be linked to a decrease in CO production.
The relationship between temperature and carbon monoxide (Figure 10) suggests the lack of a simple correlation, especially for piles stabilized during the shorter period (B2, C1 and C2). This may indicate that other biotic factors, not considered in this study, were important. Microbial production of CO during composting has been proven in previous studies [14,15,55]. As a major precursor of CO production, CO2 can arise from the decarboxylation of pyruvate, generated from sugars by the Embden-Meyerhof pathway. It can also be formed from the carboxyl group of benzoic acid and its derivatives [56,57]. The biodegradable fraction in the present study comprised 45.0 to 53.6% of the waste [23], providing an enormous source of carbohydrates for CO production. The highest concentration of organic matter was observed in B2 pile which, in combination with less aeration, resulted in the most favourable conditions for CO production.
The differences in aeration are demonstrated in Figure 11, where the red points (piles A) are distinct in several cases. It may be observed that in the piles with sidewalls (C1 and C2) the relationship between O2 concentration and CO2 differs from that in piles A1, A2, B1, and B2, where the decrease in the CO2 concentration with the increase in O2 concentration is steeper. Additionally, the highest CO concentrations, reaching even 2000 ppm, were noted only in a very narrow range of air flow between 5.2 and 5.4 m3·Mg−1·h−1 (Figure 11) in the case of piles B1 and B2.
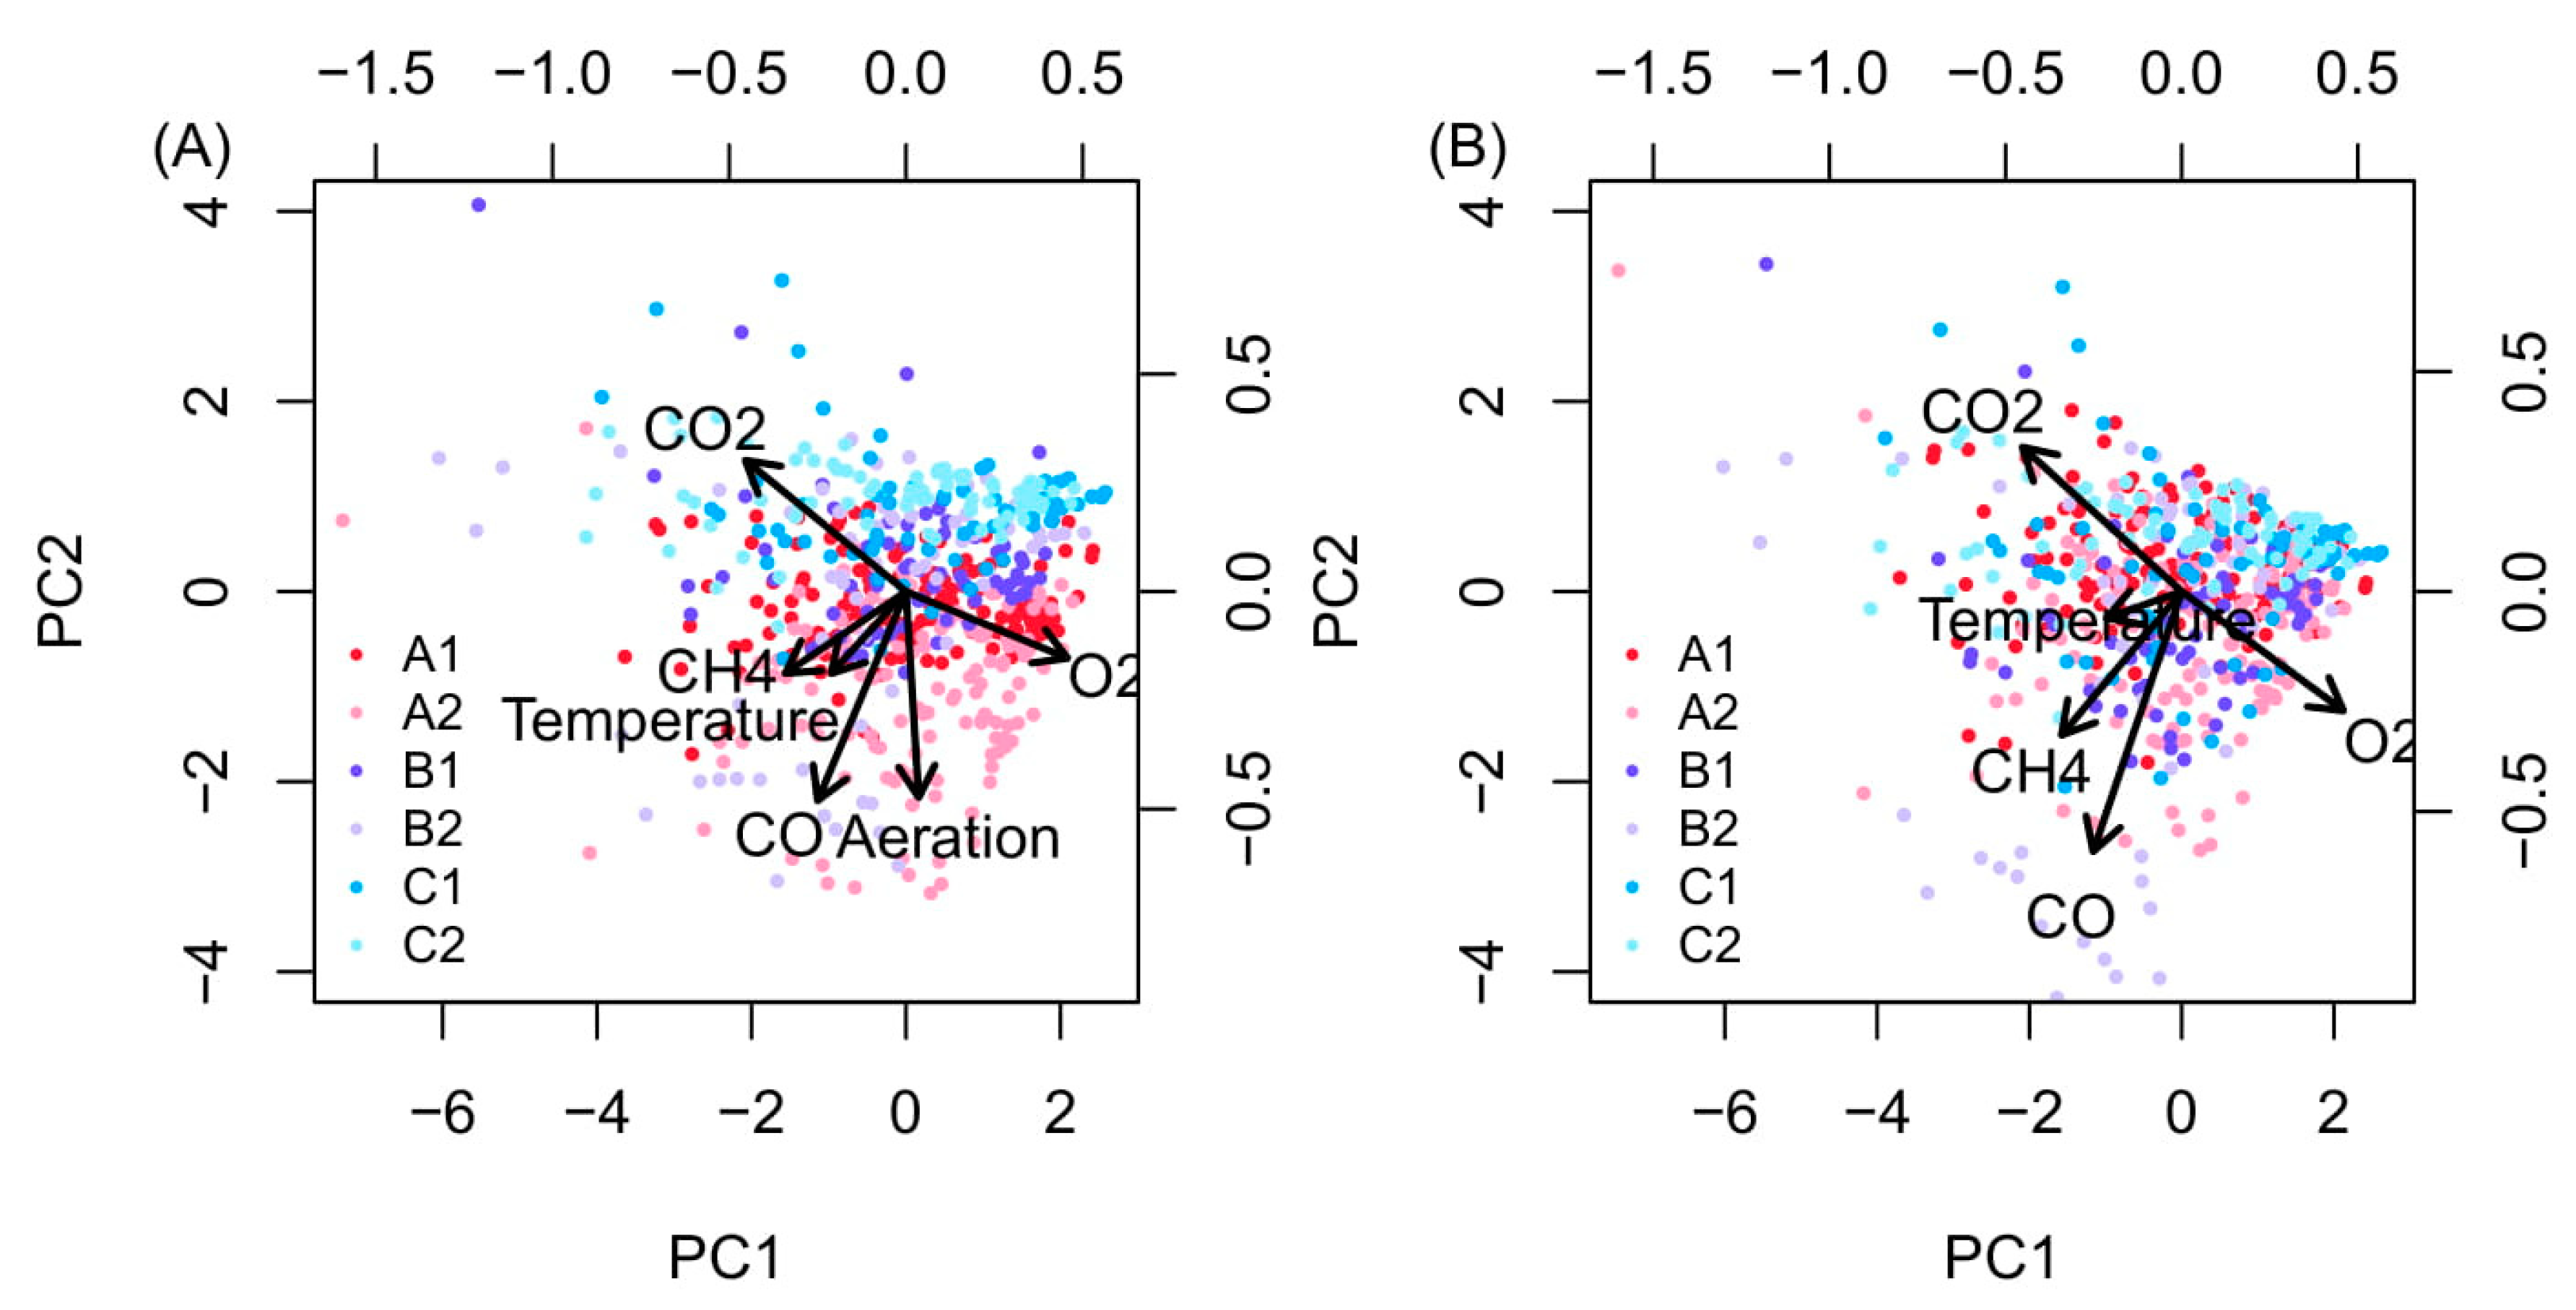
Principal components analysis (PCA) was used to evaluate the relationship between individual factors (temperature, aeration, O2, CH4, CO2 and CO). PCA showed some separation between pile groups. CO2 and O2 loaded orthogonally to CO, further indicating that CO2 and O2 were poorly correlated with CO emissions (Figure 11A). This held true even when aeration rate was not included in the PCA (Figure 11B).
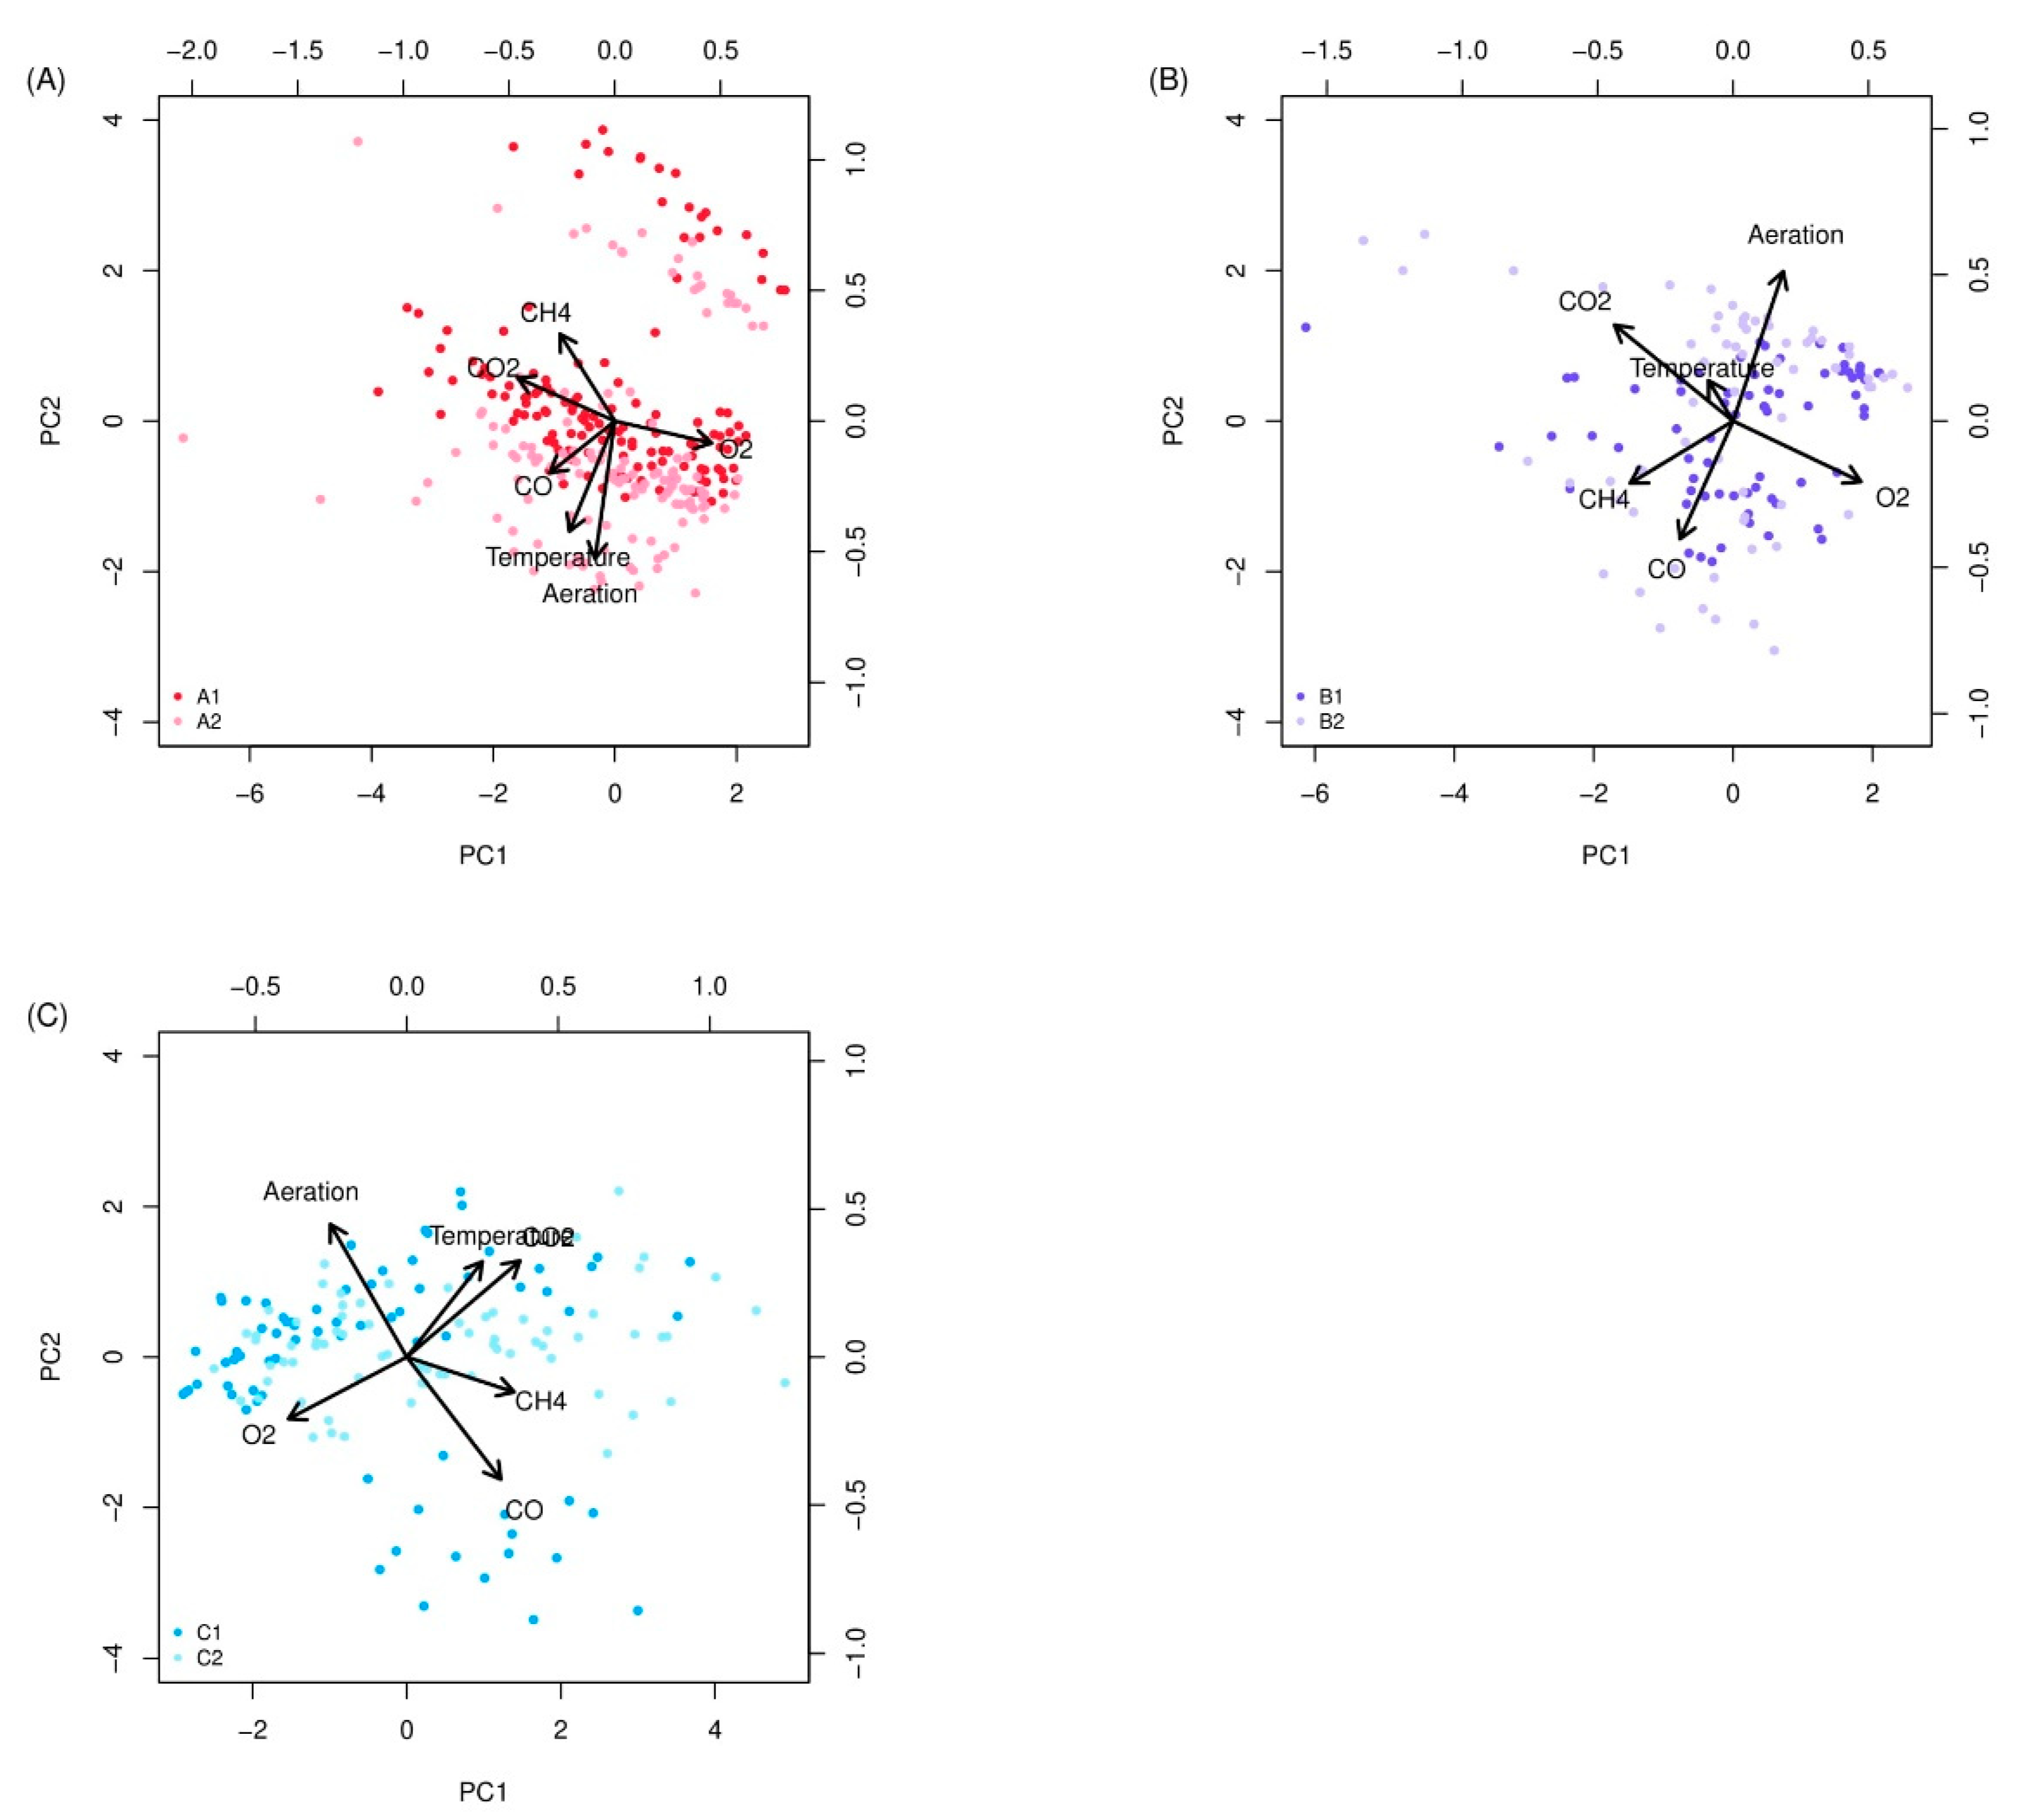
The separate PCAs for each pile type (A, B and C) (Figure 12) showed both similarities and differences in the orientation of the variables. The most striking difference was that in B and C, vector arrows representing CO and aeration were in opposition, while in the A piles they were not. This may be caused by higher variability of CO concentration in piles B and C (Figure 7). It may also indicate that, in the case of the A piles, the aeration rate was too high to have an influence on CO formation, as evidenced by the consistently high level of O2 throughout the biostabilization process (Figure 4). The influence of aeration rate on CO formation was only distinguishable for flow rates below 6 m3·Mg−1·h−1 (Figure 10). In the separate PCAs for each pile type (A, B and C) (Figure 12), individual sample points showed some separation on PC2 between piles within each type, although there was overlap between the sets of points in all cases, indicating greater differences within individual piles rather than between the pairs.
These results show that the three pairs of piles behave differently from each other, which explains why an earlier attempt to fit an overall general linear model (GLM; data not shown) was unsuccessful. In particular, the B piles were consistent outliers, with very high CO production. B1/B2 piles would be expected to group with either A (which also had no walls) or C (which were also high mass) piles. This suggests that a major, but unknown, source of variation influenced CO production. However, the data evaluation showed that aeration rate and sidewalls do influence CO production in the full technical scale OFMSW aerobic biostabilization. The highest CO production was noted in piles with the highest waste mass loads (B, and C). However, in the case of pile C, the presence of sidewalls caused cooling of the waste mass due to airflow concentrated in a smaller area. Finally, the lower temperatures in piles C resulted in lower thermochemical CO production. In the case of the A piles, the very high aeration rate, as recommended for waste biodrying, resulted in very low CO accumulation.

4. Conclusions

  • All examined piles were well aerated and had stable thermal conditions (O2 > 15%, Temperature > 50 °C), yet the presence of CO and CO2 and CH4 was observed, which suggests that ensuring apparently optimum conditions for the process does not eliminate CO;
  • Increase in waste mass load promotes conditions for CO accumulation;
  • The use of side walls influenced pile cooling. A decrease in the temperature reduced the possibility of thermo-chemical CO generation;
  • Oxygen concentration (R2 = 0.55) and temperature (R2 = 0.44) had moderate effects on the CO concentration in the waste piles;
  • Aeration rate influenced CO concentration in the waste piles when its value did not exceed 6 m3·Mg−1·h−1;
  • The most preferable aeration rate for CO formation was about 5.3 m3·Mg−1·h−1.
Analysis of the CO concentrations for the six piles using GAM, showed that a combination of factors (construction with either aeration or pile mass) gave the most efficient predictions of CO, whereas no single factor could do so. The model predicted timings for peak levels of CO to be early for piles A1, B2, C1 but later for A2, B1, C2, reflecting the complex interaction between these technical parameters in the waste treatment system.
As the observations were made at the full technical scale and results do not fully explain the influence of technological parameters on CO formation, further controlled experiments under laboratory scale are required.

Author Contributions

Conceptualization, A.B.; methodology, A.B.; validation, A.B. and P.F.R.; formal analysis, S.S.-D., S.R.C., P.F.R., A.B.; resources, S.S.-D., A.B.; data curation, S.S.-D.; writing—original draft preparation, S.S.-D.; writing—review and editing, A.B., S.S.-D., P.F.R., S.R.C.; visualization, S.S.-D., S.R.C.; supervision, A.B., P.F.R.; project administration, A.B.; funding acquisition, A.B. All authors have read and agreed to the published version of the manuscript.

Funding

This research was funded by the Municipal Cleaning Company in Warsaw, Poland, “The investigation on the intensity of the aerobic biological processes occurring in the prisms for biostabilization of the municipal solid waste undersize fraction”

Conflicts of Interest

The authors declare no conflict of interest.

Abbreviations

OFMSWorganic fraction of municipal solid waste
ABAerobic biostabilization
MSWMunicipal solid waste
GHGGreenhouses gases
MCPmembrane-covered pile
SWwith side walls

Appendix A

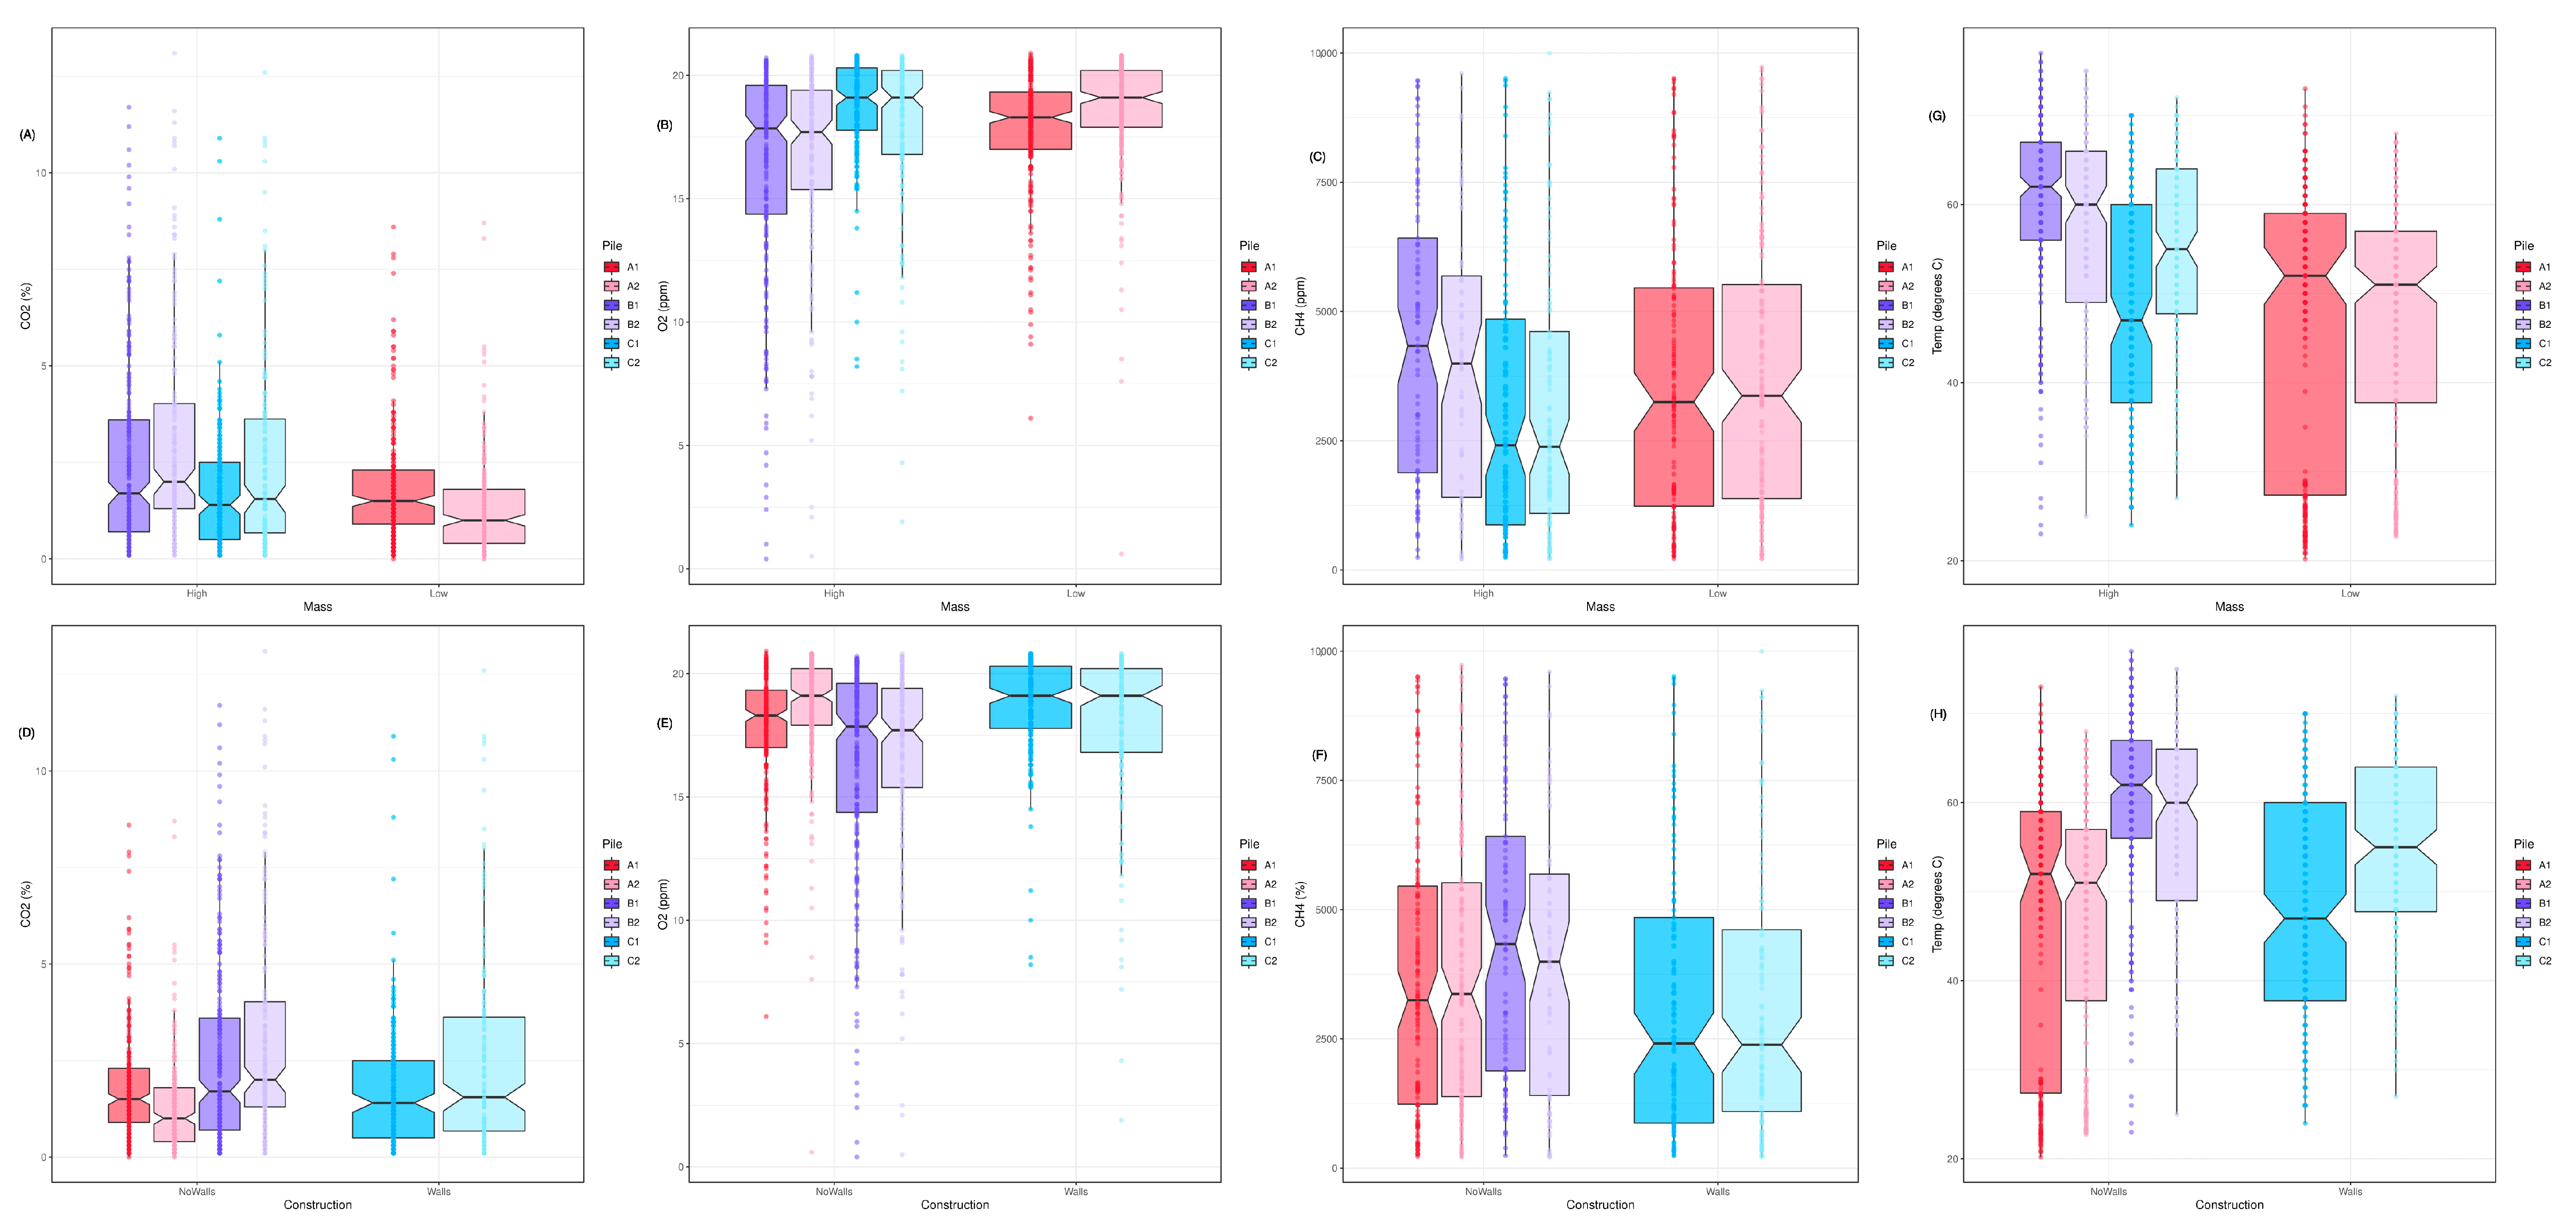
Figure A1. Effect of pile construction (starting mass and the presence of side walls) on CO2 production (A,E), O2 production (B,F), CH4 production (C,G) and temperature (D,H) across the duration of the experiment. Different colours represent different piles. Notches on the boxplots represent 95% confidence intervals.
Energies 13 05624 g0a1

References

  1. Hellebrand, H.J. Emission of nitrous oxide and other trace gases during composting of grass and green waste. J. Agric. Eng. Res. 1998, 69, 365–375. [Google Scholar] [CrossRef] [Green Version]
  2. Haarstad, K.; Bergersen, O.; Sorheim, R. Occurrence of carbon monoxide during organic waste degradation. J. Air Waste Manag. Assoc. 2006, 56, 575–580. [Google Scholar] [CrossRef] [Green Version]
  3. Phillip, E.A.; Clark, O.G.; Londry, K.; Yu, S.; Leonard, J. Emission of carbon monoxide during composting of municipal solid waste. Compost Sci. Util. 2011, 19, 170–177. [Google Scholar] [CrossRef]
  4. Stegenta, S.; Dębowski, M.; Bukowski, P.; Randerson, P.F.; Białowiec, A. The influence of perforation of foil reactors on greenhouse gas emission rates during aerobic biostabilization of the undersize fraction of municipal wastes. J. Environ. Manag. 2018, 207, 355. [Google Scholar] [CrossRef] [PubMed]
  5. Ritzkowski, M.; Heerenklage, J.; Stegmann, R. An overview on techniques and regulations of mechanical-biological pre-treatment of municipal solid waste. Environ. Biotechnol. 2006, 2, 57–68. [Google Scholar]
  6. Jędrczak, A. Properties of the Organic Fraction Directed to Biostabilization in MBT Installations During the Heating Season. Civ. Environ. Eng. Rep. 2018, 28, 65–78. [Google Scholar] [CrossRef] [Green Version]
  7. Döing, M. The Market for Mechanical Biological Waste Treatment Plants in Europe. Available online: https://www.wtert.net/paper/3765/The-Market-for-Mechanical-Biological-Waste-Treatment-Plants-in-Europe.html (accessed on 3 September 2020).
  8. Andersen, J.K.; Boldrin, A.; Christensen, T.H.; Scheutz, C. Home composting as an alternative treatment option for organic household waste in Denmark: An environmental assessment using life cycle assessment-modelling. Waste Manag. 2012, 32, 31–40. [Google Scholar] [CrossRef] [PubMed] [Green Version]
  9. Manfredi, S.; Tonini, D.; Christensen, T.H. Environmental assessment of different management options for individual waste fractions by means of life-cycle assessment modelling. Resour. Conserv. Recycl. 2011, 55, 995–1004. [Google Scholar] [CrossRef]
  10. Lee, S.H.; Choi, K.I.; Osako, M.; Dong, J.I. Evaluation of environmental burdens caused by changes of food waste management systems in Seoul, Korea. Sci. Total Environ. 2007, 387, 42–53. [Google Scholar] [CrossRef]
  11. Hellebrand, H.J.; Schade, G.W. Carbon monoxide from composting due to thermal oxidation of biomass. J. Environ. Qual. 2008, 37, 592. [Google Scholar] [CrossRef] [Green Version]
  12. Schade, G.W.; Hoffman, R.M.; Crutzen, P.J. CO emissions from degrading plant matter. I. Measurements. Tellus B Chem. Phys. Meteorol. 1999, 51, 889–908. [Google Scholar] [CrossRef] [Green Version]
  13. Hellebrand, H.J.; Kalk, W.D. Emission of carbon monoxide during composting of dung and green waste. Nutr. Cycl. Agroecosyst. 2001, 60, 79–82. [Google Scholar] [CrossRef]
  14. Rich, J.J.; King, G.M. Carbon monoxide consumption and production by wetland peats. FEMS Microbiol. Ecol. 1999, 28, 215–224. [Google Scholar] [CrossRef]
  15. Voordouw, G. Carbon monoxide cycling by Desulfovibrio vulgaris Hildenborough. J. Bacteriol. 2002, 184, 5903–5911. [Google Scholar] [CrossRef] [PubMed] [Green Version]
  16. Ljungdahl, L.G. The Acetyl-CoA Pathway and the Chemiosmotic Generation of ATP during Acetogenesis. In Acetogenesis; Springer: Boston, MA, USA, 1994; pp. 63–87. [Google Scholar] [CrossRef]
  17. Hogan, J.A.; Miller, F.C.; Finstein, M.S. Physical modeling of the composting ecosystem. Appl. Environ. Microbiol. 1989, 55, 1082–1092. [Google Scholar] [CrossRef] [Green Version]
  18. Favoino, E.; Hogg, D. The potential role of compost in reducing greenhouse gases. Waste Manag. Res. 2008, 26, 61–69. [Google Scholar] [CrossRef]
  19. Chadwick, D.; Sommer, S.G.; Thorman, R.; Fangueiro, D.; Cardenas, L.; Amon, B.; Misselbrook, T. Manure management: Implications for greenhouse gas emissions. Anim. Feed Sci. Technol. 2011, 166–167, 514–531. [Google Scholar] [CrossRef]
  20. Amlinger, F.; Peyr, S.; Cuhls, C. Green house gas emissions from composting and mechanical biological treatment. Waste Manag. Res. 2008, 26, 47–60. [Google Scholar] [CrossRef]
  21. Su, J.J.; Liu, B.Y.; Chang, Y.C. Emission of greenhouse gas from livestock waste and wastewater treatment in Taiwan. Agric. Ecosyst. Environ. 2003, 95, 253–263. [Google Scholar] [CrossRef]
  22. Neuwahl, F.; Cusano, G.; Gómez Benavides, J.; Holbrook, S.; Roudier, S. Best Available Techniques (BAT) Reference Document for Waste Incineration: Industrial Emissions Directive 2010/75/EU (Integrated Pollution Prevention and Control), EUR 29971 EN; Publications Office of the European Union: Luxembourg, 2019; ISBN 9789276129936. [Google Scholar]
  23. Stegenta-Dąbrowska, S.; Rogosz, J.; Bukowski, P.; Dębowski, M.; Randerson, P.F.; Bieniek, J.; Białowiec, A. The fluctuation of process gasses especially of carbon monoxide during aerobic biostabilization of an organic fraction of municipal solid waste under different technological regimes. Data 2020, 5, 40. [Google Scholar] [CrossRef] [Green Version]
  24. RStudio Team. RStudio: Integrated Development for R. RStudio, PBC, Boston. 2016. Available online: https://rstudio.com/ (accessed on 23 August 2020).
  25. R Core Team. R: A language and environment for statistical computing. R Foundation for Statistical Computing, Vienna, Austria. 2019. Available online: https://www.r-project.org/ (accessed on 23 August 2020).
  26. Wood, S.N. Fast stable restricted maximum likelihood and marginal likelihood estimation of semiparametric generalized linear models. J. R. Stat. Soc. Ser. B (Stat. Methodol.) 2011, 73, 3–36. [Google Scholar] [CrossRef] [Green Version]
  27. Liang, C.; Das, K.C.; McClendon, R.W. The influence of temperature and moisture contents regimes on the aerobic microbial activity of a biosolids composting blend. Bioresour. Technol. 2003, 86, 131–137. [Google Scholar] [CrossRef]
  28. Velis, C.A.; Longhurst, P.J.; Drew, G.H.; Smith, R.; Pollard, S.J.T. Biodrying for mechanical-biological treatment of wastes: A review of process science and engineering. Bioresour. Technol. 2009, 100, 2747–2761. [Google Scholar] [CrossRef] [Green Version]
  29. Ermolaev, E.; Pell, M.; Smårs, S.; Sundberg, C.; Jönsson, H.; Smars, S.; Sundberg, C.; Jonsson, H. Greenhouse gas emission from covered windrow composting with controlled ventilation. Waste Manag. Res. 2012, 30, 155–160. [Google Scholar] [CrossRef]
  30. Mulbry, W.; Ahn, H. Greenhouse gas emissions during composting of dairy manure: Influence of the timing of pile mixing on total emissions. Biosyst. Eng. 2014, 126, 117–122. [Google Scholar] [CrossRef]
  31. Evangelou, A.; Gerassimidou, S.; Mavrakis, N.; Komilis, D. Monitoring the performances of a real scale municipal solid waste composting and a biodrying facility using respiration activity indices. Environ. Monit. Assess. 2016, 188, 302. [Google Scholar] [CrossRef]
  32. Komilis, D.; Evangelou, A.; Giannakis, G.; Lymperis, C. Revisiting the elemental composition and the calorific value of the organic fraction of municipal solid wastes. Waste Manag. 2012, 32, 372–381. [Google Scholar] [CrossRef] [PubMed]
  33. Jędrczak, A.; DenBoer, E. The Final Report of the Third Stage of the Expertize Aiming to Conducting the Waste Research in 20 Mechanical, and Biological Treatment Plants in Poland In Polish: Raport Końcowy III Etapu Ekspertyzy Mającej na Celu Przeprowadzenie Badań Odpadów w 20 Inst. 2015. Available online: https://sdr.gdos.gov.pl/Documents/GO/Ekspertyzy/Ekspertyza%20MBP_III%20etap_%2022-06-2015%20+%20za%C5%82aczniki.pdf (accessed on 3 September 2020).
  34. Jiang, T.; Li, G.; Tang, Q.; Ma, X.; Wang, G.; Schuchardt, F. Effects of aeration method and aeration rate on greenhouse gas emissions during composting of pig feces in pilot scale. J. Environ. Sci. 2015, 31, 124–132. [Google Scholar] [CrossRef]
  35. Shen, Y.J.; Ren, L.M.; Li, G.X.; Chen, T.B.; Guo, R. Influence of aeration on CH4, N2O and NH3 emissions during aerobic composting of a chicken manure and high C/N waste mixture. Waste Manag. 2011, 31, 33–38. [Google Scholar] [CrossRef]
  36. Adani, F.; Tambone, F.; Gotti, A. Biostabilization of municipal solid waste. Waste Manag. 2004, 24, 775–783. [Google Scholar] [CrossRef] [PubMed]
  37. Andersen, J.K.; Boldrin, A.; Samuelsson, J.; Christensen, T.H.; Scheutz, C. Quantification of greenhouse gas emissions from windrow composting of garden waste. J. Environ. Qual. 2010, 39, 713. [Google Scholar] [CrossRef] [PubMed] [Green Version]
  38. Beck-Friis, B.; Pell, M.; Sonesson, U.; Jonsson, H.; Kirchmann, H. Formation and emission of N2O and CH4 from compost heaps of organic household waster. Environ. Monit. Assess. 2000, 62, 317–331. [Google Scholar] [CrossRef]
  39. Wang, J.Z.; Hu, Z.Y.; Xu, X.K.; Jiang, X.; Zheng, B.H.; Liu, X.N.; Pan, X.B.; Kardol, P. Emissions of ammonia and greenhouse gases during combined pre-composting and vermicomposting of duck manure. Waste Manag. 2014, 34, 1546–1552. [Google Scholar] [CrossRef]
  40. Mason, I.G. Mathematical modelling of the composting process: A review. Waste Manag. 2006, 26, 3–21. [Google Scholar] [CrossRef] [PubMed]
  41. Luangwilai, T.; Sidhu, H.S.; Nelson, M.I.; Chen, X.D. Modelling air flow and ambient temperature effects on the biological self-heating of compost piles. Asia Pac. J. Chem. Eng. 2010, 5, 609–618. [Google Scholar] [CrossRef]
  42. Clemens, J.; Cuhls, C. Greenhouse gas emissions from mechanical and biological waste treatment of municipal waste. Environ. Technol. 2003, 24, 745–754. [Google Scholar] [CrossRef] [PubMed]
  43. Stegenta, S.; Sobieraj, K.; Pilarski, G.; Koziel, J.A.; Białowiec, A. Analysis of the spatial and temporal distribution of process gases within municipal biowaste compost. Sustainability 2019, 11, 2340. [Google Scholar] [CrossRef] [Green Version]
  44. Adhikari, B.K.; Tremier, A.; Barrington, S.; Martinez, J.; Daumoin, M. Gas emissions as influenced by home composting system configuration. J. Environ. Manag. 2013, 116, 163–171. [Google Scholar] [CrossRef]
  45. Colon, J.; Cadena, E.; Pognani, M.; Barrena, R.; Sanchez, A.; Font, X.; Artola, A. Determination of the energy and environmental burdens associated with the biological treatment of source-separated Municipal Solid Wastes. Energy Environ. Sci. 2012, 5, 5731–5741. [Google Scholar] [CrossRef] [Green Version]
  46. Fukumoto, Y.; Osada, T.; Hanajima, D.; Haga, K. Patterns and quantities of NH3, N2O and CH4 emissions during swine manure composting without forced aeration—Effect of compost pile scale. Bioresour. Technol. 2003, 89, 109–114. [Google Scholar] [CrossRef]
  47. He, Y.W.; Inamori, Y.; Mizuochi, M.; Kong, H.N.; Iwami, N.; Sun, T.H. Measurements of N2O and CH4 from the aerated composting of food waste. Sci. Total Environ. 2000, 254, 65–74. [Google Scholar] [CrossRef]
  48. Sommer, S.G.; Moller, H.B. Emission of greenhouse gases during composting of deep litter from pig production—Effect of straw content. J. Agric. Sci. 2000, 134, 327–335. [Google Scholar] [CrossRef] [Green Version]
  49. Thompson, A.G.; Wagner-Riddle, C.; Fleming, R. Emissions of N2O and CH4 during the composting of liquid swine manure. Environ. Monit. Assess. 2004, 91, 87–104. [Google Scholar] [CrossRef] [PubMed]
  50. Zeman, C.; Depken, D.; Rich, M. Research on how the composting process impacts greenhouse gas emissions and global warming. Compost Sci. Util. 2002, 10, 72–86. [Google Scholar] [CrossRef]
  51. Ragsdale, S.W. Life with carbon monoxide. Crit. Rev. Biochem. Mol. Biol. 2004, 39, 165–195. [Google Scholar] [CrossRef]
  52. Boldrin, A.; Andersen, J.K.; Moller, J.; Christensen, T.H.; Favoino, E. Composting and compost utilization: Accounting of greenhouse gases and global warming contributions. Waste Manag. Res. 2009, 27, 800–812. [Google Scholar] [CrossRef] [Green Version]
  53. Andersen, J.K.; Boldrin, A.; Christensen, T.H.; Scheutz, C. Greenhouse gas emissions from home composting of organic household waste. Waste Manag. 2010, 30, 2475–2482. [Google Scholar] [CrossRef]
  54. Techtmann, S.M.; Colman, A.S.; Robb, F.T. ‘That which does not kill us only makes us stronger’: The role of carbon monoxide in thermophilic microbial consortia. Environ. Microbiol. 2009, 11, 1027–1037. [Google Scholar] [CrossRef]
  55. Stegenta-Dąbrowska, S.; Drabczyński, G.; Sobieraj, K.; Koziel, J.A.; Białowiec, A. The biotic and abiotic carbon monoxide formation during aerobic co-digestion of dairy cattle manure with green waste and sawdust. Front. Bioeng. Biotechnol. 2019, 7, 283. [Google Scholar] [CrossRef]
  56. Hsu, T.; Lux, M.F.; Drake, H.L. Expression of an aromatic-dependent decarboxylase which provides growth-essential CO2 equivalents for the acetogenic (wood) pathway of Clostridium thermoaceticum. J. Bacteriol. 1990, 172, 5901–5907. [Google Scholar] [CrossRef] [Green Version]
  57. Hsu, T.; Daniel, S.L.; Lux, M.F.; Drake, H.L. Biotransformations of carboxylated aromatic compounds by the acetogen Clostridium thermoaceticum: Generation of growth-supportive CO2 equivalents under CO2-limited conditions. J. Bacteriol. 1990, 172, 212–217. [Google Scholar] [CrossRef] [PubMed] [Green Version]
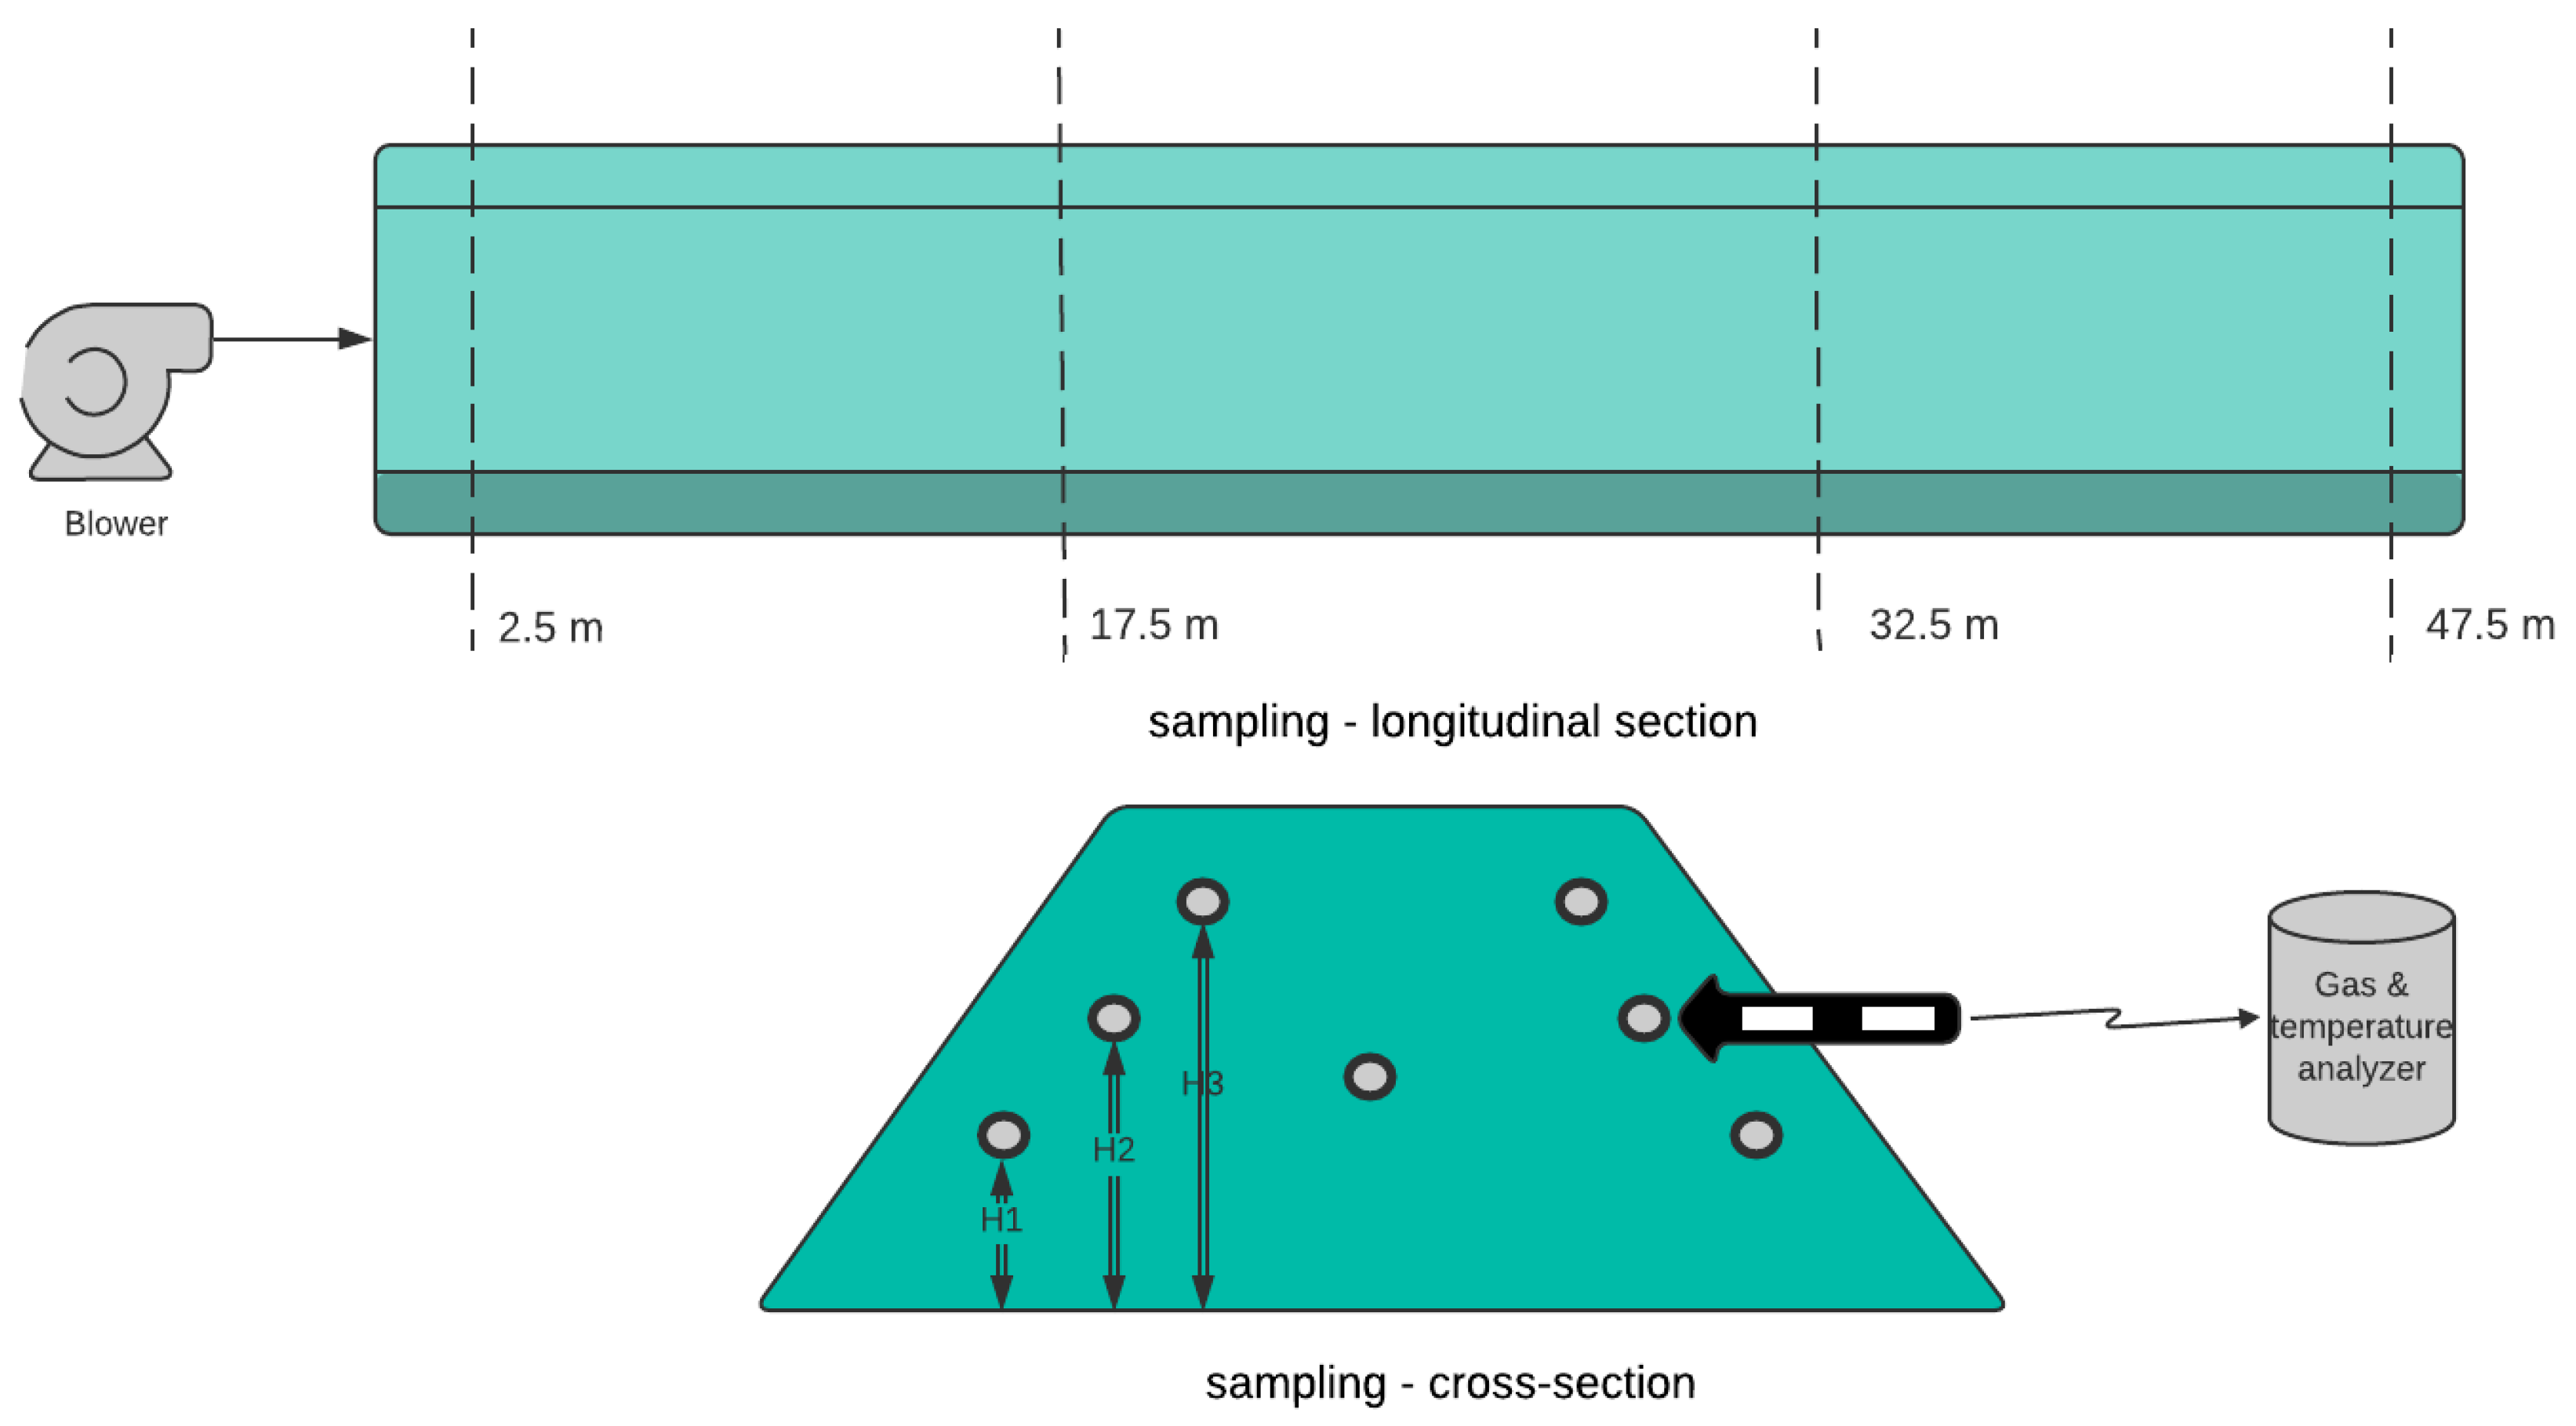
Figure 1. Scheme of probing points in piles.
Energies 13 05624 g001
Figure 2. Ambient temperature changes during measurement of aerobic biostabilization of OFMSW in aerated piles (A1, A2, B1, B2, C1, and C2).
Energies 13 05624 g002
Figure 3. Temperature changes during aerobic biostabilization of OFMSW in aerated piles (A1, A2, B1, B2, C1, and C2) (average ± standard deviation).
Energies 13 05624 g003
Figure 4. Oxygen concentration in aerated waste piles (A1, A2, B1, B2, C1, and C2) changes during aerobic biostabilization of OFMSW (average ± standard deviation).
Energies 13 05624 g004
Figure 5. Carbon dioxide concentration in aerated waste piles (A1, A2, B1, B2, C1, and C2) changes during aerobic biostabilization of OFMSW (average ± standard deviation).
Energies 13 05624 g005
Figure 6. Methane concentration in aerated waste piles (A1, A2, B1, B2, C1, and C2) changes during aerobic biostabilization of OFMSW (average ± standard deviation).
Energies 13 05624 g006
Figure 7. Carbon monoxide concentration in aerated waste piles (A1, A2, B1, B2, C1, and C2) changes during aerobic biostabilization of OFMSW (average ± standard deviation).
Energies 13 05624 g007
Figure 8. GAM predictions of CO over time from pile A1 (A), A2 (B), B1 (C), B2 (D), C1 (E), C2 (F). Aeration and construction (±sidewalls) are linear predictors, while pile–time is a non-linear interaction. The response variable transformation is cube root of x + 1. Dotted lines indicate standard error of the mean. Overall R2 (adj) = 0.46.
Energies 13 05624 g008
Figure 9. Effect of pile construction on CO production during the experiment, based on starting mass (A) and the presence of sidewalls (B). Different colours represent different piles. CO is plotted on a log10 scale for ease of viewing. Notches on the boxplots represent 95% confidence intervals.
Energies 13 05624 g009
Figure 10. Pairwise relationships between CO and CO2 (A), CO and temperature (B), CO and aeration rate (C), CO and O2 (D), CO2 and temperature (E), CO2 and aeration rate (F), CO2 and O2 (G), CO2 and temperature (H), and O2 and aeration rate (I) over the course of the experiment. Different colors represent different piles.
Energies 13 05624 g010
Figure 11. Principal components analysis of waste pile properties when aeration rate was included (A) or excluded (B). Different colours represent different piles.
Energies 13 05624 g011
Figure 12. Principal components analysis of waste pile properties for pile groups A (A), B (B) and C (C). Different colours represent different piles.
Energies 13 05624 g012
Table 1. Effectiveness of waste treatment (rate of removal of moisture, loss on ignition, total organic carbon, waste mass, during aerobic biostabilization). MCP: membrane-covered pile; SW: with side walls.
Parameter
PileMoistureLoss on IgnitionTotal Organic CarbonWaste MassTotal Aeration IntensityWaste Mass LoadReactor DesignDuration of Cycle
%%%%m3·Mg−1Mg-Days
A161.126.127.335.212,744465.38MCP69
A271.431.034.533.612,681391.02MCP66
B122.818.08.235.85205702.38MCP64
B230.812.09.627.45690611.36MCP43
C126.0--24.45461626.14SW42
C226.74.23.925.93365671.84SW42
Table 2. GAM models ranked by Akaike Information Criterion (AIC) from most to least parsimonious.
RankWhole DatasetPiles A1, B1 and C1Piles A2, B2 and C2
1Aeration + constructionConstruction + massAeration + construction + mass
2Construction + massAeration + constructionAeration + construction
3Aeration + construction + massAeration + construction + massConstruction + mass
4AerationMassAeration
5MassAerationMass
6Aeration + massAeration + massAeration + mass
7ConstructionConstructionSmoothed-term only
8Smoothed-term onlySmoothed-term onlyConstruction
Publisher’s Note: MDPI stays neutral with regard to jurisdictional claims in published maps and institutional affiliations.