Abstract
The development of city-driven urban laboratories was considered a priority by the European Commission through Action 3.2 of the Strategic Energy Technology Plan. In this context, positive-energy districts laboratories could take the role of urban drivers toward innovation and sustainability in cities. These urban labs can provide real-life facilities with innovative co-creation processes and, at the same time, provide testing, experimenting, and prototyping of innovative technologies. In this scope, the authors of this work want to share the very first results of an empirical study using the testing facilities provided by the members of the Joint Program on Smart Cities of the European Energy Research Alliance as positive-energy districts laboratories. Six climatic regions are studied as boundary conditions, covering temperate and continental climates. Four scales of action are analyzed: Building, campus, urban, and virtual, with building and campus scales being the most frequent. Most of these laboratories focus on energy applications followed by networks, storage systems, and energy loads characterization. Many of these laboratories are regulated by ICT technologies but few of them consider social aspects, lighting, waste, and water systems. A SWOT analysis is performed to highlight the critical points of the testing facilities in order to replicate optimized configurations under other conditions. This statistical study provides guidelines on integration, localization, functionality, and technology modularity aspects. The use of these guidelines will ensure optimal replications, as well as identify possibilities and opportunities to share testing facilities of/between the positive-energy district laboratories.
1. Introduction
Smart cities and communities have been identified as key challenges for achieving the energy efficiency targets for 2020 and 2050 according to the European Commission initiative formulated in the Strategic Energy Technology Plan Action 3.2 (SET Plan Action 3.2) [1]. The transition pathways need an integrated and inclusive approach that considers sustainability strategies, societal needs, and business opportunities on various levels.
Currently, 55% of the world’s population lives in urban areas, a number that is expected to increase to 68% by 2050 [2]. At the same time, these urban areas are responsible for 71–76% of CO2 emissions and 67–76% of global energy use [2]. These cities have been conceived as habitable, work, and leisure areas, but they also involve serious environmental, energy, social, and economic problems. New multi-criterion approaches are needed to evaluate and plan a sustainable energy transformation of the urban environments [3], as defined in the United Nations 2030 Agenda [4] and the Green Deal of the European Commission [5].
Seventy-five percent of the 210 million European buildings are not energy-efficient, and it is estimated that 75% to 85% of these buildings will be in use by 2050 [6]. The urban building stock is getting older and requires refurbishment measures that are energy-efficient, sustainable, and cost-effective. These measures should be adapted to the change in climate based on real weather data [7,8]. The combination of passive techniques to reduce the building energy demands [9,10] with techniques to minimize the primary energy consumption [11,12] represents a path toward decarbonization and improvement in energy and environmental impacts in cities. Thermal comfort, air quality, and appropriate light and acoustic levels should be considered inside buildings [13,14,15]. However, the building energy optimization should be accompanied by energy savings in cities. This concept includes aspects such as energy storage, flexibility, or polygeneration [16,17,18]. Urban approaches need to be carried out by means of optimized planning that considers energy and environmental aspects [19,20]. Sustainable urban mobility is an imperative need as a source of congestion [21]. The measures proposed differ from city to city depending on the urban planning, citizens, and stakeholders [22]. The use of Information and Communication Technologies (ICT) makes it possible to evaluate the information coming from urban transport and identifies different aspects that allow the improvement in its efficiency and sustainability [23]. Furthermore, other challenges such as the influence of air quality [24] and its measurement [25], urban livability [26], system integration of all urban flows [27], and lack of citizen involvement [28,29] are the actual real challenges toward sustainable urban transformation and energy transition.
Over many decades, the European Commission has been dedicating attention on research challenges for development and demonstration, isolated measures, and technologies rather than proposing an integrated approach where technologies and processes would work together in the urban environment. This situation changed in 2004 when the European Commission started strongly supporting this integration approach at the city level, specifically with the Framework Programme Research and Innovation 6 funding of the CONCERTO projects [30]. In line with this challenge, the Horizon 2020 framework has provided smart cities and communities lighthouse projects with approximately €500 million in funding for 2014–2020 [31].
In 2015, the SET-Plan Action 3.2 Smart Cities and Communities [32] promoted by the European Commission identified specific targets related to buildings. These include the development of the necessary interfaces to connect net-zero-energy buildings [33,34] and positive-energy buildings [35] to zero-energy blocks and districts [36,37]. This new concept integrates renewable energy systems, ICT solutions, smart meters, smart appliances, smart energy management, empowering tenants, improving planning management, and developing tools for scalable integrated design. In 2010, the Joint Programming Initiative (JPI) Urban Europe [38] was created to develop knowledge, tools, and platforms to help European cities on their way to sustainable urban transitions. This initiative connects public authorities, civil society, scientists, innovators, companies, and industry with the aim of providing a new environment for research and innovation in urban issues.
The European Energy Research Alliance (EERA) is the largest energy research community in Europe [39] made up of 250 universities and public centers from 30 European countries. The EERA mission is to catalyze energy research to achieve a climate-neutral society by 2050. With this aim, a wide range of low-carbon technologies that enable a clean energy transition are analyzed. To work on the priority lines of low-carbon technologies defined by the Strategic Energy Technology Plan, the EERA has created 17 Joint Programs (JP). One of these JP is focused on Smart Cities [40], contributing to research and innovation of Positive-Energy Districts (PED). Within this framework, the EERA Joint Programme on Smart Cities (EERA JP SC) has implemented the work established in the Temporary Working Group of the SET-Plan Action 3.2 on PEDs [32]. One of the strategic solutions and relevant actions proposed to respond to these challenges and targets is the use and development of a network of infrastructures for industrial research and demonstration through module 2. This strategic module assesses the development of city-driven Positive-Energy Districts Laboratories (PED Labs). One of the objectives of this module is to identify research testing platforms across countries in Europe that can be used for developing and testing integrated solutions and should work as drivers for local communities, districts, and cities.
This article makes a first mapping of the existing urban living laboratories in Europe in order to identify the resources available to deal with cross-cutting issues. To this end, only testing installations of the members of the EERA JP SC have been evaluated. General and more specific statistical studies have been developed to identify the main characteristics of these facilities. Finally, a SWOT analysis has been carried out to highlight the strengths, weaknesses, opportunities, and threats reached by the studied sample.
2. Materials and Methods
The implementation and monitoring of new technological and innovative solutions, governance models, socio-economic models, citizen participation or environmental issues highlight the most influential fluxes for transforming our neighborhoods. Based on this, PED Labs should consider many aspects to optimize different urban configurations under several conditions. These laboratories have to:
- Be flexible to allow the integration of different solutions.
- Take into account energy, social, environmental or economical aspects.
- Monitor the performance of a district solution under real conditions of use.
- Quantify the main fluxes that contribute to the studied configuration.
To identify the resources available in Europe that allows for evaluating integrative urban configurations, a first mapping of the existing urban living laboratories is needed.
This article makes a first mapping of the urban testing facilities that have been provided by the members of EERA JP SC. The methodology used has been divided into several stages. The first stage is to evaluate the capabilities of the existing urban infrastructures. With this aim, a factsheet has been developed to quantify the main characteristics of the living laboratories submitted. This factsheet describes the location of the installation, the field of action, the testing facilities available, the plant size, the main capacities of the installation, and the person of contact.
Figure 1 represents two examples of the factsheets describing the testing infrastructures provided by the EERA JP SC members. On the right side, the testing facility of National Laboratory of Energy and Geology (LNEG) in Lisbon (Portugal) is shown, while the left side corresponds to the testing laboratory of the Centre for the Development of Renewable Energy (CEDER-CIEMAT) in Soria (Spain).
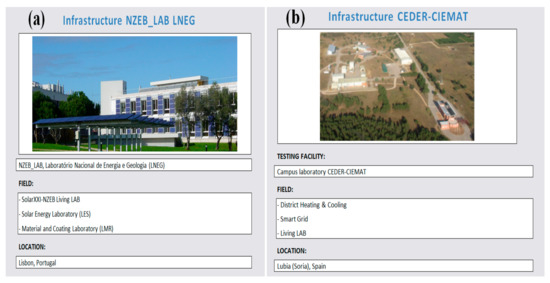
Figure 1.
Examples of factsheet developed by module 2 of the European Energy Research Alliance Joint Programme on Smart Cities (EERA JP SC). (a) NZEB lab in the facilities of LNEG, (b) campus lab in the facilities of CEDER-CIEMAT.
The second stage consists of a statistical study of the laboratories described in the submitted factsheets. This survey allows the identification of the frequency of boundary conditions, scale of action, facility application, and technologies available in these laboratories. These data have been disaggregated by each scale of action obtained in the studied sample. Finally, a SWOT analysis has been carried out to identify the strengths, weaknesses, opportunities, and threats found in the studied laboratories. This evaluation highlights the resources available, the critical points, the benefits produced, and the barriers reached in the operation of these urban living-labs.
3. Results
Once the information of the infrastructures submitted by the members of the EERA JP SC has been compiled, statistical studies have been performed to identify the main characteristics of these facilities. These evaluations provide information regarding climate conditions, the laboratory scale of action, facilities application, equipment, and technologies or experimental devices. This information can be used for development, testing, and optimizing different technologies and solutions, detecting what is available, and identifying what would be needed to create or replicate a new PED lab.
3.1. Case Studies
The first approach consists of sixteen testing platforms and existing facilities provided by the EERA JP SC members. These cases represent six European countries: Portugal, Spain, Belgium, Czech Republic, Finland, and Norway. Despite being a small sample, different regions are covered: North, south, and central Europe, as it can be seen in Figure 2. More cases should be included in these statistics in order to consider different climate conditions.
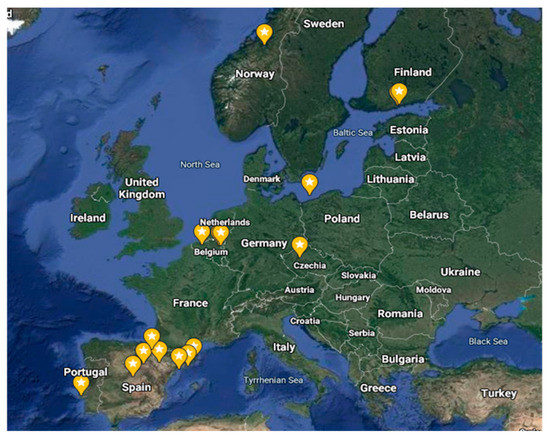
Figure 2.
European map highlighting the initial testing facilities studied by module 2 of EERA JP SC [Source: Google Maps].
Sixteen facilities have been compiled from Norwegian University of Science and Technology (NTNU); Spanish Centre for Energy, Environment and Technology Research (CIEMAT); Spanish Centre for the Development of Renewable Energy (CEDER-CIEMAT); Public University of Navarre & Campus Iberus (UPNA-Campus Iberus); University of Zaragoza & Campus Iberus (UniZar-Campus Iberus); eXiT research group from the Univeristy of Girona (ExiT RG-UdG); National Laboratory of Energy and Geology from Portugal (LNEG), Nieuwe Dokken district from Belgium; Energyville Centre from Belgium, Catalonian Institute for Energy Research (IREC), University Centre for Energy Efficient Buildings from the Technical University of Prague (UCEEB) and Technical Research Center of Finland Ltd (VTT). The study of these factsheets can help to highlight the capabilities available by the EERA JP SC members [33] to assess different aspects of PEDs across Europe.
The main characteristics of these infrastructures are summarized in Table 1 and are based on the results provided by the factsheets submitted.

Table 1.
Name, center, location, country, scale of action, and contact person defined for the sixteen cases submitted in the first approach.
3.2. Climate Conditions
The Köppen–Geiger classification [41] is used to highlight the climate representativeness of the sixteen studied cases. Figure 3 shows the Köppen–Geiger classification registered in Europe [42].
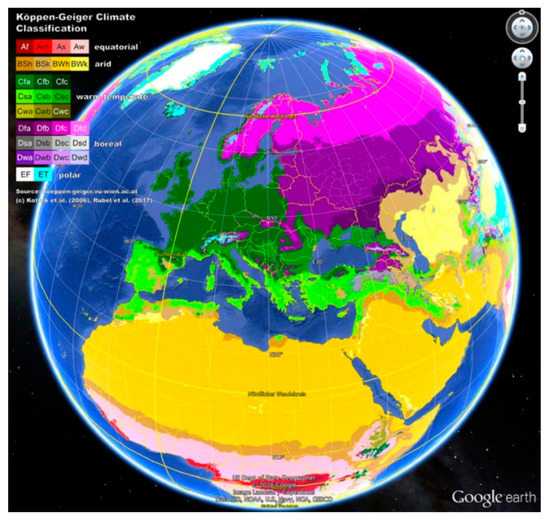
Figure 3.
European map of Köppen–Geiger classification developed by the Climate Change and Infectious Diseases Group [42].
The study sample covers temperate and continental climate conditions and excludes polar and tropical conditions. Six climate regions have been identified:
- Zone BSk is defined as cold and semi-arid climate. These zones are characterized by warm to hot dry summers and cold winters. The precipitation patterns for regions with higher latitudes correspond to dry winters and wetter summers. The precipitation patterns for regions with lower latitudes correspond to dry summers, relatively wet winters, and wetter springs and autumns. Only the city of Zaragoza in Spain is available in this climatic zone.
- Zone Csa is defined as hot-summer Mediterranean climate. These zones are characterized by hot and dry summers and mild and wet winters. Four Spanish regions are available in this climatic zone: Barcelona, Girona, Madrid, and Tarragona.
- Zone Cfb is defined as temperate oceanic climate. These zones are characterized by moderate temperature along the year, absence of a dry season and constant precipitation especially during the colder months. Three countries are available in this climatic zone: Spain (Soria and Pamplona), Belgium (Dilsen-Stokkem, Ghent, and Genk), and the Czech Republic (Buštěhrad).
- Zone Csb is defined as warm-summer Mediterranean climate. These zones are characterized by warm and dry summers and wet winters with temperatures that vary from mild to chilly climates. Only the city of Lisbon in Portugal is available in this climatic zone.
- Zone Dfb is defined as warm summer and humid continental climate. These zones, known as hemiboreal zones, are characterized by warm to hot and humid summers and cold winters (sometimes severe cold in northern areas). Precipitation is distributed throughout the year. Only the city of Espoo in Finland is available in this climatic zone.
- Zone Dfc is defined as subarctic climate. These zones are characterized by long and very cold winters and short summers with temperatures that vary from cold to mild climates. In these regions, there is no dry season and there are no significant seasonal differences in precipitation. Only the city of Trondheim in Norway is available in this climatic zone.
The percentage distribution of the climate zones registered by the case studies is shown in Figure 4. With this first sample, the most frequent conditions are characterized by temperate climate conditions (Cfb zone), followed by hot summer and mild winter areas (Csa zone). On the opposite side, cold and semi-arid areas (BSk zone) and warm summer with mild winter climates (Csb zone) are the most infrequent zones.
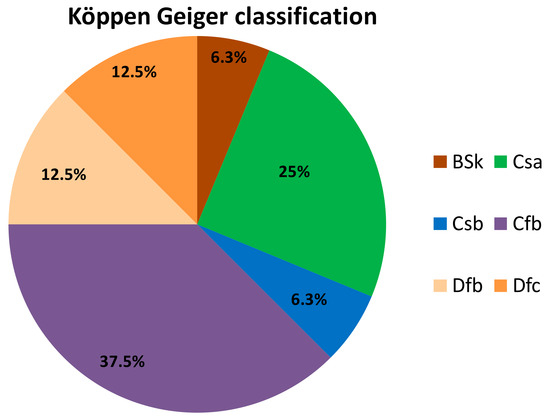
Figure 4.
Distribution of the Köppen–Geiger climate classification obtained for the studied cases.
The variability in the available climates allows the analysis of numerous urban configurations, taking into account all kinds of renewable and low-carbon technologies. Thermal conditioning strategies for both exterior spaces and interior buildings cover a wide range of measures, from the maximization of solar gains or optimal distribution for the wind flows to adiabatic cooling or optimized installation of shading elements. Unfortunately, this sample does not cover regions with more extreme climates such polar or tropical conditions.
3.3. Scale of Action
According to information provided by the factsheets, four scales of action have been identified for the studied cases: Building, campus, urban, and virtual. The differences between them are based on the dimensions, boundary conditions, and the energy fluxes that can be evaluated by these facilities. The first three scales of action have geographical limits for their facilities, while the fourth does not have these types of restrictions. Figure 5 shows the percentage distribution of the scales of action obtained for the studied cases. As can be seen, the campus and the building scale are the most common, both reaching more than 62% of the studied cases. These installations allow the evaluation and controlling of technical solutions and methodologies in two scales that, once optimized, can be implemented into the urban infrastructures. On the other side, virtual laboratories are the most infrequent cases with a percentage that does not exceed 13%. These installations allow the evaluation of energy exchanges that are not subject to geographic limits.
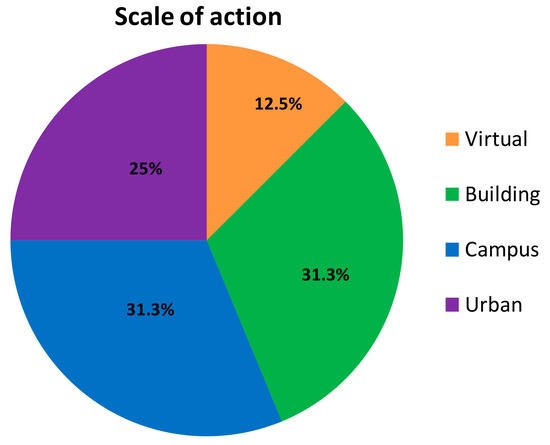
Figure 5.
Distribution of the action scale defined for the laboratories studied.
The scales of action defined for the laboratories determine the type of experiments than can be done. Different control levels are identified regulating the fluxes that contribute to the urban balance. The principal characteristics of these scales of action are:
- Building scale (green area). These facilities consider the building as a very small-scale urban experimental laboratory where energy exchanges between the building and its surrounding environment can be controlled. In these installations, the boundary conditions, as well as the building energy fluxes, are evaluated to identify the relevant flows that will affect the district scale. The ZEB lab is shown in Figure 6 as an example of the building scale.
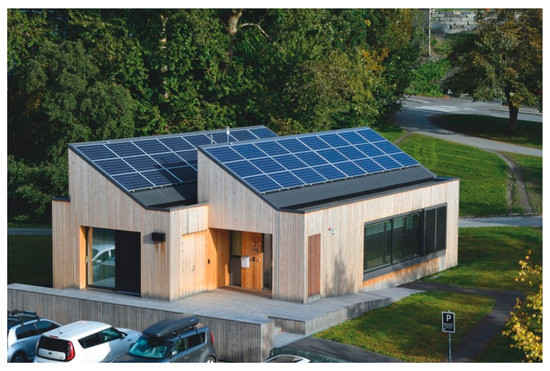 Figure 6. Building ZEB Lab provided by NTNU (Norway).
- Campus scale (blue area). This scale represents a testing district facility that operates under controlled conditions. These laboratories consider some elements of the district model such as buildings and conditioning networks, in which the energy fluxes are evaluated in a controlled manner. Several batteries of experiments can be performed to reproduce specific situations. The facilities of EnergyVille placed in Belgium are shown in Figure 7 as an example of this scale.
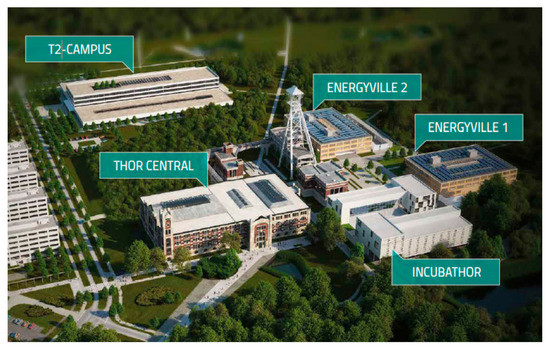 Figure 7. Diagram for the campus Thor Lab provided by EnergyVille (Belgium).
- Urban scale (purple area). This scale represents urban testing facilities operating under real conditions of use. Buildings, thermal networks, electrical networks or open spaces are elements of these laboratories. In these laboratories, all the urban interactions between people, buildings, and systems are represented, but not all of them can be controlled and calculated. The Lippulaiva lab is shown in Figure 8 as an example of the urban scale.
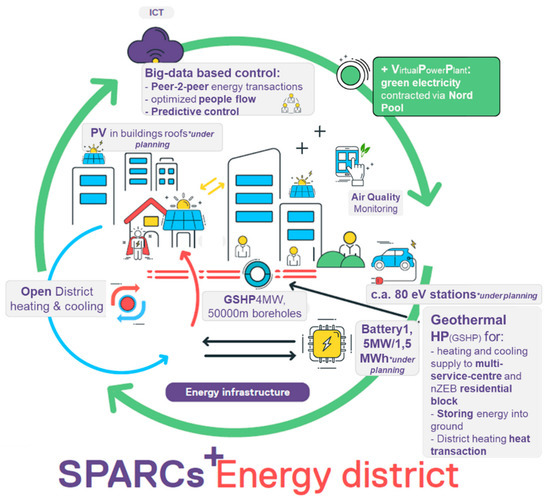 Figure 8. Diagram for the urban Lippulaiva Lab provided by VTT (Finland).
- Virtual scale (orange area). This scale represents a laboratory that can operate under real or simulated conditions of use. These facilities allow the evaluation of several urban fluxes, but high computing requirements are needed. Real measurements of different elements must feed these platforms to represent the urban energy fluxes correctly. The semi virtual SEILAB facility is shown in Figure 9 as an example of this scale.
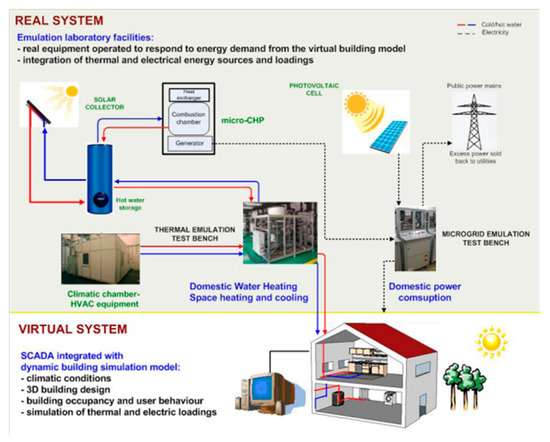 Figure 9. Diagram for the virtual SEILAB facility provided by IREC (Spain).
3.4. Facility Application
Based on the information provided by the factsheets, several applications for the testing facilities are identified. These uses define the type of experiments, the capacity of the laboratories, and the urban flows that can be assessed. These laboratories analyze different aspects of the urban balance, such as: Energy factors, environmental characteristics, information and communication technologies, or social aspects. The main applications identified are:
- Social aspects. The interactions between humans and their environment can be analyzed as an urban issue in the existing facilities.
- ICT/control. These laboratories assess the performance of control systems and technologies of information and communication.
- Outdoor climate conditions. The ambient climate conditions of the district can be evaluated through experimental devices.
- Indoor climate conditions. The ambient conditions inside the buildings can be monitored through the integration of experimental devices.
- Energy loads. The building performance can be quantified through the energy loads calculation. Two types can be evaluated: Thermal and electrical loads.
- Electrical vehicle. The interactions between electrical vehicles, buildings, and grids can be assessed through electrical mobility facilities.
- Lighting systems. The operation of artificial lighting systems produced in the district can be analyzed and regulated through different equipment.
- Energy networks. The energy interaction between the generation sources, distribution networks, and consumption points can be evaluated through the use of different devices. Two district types can be evaluated: Thermal (heating and cooling) and electrical networks.
- Storage elements. The fluctuations produced between the energy production and the demand side can be evaluated through the energy performance of the storage systems. Two types can be evaluated: Thermal and electrical storage.
- Water systems. The performance of water recovery systems or treatment of water can be assessed by means of different devices in the existing facilities.
- Waste treatments. These laboratories evaluate different solutions to minimize the urban waste and increase the environmental conditions.
The general statistics of the facility applications obtained for all the studied cases are shown in Figure 10. This figure represents a histogram with the frequencies of occurrence obtained for each application. The majority of the studied installations evaluate energy loads, energy networks, especially the electrical grids, and energy storage systems. Most of these laboratories have control or ICT systems to evaluate and optimize their operation. Many installations analyze the electrical vehicle and monitor ambient conditions, especially outdoors situations. On the opposite side, few installations assess lighting devices, social aspects, waste solutions, and water systems.
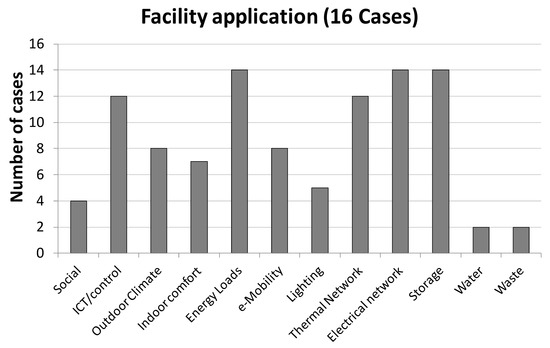
Figure 10.
Histogram of occurrence obtained for the facility applications of the studied cases.
3.5. Characteristics of Laboratories according to the Scale of Action
Once the possible applications of the testing infrastructures have been defined in a general way, the most common ones at each scale of action are identified, specifying the technologies that are involved in the experimental processes.
3.5.1. Building Scale
The smallest scale of action is the building scale, in which the exchanges between the building and the urban environment are regulated in a controlled manner. There are five testing facilities in the studied sample, located in four climate zones: One placed in the Cfb zone, one placed in the Csb zone, one placed in the Dfc zone, and two placed in the Csa zone. Figure 11 shows the technologies installed in the studied cases at the building scale. All of the installations evaluated at this scale of action assess the building energy loads, regulate the operation with ICT/control devices, and have electrical systems and thermal systems. The majority evaluate outdoor and indoor conditions and have storage devices. Three installations have implemented ventilation techniques and artificial lighting into the building. Finally, only one laboratory has water treatment and electrical vehicle assessment. There are other technologies installed inside these building laboratories such as phase-change materials or ventilated façades.
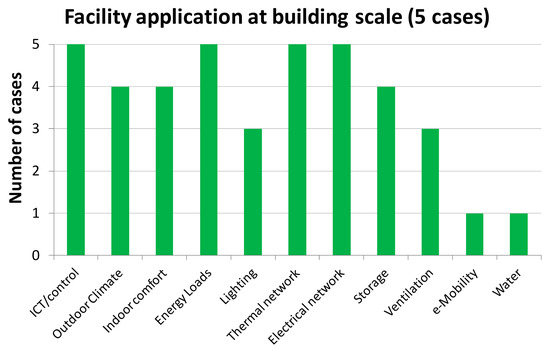
Figure 11.
Histogram of occurrence obtained for the facility applications at the building scale.
Attending to the technologies installed inside these controlled buildings, solar thermal collectors, photovoltaic panels, biomass boilers, wind turbines, heat exchangers, ground exchangers, energy storage systems, absorption chillers or water systems can be used to develop different batteries of experiments. Figure 12 shows the technologies installed in the studied cases. The installation of solar photovoltaic panels is the most common technology reached in the buildings studied. It is followed by solar thermal collectors. Heat exchangers, storage elements or cooling systems have been obtained with great percentages. No wind turbines or biomass boilers have been found in the test-buildings studied. In addition, other technologies are available in the building sample such as cogeneration systems or the organic Rankine cycle.
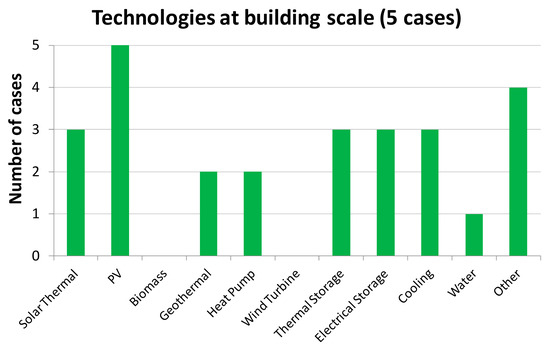
Figure 12.
Occurrence of the various technologies installed at the building scale.
3.5.2. Campus Scale
An intermediate scale of action is the campus scale, in which the urban exchanges are regulated in a controlled manner. There are five testing facilities in the studied sample, located in three climate zones: Three placed in the Cfb zone, one placed in the Csa zone, and one placed in the BSk zone. Figure 13 shows the histogram of occurrence obtained for the facility applications found at the campus scale. All these laboratories have control or ICT systems to optimize the use of the installations as well as energy storage systems. The majority of them have energy networks, especially electrical. Most of these laboratories integrate buildings into the campus installation and evaluate the ambient conditions, especially indoors. On the other side, only two laboratories analyze the electrical mobility and monitor outdoor conditions. There is no installation that considers water systems.
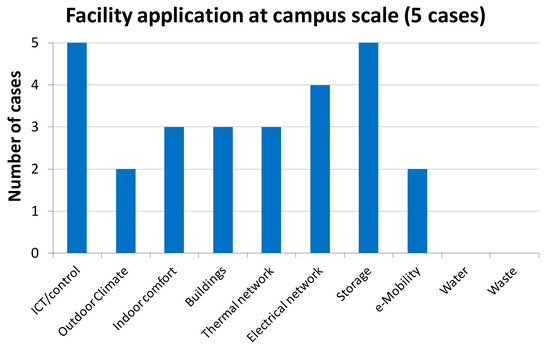
Figure 13.
Histogram of occurrence obtained for the facility applications at the campus scale.
Once the facility applications have been identified for the studied cases, the technologies installed should be highlighted, shown in Figure 14. This graph represents the histogram of occurrence reached by installations available at the campus scale. The majority of these testing laboratories have thermal and electrical storage systems.
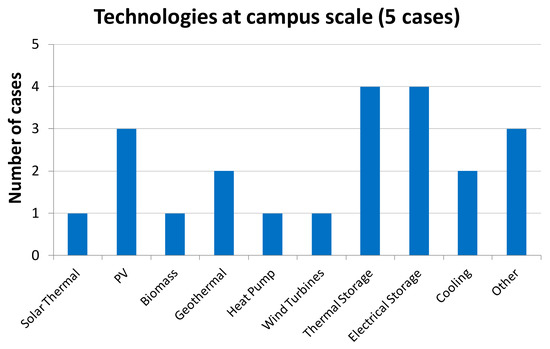
Figure 14.
Histogram of occurrence obtained for the technologies installed at the campus scale.
Most of the campus laboratories have installed solar photovoltaic panels, as well as other technologies such as an organic Rankine cycle, Stirling engines, fuel cells or LED lighting. Two laboratories have integrated geothermal and cooling systems. Solar thermal collectors, biomass boilers, heat pumps or wind turbines have been obtained in one case.
3.5.3. Urban Scale
The urban scale of action evaluates the urban interactions between buildings, technologies, and people, but not all of them are analyzed and regulated. There are four testing facilities in the studied sample, located in three climate zones: Two placed in the Cfb zone, one placed in Dfc zone, and one placed in the Dfb zone. By analyzing the factsheets provided by the EERA JP SC members, the histogram of occurrence for the facility applications is obtained and plotted in Figure 15. All the urban laboratories studied have considered social areas, and most of them have included buildings, thermal and electrical grids, electrical mobility, and the participation of citizens. Half of these facilities have green areas, ICT or control systems or have considered the treatment of the urban waste. Very few laboratories have included lighting systems, water treatments, and monitoring of urban outdoor conditions.

Figure 15.
Histogram of occurrence obtained for the facility applications at the urban scale.
The technologies included in these urban laboratories are photovoltaic solar panels, biogas boilers, geothermal heat pumps, thermal and electrical storage systems, and waste treatment. The percentage of occurrence of these technologies is shown in Figure 16. The most implemented technologies in the studied urban laboratories are photovoltaic panels and electrical storage. Half of these installations have included waste treatments. Only in one case, a biogas boiler, a geothermal heat pump or thermal storage systems have been installed. However, some of these laboratories have included efficient buildings, cogeneration plants or open-source technical infrastructures.
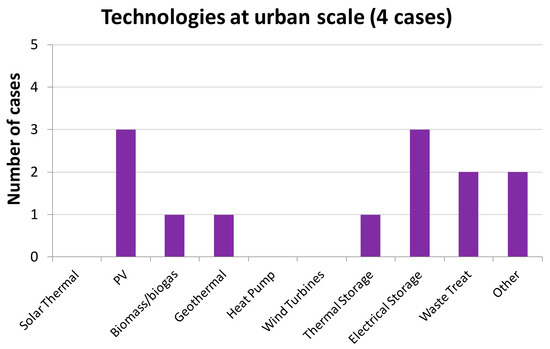
Figure 16.
Histogram of occurrence obtained for the technologies installed at the urban scale.
3.5.4. Virtual Scale
The virtual scale of action evaluates the urban interactions in a simulated environment based on real data. There are two testing facilities in the studied sample, located in the Csa and Dfb climate zones. Both testing laboratories evaluate outdoor conditions, building energy loads, and electrical vehicles. These labs assess the performance of several thermal and electrical technologies, as well as the operation of storage systems. All these energy flows are modeled and controlled through the use of ICT systems. Only one laboratory analyzes ambient conditions inside the buildings and only one laboratory considers lighting systems. Any virtual laboratory has integrated water treatment systems. All the applications found by these two facilities are shown in Figure 17.
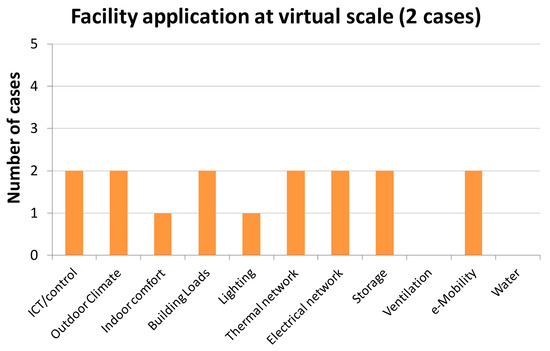
Figure 17.
Histogram of occurrence obtained for the facility applications at the virtual scale.
The most common technologies evaluated in these laboratories are: Photovoltaic solar panels, electrical storage, and virtual power plants, as can be seen in Figure 18. On the other hand, no solar thermal plants, ground exchanges, wind turbines or absorption chillers are available in these testing facilities. The laboratory placed in the Csa zone has electrical and heat test benches to emulate heat and electrical sources. It also has heat pumps, storage tanks, and gas boilers. The laboratory placed in the Dfb zone has district heating supplied by the renewable heat from a bio oil plant, a decentralized energy production, and the inclusion of an e-mobility hub. All these flows are managed through a virtual power plant.
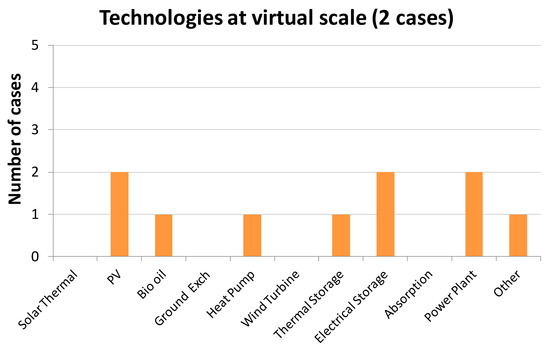
Figure 18.
Histogram of occurrence obtained for the technologies installed at the virtual scale.
3.6. SWOT Analysis
In order to know the real situation of the available urban laboratories and plan a future strategy for PED Labs, a SWOT analysis is carried out. This study highlights the strengths, weaknesses, opportunities, and threats reached by the whole studied sample. This SWOT analysis highlights the main technical, administrative, economic, social, environmental or other aspects that may constitute a barrier (weaknesses, threats) or those that may promote (strengths, opportunities) the development and replication of urban laboratories. The identification of these points makes it possible to know the available resources and requirements needed when analyzing different PED configurations.
The analysis performed includes the benefits and barriers obtained for the complete sample of the sixteen laboratories, but a more specific SWOT analysis can be done for each scale of action.
From the sample of sixteen facilities provided by the EERA JP SC members located throughout Europe, the following strengths have been identified:
Testing platforms STRENGTHS
- High climatic representativeness of Europe.
- Availability of different scales of action for the studied laboratories, allowing the assessment of several urban flows.
- Availability of measurements in real conditions of use and in virtual conditions.
- Availability of different technologies for the use of laboratories: Energy, social, e-mobility, ...
- Possibility of evaluating urban configurations that integrate various types of uses.
- Availability of different types of buildings, energy systems, and storage systems.
- High representativeness of renewable technologies.
- High generation potential of renewable technologies.
- Availability of other types of technologies such as cogeneration or Stirling engines.
- Diversification of energy generation and consumption due to the competitiveness of generation technologies and energy efficiency measures.
High availability and versatility of control systems.
Based on the information provided by this first dataset of the existing facilities, the following weaknesses have been identified:
Testing platforms WEAKNESSES
- Few laboratories available for the analysis sample. To raise the representativeness of the study, more cases should be added.
- Absence of extreme weather conditions: Tropical (climate zone A) and polar (climate zone E).
- Necessity to expand the climate applicability of this study. More dry (B zones) and continental (D zones) regions should be included.
- More virtual laboratories are needed.
- Low availability of laboratories that include social aspects, water, and waste flows.
- More cases of some renewable technologies should be included into the sample: Solar thermal technologies, wind turbines or biomass boilers.
- Gap between theoretical models and real situations of certain systems due to the lack of validation based on real data.
- Technical aspects in order to optimize the management of a combined configuration.
- Administrative, regulatory, and normative barriers can be found for the optimal operation of the laboratory.
- Absence of experimental analysis protocols for high scales of action.
The following opportunities have been identified:
Testing platforms OPPORTUNITIES
- Quantification of several urban flows thanks to the availability of different scales of action laboratories.
- Evaluation of the energy balance for combined urban solutions.
- Integrated management optimization for the resources and services of a district.
- Development of virtual PED labs to assess configurations that integrate different urban aspects.
- Helping tools to increase the decarbonization of the districts through sustainable models with a favorable impact on the quality of life of citizens.
- Optimization of solutions that promote the efficient renovation of the building stock and the optimization of public infrastructures.
- Improvement in the comfort perception and the environmental conditions in urban districts.
- Evaluate, under controlled conditions, the joint participation of different stakeholders for the development of positive-energy districts.
- Creation of qualified jobs.
Finally, the following threats have been identified:
Testing platforms THREATS
- Deviation in the obtained results due to the absence of measure protocols for PED labs.
- More regulatory barriers for urban large-scale laboratories.
- Need for flexible and efficient networks connected to the living labs.
- Administrative problems for urban large-scale laboratories due to data protection laws.
- Necessary investment for the implementation of some technologies and infrastructures.
- Legal barriers to construct an urban large-scale laboratory.
- Difficulty of defining a large-scale laboratory due to the existing urban layout in cities.
- Social lack of knowledge for the benefits produced by urban large-scale laboratories.
4. Discussion
To achieve the necessary energy transition in cities, it is essential to increase the renewable systems integration into urban energy networks, and to push energy efficiency performance levels of the built environment significantly beyond the levels of current European building codes. The development of efficient solutions that can be replicated or scaled up to the city level requires the use of urban laboratories. However, given the complexity of the urban context, it is necessary to have several scales of action for these laboratories in order to quantify and control different flows that contribute to the urban balance. Building, campus, urban, and virtual scales are identified to characterize the urban configurations. The first three scales have geographical restrictions; however, the fourth scale can operate under real or virtual conditions of use.
The use of PED laboratories as an analysis tool allows the quantification of flows of different configurations and identification of the critical points and the conditions that take place. Several technologies can be integrated into the monitored urban configurations, maximizing the use of efficient systems and renewable technologies. To achieve homogeneous conclusions from these living-labs, experimental analysis protocols and testing studies should be proposed.
Under the framework of the EERA Joint Program on Smart Cities, a factsheet has been designed to compile all the information regarding the capabilities of the living laboratories from the members. A statistical study has been performed to identify the boundary conditions, the scale of action, the facility applications, and the technologies available in these laboratories. Despite having only sixteen laboratories, a good representation of climatic zones in Europe has been obtained. Based on the Köppen–Geiger climatic classification, the most frequent zones for the studied laboratories are Cfb and Csa, while the most infrequent zones are BSk and Csb. To expand the applicability to extreme conditions, installations placed in tropical and polar climate zones should be added. More than 62% of the studied laboratories are built under building and campus scales of action (both in equal percentages), 25% are built under urban scales of action, and only 12.5% are built as virtual PED labs. It is necessary to develop more virtual laboratories that allow the analysis of integrated urban situations. From this study sample, most of the living-labs are focused on energy applications with a high contribution of networks and storage systems, as well as energy loads characterization. Many laboratories have high versatility to operate the installations using control and ICT technologies. There are a high percentage of laboratories that manage e-mobility and ambient conditions. Nevertheless, few integrate lighting devices, social aspects, and waste and water systems into the global installations. More laboratories with nonenergy uses must be added to increase the applicability of the urban results.
Attending to each scale of action, a high diversification is observed in the generation, storage, distribution, and consumption of energy. Different types of technologies are available (renewable and nonrenewable) that allow the evaluation of several urban configurations. There is a high contribution of renewable technologies, with solar photovoltaic generation being remarkable. However, to evaluate the high potential of other renewable technologies in the urban context, more laboratories with solar thermal collectors, wind turbines or biomass boilers should be added. Finally, different types and uses of buildings are available to quantify the urban loads. This fact enables flexibility when modelling the urban consumption profile.
A SWOT analysis has been carried out to highlight the technical, economic, environmental, administrative or social aspects found in the total sample studied, but it must be taken into account that there are different types of applications according to the laboratory scale of action. This scale defines the limits of benefits and barriers obtained in the testing facilities.
Once the first mapping of the existing living labs has been carried out, it is necessary to go deeper and identify other cross-cutting issues such as existing incentives, financial aspects, local and national policies, business models, and city planning. The complexity of these interrelations requires new approaches to address the problems in a holistic and integrated manner, using virtual PED labs to do so. These virtual laboratories will be fed with data from different sources (Building Information Modeling files, smart meters, Geographic information system, satellites, sensors), allowing the application of smart solutions that combine several urban configurations and open new paths to assess the transition to clean energy systems in cities.
5. Conclusions
The development of positive energy districts should be based on an integrative approach that considers not only energy efficiency and renewable integration across the built environment, but also other integrative processes. Within the urban context, different sectors, systems, strategies, goals, rights, and interests have to be considered. Therefore, urban models should take into account energy flexibility, the interaction between buildings and energy systems, the integration of users and local communities, economic issues, social aspects, environmental conditions, and legal considerations. In addition, all urban configurations should be designed based on climate change mitigation, decarbonization, and the energy transition targets.
The optimal planning of PEDs requires the knowledge of available natural resources, existing technologies, and their performance under specific boundary conditions. For this reason, it is necessary to have urban laboratories that allow testing, under real conditions of use, the most effective and sustainable solution for each geographical area. The use of PED labs makes it possible to optimize urban solutions, minimizing the existing risks in the implementation of measures. To quantify the urban flows as a function of the boundary conditions, it is necessary to have laboratories that operate under different scales of action. These laboratories should be flexible to test different configurations, with a representative sample of different conditions and applications being necessary. The complexity of the urban interrelations requires new approaches to address a solution holistically, meet the targets of sustainability strategies on various levels, and contribute to urban transition pathways at large. To homogenize the results obtained by these living-labs, it is necessary to have experimental analysis protocols. These protocols must have key and quantifiable indicators, which serve as a guide-control throughout the monitoring process. This methodology will allow the development of virtual PED labs with all the information collected from the existing facilities. These virtual tools allow the application of smart solutions that combine several urban configurations.
Author Contributions
Conceptualization, L.A., H.G., S.S., P.S.N. and J.A.F.; methodology, L.A., H.G., S.S., P.S.N. and J.A.F.; statistical study, S.S.; SWOT analysis, S.S. and L.A.; discussion, L.A., S.S. and P.S.N.; writing—original draft preparation, L.A., S.S. and P.S.N.; writing—review and editing, L.A., S.S. and P.S.N. All authors have read and agreed to the published version of the manuscript.
Funding
This research received no external funding.
Acknowledgments
This research has been developed in the framework of module 2 of the EERA Joint Program on Smart Cities. Authors would like to acknowledge the support given by the members of the EERA Joint Program on Smart Cities who have submitted the factsheet.
Conflicts of Interest
The authors declare no conflict of interest.
References
- European Commission. The Strategic Energy Technology Plan—At the Heart of Energy Research and Innovation in Europe; Communication from the Commission: Brussels, Belgium, 2018; ISBN 978-92-79-77316-7. [Google Scholar]
- United Nations. Department of Economic and Social Affairs, Population Division. In World Urbanization Prospects: The 2018 Revision; ST/ESA/SER.A/420; United Nations: New York, NY, USA, 2019; ISBN 978-92-1-148319-2. [Google Scholar]
- Balaras, C.A.; Droutsa, K.G.; Dascalaki, E.; Kontoyiannidis, S.; Moro, A.; Bazzan, E. Urban Sustainability Audits and Ratings of the Built Environment. Energies 2019, 12, 4243. [Google Scholar] [CrossRef]
- Sustainable Development—17 Goals to Transform Our World. United Nations. Available online: https://www.un.org/sustainabledevelopment/ (accessed on 30 September 2020).
- European Commission. The European Green Deal, Volume 53. 2019. Available online: https://eur-lex.europa.eu/legal-content/EN/TXT/HTML/?uri=CELEX:52019DC0640&from=EN (accessed on 30 September 2020).
- Fabbri, M.; DeGroote, M.; Rapf, O. Building Renovation Passports: Customised Roadmaps towards Deep Renovation and Better Homes; Buildings Performance Institute European: Brussels, Belgium, 2016; Volume 46, ISBN 9789491143175. [Google Scholar]
- Cartalis, C.; Synodinou, A.; Proedrou, M.; Tsangrassoulis, A.; Santamouris, M. Modifications in energy demand in urban areas as a result of climate changes: An assessment for the southeast Mediterranean region. Energy Convers. Manag. 2001, 42, 1647–1656. [Google Scholar] [CrossRef]
- Sánchez, M.; Soutullo, S.; Olmedo, R.; Bravo, D.; Castaño, S.; Jiménez, M. An experimental methodology to assess the climate impact on the energy performance of buildings: A ten-year evaluation in temperate and cold desert areas. Appl. Energy 2020, 264, 114730. [Google Scholar] [CrossRef]
- Pacheco, R.; Ordonez, J.; Martinez, G. Energy efficient design of building: A review. Renew. Sustain. Energy Rev. 2012, 16, 3559–3573. [Google Scholar] [CrossRef]
- Kheiri, F. A review on optimization methods applied in energy-efficient building geometry and envelope design. Renew. Sustain. Energy Rev. 2018, 92, 897–920. [Google Scholar] [CrossRef]
- Cao, X.; Dai, X.; Liu, J. Building energy-consumption status worldwide and the state-of-the-art technologies for zero-energy buildings during the past decade. Energy Build. 2016, 128, 198–213. [Google Scholar] [CrossRef]
- Rezaie, B.; Rosen, M.A. District heating and cooling: Review of technology and potential enhancements. Appl. Energy 2012, 93, 2–10. [Google Scholar] [CrossRef]
- Taleghani, M.; Tenpierik, M.; Kurvers, S.S.R.; Dobbelsteen, A.V.D. A review into thermal comfort in buildings. Renew. Sustain. Energy Rev. 2013, 26, 201–215. [Google Scholar] [CrossRef]
- Yang, W.; Moon, H.J. Combined effects of acoustic, thermal, and illumination conditions on the comfort of discrete senses and overall indoor environment. Build. Environ. 2019, 148, 623–633. [Google Scholar] [CrossRef]
- Heibati, S.; Maref, W.; Saber, H.H. Assessing the Energy and Indoor Air Quality Performance for a Three-Story Building Using an Integrated Model, Part One: The Need for Integration. Energies 2019, 12, 4775. [Google Scholar] [CrossRef]
- Reynders, G.; Lopes, R.A.; Marszal-Pomianowska, A.; Aelenei, D.; Martins, J.; Saelens, D. Energy flexible buildings: An evaluation of definitions and quantification methodologies applied to thermal storage. Energy Build. 2018, 166, 372–390. [Google Scholar] [CrossRef]
- Eshraghi, A.; Salehi, G.; Heibati, S.; Lari, K. An enhanced operation model for energy storage system of a typical combined cool, heat and power based on demand response program: The application of mixed integer linear programming. Build. Serv. Eng. Res. Technol. 2018, 40, 47–74. [Google Scholar] [CrossRef]
- Calise, F.; D’Accadia, M.D.; Piacentino, A. Exergetic and exergoeconomic analysis of a renewable polygeneration system and viability study for small isolated communities. Energy 2015, 92, 290–307. [Google Scholar] [CrossRef]
- Hiremath, R.; Shikha, S.; Ravindranath, N. Decentralized energy planning; modeling and application—A review. Renew. Sustain. Energy Rev. 2007, 11, 729–752. [Google Scholar] [CrossRef]
- Drysdale, D.; Jensen, L.K.; Mathiesen, B. Energy Vision Strategies for the EU Green New Deal: A Case Study of European Cities. Energies 2020, 13, 2194. [Google Scholar] [CrossRef]
- Macedo, J.; Rodrigues, F.; Tavares, F. Urban sustainability mobility assessment: Indicators proposal. Energy Procedia 2017, 134, 731–740. [Google Scholar] [CrossRef]
- Lindenau, M.; Böhler-Baedeker, S. Citizen and Stakeholder Involvement: A Precondition for Sustainable Urban Mobility. Transp. Res. Procedia 2014, 4, 347–360. [Google Scholar] [CrossRef]
- Serna, A.; Gerrikagoitia, J.K.; Bernabé, U.; Ruiz, T. Sustainability analysis on Urban Mobility based on Social Media content. Transp. Res. Procedia 2017, 24, 1–8. [Google Scholar] [CrossRef]
- European Environment Agency. Air Quality in Europe—2018 Report. Available online: https://www.eea.europa.eu/publications/air-quality-in-europe-2018 (accessed on 30 September 2020).
- Morawska, L.; Thai, P.K.; Liu, X.; Asumadu-Sakyi, A.; Ayoko, G.; Bartonova, A.; Bedini, A.; Chai, F.; Christensen, B.; Dunbabin, M.; et al. Applications of low-cost sensing technologies for air quality monitoring and exposure assessment: How far have they gone? Environ. Int. 2018, 116, 286–299. [Google Scholar] [CrossRef]
- Martínez-Bravo, M.M.; Martínez-del-Río, J.; Antolín-López, R. Trade-offs among urban sustainability, pollution and livabiity in European cities. J. Clean. Prod. 2019, 224, 651–660. [Google Scholar] [CrossRef]
- Van Broekhoven, S.; Vernay, A.L. Integrating Functions for a Sustainable Urban System: A Review of Multifunctional Land Use and Circular Urban Metabolism. Sustainability 2018, 10, 1875. [Google Scholar] [CrossRef]
- Ferreira, V.; Barreira, A.P.; Loures, L.; Antunes, D.; Panagopoulos, T. Stakeholders’ Engagement on Nature-Based Solutions: A Systematic Literature Review. Sustainability 2020, 12, 640. [Google Scholar] [CrossRef]
- Margerum, R.D. Evaluating Collaborative Planning:Implications from an Empirical Analysis of Growth Management. J. Am. Plan. Assoc. 2002, 68, 179–193. [Google Scholar] [CrossRef]
- Concerto European Initiative. Available online: https://www.concertoplus.eu/ (accessed on 30 September 2020).
- Horizon. 2020. Available online: https://ec.europa.eu/programmes/horizon2020/en (accessed on 30 September 2020).
- SET-Plan Working Group. Europe to Become a Global Role Model in Integrated, Innovative Solutions for the Planning, Deployment, and Replication of Positive Energy Districts. SET-Plan Action No 32 Implement Plan, 1–72. 2018. Available online: https://setis.ec.europa.eu/system/files/setplan_smartcities_implementationplan.pdf (accessed on 30 September 2020).
- Ferrara, M.; Monetti, V.; Fabrizio, E. Cost-Optimal Analysis for Nearly Zero Energy Buildings Design and Optimization: A Critical Review. Energies 2018, 11, 1478. [Google Scholar] [CrossRef]
- Sartori, I.; Napolitano, A.; Voss, K. Net zero energy buildings: A consistent definition framework. Energy Build. 2012, 48, 220–232. [Google Scholar] [CrossRef]
- Magrini, A.; Lentini, G.; Cuman, S.; Bodrato, A.; Marenco, L. From nearly zero energy buildings (NZEB) to positive energy buildings (PEB): The next challenge—The most recent European trends with some notes on the energy analysis of a forerunner PEB example. Dev. Built Environ. 2020, 3, 100019. [Google Scholar] [CrossRef]
- Marique, A.-F.; Reiter, S. A simplified framework to assess the feasibility of zero-energy at the neighbourhood/community scale. Energy Build. 2014, 82, 114–122. [Google Scholar] [CrossRef]
- Amaral, A.R.; Rodrigues, E.; Gaspar, A.R.; Gomes, Á. Review on performance aspects of nearly zero-energy districts. Sustain. Cities Soc. 2018, 43, 406–420. [Google Scholar] [CrossRef]
- JPI Urban Europe. Available online: https://jpi-urbaneurope.eu/ (accessed on 30 September 2020).
- European Energy Research Alliance (EERA). Available online: www.eera-set.eu/ (accessed on 30 September 2020).
- EERA. Joint Programme on Smart Cities. Available online: www.eera-sc.eu/ (accessed on 30 September 2020).
- Köppen, W.; Geiger, R. Das Geographische System der Klimate. Handbuch der Klimatologie; Bulletin of the American Geographical Society: Berlin, Germany, 1936; Volume 43, Available online: http://koeppen-geiger.vu-wien.ac.at/pdf/Koppen_1936.pdf (accessed on 30 September 2020).
- Vetme University of Wien. Available online: http://koeppen-geiger.vu-wien.ac.at/ (accessed on 30 September 2020).


Publisher’s Note: MDPI stays neutral with regard to jurisdictional claims in published maps and institutional affiliations. |
© 2020 by the authors. Licensee MDPI, Basel, Switzerland. This article is an open access article distributed under the terms and conditions of the Creative Commons Attribution (CC BY) license (http://creativecommons.org/licenses/by/4.0/).