Abstract
Offshore wind could both play a significant role in decarbonising the global energy system and supporting the energy needs of cities. Recent trends in offshore wind have seen the installation of turbines in deeper and more remote waters due to the presence of stronger and more consistent wind resources. This has led to the development of floating foundations for turbine mounting in water depths above 40 m, where conventional bottom-fixed foundations are not considered economically feasible. However, due to its emerging nature, floating wind must attain market maturity to be considered cost competitive. It is a widely accepted belief that market expansion yields technological maturity. Therefore, this paper adopts a systems approach to investigate the viability of floating offshore wind power generation in Scotland and South Africa. It does this through a content analysis of relevant secondary documentation, including policy documents, industry reports, press releases, online publications, and databases to determine the drivers and barriers of floating wind in the case contexts. The key findings are that substantial technical potential is required to attract floating wind investments, political support is necessary in order to scale up, a strong offshore wind supply chain could cushion the high-cost effects of floating wind projects, and more innovative business models such as corporate Power Purchasing Agreements could serve as social drivers for such projects. The main contextual conclusions drawn from this paper are that Scotland’s inaugural floating wind projects benefitted from the Scottish government’s Renewable Obligation scheme, however its discontinuation threatens the prospects of future projects. Alternatively, South Africa’s technical potential, coupled with its government’s healthy appetite for renewable energy development, could see the take up of this technology in the near future, with corresponding benefits for more sustainable energy in densely populated areas, compliant with SDG 7.
1. Introduction
Climate change is widely considered as an existential threat and is mainly linked to energy consumption and greenhouse gas (GHG) emissions. As a result, many organisations have called for concentrated efforts towards limiting global emissions in order to ensure a sustainable global future [1,2,3,4]. The United Nations Framework Convention on Climate Change (UNFCCC) has further rallied for accelerated and united actions by instituting the Paris Agreement, whose short-term aim is to hold “the increase in global average temperature to well below 2 °C above pre-industrial levels” [5] (p. 3). In addition, the 2030 Sustainable Development Agenda was adopted by all United Nation members in 2015 to serve as a shared blueprint towards a global sustainable future, with Sustainable Development Goal (SDG) 7 hinging on affordable and clean energy [6].
Consequently, wind energy is increasingly playing a key role in the global energy transition, and currently makes up 50% of the global renewable generation (excluding hydro power) [7]. Wind power has a total global installed capacity of 651 GW, with onshore wind representing about 95% of that total [8]. Onshore wind’s continued dominance can be attributed to technological advances and falling costs, and is expected to keep dominating for the next three decades [9]; however, continuous technological advancements have led to an increase in turbine sizes [10], and could see an ascendency of offshore wind due to the reduced noise and visual impact of offshore wind farms [11]. Besides, 6.1 GW of offshore wind capacity was installed in 2019, bringing the total global installed capacity to 29.1 GW [8]. Furthermore, recent trends in offshore wind technology have seen an increase in the water depth and the distance from shore of offshore wind farms [10], necessitating the deployment of floating foundations for turbine mounting.
Floating offshore wind technology (FOWT) utilises floating foundations (such as spar, tension-leg platform (TLP), and semi-submersible. The Spar design is a “cylindrical ballast-stabilised structure which gains its stability from having the centre of gravity lower in the water than the centre of buoyancy” [12] (p. 18). The TLP is a highly buoyant structure that is moored to the seabed with taut leg mooring lines and drive/suction piles to help deal with the huge vertical loads placed on the mooring lines [12]. The semi-submersible design is basically made up of a number of large columns interconnected by submerged pontoons, which combine to provide hydrostatic stability and additional buoyancy, respectively [13]) for turbine mounting [14], in water depths above 40 m, where bottom-fixed structures are not considered economically feasible [15]. Furthermore, floating foundations are considered capable of unlocking greater offshore wind power generation due to the availability of stronger wind resources in deeper and more remote waters [16]. This claim has been supported by Equinor’s Hywind Scotland Pilot Park, the world’s first commercial floating wind array, which announced a record 56% average capacity factor in its first two years of operation [17]. However, due to its nascent nature, floating offshore wind (FOW) energy is often associated with high costs [12], but cost reductions could be realised with adequate industry and government support [18]. Additionally, floating wind must experience rapid market expansion to take advantage of the cost reduction benefits of economies of scale [19].
Moreover, FOWT addresses SDG target 7.3, which is to “double the global rate of improvement in energy efficiency by 2030” [6]. The intermittent nature of variable renewable energy (VRE) sources (e.g., wind and solar) poses a challenge of flexibility, which is defined as “the capability of a power system to cope with the variability and uncertainty that solar and wind energy introduces at different timescales” [20] (p. 9). However, this challenge of flexibility can be solved by two strategies—improving the suitability of VRE for the wider energy system and/or making the whole energy system more compatible for VRE [21]. FOWT is concerned with the former, as its ability to capture more potent wind resources has proven to yield a higher capacity factor in offshore wind farms, as in the case of Hywind Scotland Pilot Park [17].
Several authors attest to the technical viability of FOWT [12,16,17,18,19]; however, no study has holistically assessed the feasibility of floating wind to date. This paper adopts a whole systems approach to investigate the drivers for and barriers to the take up of FOWT. The case studies—Scotland and South Africa—were chosen for the following reasons: First, following the commissioning of two major projects (Hywind Scotland Pilot Park and Kincardine Offshore Wind Farm), Scotland could serve as an example for countries intending to explore floating wind; however, the third major Scottish floating wind project, Dounreay Tri Floating Wind Farm, has been placed on hold [22], thereby leaving the future of floating wind in the country in question. Second, South Africa’s electricity sector has an installed capacity of 51.3 GW, with only 8.8% generated from renewable sources [23]. With 86% of its population said to have access to electricity [23], the South African government has set targets in its National Development Plan 2030, including ensuring that at least 90% of its population have access to the electricity grid by 2030 [24]. Furthermore, there is significant offshore wind in South Africa, with potential generation capacities of 57 and 589 GW on fixed and floating foundations, respectively [25].
2. Methodology
This paper adopts a whole systems approach in examining the feasibility of floating offshore power generation through a content analysis of secondary data for Scotland and South Africa. Owing to the relative novelty of FOWT, there was a lack of specific literature to form a model for assessing the chosen case studies. Consequently, this work explored the wider literature on the influencing factors of renewable energy (RE) deployment to identify themes for case study analysis. A combination of keywords, such as “drivers”, “barriers”, “renewable”, “energy”, “technology”, etc., were utilised in this search. Furthermore, at the time of research, the Scottish case study provided the most thorough review of the floating wind market and technology. Therefore, considering the various influencing factors of RE deployment cited in the literature [13,23,24] and the Carbon Trust’s and Hannon et al.’s studies on floating offshore wind market and technology [12,16], this paper qualitatively assesses the drivers and barriers of FOWT in the case study contexts using the systems framework presented in Figure 1. The presented themes are explained thus:
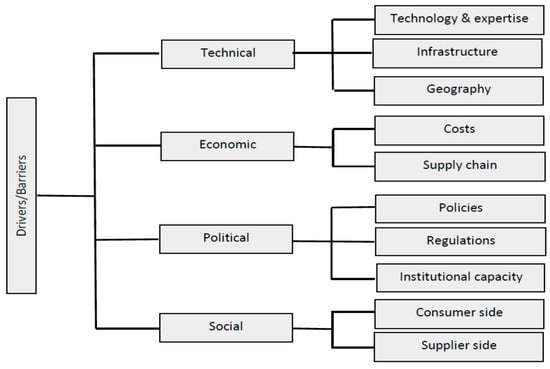
Figure 1.
Framework for analysing the drivers and barriers of FOWT.
- Political: This area is concerned with how various government policies and regulations combine to facilitate the generation of energy through different renewable sources.
- Economic: Addresses how the interactions within the energy network (i.e., supply chain) influence the levelised cost of electricity.
- Technical: This area involves geographical attributes—such as mean wind speeds—which determine the generation capacity, infrastructural capacity, and technological potential of the case studies.
- Social: This deals with the general public’s interaction with renewable energy development, and ranges from supplier engagement, due to revenue reasons, to consumer acceptance and issues such as environmental degradation and local community consultation.
Data were obtained from a variety of sources. First, an online offshore wind database, 4COffshore, was used to source project-level data for the three major floating wind projects in Scotland—Hywind Scotland Pilot Park, Kincardine Offshore Wind Farm, and Dounreay Tri Floating Wind Farm—with company websites used to verify and collect missing data. Secondly, industry reports were retrieved from the Carbon Trust, Offshore Renewable Energy (ORE) Catapult, Marine Scotland, etc.
The South African case study draws on various government reports, energy sector reviews, energy industry actors, and online publications such as the Department of Mineral Resources and Energy, the South African Wind Energy Association, the International Renewable Energy Agency, ESI Africa, Energy Sector Management Assistance Program (ESMAP), United States Agency for International Development (USAID) etc., combining to help assess the renewable energy (RE) deployment appetite; drivers; barriers; and, consequently, the potential of FOW power generation in South Africa.
3. Results
3.1. Scotland: Drivers for and Barriers to the Take up of FOWT
3.1.1. Technical Factors
Drawing from the framework in Figure 1, the technical factors influencing the deployment of FOWTare technology and expertise, infrastructure, and geography.
Figure 2 technical drivers and barriers of FOWT.
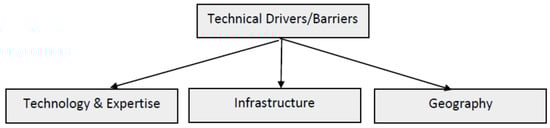
Figure 2.
Technical drivers and barriers of FOWT.
Technology and Expertise. FOW technology and expertise involves the design, manufacture, installation, operation, and maintenance of turbines, floating foundations, moorings, anchors, and electrical interconnections.
Looking at the commissioned Kincardine Offshore Wind Farm and Hywind Scotland Pilot Park projects, a similar trend is noticed. Countries across Europe were heavily involved in the supply of the offshore wind farm components, while UK companies were mostly involved in its installation, operations, and maintenance (see Table A1 and Table A2). For example, Siemens (Germany) and MHI Vestas (Germany) provided turbines for the Hywind Scotland and Kincardine Offshore projects, respectively, while Granada Material Handling Ltd (UK) and Global Offshore (UK) were mainly responsible for the on-site installations. This points to an existing technological competence in Scotland, which could be attributed to the thriving UK offshore wind market. Additionally, according to the Global Wind Energy Council’s offshore wind statistics [8], the UK hosts 33% of the global offshore wind installations, and considering the presence of transferable skills from the more mature bottom-fixed offshore market as in turbine maintenance, metocean monitoring, weather forecasting, etc., it can be said that this was advantageous to the success of the Kincardine and Hywind projects.
Geography. The geographical attributes necessary for the deployment of FOW energy generation are water depths greater than 40 m, high average mean speeds, and favourable metocean and geotechnical conditions [12]. Marine Scotland’s study identified potential sites suitable for FOW development [26]. The criteria for selection were wind speeds greater than 9 m/s, water depths greater than 35 m, and various constraints such as military activities, fishing activity, shipping routes, etc. The sites labelled 1–7 in Figure 3 include Dog’s Hole (1) and Buchan Deep (2), which were used for the Kincardine Offshore Wind Farm and the Hywind Scotland Pilot Park projects, respectively. Furthermore, Buchan Deep was found to be 95–120 m, which was suitable for Hywind’s Spar-buoy concept, while Dog’s Hole was appropriate for Kincardine’s Windfloat semi-submersible concept [12].
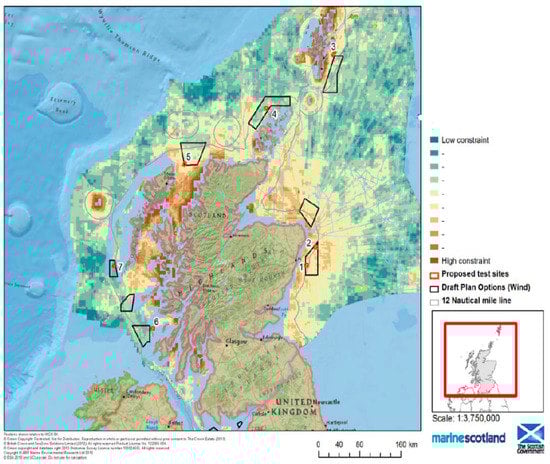
Figure 3.
Potential sites for FOW deployment labelled 1–7. Source: Marine Scotland, 2014.
Infrastructure. This mainly involves the port facilities required to aid the assembly of floating offshore components before they are towed to site and the grid infrastructure to enable the transmission of power to end users.
As seen in Figure 4, Scotland has adequate port capability to accommodate the assembly of various floating foundation types, but the Nigg Energy Park and Port of Peterhead are the only two ports likely to accommodate all foundation types, while most are seen to either have potential or as being unlikely to accommodate component assembly. The Kinshorn Port was first identified as suitable for the fabrication and assembly of the five 6 MW Hywind turbines; however, due to inferior port facilities and contracting issues, the project was eventually awarded to Stordbase AS (a Norwegian port facility) [27]. A similar story is the Kincardine Offshore Wind Farm case study, where the Navantia Fene Yard in Spain was chosen over the available Scottish ports for the assembly of the five remaining floating foundations [28]. Nevertheless, in the Dounreay Tri Floating Offshore Wind Farm project, assembly works were expected to begin in the Nigg Energy Park port facility in Scotland in the third quarter of 2018 [29], before the project’s shareholders decided to stop funding it due to uncertainties around meeting the 3.5 Renewable Obligation (RO) October 2018 deadline [19].
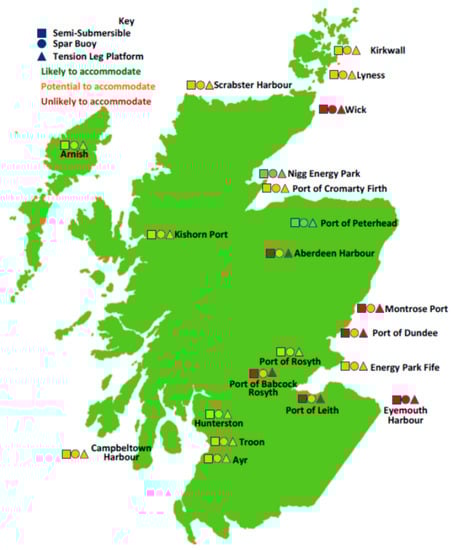
Figure 4.
Scottish port floating wind capabilities. Source: Carbon Trust and ORE Catapult (2017).
The UK’s Department for Energy and Climate Change’s Environmental Report cite an availability of connection points to the onshore transmission grid as a significant factor for offshore wind development sites [30], therefore grid availability is key for floating wind deployment. Consequently, the grid availability status of the potential zones identified by Marine Scotland for floating wind development were highlighted in the Carbon Trust and ORE Catapult’s study [27]. The zone south-east of Aberdeen was seen to have suitable grid connection points, which explains the Kincardine project’s ability to secure grid access. Similarly, the zone north-east of Aberdeen, which houses the Hywind Scotland Pilot Park, provided several suitable points for onshore grid connection. Furthermore, the Carbon Trust’s [12] Floating Offshore Wind Market and Technology report noted that a lack of access to grid connection raised a question of the ability of some floating wind projects to meet the 3.5 Renewable Obligation deadline in October 2018. Therefore, it can be inferred that the Dounreay Tri project may have been put on hold partly because of an inadequate grid infrastructure.
3.1.2. Political Factors
Figure 5 illustrates about political drivers and barriers of FOWT.
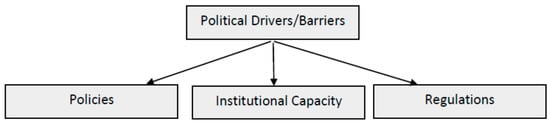
Figure 5.
Political drivers and barriers of FOWT.
Policies. The UK government launched its Offshore Wind Sector Deal in 2019, pledging support for FOW in a bid to accelerate efforts towards achieving its 30 GW offshore wind capacity target by 2030 [31]. In response to this, the Scottish Government set up the Scottish Offshore Wind Energy Council (SOWEC) to maximise the returns of the new deal for Scotland’s offshore wind sector [32].
This existing and continued policy support has yielded grants and subsidy support for offshore wind projects across the UK. In Scotland, an enhanced RO scheme was made available for floating wind projects [33], which was secured by both Kincardine and Hywind projects before its October 2018 deadline (see Table A1 and Table A2). This scheme provided 3.5 Renewable Obligation Certificates (ROCs) per MWh for floating wind generation to ensure its competitiveness amid more mature RETs. Nevertheless, the closing of the scheme in October 2018 has left floating wind with Contract for Difference (CfD) as the only available subsidy scheme. The CfD allocation round 3, which opened in May 2019, sets the administrative strike price at £53–£56 per MWh for both bottom-fixed and floating wind power generation [34].
Regulations. To expand on the benefits of the 3.5 ROCs received by the Kincardine and Hywind projects, the RO places a responsibility on UK electricity suppliers to provide a stated number of ROCs per MWh of electricity supplied [35]. This implies that UK suppliers must source a certain percentage of energy from renewable generators per MWh of electricity supplied. Therefore, floating wind projects in Scotland, who successfully commissioned projects before the October 2018 deadline, are expected to make around £205 (i.e., 3.5 × 48.78 + 35) from ROCs per MWh of electricity sold, considering a current ROC buy-out price of £48.78 [36] and an electricity wholesale price of £35 per MWh [37].
Furthermore, the CfD mechanism promises only a £53–£56 strike price per MWh for all offshore wind projects. Therefore, assuming a wholesale price of £35, the UK government’s Low Carbon Contracts Company (LCCC) pays the generator £18–£21 per MWh of electricity sold. However, it is a two-way contract [38]. For example, assuming a wholesale price of £70 per MWh, the generator would be required to pay £14–£17 to the LCCC. Consequently, the high levelised cost of electricity (LCOE—the levelised cost of electricity (“cost of energy”) is defined as the revenue required (from whatever source) to earn a rate of return on investment equal to the discount rate (also referred to as the weighted average cost of capital or WACC) over the life of the wind farm [13] (p. 14)) of around £177 per MWh for floating wind generation [12] further explains the decision to put the Dounreay Tri Floating Offshore Wind Farm project on hold.
Institutional Capacity. The RO and CfD schemes indicate an inherent institutional capability to support floating wind projects. Furthermore, the Offshore Wind Sector Deal arguably represents the willingness of the UK government to support continued growth in FOWT.
3.1.3. Economic Factors
Figure 6 illustrates about economic drivers and barriers of FOWT.
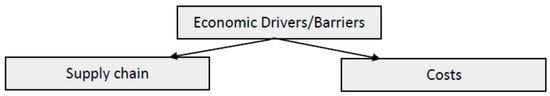
Figure 6.
Economic drivers and barriers of FOWT.
Supply Chain. As seen in both the commissioned Scottish floating wind projects, the European supply chain played a major role in the supply of components (see Table A1 and Table A2). For example, a German company, Siemens, provided the turbines; Equinor (Norway) supplied the foundation; while MacGregor Cargotec (Finland) and Nexan Norway AS supplied the array and export cables for the world’s first commercial floating wind farm, Hywind Scotland Pilot Park. A similar trend was seen in the Kincardine project, where MHI Vestas (Germany) provided wind turbines, Navantia (Spain) and Windar (Spain) fabricated the floating foundation, and Vryhof (Netherlands) supplied the moorings and anchors. This trend has arguably been aided by the European Economic Area (EEA) agreement. “The EEA agreement extends the EU single market and free movement of goods, services, people and capital (…) to Norway, Iceland and Lichtenstein” [39] (p. 6). However, with the UK leaving the European Union and going through a transition period until 1st January 2021 [40], its effect on the future of floating wind projects in the UK remains unclear.
Furthermore, the UK government, via the Offshore Wind Sector Deal, has committed to increasing the UK capital expenditure (CAPEX) content to 60% by 2030 [31]. This includes increases in capital expenditure, which for floating wind projects could mean investments in turbines, foundations, moorings, and anchor supply-chain companies. However, BVG Associates’ study of the UK Offshore Wind Supply Chain found a low potential in growing the UK content in capital expenditures [41] due to a lack of supply track record and market readiness for commercial scale offshore wind projects. On the other hand, the installation, commissioning, and operations and maintenance (O&M) services in both commissioned floating wind projects were mostly carried out by UK companies. This is in consonance with the BVG Associates’ findings of an excellent UK supply track record and high market readiness for commercial-scale turbine installations, foundation installations, subsea cable installations, and O&M services [41].
Costs. According to Quest Floating Wind Energy (FWE) [42], the total CAPEX costs for the Kincardine Offshore Wind Farm Phase 2 (i.e., five 9.5 MW turbines) is estimated at 400 million USD, with turbines priced at 151 million USD, platforms at 105 million USD, moorings amounting to 32 million USD, cabling at 63 million USD, installation at 10 million USD, and other expenses totalling 40 million USD. These figures are consistent with the Carbon Trust’s CAPEX breakdown of commercial wind farms, as seen in Figure 7. However, for the Dounreay Tri Floating Wind Farm project, with an estimated CAPEX at 49 million USD [42], the turbine and foundation costs are said to be 15 million USD and 17 million USD, respectively [42], which could be attributed to the mounting of two wind turbines on a single platform, as seen in Table A3. Furthermore, the current operational expenditure (OPEX) costs for floating wind projects are said to be around 147,000 USD/MW for a 20-year project lifetime [43]. Subsequently, the LCOE cost for pre-commercial floating wind projects is estimated at 197–219 USD/MWh [18], consistent with the Carbon Trust’s estimation of 219 USD/MWh [12]. This is a lot higher than the average LCOE of bottom-fixed offshore wind, marked at 127 USD/MWh [10].
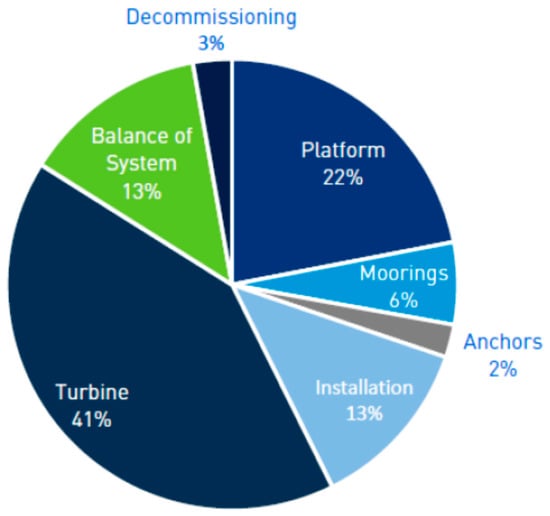
Figure 7.
CAPEX breakdown for commercial floating wind projects. Source: Carbon Trust (2015) (N/B: balance of system refers to electrical infrastructure).
3.1.4. Social Factors
Figure 8 illustrates about social drivers and barriers of FOWT.
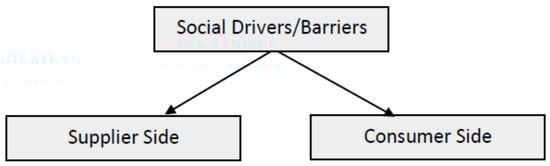
Figure 8.
Social drivers and barriers of FOWT.
Suppliers. The Renewable Obligation scheme is set out to support large-scale renewable electricity projects in the UK. “The RO places an obligation on licensed electricity suppliers in the UK to provide a specified number of ROCs per MWh of electricity supplied” [35] (p. 6). In Scotland, for the obligation period of 2019–2020, suppliers were expected to provide 0.484 ROCs/MWh of electricity supplied [36], which also means that they are obligated to pay the buy-out price of £48.78 for the number of ROCs not presented towards compliance in this 2019–2020 obligation period [36]. This essentially influences supplier behaviour towards renewable power purchase and considering that both Hywind Scotland and Kincardine projects were offered 3.5 ROCs/MWh, it is expected that sales of floating wind power in both projects would thrive regardless of its high LCOE.
Consumers. The consumers’ role in the choice of electricity source can be said to be negligible due to the structure of the electricity sector, where the electricity suppliers play an intermediary role between the generators and the end-users, however some business models have been seen to support RETs. For example, the Danish energy trading company, Danske Commodities, signed a 20-year Power Purchase Agreement (PPA) with Hywind Scotland in 2019 [44].
Table 1 sums up the drivers for and barriers to the take up of FOWT drawn from the Scottish context. These drivers and barriers were analysed using the framework in Figure 1, taking into consideration the technical, political, economic, and social factors of FOWT.

Table 1.
Summary of the drivers and barriers of FOWT in Scotland.
The drivers and barriers identified in the Scottish case study provides a basis for analysing the potential factors influencing the take up of FOWT in the subsequent context, South Africa. This case study will also identify the drivers and barriers of FOWT using the framework in Figure 1.
3.2. Energy Situation in South Africa
South Africa’s total installed electricity generation capacity is said to be 51,309 MW, with approximately 91.2% generated from thermal power stations and 8.8% from renewable sources [23]. However, with 14% of its population said to be without access to electricity [23], the South African government anticipates providing at least 90% of its population with access to the electricity grid by 2030 [24]. This plan involves the decommissioning of 11,000 MW of ageing coal-fired power stations and the procurement of 20 GW of RE power [24]. Furthermore, the Integrated Resource Plan (IRP) 2010–2030 was established in March 2011 as an electricity infrastructure development plan, incorporating the government’s objectives of affordable electricity, reduced GHG emissions, etc. [45]. This plan birthed the Renewable Energy Independent Power Producer Procurement Programme (REIPPPP), which has seen a total of 6422 MW RE procured, with 3876 MW operational and connected to the grid [45].
3.3. South Africa: Drivers and Barriers of FOWT
Floating offshore wind energy could be harnessed to both solve South Africa’s electricity problems and achieve SDG 7. Study has found a huge offshore wind potential in South Africa, with potential generation capacities of 57 and 589 GW on fixed and floating foundations, respectively [25]. Therefore, the subsequent sections will analyse the potential drivers and barriers of FOWT in the South African context.
3.3.1. Technical Factors
Geography. South Africa’s whole coastline is said to have wind speeds greater than 7 m/s but in waters deeper than 50 m [25]. Figure 9 shows the significant floating wind potential from Durban through to the Namibian border, with a total geographical resource potential of 589 GW [25]. This is similar to the study in [46], which suggests the use of floating platform to harness offshore wind in South Africa, citing the existence of a wind resource potential of 600.3 GW in offshore areas with mean speeds greater than 7.5 m/s and in water depths less than 800 m.
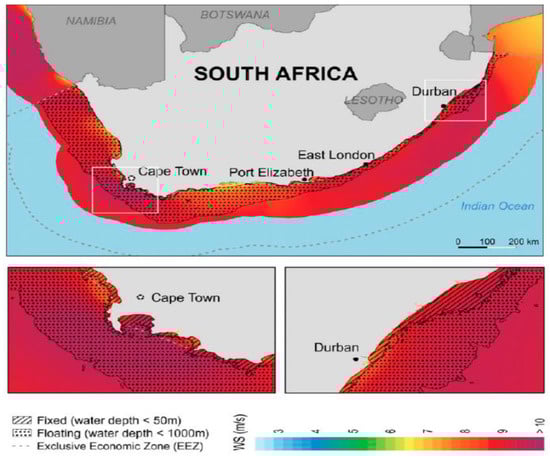
Figure 9.
Potential FOW regions in South Africa. Source: ESMAP, 2019.
Technology and Expertise. The total wind installed capacity in South Africa has grown from 10 MW in 2010 to 2094 MW in 2018 [47], making it the largest wind power market in Africa. The sector has further reported progress in the areas of technology and innovation. Turbine foundation improvement were found in two major wind projects [48], 140 MW Kangas and 110 MW Perdekraal East, with a 32.5% carbon footprint reduction being achieved by increasing the concrete mix in the turbine foundations to 70%. Furthermore, Enel Green Power RSA has reportedly deployed innovative tools such as digital platforms for quality control and the smart tracking of wind turbine components, and software solutions for site monitoring and plant commissioning in its wind energy projects [48].
Although the technological advances so far have been limited to onshore wind, the South African wind market seems ready for continued growth, which could see it deploy offshore wind installations in the near future. The new joint venture, GenesisHexicon (Pty) Ltd, which has been set up to explore the FOW development in South Africa’s deep waters [49], further indicates a promising future for South Africa’s floating wind market.
Infrastructure. The Port of Cape Town boasts of a deep quayside and large dry docks [50]. For example, the Duncan dry dock (1800 m by 600 m), located in the Victoria Basin of the Port of Cape Town, has a maximum quayside depth of 12.9 m and a dock opening 180 m wide [50]. This indicates a suitable port facility for the assembly of floating wind farm components because the Nigg Energy Park in Scotland, which is identified as a suitable port for assembly of all floating wind platform types in Figure 4, has a relatively lower capacity (a 300 by 150 m dry dock with a 9.1 m Lowest Astronomical Tide water depth and a 122 m-wide dock entrance [51]).
In the 2018 Integrated Resource Plan (IRP) Draft Plan, Eskom was cited as responsible for the development of South Africa’s transmission network [45]. Additionally, Eskom, in its Transmission Development Plan 2020–2029 report, has further cited the market penetration of large-scale RE as a major driver of its transmission development works in the Cape Town region [52]. This indicates an availability of potential grid connection points for FOW installations. Furthermore, the availability of the 765 kV grid connection points in both Cape Town and Durban [25] could help transmit power to the north of South Africa, where power demand is most concentrated.
3.3.2. Economic Factors
Costs. As earlier mentioned earlier, floating wind is associated with high CAPEX, OPEX, and LCOE costs, requiring huge investments. However, a mature onshore wind market combined with a huge resource potential for FOW power generation could lead to an accelerated reduction in costs. The South African Wind Energy Association (SAWEA) reported a 59% reduction in wind-generated electricity prices since the introduction of the Renewable Energy Independent Power Producer Procurement Programme (REIPPP) [53], which has ensured a relatively competitive tariff for wind energy projects.
Supply Chain. Although there are no offshore wind installations in South Africa, some transferable skills from the onshore wind market exist. Floating wind installation, commissioning, and site monitoring services could be carried out by the existing onshore wind market actors such as Enel Green power RSA. Additionally, Siemens and Vestas, who were suppliers of wind turbines for both the Hywind and Kincardine projects in Scotland, are seen to be major players in the South African onshore wind market [54]. Furthermore, the arrival of Hexicon AB, a major floating foundation developer, in the South African wind market is expected to spark interest from other floating wind industry actors.
3.3.3. Political Factors
Policies and Regulations. The REIPPPP has seen renewable projects worth a combined total of 6.4 GW allocated to Independent Power Producers (IPPs) [45]. However, the qualifying technologies for the REIPPPP are onshore wind, solar PV, solar thermal, biomass solid, biomass gas, landfill gas, and small hydro plants [55]. There is no mention of offshore wind in the IRP 2010–2030, but considering that this plan is subject to frequent review in order to meet the increasing demand of electricity in South Africa [56], a future inclusion of offshore wind targets could be envisaged. Furthermore, the CEO of Hexicon, Henrik Baltscheffsky, has expressed optimism over the future of floating wind in South Africa, as Genesis Eco-Energy Development, who jointly own GenesisHexicon (Pty) Ltd, has a proven history of collaborating with government stakeholders in shaping renewable energy policies in South Africa [49].
Institutional Capacity. The South African economy slipped into recession in the third quarter of 2019 [57]. As a result, the South African finance minister, Tito Mboweni, has announced a proposed reduction in the public sector wage bill of 10.5 billion USD in its national budget for the next three years [58]. However, it is unclear what effect this might have on future power sector projects.
3.3.4. Social Factors
Suppliers. There are currently no regulations in South Africa’s Integrated Resource Plan 2010–2030 regulating the supply of electricity. However, the 2019 decision to unbundle Eskom might see a separation of the generation, transmission, and distribution subsectors of the South African power sector [53], thereby granting relative autonomy to potential electricity suppliers and ensuring a more competitive energy sector.
A closely related supply-side driver of floating wind in South Africa could be diversity, as South Africa’s wind energy sector has reported a breakthrough in the achievement of equal opportunities for construction projects, with women playing key roles in the Perdekraal East Wind Farm project [48]. This could attract investors into its wind market, as they might perceive this development as a willingness to adopt new ideas.
Consumers. Considering that 2.2 million households are said to be without electricity in South Africa [23], it is assumed that demand will drive the procurement of additional generation capacities in general. Furthermore, the South African government’s intention to provide electricity access to at least 90% of its population, with 20 GW coming from renewable sources, as stated in its National Development Plan 2030 [24], might facilitate the deployment of floating wind.
A potential barrier to consider is the issue of site selection for floating wind projects. The Not in My Backyard (NIMBY) syndrome was cited as a potential risk in developer-led site selection procedures in South African solar projects [59]. Another major area of potential concern was the problem of local ownership and revenue provision, where local communities are entitled to 2.5% ownership of the project company and 1% of the total revenues [59]. This adds an additional layer of complexity to project requirements and might also lead to social unrest if commitments appear not to be met.
Table 2 outlines the potential drivers and barriers of FOWT in South Africa, drawn using the framework in Figure 2.
Table 2.
Summary of the drivers and barriers of FOWT in South Africa.
4. Discussion
4.1. Scotland
The desired decarbonisation of the global energy system has led to an exploration of RE sources, with the UK taking advantage of its offshore wind resource to establish itself as a global leader in offshore wind energy. Scotland has built upon this offshore wind expertise to lead the FOW market with the commissioning of the world’s first commercial floating wind array, Hywind Scotland Pilot Park, and the first phase of the Kincardine Offshore Wind farm.
In addition to the existing offshore wind expertise, high-quality wind resources in suitable water depths and favourable metocean and geotechnical conditions, as identified by Marine Scotland [26], contributed to the Hywind and Kincardine success stories. However, limited grid connections were perceived to be an obstacle for the Dounreay Tri Floating Wind Farm project and could pose a barrier for future floating wind projects in the country. Additionally, the suitability of port facilities might be a cause for potential concern in Scotland. Although the Hywind and Kincardine projects took advantage of the flexibility of floating foundations by having their wind farm assembled by Navantia and Windar in Spain (see Table A1 and Table A2) before being towed to site, this might allude to a relative inferiority of Scottish ports for component assembly. Therefore, port upgrades are required to facilitate the scaling up of floating wind in Scotland, as this would reduce the project delivery time and potentially increase the local offshore wind CAPEX content, as desired in the UK Offshore Wind Sector Deal [31].
However, investments in Scottish port facilities for floating wind projects may not be realised without a strong FOW project pipeline. Stable government policies and support schemes could help build a robust project pipeline, as policy interventions were seen to play a crucial role in the successes of the Scottish floating wind projects. Both the Hywind and Kincardine projects benefited from the enhanced 3.5 RO (as seen in Table A1 and Table A2), which has ensured market revenue for both projects. Perhaps a new ring-fenced innovation CfD mechanism (iCfD) could be introduced for emergent technologies, as suggested by Scottish Renewables [60], which could see future floating wind projects get up to £150/MWh strike prices.
Furthermore, the free flow of capital, goods, services, and people between European countries for both the Hywind and Kincardine projects can be attributed to the EEA agreement between EU countries and other members, as discussed earlier. However, Britain’s exit from the EU and the relatively high LCOE cost of floating wind has cast uncertainties over future projects. The UK government, through its Offshore Wind Sector Deal [31], could invest in growing the UK CAPEX content, thereby increasing the feasibility level of future Scottish projects and consequently contributing to the cost reductions in floating wind via economies of scale. The potential for achieving economies of scale in floating wind was addressed in [19], with floating foundations said to be more suited to standardisation (when compared with bottom-fixed ones). This, if realised, could lead to cheaper and quicker production rates and drive economies of scale.
Socially, the growing adoption of corporate PPAs is a potential good influencing factor for future floating wind projects in Scotland. Organisations have been seen to increasingly adopt corporate PPAs for benefits such as security of supply and long-term price stability [21]. A typical example was seen in the 20-year PPA between the Danish energy trading company, Danske Commodities, and the Hywind Scotland Pilot Park wind farm [44]. Thus, floating wind industry players must collaborate with the industrial and government sectors to carve similar market models to influence the scaling up of FOWT through various cost reduction pathways.
4.2. South Africa
South Africa’s ambition to procure 20 GW of renewable power capacity, with 90% of its population having access to the electricity grid [24], is compliant with SDG 7, which hinges on ensuring access to clean and affordable energy for all.
Consequently, South Africa’s case for floating wind development presents several drivers. Most notably, its technical potential for floating offshore wind power generation [25] has recently attracted interest from floating wind big players, Hexicon AB [49], which has, via a new joint venture, GenesisHexicon (Pty) Ltd, set its sights on exploring South Africa’s 589 GW resource potential for floating offshore wind power generation. While, as seen with Hexicon’s Dounreay Tri project in Scotland, a lack of enabling policies could pose a challenge for floating wind development in South Africa, the government’s Renewable Energy Independent Power Procurement Plan has seen the procurement of 6422 MW of renewable energy since 2011 [45]. However, the qualifying technologies for this REIPPPP are onshore wind, solar PV, solar thermal, biomass solid, biomass, landfill gas, and small hydro plants [55], with no mention of offshore wind. The arrival of Hexicon into the South African wind energy market could yield favourable policies for floating wind deployment in South Africa. Genesis Eco-Energy Developments, a co-owner of GenesisHexicon (Pty) Ltd, are credited with a proven track record of negotiating with government stakeholders to shape renewable energy policies [48]. This resonates with the opinion that smaller players are crucial to the expansion of the global floating wind market [19] because they could influence policymaking at a local level.
Considering that the Scottish floating wind projects benefited from the European supply chain, a potential economic barrier in South Africa could be the absence of an offshore renewable energy supply chain. Although a case could be made for the presence of turbine developers, Siemens and MHI Vestas—who are currently active in the Scottish floating wind market—in the South African onshore wind market [58], initial floating wind development efforts might require additional CAPEX expenses as a result of the additional transport and customs charges. However, recent developments in the South African wind sector suggest a potential for cost reductions. First, the sector has recorded advances in technology and improvements in turbine foundation [53]. The use of a 70% replacement cement design for turbine foundation in two major wind projects, the 140 MW Kangas and 110 MW Perdekraal East [47], implies an increase in the local CAPEX content, which could help strengthen its offshore wind supply chain. Maximising the local CAPEX content has been marked as a key strategy for achieving 30 GW of offshore wind in the UK by 2030 [31]. Furthermore, the Carbon Trust’s study found reduced CAPEX and LCOE costs in floating wind concepts with concrete as the primary material [13]. Second, wind electricity prices in South Africa have experienced a 59% reduction since the advent of the REIPPPP in 2011 [50]. Perhaps the Integrated Resource Plan 2010–2030 could be updated with a subsidy scheme in the shape of Scotland’s 3.5 Renewable Obligation for floating wind projects in South Africa to facilitate floating wind development and further drive down wind electricity costs.
Although a high electricity demand could drive the deployment of FOWT in South Africa, potential concerns surrounding local ownership and revenue provision [59] could deter project developers. South Africa requires project developers to evaluate the socioeconomic needs of communities within a 50 km radius of the project site [61]; however, challenges such as a lack of community involvement in defining beneficiaries and a misalignment of the project developers’ economic development plan and the local government’s plan have been reported by various stakeholders [61]. Hence, the government must work together with local communities and industry players to institute a more effective strategy for improving local community engagement in renewable energy development in general. This could minimise the project risk for stakeholders and boost investor confidence for floating wind development in the country.
5. Conclusions
This paper has compared the drivers for and barriers to the take up of floating offshore wind technology in Scotland and South Africa. Having developed a framework for analysis using a content analysis of the literature and secondary data and identified the drivers and barriers in both contexts, some conclusions can be made.
In addition to the existence of suitable floating wind sites in Scotland, the Hywind Scotland Pilot Park and Kincardine Offshore Wind Farm projects benefited heavily from the UK offshore wind expertise, the European offshore wind supply chain, and the 3.5 Renewable Obligation scheme. However, the closure of the 3.5 Renewable Obligation to floating wind projects in October 2018 put a hold on the Dounreay Tri project and casts doubts on future floating wind projects in the country. However, the UK’s Offshore Wind Sector Deal could prove instrumental to Scotland’s floating wind market, because the proposed 60% increase in CAPEX content, if realised, could help drive down project costs. However, this is a long-term projection. A replacement of the 3.5 RO scheme with a similar subsidy mechanism would be required to bring large-scale floating wind farms online in the coming years. Additionally, industry could fund research to carve out market models like the Corporate Power Purchase Agreement to ensure market revenue for future floating wind projects.
South Africa could capitalise on the strong wind resources and suitable water depths in the Cape Town and Durban areas for floating offshore wind power generation. Additionally, the South African government seem to have a healthy appetite for renewable energy development. The government’s Renewable Energy Independent Power Procurement Plan has facilitated the procurement of 6422 MW of renewable energy; however, with offshore wind technologies not being listed in the plan, an update on the Integrated Resource Plan 2010–2030 would be required to make provisions for floating wind auctions. The arrival of GenesisHexicon (Pty) Ltd to the South African wind market can be seen a welcome development to that effect. This is because Genesis Eco-Energy Developments, a co-owner of GenesisHexicon (Pty) Ltd, has a proven track record of negotiating with government stakeholders to shape renewable energy policies. However, some potential barriers must be addressed to further confirm the feasibility of floating wind in the country. The most noteworthy barriers are a lack of an offshore wind supply chain and potential community resistance towards project development. These could, however, be tackled by channelling further investments towards increasing local offshore wind CAPEX content and improving community engagement in renewable energy development.
6. Future Research
Social factors affect renewable energy deployment beyond the supply and demand of electricity. However, a dearth of literature on the social issues of floating wind is a limitation to understanding the existing and potential social drivers and barriers specific to FOWT. An effective way to bridge this knowledge gap is via case study analysis. For example, many of the environment and human impacts of a bottom-fixed offshore wind farm (such as on fishing, aquatic habitats, navigation, and safety) are believed to be transferable [27]. However, targeted studies must be undertaken to validate the impact of commercial floating wind farms in the aforementioned areas.
The potential of job development is another area of interest. Offshore wind in general provides numerous job opportunities, ranging from project planning and financing to manufacturing, operations, and maintenance [62]. The specific requirements of floating offshore wind technology, such as heavy lift offshore operations, monitoring and inspection, and dynamic export cable development [63], need to be considered in order to explore the job development potential of floating wind, which could serve as a major social driver for the scaling up of this technology.
Author Contributions
Conceptualisation, K.U. and M.L.; methodology, K.U.; investigation, K.U.; data curation, K.U.; writing—original draft preparation, K.U.; writing—review and editing, K.U. and M.L.; visualisation, K.U.; supervision, M.L. All authors have read and agreed to the published version of the manuscript.
Funding
This research has received no external funding.
Acknowledgments
The authors benefited greatly from the comments of anonymous external reviewers; any errors within this paper are, of course, our own. All the authors also acknowledge the contribution of three anonymous reviewers.
Conflicts of Interest
The authors declare no conflict of interest.
Appendix A
Table A1.
Kincardine offshore wind farm project supply chain.
Table A1.
Kincardine offshore wind farm project supply chain.
| Introduction | This project involves the construction of a 50 MW rated floating offshore wind farm, with a site located 15 km south-east of Aberdeen, off the east coast of Scotland. Having commissioned the first phase of the project in 2018, a 2 MW V80 Vestas turbine mounted on a semi-submersible Windfloat foundation from Principle Power, the second phase, including 5 additional 9.5 MW Windfloats, is said to be under construction and poised to be the world’s largest floating wind farm upon its completion in 2020. This project is jointly owned by Pilot Offshore Renewables Limited (UK) (49% stake) and the Cobra Group (Spain), who own 51% of the project. |
| Costs | The entire project was valued at around 305 million USD and successfully secured the 3.5 Renewable Obligation Certificates from the Scottish Government for a 20-year period before its deadline in October 2018. |
| Surveys | Geographical surveys were carried out by Fugro GeoConsulting Limited and Atkins (UK), who carried out the geotechnical and EIA surveys, respectively. |
| CAPEX Supply Chain | As with Hywind, components of the Kincardine Offshore Wind Farm projects were mostly supplied by other European Countries. MHI Vestas (Germany) supplied the first 2 MW turbine and are to supply the remaining five 9.5 MW turbines. The floating foundation was designed by Principle Power (USA) and fabricated by Navantia (Spain) and Windar (Spain), while the moorings and anchors were supplied by Vryhof (Netherlands). In the installation and commissioning stage, Prysmian Group (Italy) provided the subsea array and export cables, which were installed by Correll Services (UK) and Global Offshore (UK) (4COffshore, 2020). Bourbon Offshore (France) and Kinetic Renewable Services (UK) were responsible for heavy load logistics, while Vryhof (Netherlands) partly handled the moorings and anchor installation. |
| OPEX Supply Chain | O&M services in this wind farm were subcontracted to kinetic Renewable Services (UK), while the metocean monitoring and weather forecast is being overseen by Partrac (UK). |
Sources: 4COffshore offshore windfarm database [64].
Table A2.
Hywind Scotland Pilot Park supply chain.
Table A2.
Hywind Scotland Pilot Park supply chain.
| Introduction | Hywind Scotland is a 30 MW fully commissioned floating offshore wind farm, located 25 km off Peterhead in Buchan deep, north-east of Scotland. This project is majorly owned by a Norwegian company, Equinor, who are responsible for 75% of its development, and Masdar, a UAE company, who own 25%. |
| Costs | The project costs were estimated at 192 million USD, and to help cover the capital expenditure (CAPEX) and operational expenditure (OPEX) the project secured a subsidy through the Scottish Government’s Renewable Obligation (RO) scheme for a 20-year period. This scheme offered 3.5 Renewable Obligation Certificates (ROCs) for every Megawatt-hours (MWh) of generated electricity to floating wind generators. |
| Wind Farm Components | This wind farm is made up of five 6 MW turbines, mounted on Hywind spar foundations, and covering an area of around 4 km2 in water depths between 95 m to 129 m. The wind farm experiences an average wind speed of 10 m/s and an average wave height of 1.8 m and utilises an export cable of 30 km length, which helps transmit power to the shore. |
| Surveys | Geographical surveys of this wind farm area were carried out by Metocean Services International (South Africa/Australia), Fugro Geoconsulting Limited (UK), and Xodus Group (UK), who carried out the metoocean, geotechnical, and Environmental Impact Assessment (EIA) surveys, respectively. |
| CAPEX Supply Chain | Components of this floating offshore wind farm were mostly supplied by other European countries. Siemens (Germany) supplied the five 6 MW turbines, with the floating foundation designed by Equinor (Norway) and fabricated by Navantia (Spain) and Windar (Spain) at the Stordbase Port facility (Norway). Furthermore, the anchors were designed and fabricated by Norwegian Geotechnical Institute (NGI) (Norway) and Global Energy Group (UK) respectively, while the moorings and subsea cables (array and export cables) were provided by MacGregor Cargotec (Finland) and Nexans Norway AS. Installation and commissioning were majorly carried out by UK companies. Granada Material Handling Ltd. (UK) provided installation cranes, while Subsea 7 (UK) and Balfour Beatty (UK) oversaw the installation of the subsea cables and the substation/onshore cabling, respectively. However, floating foundations were installed by a Norwegian company, OHT Management AS. |
| OPEX Supply Chain | Operation and maintenance (O&M) services were subcontracted to Green Marine (UK) and Reach Subsea (Norway), while equipment monitoring is being overseen by Wood Group (UK), Strainstall/James Fisher and Sons (UK), and Kongsberg Renewables Technology (UK). Additionally, Partrac (UK) are responsible for metocean monitoring and weather forecasting services. |
Sources: 4COffshore offshore windfarm database [65].
Table A3.
Dounreay Tri floating offshore wind project profile.
Table A3.
Dounreay Tri floating offshore wind project profile.
| Introduction | Dounreay Tri is a 10 MW floating wind farm project by Hexicon AB, which includes two 5 MW turbines, both hosted on one semi-submersible platform, fixed to the seabed with one mooring line and anchor and designed to utilise one subsea export cable in transmitting power to the onshore grid. |
| Costs | The project was valued at 60 million USD, however with uncertainties around the project’s ability to meet the Scottish Government’s October 2018 3.5 ROC deadline, the project was put on hold due to the withdrawal of funding support from the Dounreay Tri shareholders. |
Sources: supply chain website [29].
References
- Hansen, J.; Sato, M.; Kharecha, P.; Beerling, D. Target Atmospheric CO2: Where Should Humanity Aim? Open Atmos. Sci. J. 2008, 2, 217–231. [Google Scholar] [CrossRef]
- Gasser, T.; Guivarch, C.; Tachiiri, K.; Jones, C.D. Negative emissions physically needed to keep global warming below 2 °C. Nat. Commun. 2015, 6, 7958. [Google Scholar] [CrossRef]
- Liddle, B.; Sadorsky, P. How much does increasing non-fossil fuels in electricity generation reduce carbon dioxide emissions? Appl. Energy 2017, 197, 212–221. [Google Scholar] [CrossRef]
- Mejean, A.; Guivarch, C.; Julien, L.; Meriem, H. The transition in energy demand sectors to limit global warming to 1.5 °C. Energy Effic. 2019, 12, 441–462. [Google Scholar]
- Blau, J. The Paris Agreement: Climate Change, Solidarity, and Human Rights; Springer: Berlin/Heidelberg, Germany, 2017. [Google Scholar] [CrossRef]
- United Nations. Sustainable Development Goals. Available online: https://www.un.org/sustainabledevelopment/ (accessed on 11 February 2020).
- British Petroleum. BP Statistical Review of World Energy. Available online: https://www.bp.com/content/dam/bp/business-sites/en/global/corporate/pdfs/energy-economics/statistical-review/bp-stats-review-2019-full-report.pdf (accessed on 5 February 2020).
- Global Wind Energy Council. Global Wind Report Released 2019. Available online: https://gwec.net/global-wind-report-2019/ (accessed on 28 January 2020).
- IRENA. Future of Wind: Deployment, Investment, Technology, Grid Integration and Socio-Economic Aspects (A Global Energy Transformation Paper); International Renewable Energy Agency: Abu Dhabi, UAE, 2019.
- IRENA. Renewable Power Generation Costs in 2018; International Renewable Energy Agency: Abu Dhabi, UAE, 2019.
- Kaldellis, J.K.; Kapsali, M. Shifting towards offshore wind energy—Recent activity and future development. Energy Policy 2013, 53, 136–148. [Google Scholar] [CrossRef]
- Carbon Trust. Floating Wind: Market and Technology Review; Scottish Government: Edinburgh, UK, 2015.
- IRENA. Innovation Outlook: Offshore Wind; International Renewable Energy Agency: Abu Dhabi, UAE, 2016.
- European Wind Energy Association. Deep Water—The Next Step for Offshore Wind Energy; EWEA: Brussels, Belgium, 2013. [Google Scholar]
- Salic, T.; Charpentier, J.F.; Benbouzid, M.; Le Boulluec, M. Control Strategies for Floating Offshore Wind Turbine: Challenges and Trends. Electronics 2019, 8, 1185. [Google Scholar] [CrossRef]
- Hannon, M.; Topham, E.; MacMillan, D.; Dixon, J.; Collu, M. Offshore Wind, Ready to Float? Global and UK Trends in the Floating Offshore Wind Market; University of Strathclyde: Glasgow, UK, 2019. [Google Scholar] [CrossRef]
- Equinor. Equinor and ORE Catapult Collaborating to Share Hywind Scotland Operational Data-Equinor.com. Available online: https://www.equinor.com/en/news/2019-11-28-hywind-scotland-data.html (accessed on 20 February 2020).
- Wind Europe. Floating Offshore Wind Energy: A Policy Blueprint for Europe; Springer: Berlin/Heidelberg, Germany, 2018. [Google Scholar] [CrossRef]
- Darius, S.; Cole, J.; Geschier, B.; Fromont, V.; Metelo, J.; Weber, C.; Mochet, C. Floating Wind–Going Global Webinar|GoToStage.com. Available online: https://www.gotostage.com/channel/2b04efcab64644d388f92bec31fbe11c/recording/820636e742754e37b852b69915004067/watch (accessed on 29 May 2020).
- IRENA. Demand-Side Flexibility for Power Sector Transformation; International Renewable Energy Agency: Abu Dhabi, UAE, 2019.
- REN21. REN21 Renewables 2018 Global Status Report. Available online: https://search.informit.org/documentSummary;dn=162298884475508;res=IELHSS (accessed on 12 March 2020).
- Hexicon AB. Information Memorandum. Available online: https://natlib-primo.hosted.exlibrisgroup.com/primo-explore/search?query=any,contains,9913235003502836&tab=catalogue&search_scope=NLNZ&vid=NLNZ&offset=0 (accessed on 20 March 2020).
- USAID. Power Africa in South Africa|Power Africa|U.S. Agency for International Development. Available online: https://www.usaid.gov/powerafrica/south-africa (accessed on 17 April 2020).
- National Planning Committee RSA. National Development Plan 2030; Department: The Presidency, South Africa, 2012. [Google Scholar]
- ESMAP. Going Global: Expanding Offshore Wind to Emerging Markets; World Bank: Washington, DC, USA, 2019. [Google Scholar]
- Marine Scotland. Potential Scottish Test Sites for Deep Water Floating Wind Technologies Draft Regional Locational Guidance; Marine Scotland: Edinburgh, UK, 2014.
- Carbon Trust & ORE Catapult. Floating Wind Joint Industry Project: Policy & Regulatory Appraisal. Available online: https://www.carbontrust.com/media/673978/wp1-flw-jip-policy-regulatory-appraisal_final_170120_clean.pdf (accessed on 4 April 2020).
- Navantia-Windar. Navantia-Windar to Build Kincardine Floating Foundations. Available online: https://www.offshorewind.biz/2019/02/25/navantia-windar-to-build-kincardine-floating-foundations/ (accessed on 28 March 2020).
- Timetric. Hexicon-Dounreay Tri Floating Offshore Wind Farm 12MW-Scotland Project Profile. Available online: https://search.proquest.com/docview/1917098797 (accessed on 9 April 2020).
- DECC. UK Offshore Energy Strategic Environmental Assessment; DECC: London, UK, 2016. [Google Scholar]
- BEIS. Offshore Wind: Sector Deal. Available online: https://www.gov.uk/government/publications/offshore-wind-sector-deal (accessed on 5 May 2020).
- Scottish Government. Annual Energy Statement 2019. Available online: http://publicinformationonline.com/download/202585 (accessed on 22 May 2020).
- Ofgem. Guidance for Generators that Receive or Would Like to Receive Support under the Renewables Obligation (RO) scheme. Available online: https://www.ofgem.gov.uk/system/files/docs/2018/09/renewables_obligation_guidance_for_generators_september_2018_0.pdf (accessed on 19 May 2020).
- BEIS. Contracts for Difference. Available online: https://www.gov.uk/government/publications/contracts-for-difference/contract-for-difference (accessed on 19 May 2020).
- Ofgem. Renewable Obligation: Guidance for Suppliers. Available online: https://www.ofgem.gov.uk/ofgem-publications/149531 (accessed on 20 May 2020).
- Ofgem. Renewables Obligation (RO) Buy-Out Price and Mutualisation Ceilings for 2019–20. Available online: https://www.ofgem.gov.uk/publications-and-updates/renewables-obligation-ro-buy-out-price-and-mutualisation-ceilings-2019-20 (accessed on 21 May 2020).
- Business Electricity Prices UK. Wholesale Electricity Price Guide. Available online: https://www.businesselectricityprices.org.uk/retail-versus-wholesale-prices/ (accessed on 29 May 2020).
- Low Carbon Contracts Company. Contracts for Difference (CFD) Booklet 2016/17: Overview of the CFD Mechanism and Delivery Partners. Available online: https://www.lowcarboncontracts.uk/sites/default/files/CFD%20Booklet%202016-17.pdf (accessed on 2 June 2020).
- Webb, D.; Lang, A.; Keep, M.; Miller, V.; Jozepa, I.; Harari, D.; Gower, M. The European Economic Area. Available online: http://researchbriefings.files.parliament.uk/documents/CBP-8129/CBP-8129.pdf (accessed on 9 June 2020).
- UK Government. The UK Transition. Available online: https://www.gov.uk/transition (accessed on 26 March 2020).
- BVG Associates. UK Offshore Wind Supply Chain: Capabilities and Opportunities. Available online: https://www.gov.uk/government/uploads/system/uploads/attachment_data/file/277798/bis-14-578-offshore-wind-supply-chain-capabilities-and-opportunities.pdf (accessed on 29 May 2020).
- Quest FWE. 2020 Global Floating Wind Energy Market and Forecast Report Volume 2.2; Maker Media: San Francisco, CA, USA, 2020. [Google Scholar]
- ORE Catapult. Macroeconomic Benefits of Floating Wind in the UK. Available online: https://ore.catapult.org.uk/?industryreports=macroeconomic-benefits-of-floating-offshore-wind-in-the-uk (accessed on 11 June 2020).
- Danske Commodities. Danske Commodities Books Hywind Scotland Power. Available online: https://www.offshorewind.biz/2019/06/19/danske-commodities-books-hywind-scotland-power/ (accessed on 8 May 2020).
- Department of Mineral Resources and Energy RSA. Integrated Resource Plan 2019; Republic of South Africa, Department of Energy: Pretoria, South Africa, 2019.
- Elsner, P. Continental-scale assessment of the African offshore wind energy potential: Spatial analysis of an under-appreciated renewable energy resource. Renew. Sustain. Energy Rev. 2019, 104, 394–407. [Google Scholar] [CrossRef]
- IRENA. Renewable Energy Statistics 2019; International Renewable Energy Agency: Abu Dhabi, UAE, 2019.
- Zyl, N.P. Tracking Wind Energy in South Africa. Available online: https://www.esi-africa.com/industry-sectors/renewable-energy/tracking-wind-energy-in-south-africa/ (accessed on 17 June 2020).
- Hexicon, A.B. Hexicon Posted on Linkedin. Available online: https://www.linkedin.com/posts/hexicon-ab_new-partner-for-south-african-deepwater-windfarms-activity-6666033564221612033-hYQ0/ (accessed on 11 May 2020).
- Offshore Magazin. Cape Town Yards Offer Competitive Services. Available online: https://www.offshore-mag.com/business-briefs/equipment-engineering/article/16755384/cape-town-yards-offer-competitive-services (accessed on 2 July 2020).
- Scottish Ports. Nigg Energy Park. Available online: https://energy.scottishports.org.uk/ports/nigg-energy-park (accessed on 6 June 2020).
- Eskom. Transmission Development Plan 2020–2029; Eskom: Sandton, South Africa 2019. [Google Scholar]
- SAWEA. Stats and Facts SAWEA|South African Wind Energy Association. Available online: https://sawea.org.za/stats-and-facts-sawea/ (accessed on 6 July 2020).
- SAWEA. South African Wind Farms|South African Wind Energy Association. Available online: https://sawea.org.za/wind-map/wind-ipp-table/ (accessed on 6 July 2020).
- IEA. Renewable Energy Independent Power Producer Programme (REIPPP)–Policies. Available online: https://www.iea.org/policies/5393-renewable-energy-independent-power-producer-programme-reippp (accessed on 11 July 2020).
- Department of Energy. 2019 South African Energy Sector Report. Available online: http://www.energy.gov.za/files/media/explained/2019-South-African-Energy-Sector-Report.pdf (accessed on 13 July 2020).
- Ministry of Statistics RSA. Economy Slips into Recession|Statistics South Africa. Available online: http://www.statssa.gov.za/?p=13049 (accessed on 15 July 2020).
- CNBC. Next Budget Moves Will ‘Make or break’ South African Economy Amid Second Recession in 2 Years. Available online: https://www.cnbc.com/2020/03/04/next-budget-moves-will-make-or-break-south-african-economy.html (accessed on 17 July 2020).
- Kruger, W.; Stritzke, S.; Trotter, P.A. De-risking solar auctions in sub-Saharan Africa–A comparison of site selection strategies in South Africa and Zambia. Renewable and Sustain. Energy Rev. 2019, 104, 429–438. [Google Scholar] [CrossRef]
- Scottish Renewables. UK Marine Energy 2019. Available online: https://www.scottishrenewables.com/publications/download/487/ (accessed on 17 July 2020).
- World Bank. Improving the Investment Climate for Renewable Energy–Through Benefit Sharing, Risk Management and Local Community Engagement. Available online: https://openknowledge.worldbank.org/bitstream/handle/10986/32748/Improving-the-Investment-Climate-for-Renewable-Energy-Through-Benefit-Sharing-Risk-Management-and-Local-Community-Engagement.pdf?sequence=1&isAllowed=y (accessed on 18 August 2020).
- Global Wind Energy Council. Global Offshore Wind Report 2020. Available online: https://gwec.net/wp-content/uploads/dlm_uploads/2020/08/GWEC-offshore-wind-2020-5.pdf (accessed on 11 August 2020).
- Carbon Trust. Floating Wind Joint Industry Report–Phase II Summary Report. Available online: https://prod-drupal-files.storage.googleapis.com/documents/resource/public/FWJIP_Phase_2_Summary_Report_0.pdf (accessed on 16 August 2020).
- 4COffshore Offshore Windfarm Database, Supply Chain Websites, Timetric. KOWL-Kincardine Offshore Wind Farm 50 MW-UK-Project Profile. Available online: https://search.proquest.com/docview/2031085434 (accessed on 6 May 2020).
- SWL-Hywind Scotland Pilot Park Wind Farm 30 MW-UK Project Profile. Available online: https://search.proquest.com/docview/1903498036 (accessed on 8 May 2020).


Publisher’s Note: MDPI stays neutral with regard to jurisdictional claims in published maps and institutional affiliations. |
© 2020 by the authors. Licensee MDPI, Basel, Switzerland. This article is an open access article distributed under the terms and conditions of the Creative Commons Attribution (CC BY) license (http://creativecommons.org/licenses/by/4.0/).