Article

From Niche to Market—An Agent-Based Modeling Approach for the Economic Uptake of Electro-Fuels (Power-to-Fuel) in the German Energy System

1
Department of Resilient Energy Systems, University of Bremen, Enrique-Schmidt-Straße 7, 28359 Bremen, Germany
2
Rijksuniversiteit Groningen, Grote Kruisstraat 2/1, 9712 TS Groningen, The Netherlands
3
Department of Multi-Actor Systems, Faculty of Technology, Policy and Management, Delft University of Technology, Jaffalaan 5, 2628 BX Delft, The Netherlands
4
Department of Technology Development and Design, University of Bremen, Badgasteiner Str. 1, 28359 Bremen, Germany
*
Author to whom correspondence should be addressed.
Energies 2020, 13(20), 5522; https://doi.org/10.3390/en13205522
Submission received: 16 September 2020 / Revised: 15 October 2020 / Accepted: 16 October 2020 / Published: 21 October 2020
(This article belongs to the Special Issue Agent-Based Modeling of Socioeconomic Challenges of Energy Transition)

Abstract

:
The transition process towards renewable energy systems is facing challenges in both fluctuating electricity generation of photovoltaic and wind power as well as socio-economic disruptions. With regard to sector integration, solutions need to be developed, especially for the mobility and the industry sector, because their ad hoc electrification and decarbonization seem to be unfeasible. Power-to-fuel (P2F) technologies may contribute to bridge the gap, as renewable energy can be transferred into hydrogen and hydrocarbon-based synthetic fuels. However, the renewable fuels production is far from economically competitive with conventional fuels. With a newly developed agent-based model, potential developments in the German energy markets were simulated for a horizon of 20 years from 2016 to 2035. The model was constructed through a participatory modeling process with relevant actors and stakeholders in the field. Model findings suggest that adjusted regulatory framework conditions (e.g., exemptions from electricity surtaxes, accurate prices for CO2-certificates, strong start-up subsidies, and drastic emission reduction quotas) are key factors for economically feasible P2F installations and will contribute to its large-scale integration into the German energy system. While plant capacities do not exceed 0.042 GW in a business-as-usual scenarios, the above-mentioned adjustments lead to plant capacities of at least 3.25 GW in 2035 with concurrent reduction in product prices.

1. Introduction

The German Energiewende has been focused on the electricity sector, and 42.1% of electricity came from renewable sources by the end of 2019 [1]. Common assumptions assume that renewable electricity will be the only energy source that might match the overall energy demand sustainably in Germany [2,3,4]. Biofuels, which currently supply 5% of the mobility sector’s fuel consumption, have a limited sustainability potential due to land use conflicts [5,6,7,8]. Since photovoltaic and wind power are intermittent and have low full load hours, large capacities are required to achieve 100% of renewable energy (RE) supply in all sectors and to meet the climate protection goals of the Paris Agreement (COP21) [9,10]. As a consequence, the amount of curtailed excess electricity from wind and solar power has already increased. As of 2017, 5.5 TWh of potential generation could not be fed into the grid due to congestion or mismatched demand. In 2017, 610 million euros had to be compensated by end consumers, most of which are private households, due to legally guaranteed feed-in tariffs [11]. Such developments decrease the acceptance of the Energiewende and cause resistance to the installation of new wind and photovoltaic (PV) power plants.
It will be challenging—if not impossible—to find solutions based on direct use of electricity for energy intensive sectors such as aviation, shipping, and heavy road transport as well as the production of hydrocarbon-based raw materials for industry, especially the chemical sector. Several studies conclude that hydrocarbon-based fuels will remain an essential part of the world’s energy supply, even when fossil fuels are completely displaced [12,13,14]. Power-to-fuel (P2F) technologies might close the gap between renewable electricity generation and final energy demand in the above-mentioned sectors. Based on the splitting of water into hydrogen and oxygen via electrolysis (power-to-hydrogen, P2H2), hydrocarbons can be created from hydrogen and a sustainable carbon source by specific synthesis routes such as Sabatier process and Fischer–Tropsch synthesis (hydrogen-to-fuels) [15,16,17]. With the supply of synthetic and highly energy dense fuels, the share of renewables in all sectors can be increased.
In Germany, more than thirty pilot plants for the production of hydrogen, methane, and liquid fuels are operating today [18,19]. From a technical perspective, P2F has now attained a high level of technology development. It is ready for up-scaling to the multi-megawatt scale. However, due to disadvantageous legal framing conditions, low efficiencies, and high investment costs, P2F plants are not yet economically feasible. As conventional fuels are available at low prices, there is barely an existing demand for the renewable substitutes only in small niche markets [20].
To explore the possible role of P2F in the energy system transition, we investigated pathways for an economic integration. Our model-based analysis focused on socio-technical and socio-economic relations within the German energy system with the goal of identifying key factors for an economic uptake. Stakeholders and actors were categorized in representative operator and customer groups and implemented as interactive agents within German energy markets. Based on the model, the growth rate of P2F plants in Germany over a time horizon from 2016–2035 was evaluated for different scenarios with individual political, technical, and societal developments. The approach of simulating potential real-world behavior of major energy system actors allows one to identify conditions which may lead to an economic success of P2F.

2. Current State of Affairs of P2F in Germany and Methodological Approach

To fulfill the long term German climate change mitigation targets (greenhouse gas reduction up to 95% compared to 1990) and a near 100% renewable energy supply for all sectors, a decisive role of P2F in de-fossilizing parts of the mobility and the industry sectors is inevitable. Depending on assumptions regarding available space for RE installations, studies estimate a wide span for renewable electricity potential of 462–3939 TWh a−1 [3,4]. However, the maximum potential for biofuels is considered to be below 500 TWh a−1 [5,21,22] due to the scarcity of appropriate farming land and low energy yield per unit area. The photosynthesis and the area-based efficiencies of biomass are lower than photovoltaic and wind power efficiencies. In addition, there is potential in non-farmable areas such as offshore and rooftops that are not suited or used at present.
In Germany, research efforts with regard to synthetic fuel production at the scale of pilot plants started in 2009. Promoted by different research funds, a wide range of pilot projects are being developed, most of them with a focus on the production of hydrogen and methane. In most cases, the produced gases are injected into the natural gas grid, and the major goal of these plants is to serve as a technical proof of concept and an optimization of flexible production modes.
As projected in many scenarios, P2F will provide large shares of energy to different sectors [23,24,25]. To reach this goal, an up-scaling of existing concepts will be a next step to investigate its potential for industrial integration. Viable business cases exist for at least two pilot projects [20], where renewable hydrogen is fed into the natural gas grid and sold to private households that have a high willingness to pay. Even though the share of the renewable gas remains below 1% in the offered gas mix, these customers pay for a more sustainable premium quality and support the new technology. However, this is only a small niche market with limited sales volumes.
As the Federal Environment Agency and Müller-Syring et al. state in recent studies, production costs for the synthetic substitutes are significantly higher than prices for fossil fuels and biofuels, with production costs of up to 90 cents kWh−1 for synthetic methane compared to 2.5 cents kWh−1 for natural gas [14,26,27]. Depending on investment costs and surcharges on electricity prices, high production costs of synthetic fuels are very likely, even at levelized costs of electricity considered to be 0 cents kWh−1 and at a high number of full load hours. To achieve economic competitiveness, the following factors are widely discussed in literature to be of major importance:
  • Reduction of investment costs
  • High conversion efficiencies
  • High utilization rates
  • Reasonable legal framing conditions
Thus, these factors are considered in the further analysis of this work amongst others to quantitatively assess their impact on an economic uptake.

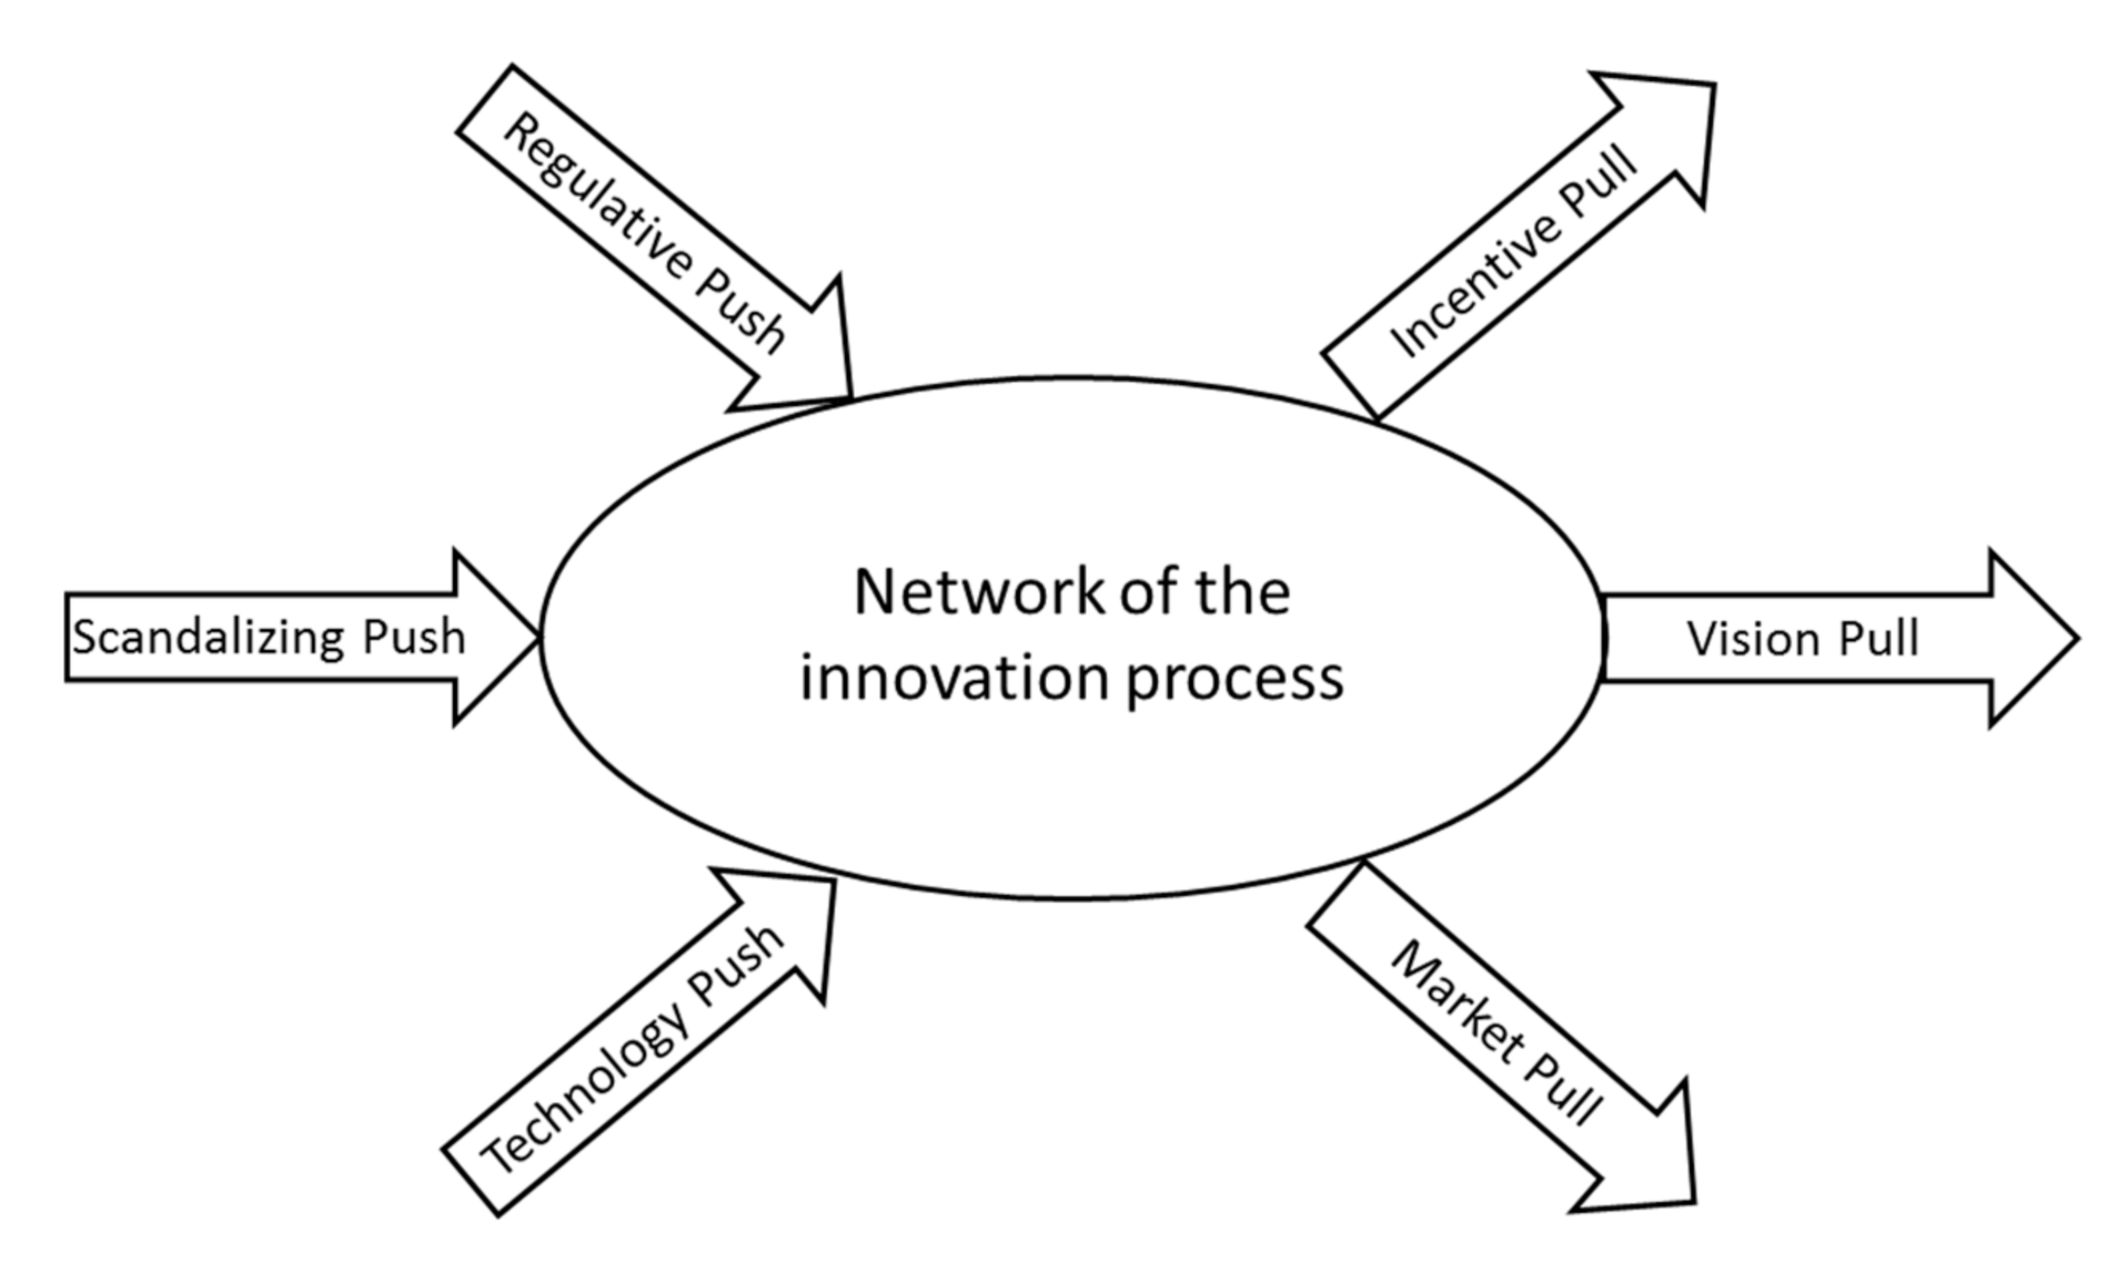
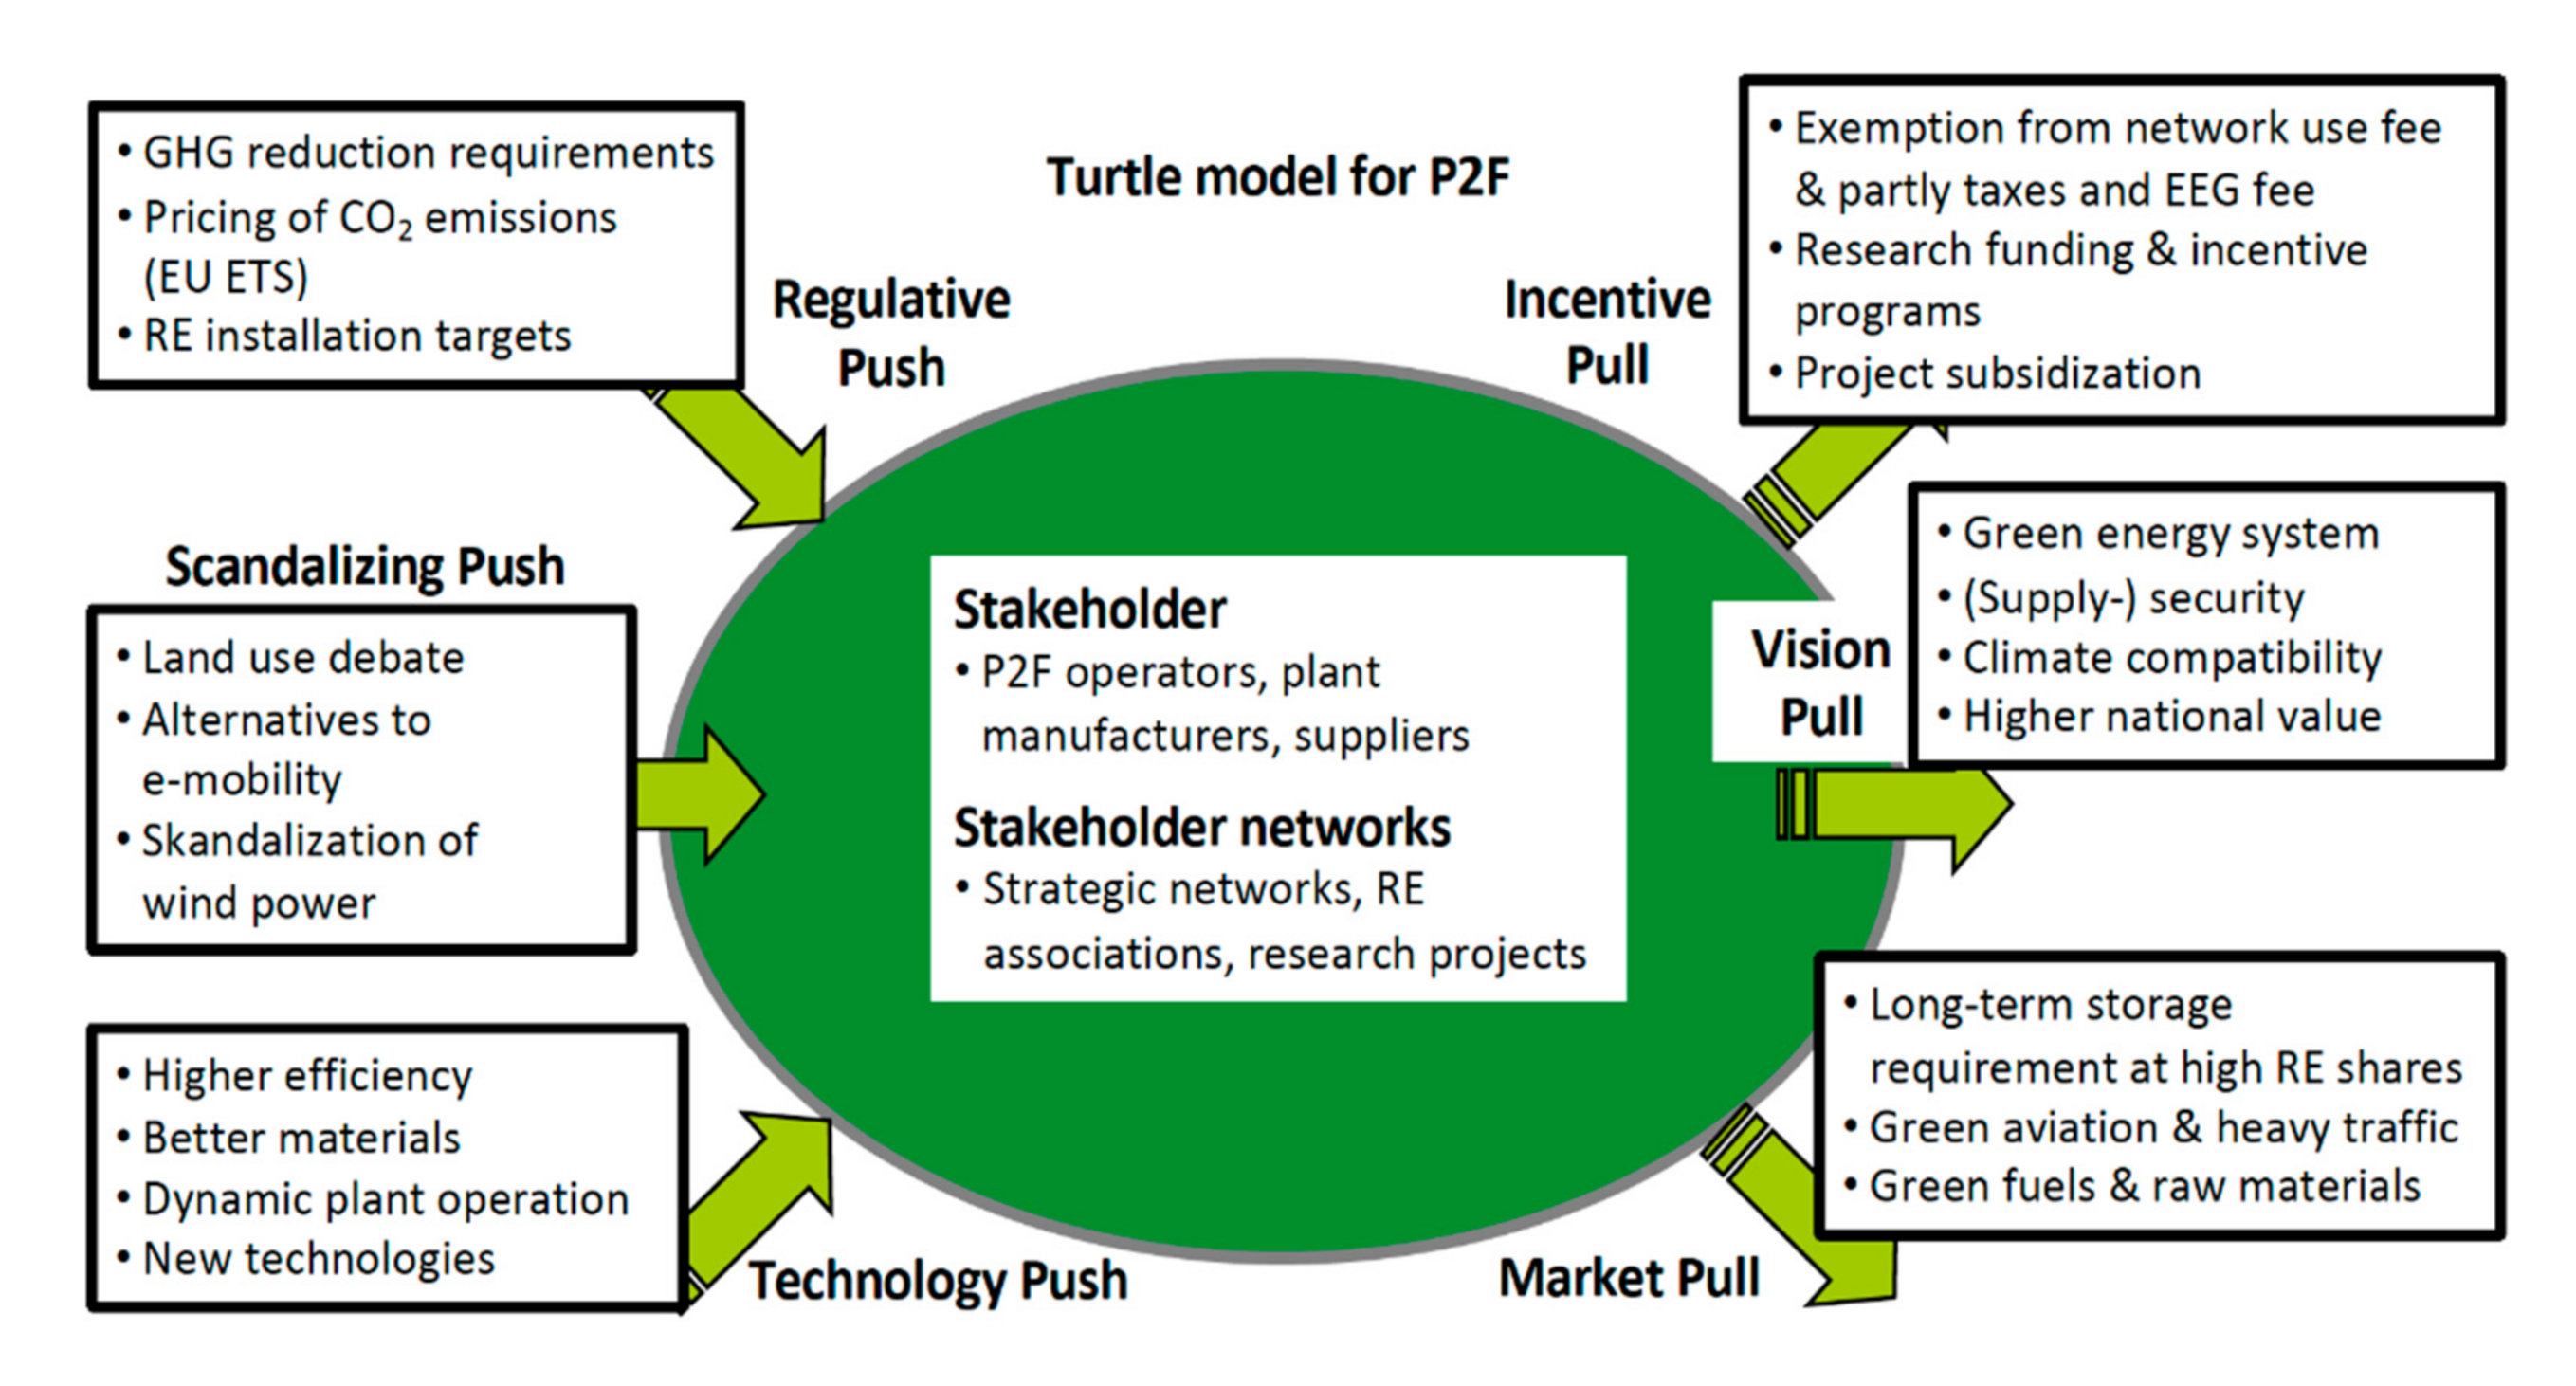
2.1. Defining Framing Conditions with the Help of the Turtle Model

The central goal of this study is to find conditions that allow the P2F concept to grow from a small niche to a substantial part of the energy markets. With respect to future uncertainties about markets and technologies, climate change impacts, and other stressors to the system, it is important to find the most relevant so-called impact factors for energy systems transformation. According to the multi-impulse hypothesis, impacts on the direction of innovation processes may arise from changes in technical, societal, economic, and ecological framing conditions or through unforeseeable incidents [28,29,30]. Effects on innovation directions and the role of different impact factors can be visualized and qualitatively discussed with the help of the turtle model displayed in Figure 1 [31,32,33,34,35,36,37]. In the core of the model, a network of participants in the innovation process is displayed. In the long run, companies from many industries might become part of the P2F innovation network. Today, mostly entrepreneurs and progressive companies are the major actors in this young environment. They started with the installation of the first pilot plants, assisted by research institutes and governmental funds. Furthermore, participating actors formed strategic networks to push the development phase forward and support the introduction of a desirable legislation.
The six impact factors can be distinguished into push and pull factors. While push factors have the ability to destabilize existing regimes and create new possibilities for innovations, pull factors exhibit a selective effect and promote the innovation direction. In the case of P2F, the technology push is a central driver of the innovation and creates technological options. Further improvement of technologies with regard to efficiency and investment costs is an additional basis for the integration of P2F in the energy markets.
The market pull represents demand for new products, which leads to directed innovation efforts. Currently in niches, there may be a growing demand for synthetic fuels by airlines and transport companies and later on by private households. This demand on the one hand is caused by emission restrictions and on the other hand by ethical preferences which result in a higher willingness to pay for the “green” product.
The regulative push summarizes any governmental regulations which cause changes for the actors’ network. Strong impulses might be created by the adoption of new laws. An example is the European Union (EU) regulation on CO2 emissions of car fleets, which forces car manufacturers to decrease their average fleet emissions [38]. Without such regulative signals, climate friendly innovations can hardly find a way into the markets, giving the regulative push a strong position.
The impact factor incentive pull contains all governmental promotion for pioneers and innovations. Without subsidies, innovations can hardly be developed. Especially in the early development phase, supporting mechanisms such as tax benefits are a common measure to incentivize innovations, e.g., in the case of P2F, operators do not have to pay network use fees (see Section 3). Furthermore, the funding of research projects is a fundamental promotion for new technologies and concepts. Subsidization of P2F projects can be considered as crucial for further market integration.
The scandalizing push is an impact factor that arises from the awareness of the civil society to new developments and old habits. Consumer and environmental protection organizations have the ability to scandalize certain technologies and thereby have an enormous impact on innovations. In contrast to P2F, which, to date, does not seem to face acceptance problems, biofuels were strongly scandalized in Germany (campaign “land use for tank or plate?”).
Guiding orientations are represented by the impact factor vision pull, which directs and drives efforts for innovations. With regard to P2F, the development progress is driven by the vision of an environmentally friendly energy system, a high degree of national self-supply leading to more energy independence and a higher national value. Figure 2 summarizes the identified drivers for the P2F innovation system.
With the turtle model and its assembly of push and pull factors, the main drivers of the innovation process can be visualized and qualitatively interconnected. However, more complex interrelations between actors and their environment are not included, and a dynamic investigation of how the innovation system may develop over time is not possible within this approach. For a dynamic and quantitative analysis, we used this model as the basis for a newly developed agent-based model (ABM) and evaluated the quantitative impact of each impact factor of the turtle’s model.

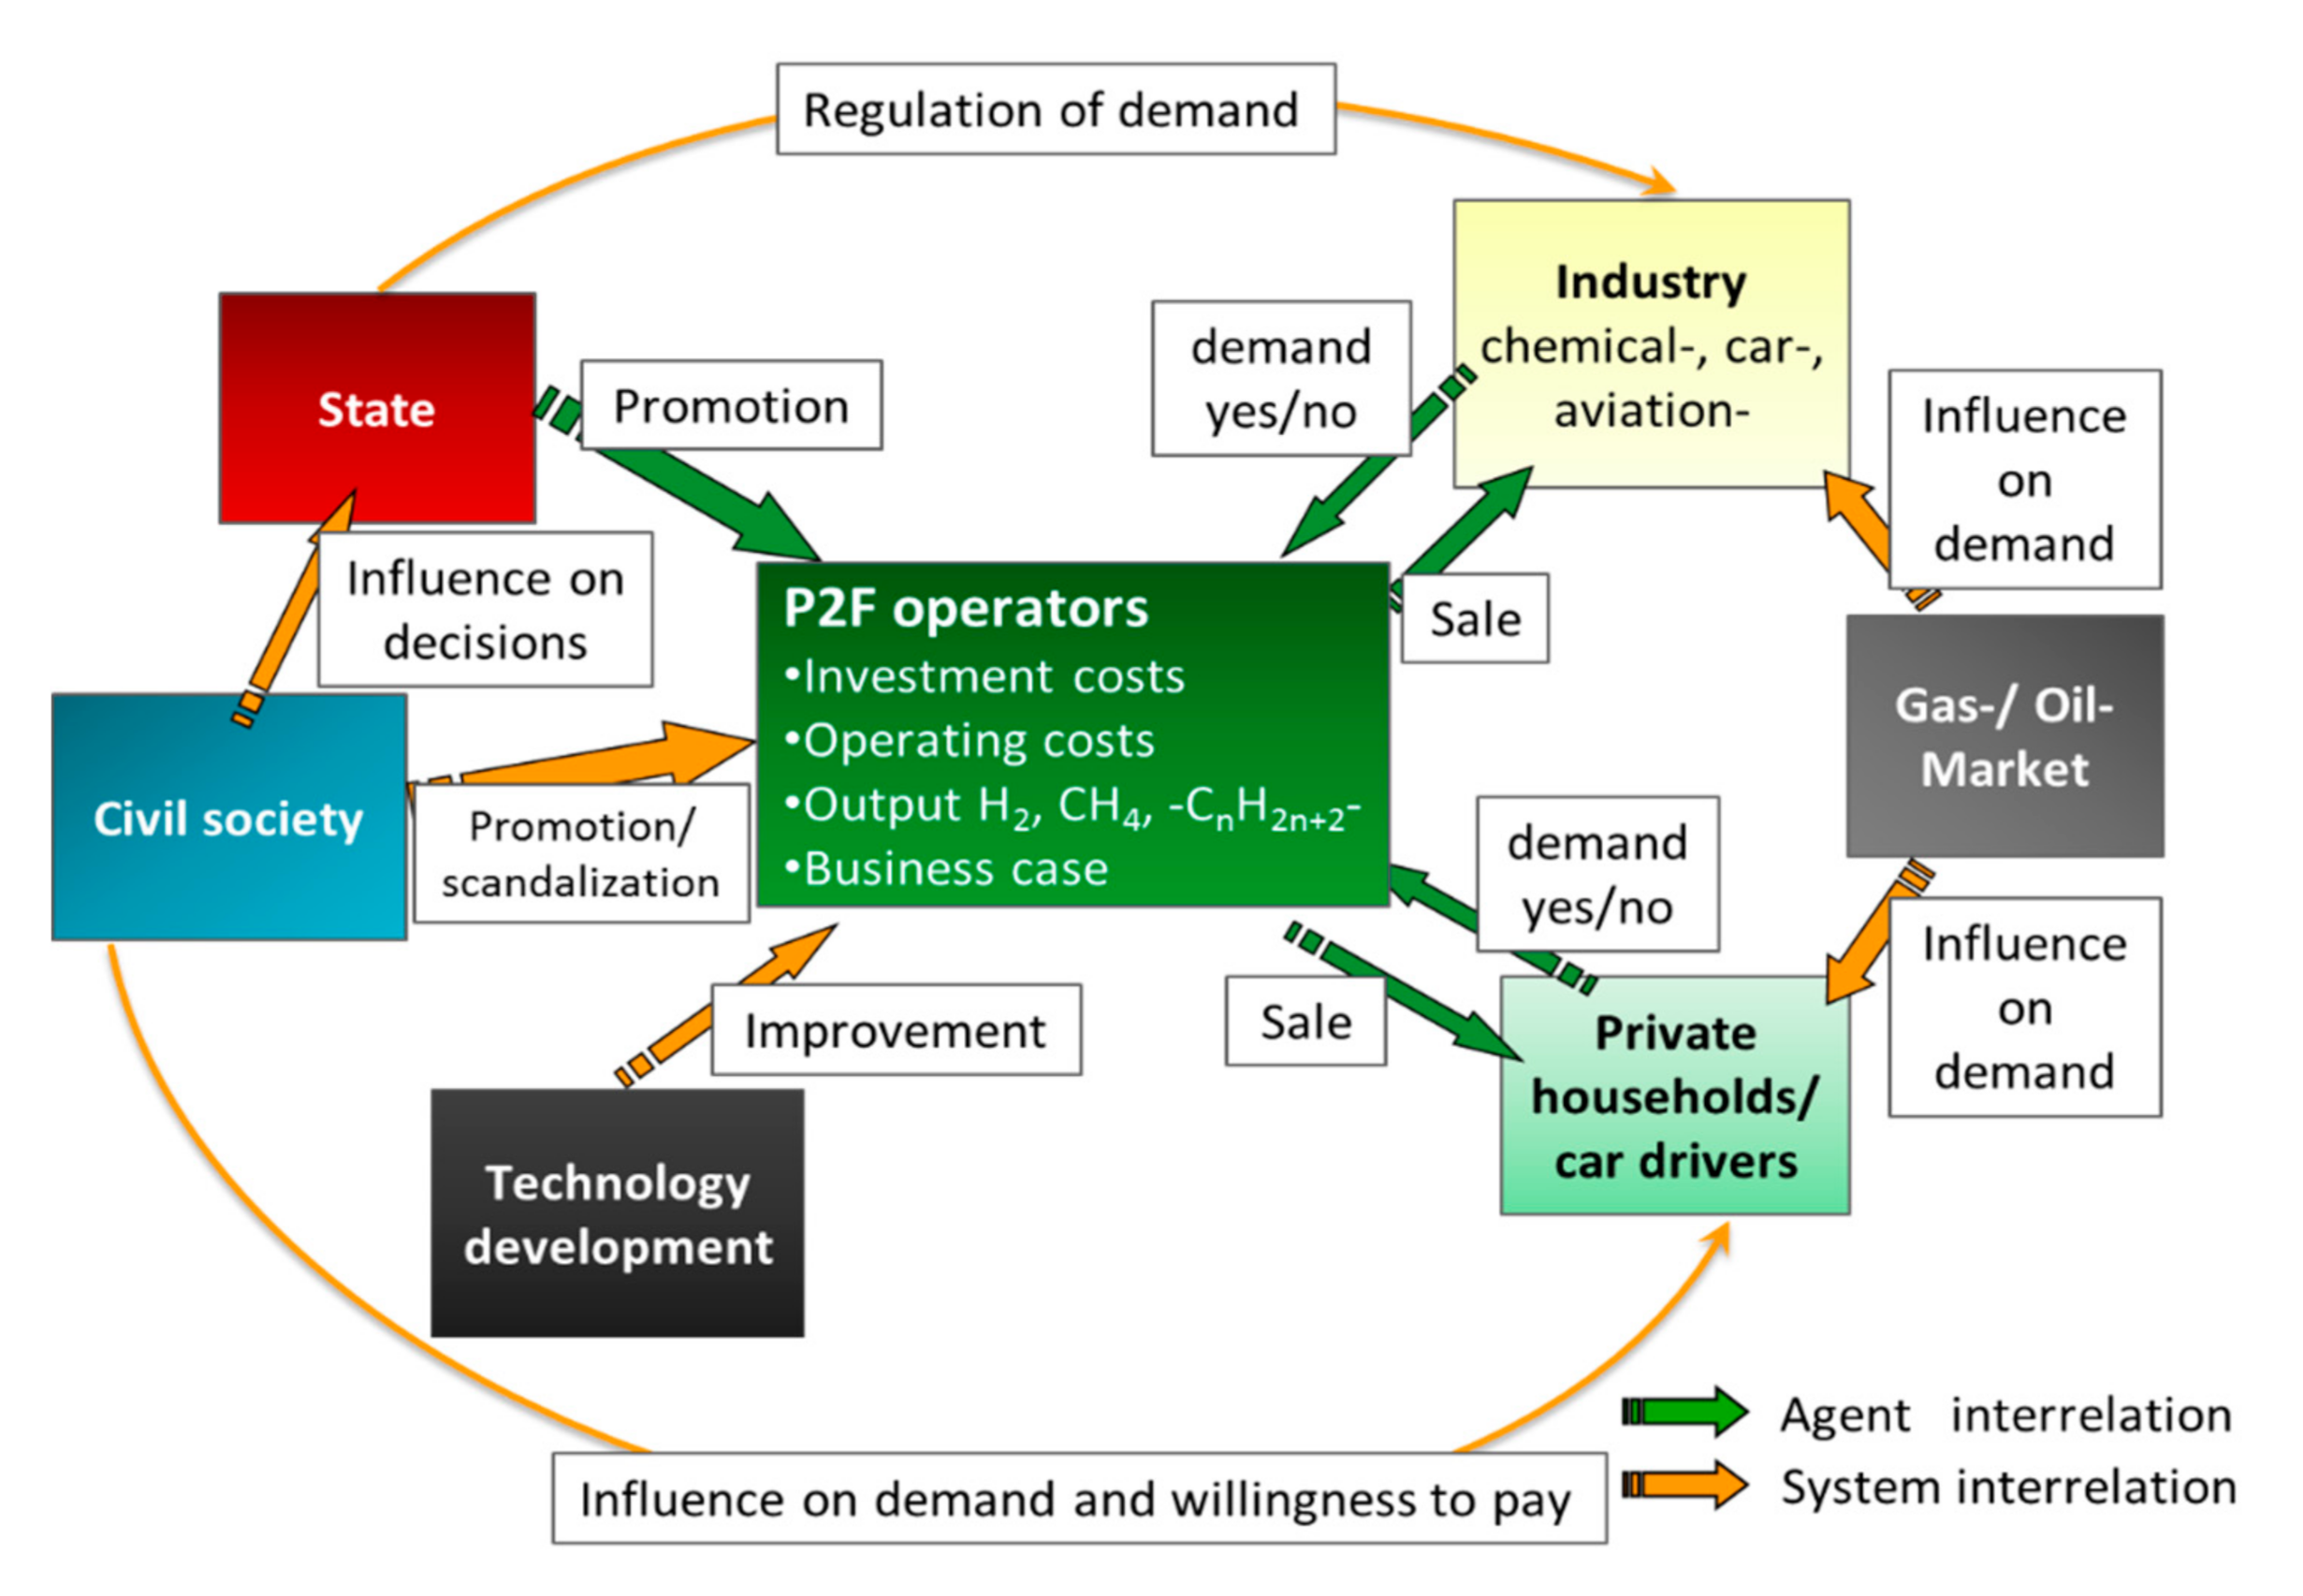
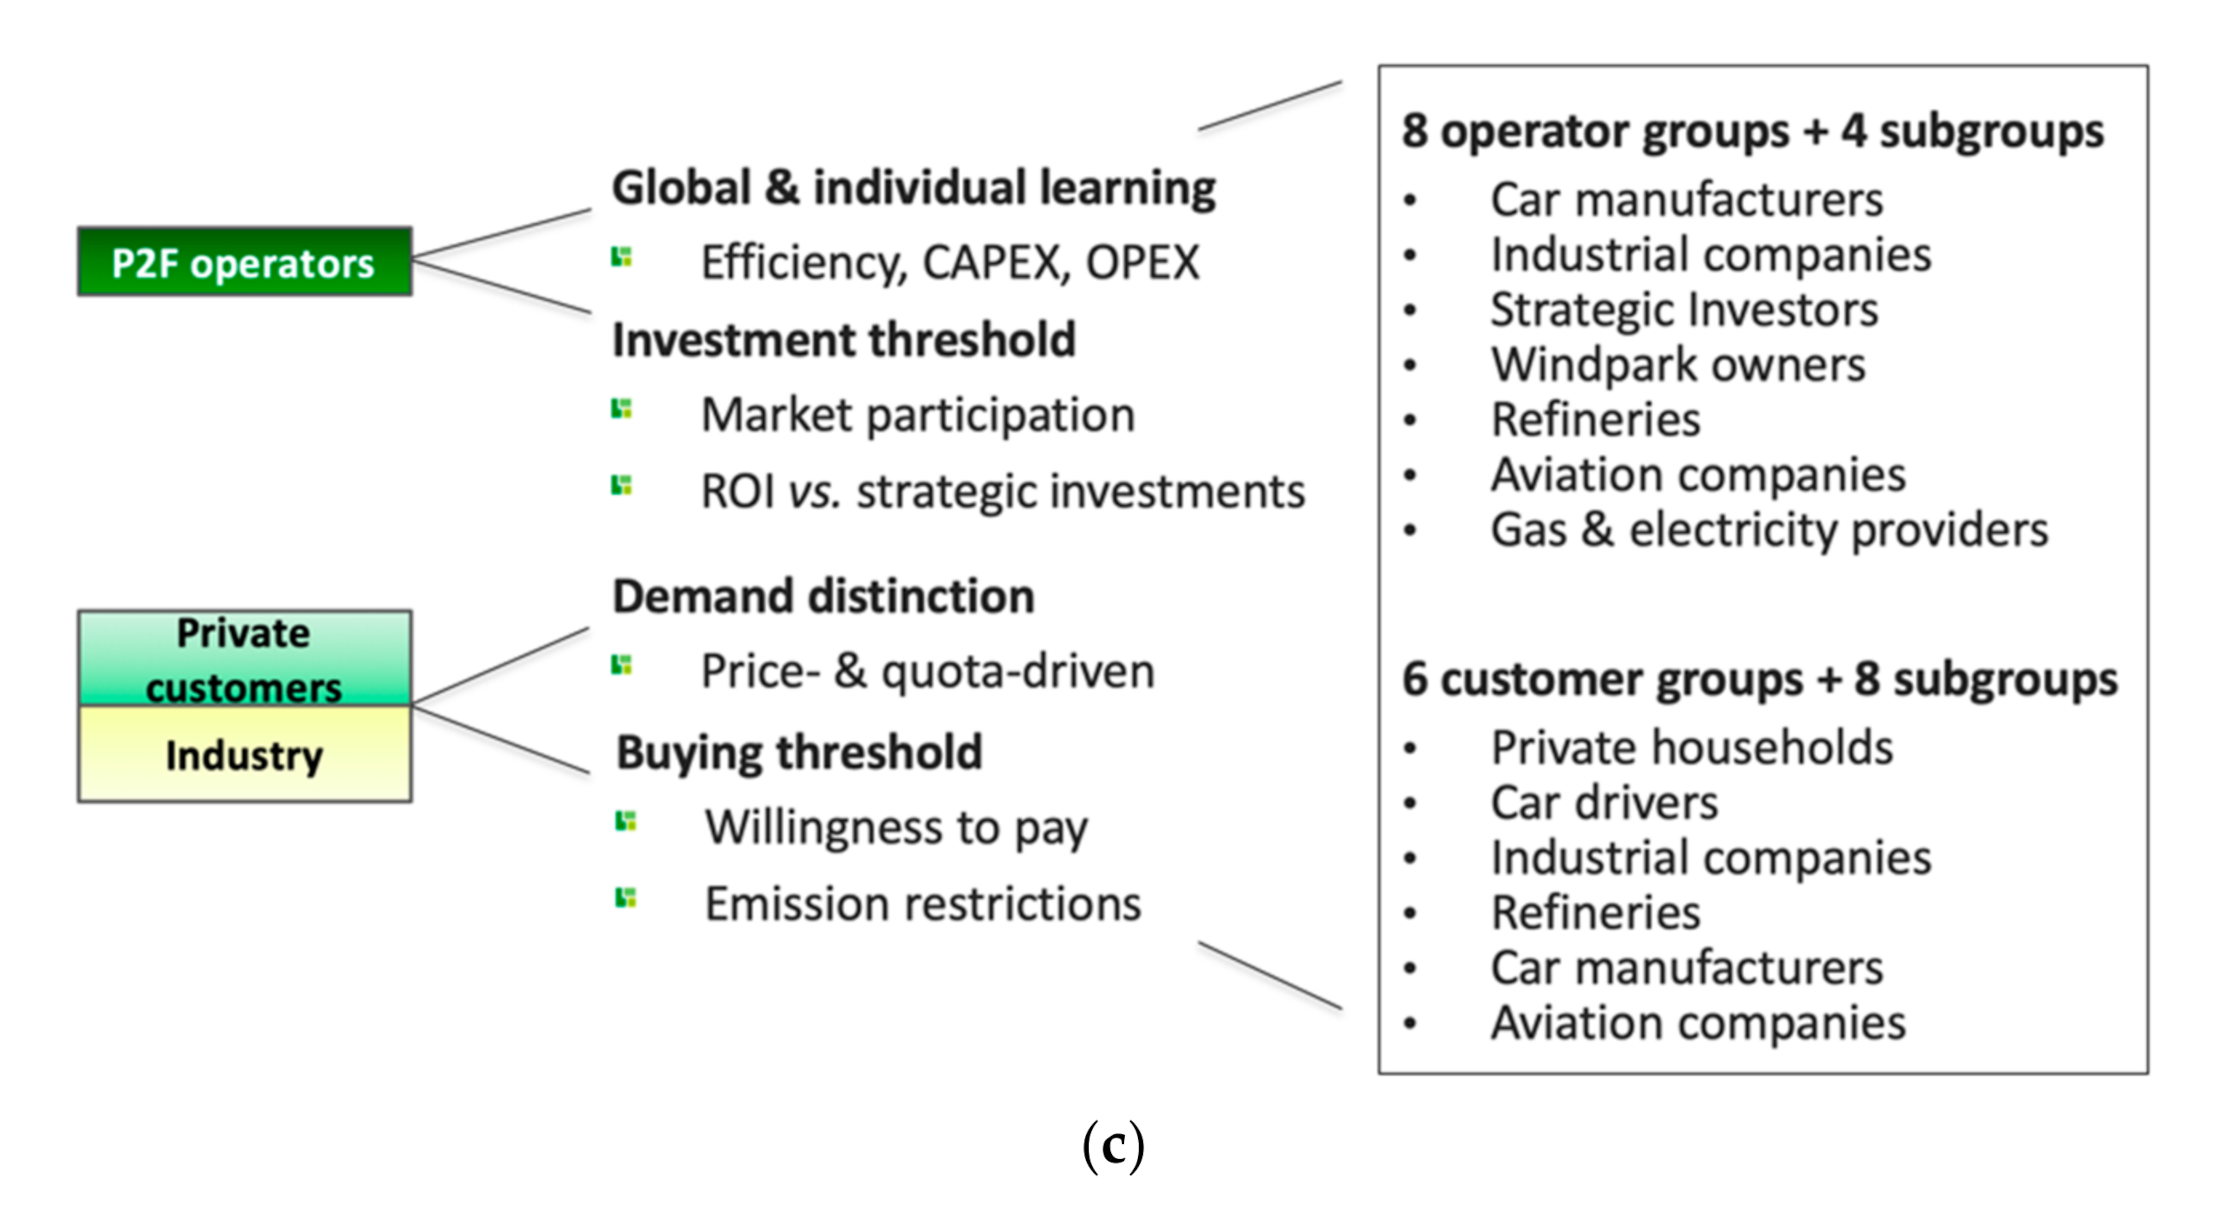
2.2. Conceptualization of the Agent-Based Model

The ABM was set up using the method of van Dam et al. to analyze framing conditions, which are desirable for a profitable operation of P2F plants [39]. Explicitly and in accordance with Section 2.1, the importance of subsidization mechanisms and their impact on private investments as well as social and regulatory impacts besides technology development are the focus of this investigation.
We implemented a deterministic ABM that simulates the situation depicted in Figure 3 by representing the various actors as individual decision-making agents. The energy system is modeled as one single system in which the demand for each energy carrier is subdivided into single markets with their own participants, prices, and sales volumes (see Table 1). The purpose of the model is to study the uptake “from niche to market” of the P2F technology, given the various push and pull factors depicted in Figure 2. The ABM can be used to explore options for cost-effective paths towards this uptake, as seen from the perspective of different stakeholders.
The model revolves around investment decisions made by a variety of P2F operators and purchasing decisions made by customers, all within a dynamic context of evolving regulation and technological progress. The regulatory push and the incentive pull are represented by the state as an agent in the model. The state sets greenhouse gas (GHG) mitigation requirements and provides targeted subsidies (or does not!). Especially in the early adoption phase, the state is a key driver for the innovation process. Subsidizing mechanisms sponsored by the state help enable the development of uneconomical pilot projects, thereby supporting early technical and economical uptake of the technology. The scandalizing push and the vision pull are represented by civil society and basically influence the willingness to pay of households. For technology push, we implemented technological improvement, resulting in a linearly improving efficiency and decreasing investment costs appropriate to the global capacity growth. Finally, the market pull is represented by private and commercial customer groups that have various motivations for purchasing P2F products. As we learned from current market situations, synthetic fuels can, to some extent, be sold in small niches to private households at premium prices. According to the rational choice theory, especially business companies will most likely not invest in more expensive energy products if they do not experience a benefit [45]. Business customers will have a quota-driven demand, which is strongly dependent on regulatory conditions with regard to GHG reduction efforts. As customer agents, we used private households and car drivers, including hydrogen mobility, as well as industrial sectors (see all agents listed in Appendix A).
The conceptual description above illustrates why ABM is an appropriate tool for our research question. Technology uptake is (or can be) a self-reinforcing process with many interdependencies that can only be understood in an integral way and subjected to a wide variety of potential circumstances when put into a simulation model. The P2F innovation system clearly involves heterogeneity among suppliers as well as buyers of P2F technology and products. In addition, this heterogeneity is essential when looking for high-potential niches for the uptake of P2F. ABM allows a natural way to characterize multiple groups as individual agents interacting in the model, while all agents still have to operate in the same technical, economic, and political context. Finally, the model results are very much oriented towards stakeholders in “the field” and policy. It is important to be able to discuss the concept behind the model and show model results without requiring too much modeling experience. ABM allows communication about the model in an intuitive way—each agent has a goal, a set of characteristics and preferences, and some available actions to achieve this goal. This is usually easier to grasp (than, for example, systems of differential equations). Not only does it make the model easier to communicate, in addition, it helps with validation and enhances trust in the accuracy and the adequacy of the model.

2.3. General Model Description

The Entity Relation Diagram depicted in Figure 4a provides a more technical view of the model structure. The model includes operators, customers, and subsidizers as active agent types, displayed in Figure 4b. Each agent actually represents a whole group of agents who together are considered as individuals. In addition, the model includes technology classes, (installed) technology instances, and business cases as passive object types. Finally, the environment provides the regulatory and the economic context for the interaction of agents and objects. All agents and objects are characterized in Appendix A. The market volume and prices for specific customer groups and energy carriers are listed in Table 1. The overall setup of the model was discussed with stakeholders from the field for validation purposes. The participating stakeholders are leading representatives of companies that operate their own demonstration plants, potential customers, strategic networks, and institutes of transition research.
All types of operators, customers, subsidizers, and technology classes that are distinguished in the model as well as qualitative characteristics and initial values of the most important environment variables are stated in Appendix A. In addition, Figure 4c provides an overview of operator and customer groups and their major properties. Complete details about the state variables of each agent and object type as well as the environment are described in the ODD (Overview, Design concepts, Details) protocol [46]. Furthermore, it provides the exact parameterization of all types of agents, objects, and the environment.
Customer agents are heterogeneous with respect to price and volume of demand, according to Appendix A. Price driven agents represent private customers with a higher willingness to pay compared to conventional fuels, motivated by the green quality of the P2F product. At each time step, they are able to decide whether to buy a P2F product or not. Once a P2F product is available on the market within an accepted price range of a customer agent, it buys it. Quota driven agents represent commercial customers that are directly affected by climate protection policies and are enforced to reduce their GHG emissions. In total, they compare the costs of fossil energy plus related charges for GHG emissions with the costs for P2F products. At each time step, they are able to decide whether to purchase the conventional or the P2F product. The individual customer demand volumes are divided into the categories “very small” (≤2% of total demand of this customer group), “small” (≤6%), “medium” (≤15%), and “large” (>15%) (see Appendix A).
Operator agents aim to maximize their installations. At each time step (one step = 1 year), these agents scan the market for available technologies. Depending on their allocated customers and/or the markets they aim to participate in, they choose whether to produce hydrogen (P2H2), methane (P2M), or liquid fuels (P2L). To be able to invest, they possess a specified starting capital and a yearly budget for operation. The capital was categorized as “small” (≤3 million euros), “medium” (≤15 million euros), and “large” (>15 million euros) (see Appendix A). Operating costs are divided into fixed (maintenance, salary, interest, etc.) and variable costs for input electricity and required CO2. Operators are able to achieve learning credits in case they own multiple plants, reducing their fixed operating costs. In addition, operators own an individual investment threshold related to the advanced rational choice theory [40]. Basically, the investment is differentiated by the motivation behind it—is it a strategic investment that may not be profitable from the very beginning but serves as market exploration? An early market integration might be desirable to develop early know-how and yield for a strong position in the new market (early adopters). On the other hand, more conservative operators and investors require profitable business cases with a return on investment within a defined period of time and are not willing to accept structural losses.
While regulatory changes are controlled on the system level, subsidies are provided by the state as an active agent. The amount of the total funding is a variable in the scenarios. The motivation for this agent is to maximize the global installed capacity for all technology classes. Further information on allocation mechanisms is explained in detail in [46].
P2F plants were characterized based on literature [26,47,48,49,50,51,52,53,54,55]. In the model, these plants were implemented as black boxes based on their current and projected characteristics concerning efficiency, investment, and operating costs. Technical details are considered out of scope. The plants have a utilization rate determining the assigned number of full load hours. It is further assumed that enough renewable electricity and CO2 will be available at times of operation. According to Sterner et al. and Fürstenwerth et al., efficiencies of the technology classes are assumed to increase linearly by 1% per year [12,56]. However, once a plant is installed, its efficiency remains constant. Investment costs for new installations decrease, as displayed in Equation (1) [57,58]:
I p n = I p 0 p n p 0 ln 0.8 ln 2
with IP(n) as investment in year n, IP(0) as investment at the base year, p(n) as capacity in year n, and p(0) as capacity in the basis year.
Finally, the economic and the regulatory contexts were derived from market information in Table 1 and legal aspects discussed in Section 3.
Looking at the model from a farther distance, we can position the model relative to other ABMs by discussing the most distinctive design concepts. One of such concepts is that the model is completely deterministic. Given a certain set of input parameters, agents will always make the exact same choices. In addition, uptake of P2F technology will always follow the exact same pattern. This has obvious performance advantages; there is no need to run a 10,000 iterations Monte Carlo experiment, afterwards trying to make sense of the distributed outcomes. Instead, those 10,000 iterations can be used to explore 10,000 different situations (i.e., combinations of input parameters). The disadvantage of this approach is that the model presumes to always know exactly what choice any stakeholder would make in a given situation. In reality, such choices can at best be seen as stochastic events.
Another distinctive concept is the heterogeneous approach to investment and purchasing decisions. Some operators are willing to make an initial loss on their investment, and some are not. Some have a preference for certain technologies, and others do not. Some customers are incentivized by wanting to be green, and others are forced by regulation. Some buy one product type, while others have multiple options. There is no specific prototype agent from some theory that generalizes all operators or all customers. Instead, we made an effort to do justice to the variation in considerations playing a role in the P2F innovation system based on discussions with stakeholders in the field.
Finally, there is a lot of interaction at the same time, including price developments, technological improvement (conditional on installed capacity), and global and individual learning effects with regard to installation and operating costs. The model does not look at one effect in isolation (although it would allow for such an exercise) but plays out all interactions as a whole.

3. Scenario Description with Consideration of Potential Markets and Legal Aspects for P2F

The economic potential of synthetic fuels is strongly dependent on the conditions of different energy markets for heat, industry, and mobility.
The existing natural gas infrastructure supplies large storage capacities for synthetic gas, and not all heating applications may be covered by power-to-heat or other alternative concepts [59]. However, even though first business cases were realized in niches of the heat sector, it is not expected to become a major market for P2F in the near future. The renewable hydrogen and methane still have to compete with natural gas, which currently is a cheap energy source with prices well below 3 ct kWh−1 in 2017 [60] and is predicted to remain so in the near future with prices below 4 ct kWh−1 [19].
As another option, the provision of basic chemicals for industries, e.g., ammonia and methanol as well as “green” hydrogen, might become an attractive future market. However, thus far, there are no climate protection restrictions implemented in this market. In the absence of other incentives, industrial companies will not use synthetic substitutes beyond niche applications as long as these come at higher expenses than fossil fuels. CO2 certificate prices of about 7 € t−1 CO2eq until the beginning of 2018 did not appear to have any effect on emission savings in the industry sector [61,62]. Instead, a much higher certificate price for CO2 emission allowances in the EU emission trading system (EU ETS) on an international basis as well as other GHG emission restrictions might lead to a higher attractiveness of P2F [63]. Reforms to the EU ETS in the recent past have seen an increase in certificate prices from 5.8 € in 2017 to 15.5 € in 2018 [64] and up to 23.40 € at March 2020 [65]. With the approved introduction of an additional carbon tax in Germany from 2021 onwards [66], emission trading is expected to see further price increases within the decade.
Parts of the mobility sector might become the first economically viable applications for synthetic fuels. A broad range of greenhouse gas emission reduction policies is already established and will be enhanced over time. Germany will have to lower its transportation based emissions by at least 38% compared to 2005 according to the effort sharing regulation until 2035 [8]. Currently, biofuels are the most important renewable energy source in the mobility sector to fulfill the GHG emission quota. With regard to this, refineries are facing two dilemmas. (1) Biofuels are barely accepted by society so that petrol and diesel with a higher mix of biofuel can hardly be sold at gas stations, even though they are offered at a cheaper price compared to conventional fuel [67]. (2) In the current legal framework, the renewable share of the total fuel production must increase linearly over time, and the GHG reduction potential of the utilized biofuels must improve as well. P2F might become an attractive alternative for refineries to meet the quota. Furthermore, P2F becoming competitive with biofuels seems more realistic than with conventional fuels.
As car producers must reduce their average fleet emissions to 95 gCO2 km−1 in 2020 [68,69,70], P2F might also become an opportunity to meet these emission restrictions. For this reason, the current largest operating power-to-gas plant in Germany is operated by a big car manufacturer. For the shipping and the aviation industries, there are no emission reduction quotas applied yet. However, the International Air Transport Association (IATA) has set up its own emission reduction targets with CO₂ neutral growth from 2020 on and a halving of the global fleet’s overall CO₂ emissions quantities by 2050 relative to 2005 levels [71,72]. Even though first attempts are heading in the direction of biofuels, it cannot be expected that long-term emission reductions will be possible without P2F in the aviation business [73].

3.1. Legal Aspects

Looking at P2F from a life cycle perspective, GHG savings are possible in the fuel production process. In Germany, the former biofuel quota was replaced with a new GHG reduction quota related to the European Fuel Quality Directive (FQD). By adding biofuels as drop-in to conventional fuels, the quota can be fulfilled. While the GHG reduction potential was set to at least 35% compared to conventional fuels until 2017, it has been further increased to at least 50% from 2018 on and up to 60% for plants in operation since October 2015 [74]. For the substitution of conventional diesel, mostly biodiesel is used in Europe today, with about 75% produced from rapeseed methyl ester. However, its GHG reduction potential is calculated to be as low as 37% [75,76]. If the GHG reduction quota is missed, a penalty of 470 € t−1 CO2eq needs to be compensated from actors delivering the fuels to the market, e.g., refineries [77].
While legal considerations of synthetic fuels are still to come, restrictions on conventional biofuels are becoming more stringent in the foreseeable future. With an increasingly shifted focus on second and third generation biofuels, the status of synthetic fuels might change towards greater importance [8]. Within Germany, energy storage concepts such as P2F are regulated by the Erneuerbare-Energien-Gesetz (EEG) and the Energiewirtschaftsgesetz (EnWG). Hydrogen and methane are considered as biogas if at least 80% of the utilized electricity originates from a renewable source with a direct connection to the production facility (§ 3 Nr. 10c EnWG). This gives P2F plants a feed-in-priority into the natural gas grid [78]. With regard to additional charges on the levelized costs of electricity, there is an ongoing debate on how to classify P2F plants in the EnWG. At current conditions, P2F plants are considered as an end consumer, resulting in the responsibility of paying several additional taxes and fees [78,79]. As an end consumer, P2F plants are legally treated as private households. Based on the year 2015, and without assuming any exemptions, this results in additional expenses of 22.69 cents per kWh. However, P2F plants are exempt from network use fees (Netzentgelte) for 20 years, even if the output product is not used for electricity generation (§ 118 Abs. 6 Satz 3 EnWG). Furthermore, electrolyzers are exempt from electricity tax (Stromsteuergesetz, StromStG § 9a Nr. 1). Besides these reductions, additional charges of 13.06 cents per kWh still remain. The biggest part of the remaining charges is the EEG fee of 6.405 cents per kWh as it was in 2019 [80]. For the future, stakeholders in the field of P2F expect and demand major changes in the legal framework. Beginning with the National Hydrogen Strategy, several ministries enforce the production of hydrogen, and new funding is approved. It seems likely that legal framing conditions will soon become more favorable for the production of green hydrogen and synthetic fuels.

3.2. Description of Scenarios

With regard to the discussion in Section 2 and Section 3 concerning suitable markets for P2F products, the legal framework, and the actor specific interests, we created three scenarios to investigate possible P2F capacity expansions in the German energy system.
First, model calibration and validation were carried out referring to the actual German development of P2F capacity from 2011 until 2016. Capacity growth was calibrated based on available data for P2F technologies, demand volumes, willingness to pay, market prices, investment thresholds, and allocated funding sums (see Appendix A). We also used this setup for a base scenario with a simulation horizon until 2029. In the base scenario, all framing conditions remain constant to investigate the scale of P2F integration in the close future if no further supporting policies and climate protection directives are applied legally.
Secondly, a moderate policy scenario was developed to simulate the impact of single changes in the framing conditions. In this scenario, a linear rise in market prices for natural gas and mineral oil is implemented, and synthetic fuels are further legally accepted as biofuels by national law (BImSchG). This enables fuel producers (e.g., refineries) to make use of synthetic fuels for GHG mitigation and GHG emission reduction quota fulfillment. In addition, it may influence the investment behavior of car manufacturers and aviation and shipping industries. The simulations run for a time period between 2016 and 2035.
In a third scenario, “EnergiewendePlus” (EW+), we implement further policy adjustments, which are discussed with regard to an ambitious energy system transformation process in all sectors. An exemption from the EEG fee and a legal high GHG reduction potential for synthetic fuels are implemented in this scenario. Within this scenario, we further implement specific changes: stronger subsidization efforts, higher EU ETS certificate prices, change of acceptance patterns, and GHG reduction restrictions for companies. The resulting effects on capacity growth rate and related investment volumes were investigated step by step.

4. Results and Discussion

In this section, we present the simulation results and discuss them in light of the theoretical framework presented in Section 2 and Section 3.

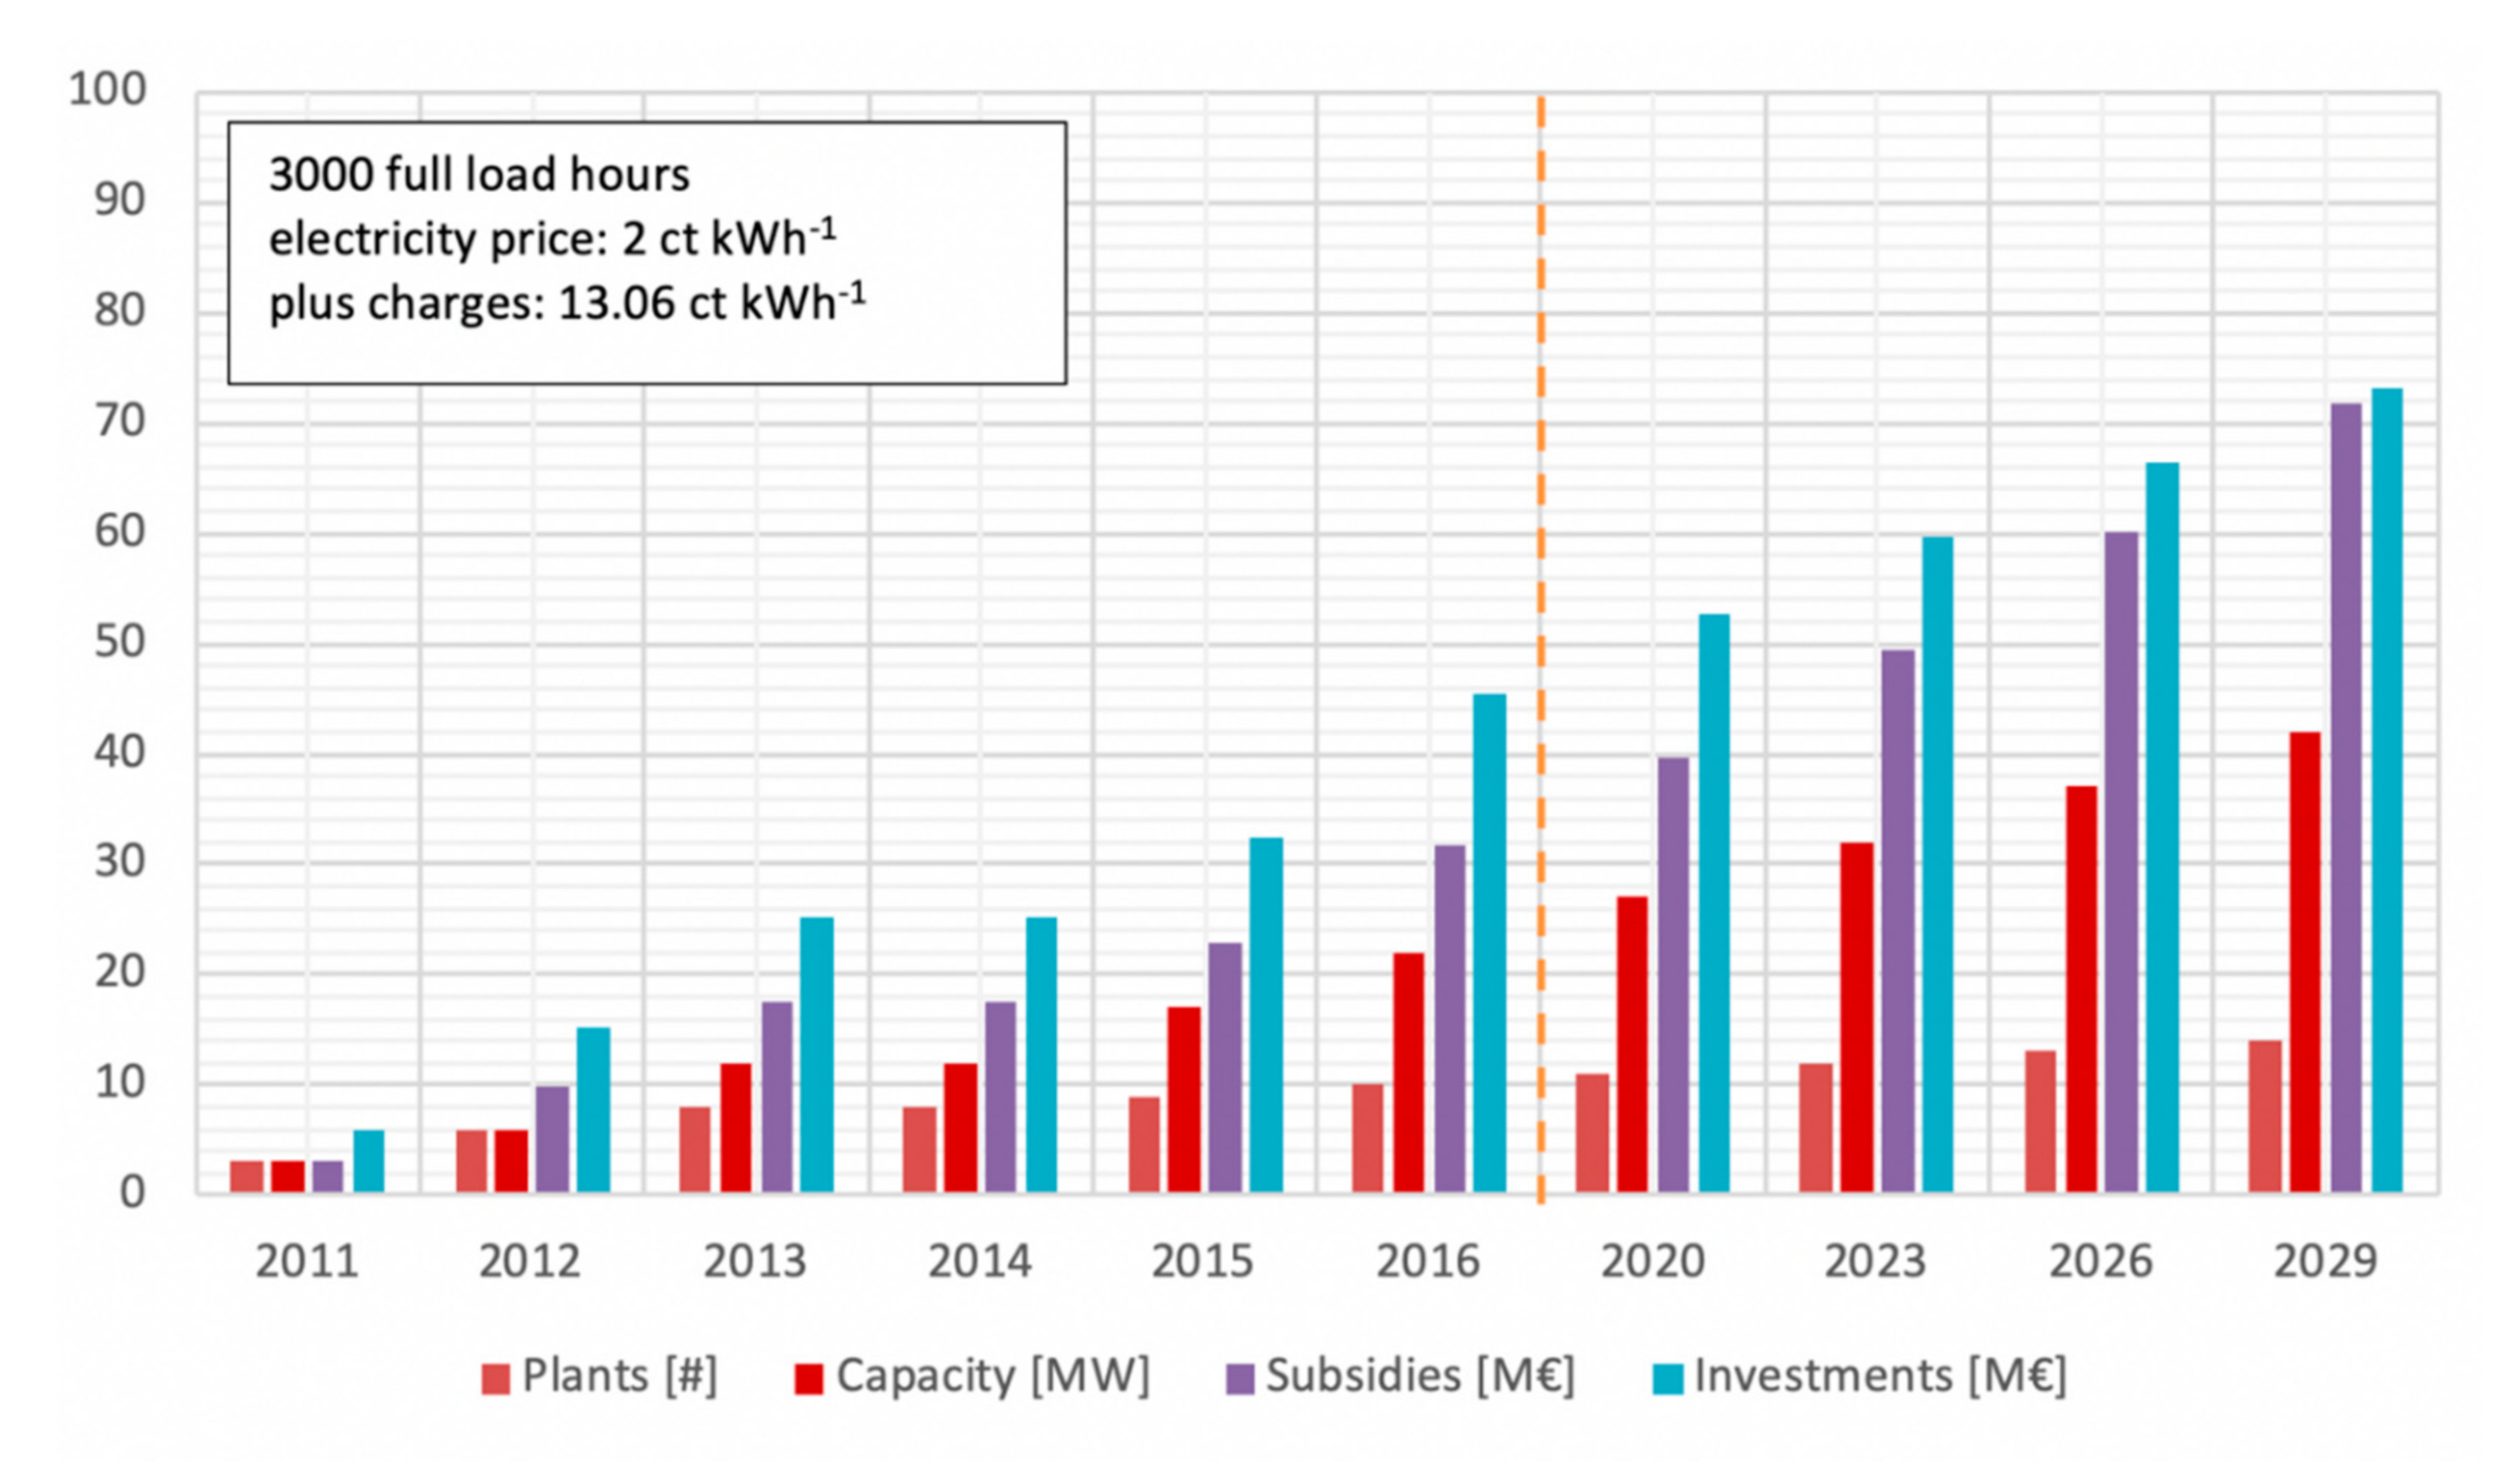
4.1. Model Calibration and Base Scenario

The actual installed P2F capacity in Germany in 2015 was 21 MW producing hydrogen, methane, and liquid fuels [81]. The total number of installations stood at 23 with many of those plants operating with electrolyzer sizes below 500 kW.
Figure 5 shows the simulation results of the model calibration and the base scenario. Within the model calibration, the actual capacity growth until 2016 was successfully simulated with only little deviation from real figures. A total investment volume of 46 million euros and an additional 32 million euros of subsidization lead to a total capacity of 22 MW, consisting of 12 MW for the production of hydrogen, 9 MW for methane, and 1 MW for liquids. The ratio of the end product types is also close to the actual distribution. The largest deviation appears in the capacity of liquid fuel production, which was 150 kW in reality in 2016 and 1 MW in the model. This is a consequence of a model restriction allowing a minimum plant size of 1 MW. Installed plant numbers are lower than the real number, also as a consequence of the minimum plant size restriction.
Further simulated development in the base scenario until 2029 shows a total capacity of 42 MW, realized with subsidies of 72 million euros and 73 million euros of private investments. As a result of the slow extension, investment costs barely decreased compared to the start of the simulation. According to Table 2, investment costs for P2H2 installations decreased by less than 14% at the end of the model run compared to 2016. P2M plants achieve a cost reduction of ~12%, while P2L remains constant. The results can be explained by a very limited market volume, which hardly enables business cases. In total, 84 GWh of synthetic fuels are produced in 2029, of which 95% is purchased by private households and only a small fraction of the car industry. As these small markets are increasingly saturated over time, the growth rate is decreasing towards the end of the model run. This is also displayed by the relationship between investments and subsidies, which almost end up in a 1:1 ratio in 2029, since business cases need more funding to be realized. Furthermore, there are no incentives for industrial companies to improve their CO2 balance. Only strategic investors who produce for their own market exploration interests and a small fraction of private households with a willingness to pay of up to plus 20% for the renewable substitute become operators in this scenario.
Because of high product prices and relatively little demand for P2F products, the production costs hardly decrease as learning effects stagnate. Table 2 shows the modeled production costs in 2015 and 2029, which strongly exceed prices for conventional energy and biofuels.

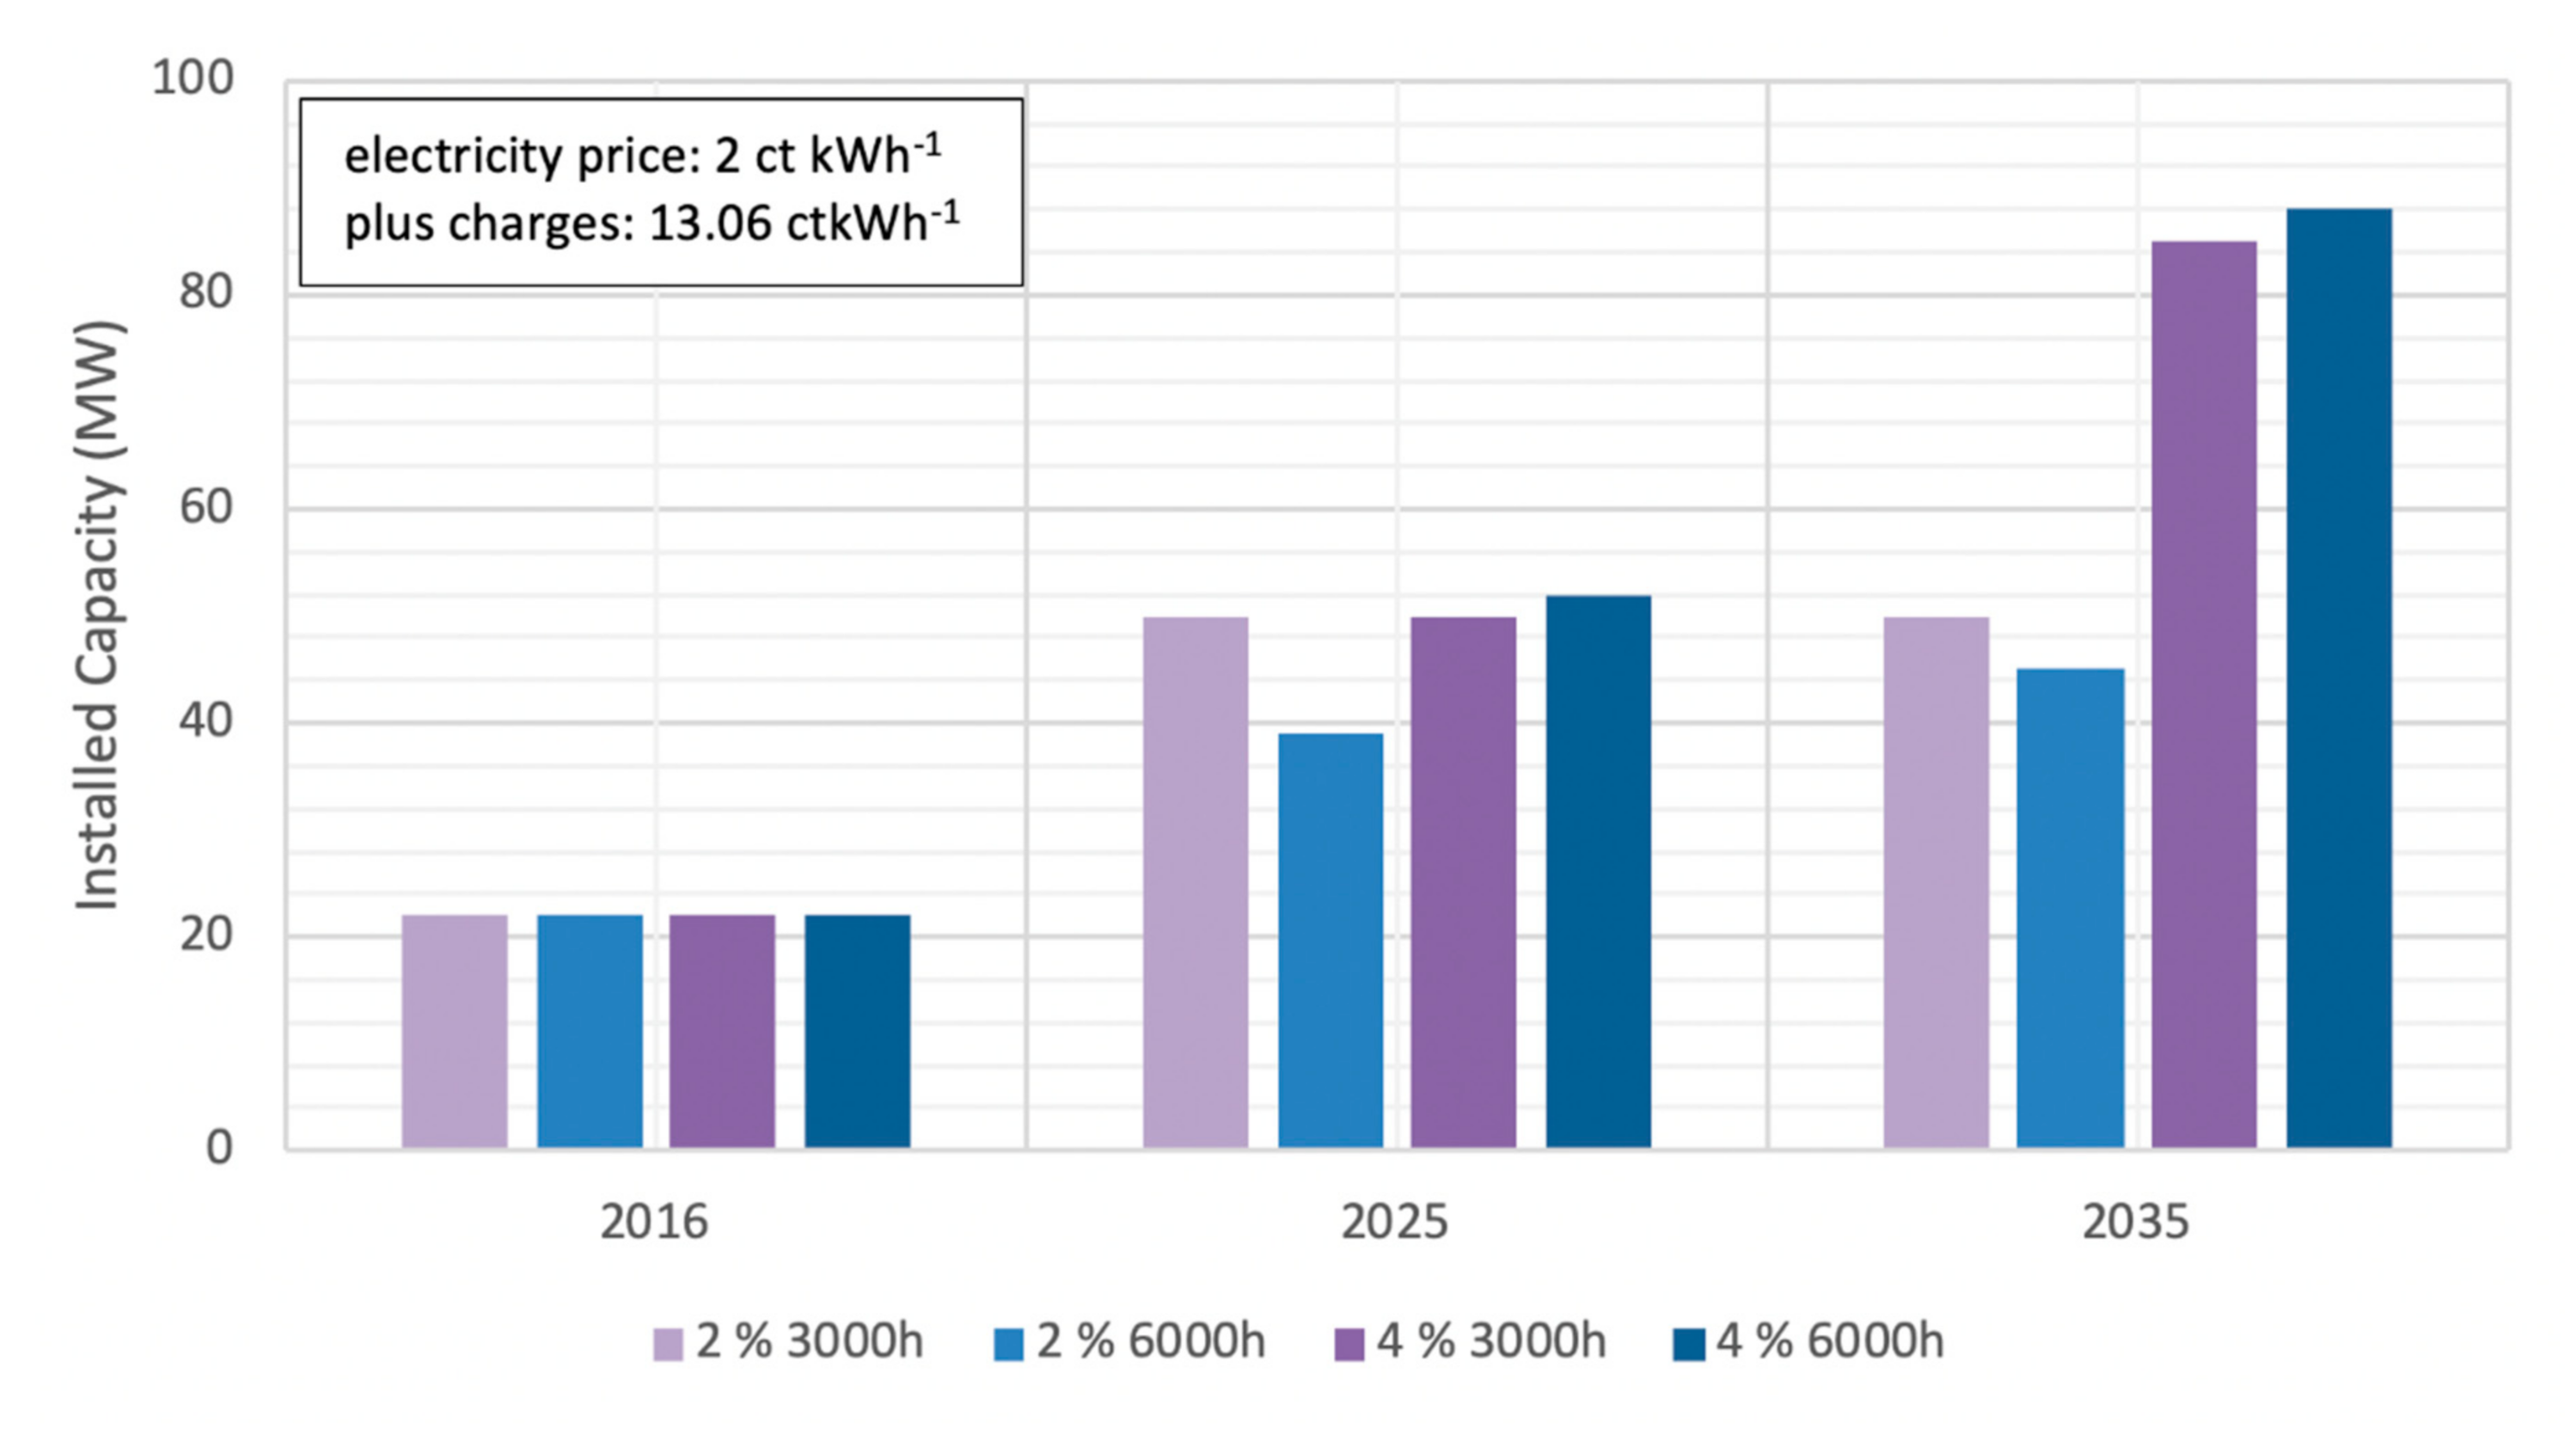
4.2. Moderate Policy Scenario

Having the model validated, the simulations for the moderate policy scenario start in the model year 2016 and end in 2035. The already preinstalled capacity until 2015 is integrated as starting capacity as well as related subsidies and investments.
As shown in the base scenario, business cases cannot develop with a moderate subsidization being the only supporting mechanism. In the moderate policy scenario, linearly increasing prices for mineral oil and natural gas are implemented, and plant operations at different full load hours are investigated.
Conventional energy price rise of 2% a1
Conventional energy price rise of 4% a1
3000 full load hours in relation to electrolysis capacity
6000 full load hours in relation to electrolysis capacity
As energy market price mechanisms are extremely complex, and a forecast for actual price development is not possible, two linear approximations are chosen. The results of Figure 6 show that increasing fossil fuel prices of up to 4% a1 can hardly improve the economic feasibility of P2F plants. Hydrogen and methane production remain the major outputs. The capacity reaches a maximum of 88 MW at 6000 full load hours, which is only slightly above the maximum at 3000 full load hours. The realized projects are still strongly dependent on subsidies and imply a strategic loss-acceptance by progressive operators. Thus, as a result of the economically disadvantageous environment, the installed capacity is lower at 6000 full load hours compared to 3000 full load hours in the 2% a1 price increase case; each operation hour implies a monetary loss as the demand remains too low.
In other words, the fewer hours a plant is running, the more it is economically “feasible”, since the operation is always combined with losses. According to Table 1 and Table 2, the results are not surprising, since the gap between production costs and market prices cannot be closed by increasing market prices only. The results reveal that regulatory signals are essential for an integration of the P2F technology into the energy system. For industrial companies, there is no motivation to switch from fossil to renewable fuels, as EU ETS certificate prices are low, and only limited restrictions for GHG reduction are realized. At these conditions, the P2F concept will not exceed its current pilot status. A scaling up progress with larger production series and decreasing investment costs will not occur.

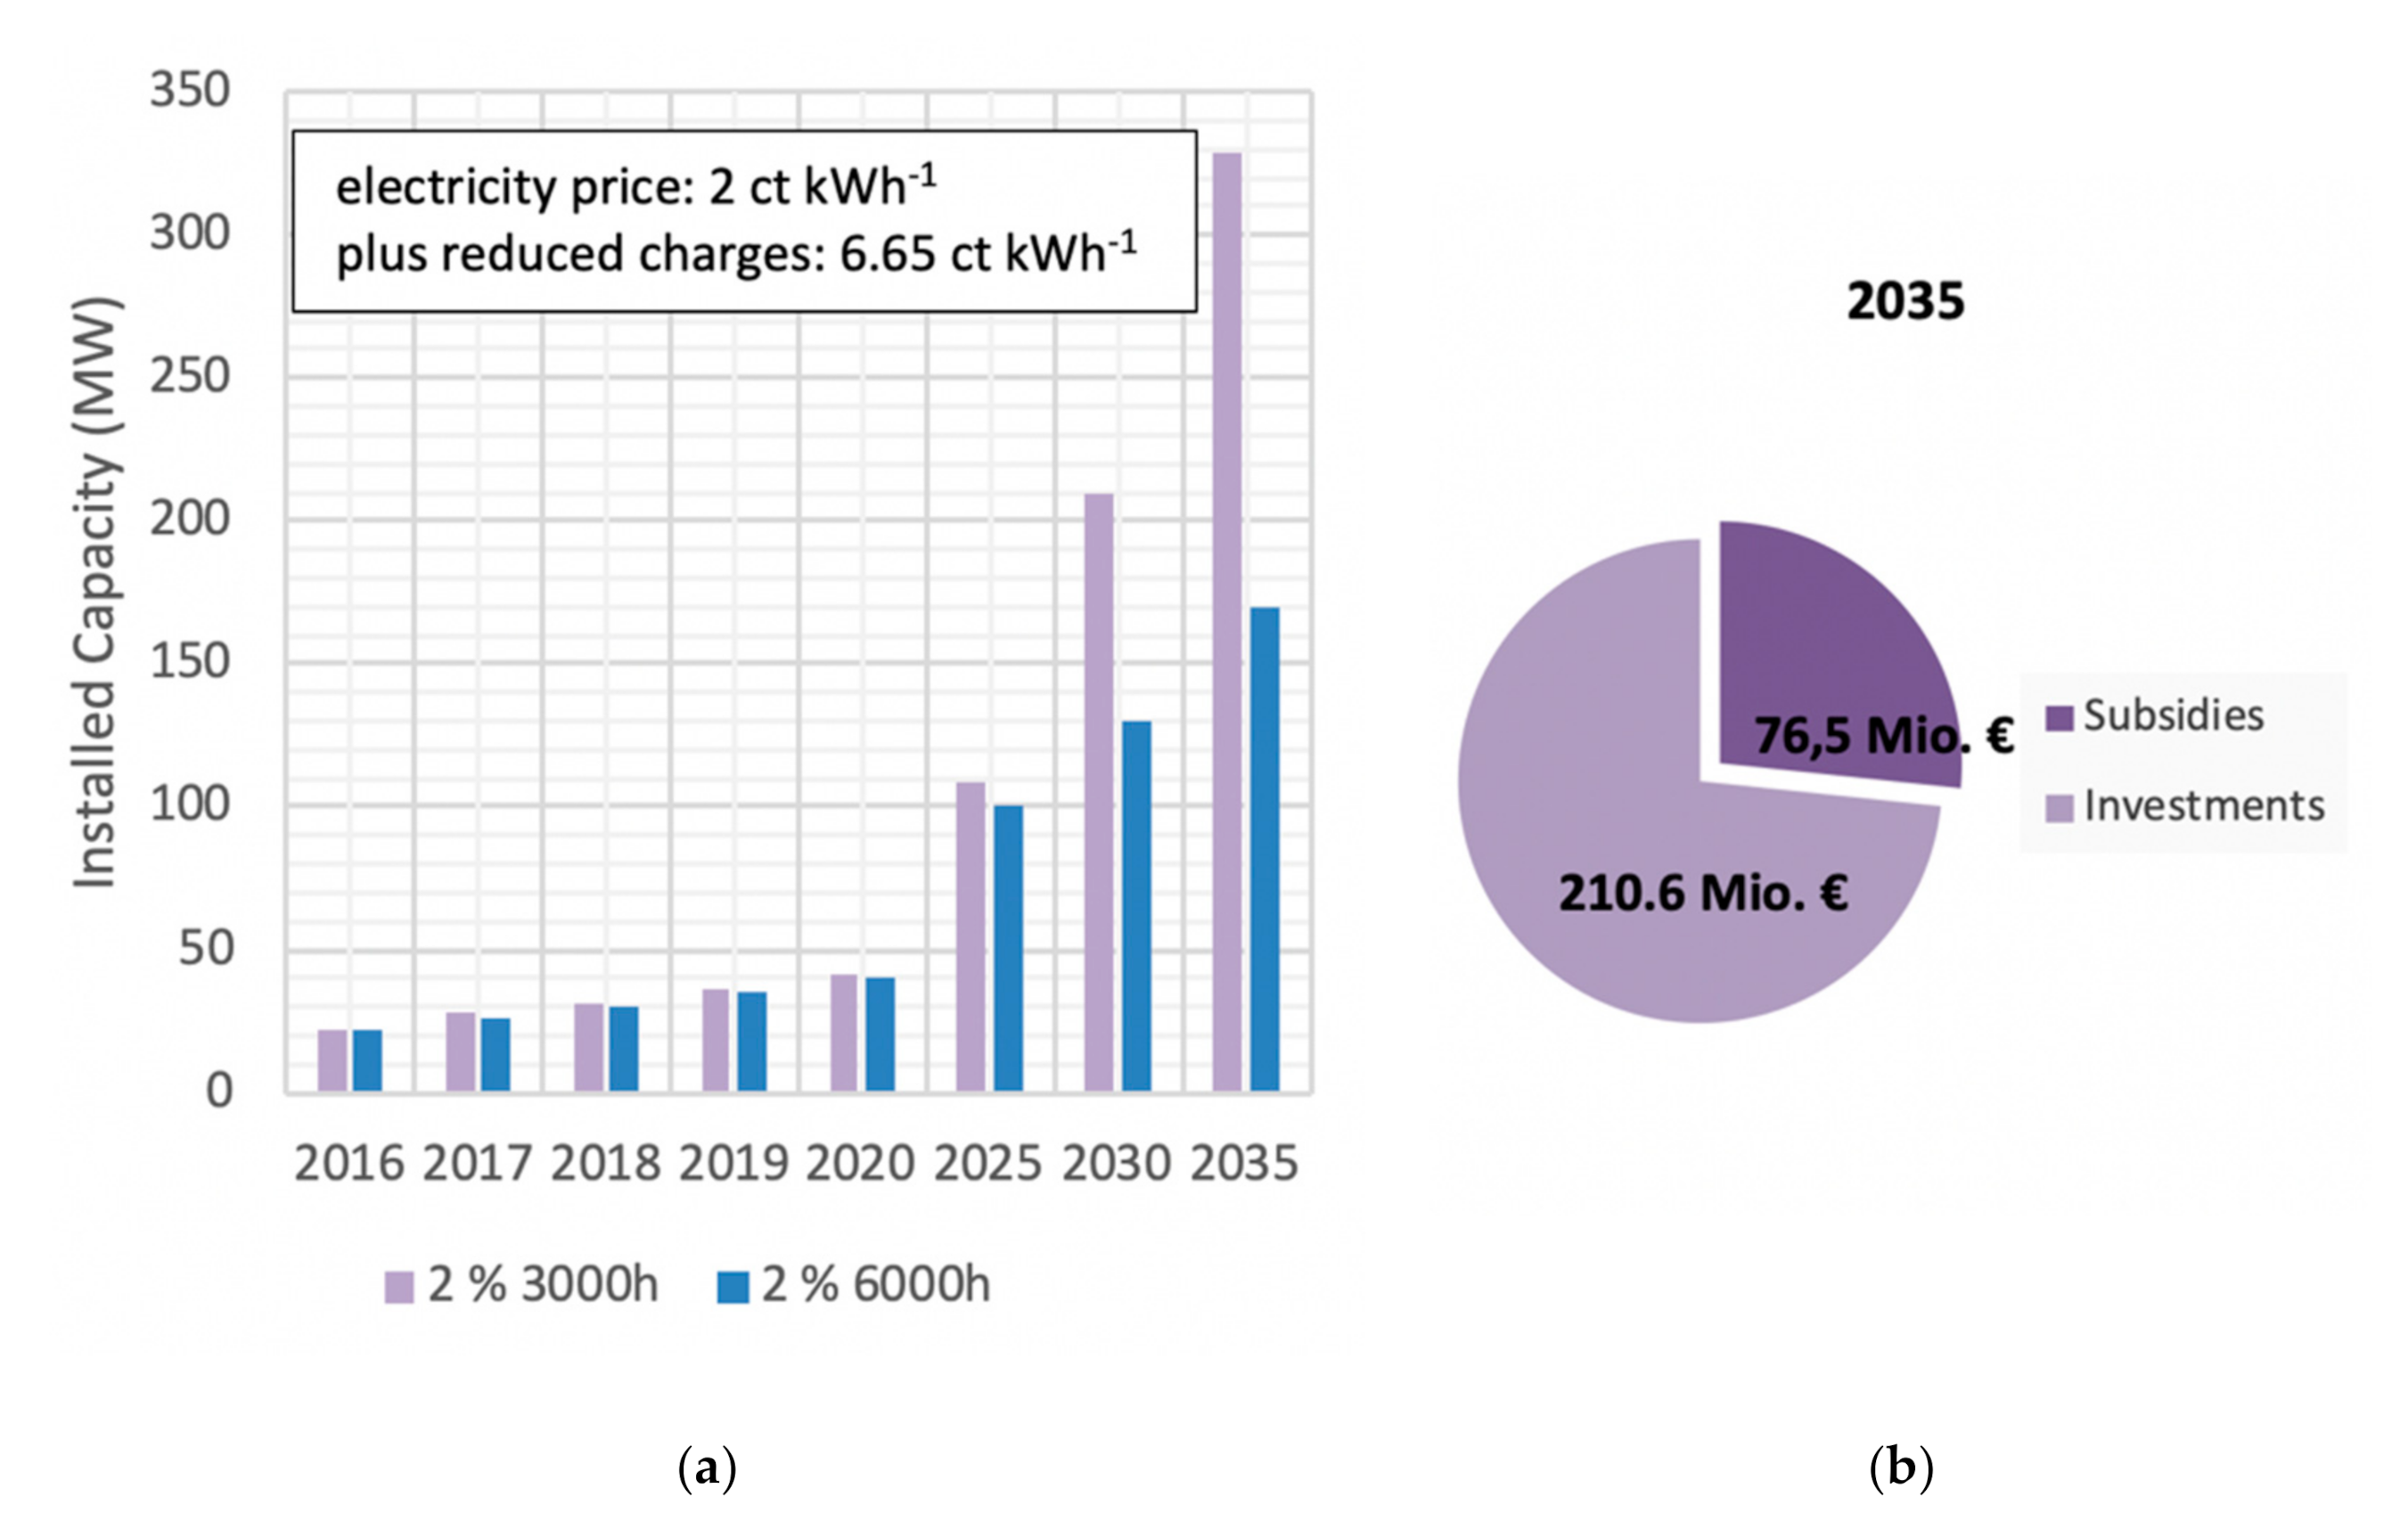
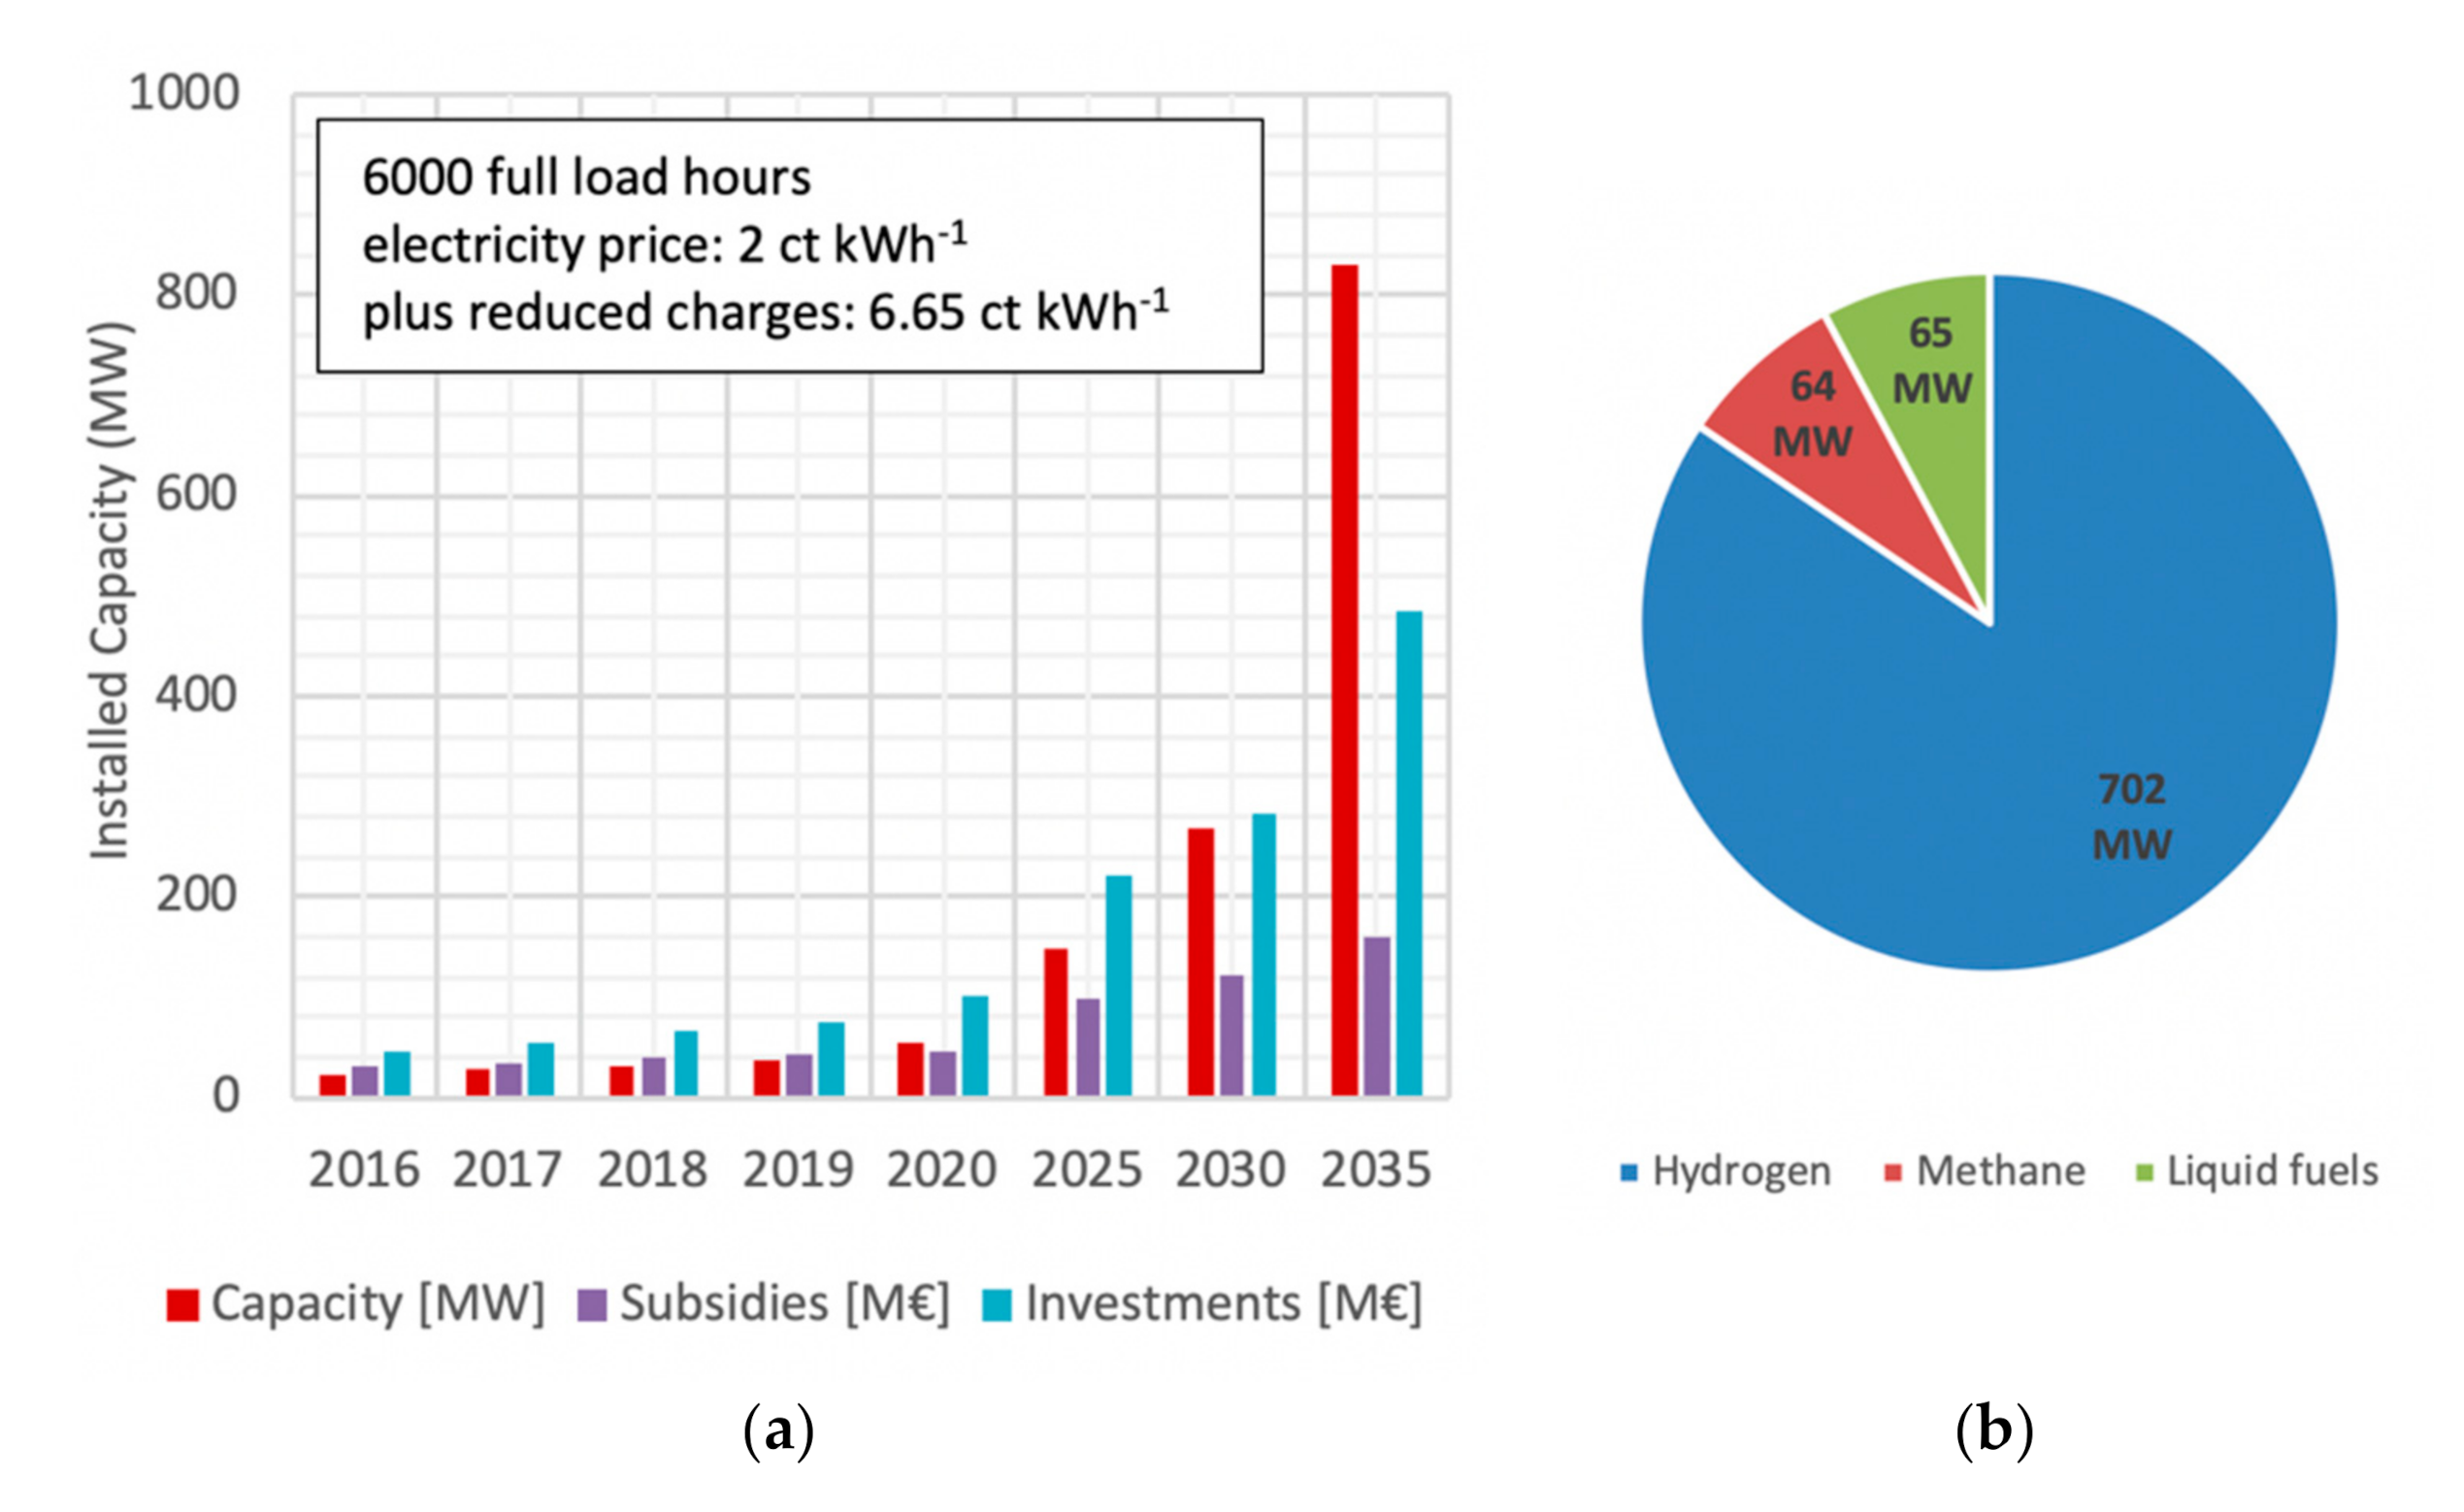
4.3. EnergiewendePlus (EW+) Scenario: Optimizing Parameters for an Ambitious Energy System Transformation

4.3.1. EEG—Fee Exemption

A big topic in the general discussion on regulative conditions for operators is the legal status of operators in the Energy Industry Act (EnWG). As stated above, operators are considered as end consumers today. The EEG fee has the biggest share of surcharges on input electricity with 6.354 ct kWh1 in 2016. P2F operators argue that their plants should be considered as a storage or a conversion device in the Energy Industry Act, as the installations do not consume electricity but convert it into storable chemical energy. Without the EEG fee, the surcharges for input electricity reduce from 13.06 ct kWh1 to 6.65 ct kWh1 in the year 2016 (see Appendix A).
Figure 7 shows the capacity development for 3000 and 6000 full load operating hours at moderate increasing fossil energy prices of 2% a−1. As a result of the much lower electricity procurement costs, the capacity grows up to 321 MW in 2035 with 3000 full load hours. With production costs still above 13 ct kWh−1 in the case of hydrogen and >18 ct kWh−1 for methane, the substitutes remain more expensive than natural gas, mineral oil, and biofuels. This is also indicated by the slower capacity growth at 6000 full load hours. However, the more attractive framing conditions lead to much higher investments in relation to subsidies. A total funding of ~77 million euro activates private investments almost three times higher, which end up in the niche markets, where private households and car drivers pay for the renewable substitutes.

4.3.2. Biofuel Recognition

Another discussion point in the P2F network is the legal recognition of synthetic fuels as biofuel. The EU parliament adjusted relevant directives (FQD and RED) in 2015 (and furthermore enacted by the RED II in 2018), which enable customers to legally reduce their GHG emissions by the use of synthetic fuels [82]. As a further extension in the EW+ scenario, the legal recognition of synthetic fuels as biofuel was implemented, which is especially interesting for refineries. The desulphurization process of petrol, diesel, and jet fuel as well as the cracking process of hydrocarbons requires huge hydrogen amounts of ~2.5 TWh per year in Germany [83]. Today, this hydrogen has a fossil energy source, as it is mostly provided through natural gas steam reforming. A substitution by renewable hydrogen could save up to 375,000 tons CO2eq per year. Due to the greenhouse gas reduction quota (Treibhausgasminderungsquote), refineries are obliged to reduce the emissions of their delivered fuels by 6% until 2020. Thus, at desirable framing conditions, synthetic hydrogen might become economically interesting for refineries. In the model, a high electrolysis capacity of 702 MW evolves in 2035 if renewable hydrogen is legally acknowledged as biofuel (see Figure 8).

4.3.3. High Willingness-to-Pay

In contrast to biofuels, P2F concepts are not yet confronted with negative acceptance issues. Instead, the opposite seems to be the case, indicated by the willingness-to-pay (WTP) of customers [20]. A special feature of the ABM is the consideration of acceptance patterns. The experiments also include simulations of a high acceptance of synthetic fuels which may result, e.g., from unpredictable extreme events or new scientific insights about consequences of climate change. For such a scenario, it was assumed that up to 10% of private households are willing to pay a premium of plus 15% for green fuels compared to prices of conventional energy providers, and 5% of the households pay a premium of up to 25%. Figure 9 shows the impact on the capacity growth up to 2.7 GW in 2035. Whether considered realistic or not, the results reveal that either a high WTP for renewable products or legally enforced quotas are required besides higher price levels of fossil energy.

4.3.4. Strong Legal Regulations

In a last optimization step, such acceptance patterns were not considered. Instead, a scenario with a focus on subsidization mechanisms was created, since all of the above results show a strong dependence on subsidies. For the simulation of an economic integration independent from subsidies in later phases, further adjustments were implemented:
  • High EU ETS certificate price of 100 € ton CO₂−1 from 2021 on
  • Strong start-up subsidization of 60 million € a−1 until 2025
  • Strong GHG reduction quotas for industrial companies leading to a WTP of up to 30%.
Figure 10 shows that an economic uptake is possible if consequent climate protection measures are realized and research funds for the realization of new projects are strongly increased in the early development phase until 2025.
New P2F plants are installed to serve most of the implemented markets with renewable fuels. Figure 10 also indicates that, even though subsidization in the second decade of the model run is stopped, a rapid capacity growth is enabled by private investments, leading to a total capacity of 3.26 GW at 3000 full load hours and 4.4 GW at 6000 full load hours, respectively.
A large P2H2 capacity of 2 GW is supplemented by 1 GW of P2L capacity, indicating that especially transportation and petro-chemical industry sectors develop attractive conditions, whereas P2M remains at a relatively low capacity of only 260 MW. From this, it can be concluded that the substitution of methane for heating applications remains the most challenging market due to comparatively low natural gas prices. The high EU ETS certificate price has a lower impact on the natural gas price due to lower emissions from gas combustion in relation to liquid fuels. Table 3 sums up the development of investment and production costs. It is obvious that synthetic fuel will remain on price levels far above today’s energy prices, as production costs can hardly decrease below 13 ct kWh−1, depending on the product.

4.4. Discussion of Model Results in Comparison to External Studies

A comparison of the model results with findings of related studies reveals that even the capacity growth in the most optimistic scenario is too low to meet the demand suggested by Sterner et al., Agora Energiewende, or Henning and Palzer (see Figure 11). Sterner et al. created a scenario for 100% renewable energy in the electricity sector and also stated an electrolysis capacity of almost 50 GW already in 2025 and 134 GW in 2050 [56]. Agora Energiewende investigated a P2F demand of max. ~20 GW in 2035, increasing up to max. ~135 GW in 2050, depending on the target of GHG reduction and the level of integration in mobility and chemical industry sectors [12]. Henning and Palzer calculated with a total P2F capacity of nearly 200 GW in 2050 to reduce GHG emissions by 90% compared to 1990 [25].
However, the model was developed to find ways out of niche markets in Germany, and possible imports from other countries with lower energy production costs are not considered. Furthermore, once P2F products are economically competitive with fossil fuels, larger investments may most likely occur and may cause a steep rise in capacity development.

5. Conclusions

With a newly developed agent-based model, possible pathways for an economic uptake of the innovation were investigated. Based on today’s characteristics and dynamics of the German energy markets and scenarios for future developments, the growth of P2F capacity was investigated within a time period between 2016 and 2035.
The results reveal that consequent regulative adjustments in terms of climate protection and GHG emission reduction in all energy sectors are required for an economic uptake of P2F. Furthermore, high start-up subsidization accelerates capacity growth within the first simulation years and leads to faster price regression and technology improvement. The application of important framework conditions such as EEG fee exemptions, realistic prices for CO2 certificates, strong start-up subsidies, and drastic emission reduction quotas lead to significant changes in terms of capacity installation and development of product prices. While plant capacities do not exceed 0.042 GW at a base scenario, the above mentioned conditions lead to plant capacities of at least 3.25 GW in 2035. Product prices will decrease concurrently for this case, whereby production costs below 13 ct kWh−1 are hard to reach.
While many studies consider large capacities for the production of synthetic hydrogen, methane, and liquid fuels, a clear strategy on how to achieve a large-scale integration is lacking. Stakeholders indicate important aspects which should be considered by policy to allow an economically feasible operation of pilot plants. However, simulations in this study showed that not only single adjustments in the legal framework regarding P2F operation are required. Instead, many different impact factors, especially emission restrictions and the introduction of quotas for renewable fuels in all energy sectors, influence the possibility of an economic uptake.

Author Contributions

Conceptualization, C.S., K.K., T.S., P.T., I.N. and A.v.G.; Data curation, C.S.; Formal analysis, S.G.-R.; Funding acquisition, C.S., T.S., A.v.G. and S.G.-R.; Investigation, C.S., K.K., P.T., I.N., A.v.G. and S.G.-R.; Methodology, C.S., K.K., T.S., P.T., I.N., A.v.G. and S.G.-R.; Project administration, C.S., P.T. and A.v.G.; Software, K.K.; Supervision, I.N., A.v.G. and S.G.-R.; Validation, C.S., I.N. and S.G.-R.; Visualization, C.S. and K.K.; Writing—original draft, C.S. and K.K.; Writing—review & editing, T.S., P.T., I.N., A.v.G. and S.G.-R. All authors have read and agreed to the published version of the manuscript.

Funding

This research was funded the German Federal Ministry of Education and Research (BMBF) within the RESYSTRA project, funding code: 01UN1219A-B, and by the Federal State of Bremen and the European Union within the H2B project, funding code AUF0013A.

Acknowledgments

We are thankful to David Fuhrlaender and Timseabasi Thomas for their support on the manuscript and proofreading.

Conflicts of Interest

The authors declare no conflict of interest. The funders had no role in the design of the study; in the collection, analyses, or interpretation of data; in the writing of the manuscript, or in the decision to publish the results.

Appendix A

Table A1. Overview of crucial model parameters and interacting agents—quantitative values are related to the base year 2015. Capital categorization “small” (≤3 million euros), “medium” (≤15 million euros), and “large” (>15 million euros). Budget categories “very small” (≤2% of total demand of this customer group), “small” (≤6%), “medium” (≤15%) and “large” (>15%).
Operators
Operator GroupCustomer BaseTechsBudget/ScaleInvestment Criterion
Progressive Car ManufacturersMobilityAllMediumStrategic
Conservative Car ManufacturersMobilityAllLargeProfitable
Progressive IndustryIndustryAllMediumStrategic
Conservative IndustryIndustryAllLargeProfitable
Strategic P2F investorBroadAllMediumStrategic
Wind park operators (big)BroadAllMediumProfitable
Wind park operators (small)BroadP2H2/P2MSmallProfitable
Electricity providerBroadP2H2/P2MMediumProfitable
Refinery-hydrogen investmentsRefineriesP2HLargeStrategic
Refinery—liquid investmentsRefineriesP2LMediumStrategic
Progressive gas providerHouseholdsP2H2/P2MMediumStrategic
Conservative gas providerHouseholdsP2H2/P2MLargeProfitable
Customers
Customer GroupSubstituteProductPotential DemandIncentive
Green householdsHydrogen, methaneGasMediumWilling to pay
Green+ householdsHydrogen, methaneGasVery smallWilling to pay
Green car driversMethane, liquid fuelLiquid fuelSmallWilling to pay
Fuel cell mobilityHydrogenFossil hydrogenSmallWilling to pay
Green H2 industryHydrogenFossil hydrogenSmallWilling to pay
Green gas industryHydrogen, methaneGasSmallWilling to pay
Green liquid industryLiquid fuelMineral oilSmallWilling to pay
H2-oriented refineriesHydrogenBiofuelLargeQuota
Liquid-oriented refineriesLiquid fuelBiofuelLargeQuota
Gas-based car industryMethaneBiofuelMediumQuota
Liquid-based car industryLiquid fuelBiofuelMediumQuota
Subsidizer
Subsidizer GroupSubstituteSubsidy per Year
Power-to-hydrogen subsidizerHydrogen3 million euro
Power-to-methane subsidizerMethane3 million euro
Power-to-liquid subsidizerLiquid fuel2 million euro
Technology Classes
Technology ClassInitial Relative Investment CostInitial EfficiencyPre-Existing (Input) Capacity
Power-to-hydrogen1500 €/kW65%12 MW
Power-to-methane3000 €/kW55%8 MW
Power-to-liquid3500 €/kW50%1 MW
Environment
Environment Variable StatusInitial Value
Fixed operating costs in % of investment 4%
Individual relative fixed operating cost reduction per year of experience 2%
Maximum individual relative fixed operating cost reduction 20%
Tax per kWh related to legal status of P2F operatorsEnd Consumer:0.1306 €/kWh
Energy-Intensive Industry:0.0765 €/kWh
Storage:0.0665 €/kWh
Locally produced RE:0.0254 €/kWh
Legal status of P2F operators End Consumer
EU ETS certificate price 6.5 €/tonCO2eq
Average utilization of renewable energy plants 22%
Biofuels quota for refineries 6%
Electricity price 0.02 €/kWh

References

  1. Umweltbundesamt (UBA). Zeitreihen zur Entwicklung der Erneuerbaren Energien in Deutschland, Dessau-Roßlau. 2020. Available online: https://www.erneuerbare-energien.de/EE/Navigation/DE/Service/Erneuerbare_Energien_in_Zahlen/Zeitreihen/zeitreihen.html (accessed on 20 October 2020).
  2. Bundesministerium für Umwelt, Naturschutz und Nukleare Sicherheit (BMUB). Climate Action Plan 2050 Berlin. 2016. Available online: https://www.bmu.de/fileadmin/Daten_BMU/Pools/Broschueren/klimaschutzplan_2050_en_bf.pdf (accessed on 20 October 2020).
  3. Kreyenberg, D.; Lischke, A.; Bergk, F.; Duennebeil, F.; Heidt, C.; Knoerr, W.; Raksha, T.; Schmidt, P.; Weindorf, W.; Naumann, K. Erneuerbare Energien im Verkehr Potenziale und Entwicklungsperspektiven Verschiedener Erneuerbarer Energieträger und Energieverbrauch der Verkehrsträger. Berlin. 2015. Available online: https://www.bmvi.de/SharedDocs/DE/Anlage/G/MKS/mks-kurzstudie-ee-im-verkehr.pdf?__blob=publicationFile (accessed on 20 October 2020).
  4. Lütkehus, I.; Adlunger, K.; Salecker, H. Potenzial der Windenergie an Land: Studie zur Ermittlung des Bundesweiten Flächen-und Leistungspotenzials der Windenergienutzung an Land Umweltbundesamt: Dessau-Roßlau, Germany. 2013. Available online: https://www.umweltbundesamt.de/sites/default/files/medien/378/publikationen/potenzial_der_windenergie.pdf (accessed on 20 October 2020).
  5. Agentur für Erneuerbare Energien (AfEE). Metaanalyse. Potenziale der Bioenergie. 2014. Available online: https://www.unendlich-viel-energie.de/presse/pressemitteilungen/nutzungspfade-der-bioenergie-gibt-es-den-koenigsweg (accessed on 20 October 2020).
  6. Brosowski, A.; Thrän, D.; Mantau, U.; Mahro, B.; Erdmann, G.; Adler, P.; Stinner, W.; Reinhold, G.; Hering, T.; Blanke, C. A review of biomass potential and current utilisation—Status quo for 93 biogenic wastes and residues in Germany. Biomass Bioenerg. 2016, 95, 257–272. [Google Scholar] [CrossRef] [Green Version]
  7. Deutscher Bundestag Sachstand. Die Einführung von Quoten für Biokraftstoff und von E 10-Benzin in Deutschland; Wissenschaftliche Dienste: Munich, Germany, 2017. [Google Scholar]
  8. Bergk, F.; Knörr, W. Klimaschutz im Verkehr: Neuer Handlungsbedarf nach dem Pariser Klimaschutzabkommen—Teilbericht des Projekts “Klimaschutzbeitrag des Verkehrs 2050“ Dessau-Roßlau. 2017. Available online: https://www.umweltbundesamt.de/sites/default/files/medien/1410/publikationen/2017-07-18_texte_45-2017_paris-papier-verkehr_v2.pdf (accessed on 20 October 2020).
  9. Nitsch, J. Die Energiewende nach COP 21-Aktuelle Szenarien der Deutschen Energieversorgung. Stuttgart. 2016. Available online: https://www.bee-ev.de/fileadmin/Publikationen/Studien/Joachim_Nitsch_Energiewende_nach_COP21.pdf (accessed on 20 October 2020).
  10. Quaschning, V. Sektorkopplung durch die Energiewende- Anforderungen an den Ausbau Erneuerbarer Energien zum Erreichen der Pariser Klimaschutzziele unter Berücksichtigung der Sektorkopplung. Berlin. 2016. Available online: https://www.volker-quaschning.de/publis/studien/sektorkopplung/Sektorkopplungsstudie.pdf (accessed on 20 October 2020).
  11. Bundesnetzagentur (BNetzA). Quartalsbericht zu Netz- und Systemsicherheitsmaßnahmen. Zweites bis Drittes Quartal 2018. Bonn. 2019. Available online: https://www.bundesnetzagentur.de/SharedDocs/Mediathek/Berichte/2019/Quartalsbericht_Q2Q3_2018.pdf?__blob=publicationFile&v=2 (accessed on 20 October 2020).
  12. Agora Energiewende Stromspeicher in der Energiewende-Untersuchung zum Bedarf an neuen Stromspeichern in Deutschland für den Erzeugungsausgleich, Systemdienstleistungen und im Verteilnetz Berlin. 2014. Available online: https://www.agora-energiewende.de/fileadmin2/Projekte/2013/speicher-in-der-energiewende/Agora_Speicherstudie_Web.pdf (accessed on 20 October 2020).
  13. Benndorf, R.; Bernicke, M.; Bertram, A. Greenhouse Gas Neutral Germany in 2050. Dessau-Roßlau. 2014. Available online: https://www.umweltbundesamt.de/sites/default/files/medien/378/publikationen/07_2014_climate_change_en.pdf (accessed on 20 October 2020).
  14. Purr, K.; Osiek, D.; Lange, M.; Adlunger, K.; Burger, A.; Hain, B.; Kuhnhenn, K.; Klaus, T.; Lehmann, H.; Monch, L.; et al. Integration of Power to Gas/ Power to Liquids into the Ongoing Transformation Process. Dessau-Roßlau. 2016. Available online: https://www.umweltbundesamt.de/sites/default/files/medien/377/publikationen/uba_position_powertoliquid_engl.pdf (accessed on 20 October 2020).
  15. Breyer, C.; Tsupari, E.; Tikka, V.; Vainikka, P. Power-to-Gas as an Emerging Profitable Business Through Creating an Integrated Value Chain. Energ. Proced. 2015, 73, 182–189. [Google Scholar] [CrossRef] [Green Version]
  16. Graves, C.R.; Ebbesen, S.D.; Mogensen, M.B.; Lackner, K.S. Sustainable hydrocarbon fuels by recycling CO2 and H2O with renewable or nuclear energy. Renew. Sustain. Energ. Rev. 2011, 15, 1–23. [Google Scholar] [CrossRef]
  17. König, D.H.; Baucks, N.; Dietrich, R.-U.; Wörner, A. Simulation and evaluation of a process concept for the generation of synthetic fuel from CO2 and H2. Energy 2015, 91, 833–841. [Google Scholar] [CrossRef] [Green Version]
  18. Golling, C.; Heuke, R.; Seidl, H.; Uhlig, J. Roadmap Power to Gas—Baustein einer Integrierten Energiewende. Berlin. 2017. Available online: https://www.powertogas.info/fileadmin/dena/Dokumente/Pdf/9215_Broschuere_Baustein_einer_Integrierten_Energiewende_Roadmap_Power_to_Gas.pdf (accessed on 20 October 2020).
  19. Bünger, U.; Michalski, J.Z. Ermittlung des volkswirtschaftlichen sowie des klimarelevanten Nutzens mittels Power-to-Gas-Eine Expertise für Open Grid Europe GmbH und Amprion GmbH—Endbericht. Ottobrunn. 2018. Available online: http://www.lbst.de/news/2018_docs/Studie_Sektorenkopplung_Kurzfassung.pdf (accessed on 20 October 2020).
  20. Schenuit, C.; Heuke, R.; Paschke, J. Potenzialatlas Power to Gas. Klimaschutz Umsetzen, Erneuerbare Energien Integrieren, Regionale Wertschöpfung Ermöglichen. Berlin. 2016. Available online: https://www.dena.de/fileadmin/dena/Dokumente/Pdf/9144_Studie_Potenzialatlas_Power_to_Gas.pdf (accessed on 20 October 2020).
  21. Bundesministerium für Verkehr, Bau und Stadtentwicklung (BMVBS). Globale und Regionale Räumliche Verteilung von Biomassepotenzialen. 2010. Available online: https://www.bbsr.bund.de/BBSR/DE/veroeffentlichungen/ministerien/bmvbs/bmvbs-online/2010/DL_ON272010.pdf?__blob=publicationFile&v=1 (accessed on 20 October 2020).
  22. Nitsch, J.; Pregger, T.; Naegler, T.; Heide, D.; de Tena, D.L.; Trieb, F.; Scholz, Y.; Nienhaus, K.; Gerhardt, N.; Sterner, M.; et al. Langfristszenarien und Strategien für den Ausbau der Erneuerbaren Energien in Deutschland bei Berücksichtigung der Entwicklung in Europa und Global. 2012, p. 345. Available online: https://www.dlr.de/dlr/Portaldata/1/Resources/bilder/portal/portal_2012_1/leitstudie2011_bf.pdf (accessed on 20 October 2020).
  23. Benndorf, R.; Bemicke, M.; Bertram, A.; Butz, W.; Dettling, F.; Drotleff, J.; Zietlow, B. Treibhausgasneutrales Deutschland im Jahr 2050. 2013. Available online: https://www.umweltbundesamt.de/sites/default/files/medien/376/publikationen/treibhausgasneutrales_deutschland_im_jahr_2050_langfassung.pdf (accessed on 20 October 2020).
  24. Blanck, R.; Kasten, P.; Hacker, F.; Mottschall, M. Treibhausgasneutraler Verkehr 2050: Ein Szenario zur zunehmenden Elektrifizierung und dem Einsatz stromerzeugter Kraftstoffe im Verkehr; Öko-Institut e.V: Berlin, Germany, 2013. [Google Scholar]
  25. Henning, H.-M.; Palzer, A. Was kostet die Energiewende?-Wege zur Transformation des deutschen Energiesystems bis 2050—Präsentation. Freiburg. 2015. Available online: https://www.ise.fraunhofer.de/content/dam/ise/de/documents/publications/studies/Fraunhofer-ISE-Studie-Was-kostet-die-Energiewende.pdf (accessed on 20 October 2020).
  26. Jean, M.D.S.; Baurens, P.; Bouallou, C.; Couturier, K. Economic assessment of a power-to-substitute-natural-gas process including high-temperature steam electrolysis. Int. J. Hydrog. Energ. 2015, 40, 6487–6500. [Google Scholar] [CrossRef]
  27. Müller-Syring, G.; Henel, M.; Köppel, W.; Mlaker, H.; Sterner, M.; Höcher, T. Entwicklung von modularen Konzepten zur Erzeugung, Speicherung und Einspeisung von Wasserstoff und Methan ins Erdgasnetz. 2013. Available online: https://www.dvgw.de/medien/dvgw/forschung/berichte/g1_07_10.pdf (accessed on 20 October 2020).
  28. Dierkes, M.; Hoffmann, U.; Marz, L. Leitbild und Technik: Zur Entstehung und Steuerung Technischer Innovationen; Ed. Sigma: Berlin, Germany, 1992. [Google Scholar]
  29. Lehr, U.; Lobbe, K. Umweltinnovationen-Anreize und Hemmnisse. Ökolog. Wirtschaf. Fachzeit. 1999, 14, 14. [Google Scholar] [CrossRef] [Green Version]
  30. Fichter, K.; von Gleich, A.; Pfriem, R.; Siebenhüner, B. Theoretische Grundlagen für Klimaanpassungsstrategien. nordwest2050-Berichte. Nord. Ber. 2010, 2191–3218. [Google Scholar]
  31. Hemmelskamp, J. Umweltpolitik und Technischer Fortschritt: Eine Theoretische und Empirische Untersuchung der Determinanten von Umweltinnovationen; Springer-Verlag: Heidelberg, Germany, 2013; ISBN 978-3-662-13259-3. [Google Scholar]
  32. Ahrens, A.; Gleich, A. v Leitbilder in der Chemikalienentwicklung und Stoffpolitik (Bericht vom SubChem-Workshop). Hamburg. 2002. Available online: http://www.tecdesign.uni-bremen.de/subchem/pdf/Leitbild_Bericht_final_0803.pdf (accessed on 20 October 2020).
  33. Fichter, K. Einflussfaktoren: Das Gefüllte Schildkrötenmodell als Basiskonzept. 2006. Available online: https://www.yumpu.com/de/document/view/24208492/einflussfaktoren-das-gefa-1-4-llte-schildkratenmodell-als-borderstep (accessed on 20 October 2020).
  34. Stührmann, S.; von Gleich, A.; Brand, U.; Gößling-Reisemann, S. Mit dem Leitkonzept Resilienz auf dem Weg zu resilienteren Energieinfrastrukturen. Syst. Auf Innov. Tech. Tech. Berl. Ed. Sigma 2012, 181–192. [Google Scholar]
  35. Brand, U. Abschlussbericht zum Umsetzungsbaustein 1: “Schaffung von Gemeinsamer Identität und Verantwortung der Bewohner durch Energie-und Kosteneffiziente Sanierungs-und Entwicklungsplanung”—Teilprojekt: Analyse und Prozessbegleitende Untersuchung der Richtungsgebenden Einflussfaktoren; BMBF-Projekt ZukunftsWerkStadt Leutkirch, 2013. [Google Scholar]
  36. Wachsmuth, J.; Petschow, U.; Brand, U.; Fettke, U.; Pissarskoi, E.; Fuchs, G.; Dickel, S.; Kljajic, M. Richtungsgebende Einflussfaktoren im Spannungsfeld von Zentralen vs. de-zentralen Orientierungen bei der Energiewende und Ansatzpunkte für ein Leitkonzept Resilienz. 2015. Available online: http://www.resystra.de/files/publikationen/richtungsgebende-einflussfaktoren.master.pdf (accessed on 20 October 2020).
  37. Brand, U. Leitkonzepte Nachhaltigkeit und Resilienz als Richtungsgeber in Transformationsprozessen von Energiesystemen, Universität Bremen. 2016. Available online: http://www.resystra.de/files/publikationen/dissertation-von-urte-brand.master.pdf (accessed on 20 October 2020).
  38. Bundesministerium für Wirtschaft und Energie (BMWi). Hintergrundinformationen zur Besonderen Ausgleichsregelung- Antragsverfahren 2017 für Begrenzung der EEG-Umlage 2018. Berlin. 2018. Available online: https://www.bmwi.de/Redaktion/DE/Publikationen/Energie/hintergrundinformationen-zur-besonderen-ausgleichsregelung-antragsverfahren.pdf?__blob=publicationFile&v=24 (accessed on 20 October 2020).
  39. Van Dam, K.H.; Nikolic, I.; Lukszo, Z. Agent-Based Modelling of Socio-Technical Systems; Springer: Dordrecht, The Netherlands, 2013; ISBN 978-94-007-4932-0. [Google Scholar]
  40. Boudon, R. Beyond Rational Choice Theory. Annu. Rev. Sociol. 2003, 29, 1–21. [Google Scholar] [CrossRef]
  41. Bundesministerium für Wirtschaft und Energie (BMWi). Zahlen und Fakten Energiedaten-National und international Entwicklungen. 2015. Available online: https://www.foerderdatenbank.de/FDB/Content/DE/Download/Publikation/Energie/erneuerbare-energien-in-zahlen-2018.pdf?__blob=publicationFile&v=2 (accessed on 20 October 2020).
  42. Deutscher Wasserstoff- und Brennstoffzellenverband (DWV). Wasserstoffproduktion in Deutschland. 2015. Available online: https://www.dwv-info.de/wp-content/uploads/2015/06/20181128-Pos.-Papier-zu-Strukturwandel-final.pdf (accessed on 20 October 2020).
  43. Mineralölwirtschaftsverband (MWV). Jahresbericht 2015—Mineralöl-Zahlen 2014. 2015. Available online: https://www.mwv.de/wp-content/uploads/2016/06/mwv-publikationen-jahresberichte-mineraloelzahlen-2014-jahresbericht-2015.pdf (accessed on 20 October 2020).
  44. Union zur Förderung von Öl- und Proteinpflanzen e.V. (UFOP). Marktinformationen Ölsaaten und Biokraftstoffe. Berlin. 2015. Available online: https://www.ufop.de/files/9715/8107/4394/RZ_MI_0220.pdf (accessed on 20 October 2020).
  45. Bundesnetzagentur (BNetzA). Monitoringbericht 2015. Bonn. 2016. Available online: https://www.bundesnetzagentur.de/SharedDocs/Downloads/DE/Allgemeines/Bundesnetzagentur/Publikationen/Berichte/2015/Monitoringbericht_2015_BA.pdf?__blob=publicationFile (accessed on 20 October 2020).
  46. Brand, U.; Giese, B.; von Gleich, A.; Heinbach, K.; Ulrich, P.; Schnülle, C.; Stührmann, S.; Stührmann, T.; Thier, P.; Wachsmuth, J.; et al. Resiliente Gestaltung des Energiesystems am Beispiel der Transformationsoptionen “EE-Methan-System” und “Regionale Selbstversorgung”: Schlussbericht des vom BMBF geförderten Projektes RESYSTRA. 2017. Available online: http://www.resystra.de/files/publikationen/resystra-schlussbericht.master.pdf (accessed on 20 October 2020). [CrossRef]
  47. Ausfelder, F.; Beilmann, C.; Bertau, M.; Bräuninger, S.; Heinzel, A.; Hoer, R.; Koch, W.; Mahlendorf, F.; Metzelthin, A.; Peuckert, M.; et al. Energiespeicherung als Element einer sicheren Energieversorgung. Chem. Ing. Tech. 2015, 87, 17–89. [Google Scholar] [CrossRef]
  48. Fasihi, M.; Bogdanov, D.; Breyer, C. Techno-Economic Assessment of Power-to-Liquids (PtL) Fuels Production and Global Trading Based on Hybrid PV-Wind Power Plants. Energ. Proced. 2016, 99, 243–268. [Google Scholar] [CrossRef] [Green Version]
  49. Haarlemmer, G.; Boissonnet, G.; Peduzzi, E.; Setier, P.-A. Investment and production costs of synthetic fuels–A literature survey. Energy 2014, 66, 667–676. [Google Scholar] [CrossRef]
  50. Schiebahn, S.; Grube, T.; Robinius, M.; Tietze, V.; Kumar, B.; Stolten, D. Power to gas: Technological overview, systems analysis and economic assessment for a case study in Germany. Int. J. Hydro. Energ. 2015, 40, 4285–4294. [Google Scholar] [CrossRef]
  51. Schmidt, P.; Zittel, W.; Weindorf, W.; Rakasha, T.; Goericke, D. Renewables in transport 2050—Empowering a sustainable mobility future with zero emission fuels. In 16. Internationales Stuttgarter Symposium; Springer Science and Business Media LLC: Berlin, Germany, 2016; pp. 185–199. [Google Scholar]
  52. Stolten, D.; Emonts, B. Hydrogen Science and Engineering: Materials, Processes, Systems and Technology; Wiley-VCH Verlag GmbH & Co KGaA: Wheinheim, Germany, 2016; ISBN 978-3-527-33238-0. [Google Scholar]
  53. Tremel, A.; Wasserscheid, P.; Baldauf, M.; Hammer, T. Techno-economic analysis for the synthesis of liquid and gaseous fuels based on hydrogen production via electrolysis. Int. J. Hydro. Energ. 2015, 40, 11457–11464. [Google Scholar] [CrossRef]
  54. Ullrich, S. Übertragungsnetze. In Energietechnologien der Zukunft; Wietschel, M., Ullrich, S., Eds.; Lehrbuch; Springer Vieweg: Wiesbaden, Germany, 2015; pp. 267–322. ISBN 978-3-658-07128-8. [Google Scholar]
  55. Vanhoudt, W.; Barth, F.; Lanoix, J.; Neave, J.; Schmidt, P.; Weindorf, W.; Raksha, T.; Zerhusen, J.; Michalski, J. Power-to-Gas; Short Term and Long Term Opportunities to Leverage Synergies between the Electricity and Transport Sectors through Power-to-Hydrogen; Hinicio and LBST·Ludwig-Bölkow-Systemtechnik GmbH: Brussels, Belgium, 2016. [Google Scholar]
  56. Sterner, M.; Thema, M.; Eckert, F.; Lenck, T.; Götz, P. Bedeutung und Notwendigkeit von Windgas für die Energiewende in Deutschland, Forschungsstelle Energienetze und Energiespeicher (FENES) OTH Regensburg, Energy Brainpool, Studie im Auftrag von Greenpeace Energy, Regensburg, Hamburg, Berlin. 2015. Available online: https://www.greenpeace-energy.de/fileadmin/docs/pressematerial/Windgas-Studie_2015_FENES_GPE_lang.pdf (accessed on 20 October 2020).
  57. Albrecht, U.; Altmann, M.; Michalski, J.; Raksha, T.; Weindorf, W. Analyse der Kosten Erneuerbarer Gase; Bochum, Germany, 2013; ISBN 9783920328652. Available online: http://www.lbst.de/download/2014/20131217_BEE-PST_LBST_Studie_EEGase.pdf (accessed on 20 October 2020).
  58. Gregory, K.; Mislick, D.A. Nussbaum Cost Estimation—Methods and Tools; John Wiley & Sons: Hoboken, NJ, USA, 2015; ISBN 978-1-118-53613-1. [Google Scholar]
  59. Graf, F.; Götz, M.; Henel, M.; Schaaf, T.; Tichler, R. Technoökonomische Studie von Power-to-Gas-Konzepten Teilprojekte B-D Abschlussbericht. Bonn. 2014. Available online: https://www.dvgw.de/medien/dvgw/forschung/berichte/g3_01_12_tp_b_d.pdf (accessed on 20 October 2020).
  60. Bundesministerium für Wirtschaft und Energie (BMWi). Zahlen und Fakten Energiedaten—Nationale und Internationale Entwicklung. 2018. Available online: https://www.bmwi.de/Redaktion/DE/Publikationen/Energie/energieeffizienz-in-zahlen-2018.pdf%3F__blob%3DpublicationFile%26v%3D8 (accessed on 20 October 2020).
  61. Sargl, M.; Wolfsteiner, A.; Wittmann, G. Neue Weltklimaordnung: Emissionshandel zwischen Staaten mit schrittweiser Klimagerechtigkeit. Wirtschaftsdienst 2011, 91, 704–711. [Google Scholar] [CrossRef] [Green Version]
  62. Wronski, R.; Küchler, S.; Lückgr, H.; Schlegelmilch, K.; Duchene, K. Umsetzung eines CO2-Mindestpreises in Deutschland-Internationale Vorbilder und Möglichkeiten für die Ergänzung des Emissionshandels; Forum Ökologisch-Soziale Marktwirtschaft e.V. Berlin. 2014. Available online: https://foes.de/pdf/2014-10-FOES-CO2-Mindestpreis.pdf (accessed on 20 October 2020).
  63. Edenhofer, O.; Schmidt, C.M. Eckpunkte einer CO2-Preisreform: Gemeinsamer Vorschlag von Ottmar Edenhofer (PIK/MCC) und Christoph M. Schmidt (RWI); RePEc: 2018; Available online: http://www.rwi-essen.de/media/content/pages/publikationen/rwi-positionen/pos_072_eckpunkte_einer_co2-preisreform.pdf (accessed on 20 October 2020).
  64. De Clara, S.; Mayr, K. The EU ETS phase IV Reform: Implications for System Functioning and for the Carbon Price Signal. 2018. Available online: https://www.oxfordenergy.org/wpcms/wp-content/uploads/2018/09/The-EU-ETS-phase-IV-reform-implications-for-system-functioning-and-for-the-carbon-price-signal-Insight-38.pdf (accessed on 20 October 2020).
  65. European Energy Exchange (EEX) European Emission Allowances (EUA). Available online: https://www.eex.com/en/market-data/environmental-markets/spot-market/european-emission-allowances (accessed on 1 April 2020).
  66. International Energy Agency (IEA). Germany 2020–Country Report. 2020. Available online: https://www.iea.org/reports/germany-2020 (accessed on 20 October 2020).
  67. Bundesverband der Deutschen Bioethanolwirtschaft e.V. (BdBe). Presseinformation. Super E10: Akzeptanz und Wahrnehmung—Umfrageergebnis 2012. 2012. Available online: https://www.presseportal.de/pm/73390/2272715 (accessed on 20 October 2020).
  68. ADAC, e.V. ADAC Position zur Festlegung neuer Pkw CO 2-Grenzwerte post 2020. 2017. Available online: https://www.bundestag.de/resource/blob/561114/595b2167a4da0db5e89ec0946ba54af3/19-16-68-D_Anhoerung_CO2-Emissionen_ADAC-data.pdf (accessed on 20 October 2020).
  69. Bundesministerium für Umwelt, Naturschutz und Nukleare Sicherheit (BMU). Die EU-Verordnung zur Verminderung der CO2—Emissionen von Personenkraftwagen. 2009. Available online: https://www.bmu.de/fileadmin/bmu-import/files/pdfs/allgemein/application/pdf/eu_verordnung_co2_emissionen_pkw.pdf (accessed on 20 October 2020).
  70. European Parliament and the Council of the European Union Regulation (EU) No 333/2014 of the European Parliament and of the Council of 11 March 2014 Amending Regulation (EC) No 443/2009 to Define the Modalities for Reaching the 2020 Target to Reduce CO2 Emissions from New Passenger Cars. 2014. Available online: https://op.europa.eu/en/publication-detail/-/publication/5b971540-bc8f-11e3-86f9-01aa75ed71a1/language-en (accessed on 20 October 2020).
  71. Ploetner, K.O.; Rothfeld, R.; Urban, M.; Hornung, M.; Tay, G.; Oguntona, O. Technological and Operational Scenarios on Aircraft Fleet-Level towards ATAG and IATA 2050 Emission Targets. In Proceedings of the 17th AIAA Aviation Technology Integration, and Operations Conference, Denver, CO, USA, 5–9 June 2017; pp. 1–13. [Google Scholar]
  72. Naumann, K.; Oehmichen, K.; Zeymer, M.; Meisel, K.; Anfahrt, I.; Trainer, P. Monitoring Biokraftstoffsektor; DBFZ Deutsches Biomasseforschungszentrum: Leipzig, Germany, 2019; Available online: https://www.dbfz.de/fileadmin/user_upload/Referenzen/DBFZ_Reports/DBFZ_Report_11_4.pdf (accessed on 20 October 2020).
  73. International Air transport Association (IATA). IATA Sustainable Aviation Fuel Roadmap; Montreal—Geneva. 2015. Available online: https://www.iata.org/contentassets/d13875e9ed784f75bac90f000760e998/safr-1-2015.pdf (accessed on 20 October 2020).
  74. Fachagentur Nachwachsende Rohstoffe e.V. (FNR). FNR—Biokraftstoffe: Rahmenbedingungen. Available online: https://biokraftstoffe.fnr.de/kraftstoffe/rahmenbedingungen/ (accessed on 1 April 2020).
  75. Kolb, T.; Umesterung von Rapsöl zu Rapsmethylester (RME). Karlsruher Institut für Technologie (KIT), Engler-Bunte-Institut, Bereich I; Chemische Energieträger-Brennstofftechnologie (CEB). 2014. Available online: https://ceb.ebi.kit.edu/download/V1_RME_Synthese.pdf (accessed on 20 October 2020).
  76. Zah, R.; Gauch, M. Ökobilanz von Energieprodukten: Biotreibstoffen Schlussbericht Bern. 2007. Available online: https://www.academia.edu/22605305/Ökobilanz_von_Energieprodukten_Ökologische_Bewertung_von_Biotreibstoffen (accessed on 20 October 2020).
  77. ENCON. Potentialatlas für Wasserstoff—Analyse des Marktpotentials für Wasserstoff, der mit Erneuerbaren Strom Hergestellt Wird, im Raffineriesektor und im Zukünftigen Mobilitätssektor. 2018. Available online: https://www.innovationsforum-energiewende.de/fileadmin/user_upload/Potentialstudie-fuer-gruenen-Wasserstoff-in-Raffinerien.pdf (accessed on 20 October 2020).
  78. Grimm, N.; Holmeier, S.; Uhlig, J.; Weber, A.; Zoch, I. Power-to-Gas-Eine innovative Systemlösung auf dem Weg zur Marktreife. 2013. Available online: https://www.dena.de/fileadmin/dena/Dokumente/Pdf/9096_Fachbroschuere_Systemloesung_Power_to_Gas.pdf (accessed on 20 October 2020).
  79. Wilms, S.V.L.; Schäfer-Stradowsky, S.J.S.; Jahnke, P.G.T. Heutige Einsatzgebiete für Power Fuels—Factsheets zur Anwendung von Klimafreundlich Erzeugten Synthetischen Energieträgern. Berlin. 2018. Available online: https://www.dena.de/fileadmin/dena/Publikationen/PDFs/2019/181123_dena_PtX-Factsheets.pdf (accessed on 20 October 2020).
  80. Übertragungsnetzbetreiber (ÜNB). Prognose der EEG-Umlage 2019 nach EEV. 2018. Available online: https://www.netztransparenz.de/portals/1/Content/EEG-Umlage/EEG-Umlage%202019/20181015_Veröffentlichung%20EEG-Umlage%202019.pdf (accessed on 20 October 2020).
  81. Deutsche Energie-Agentur. Power to Gas: Chancen, Herausforderungen und Stellschrauben auf dem Weg zur Marktreife. 2015. Available online: https://www.dena.de/newsroom/publikationsdetailansicht/pub/fachbroschuere-systemloesung-power-to-gas/ (accessed on 20 October 2020).
  82. International Council on Clean Transportation (ICCT). Final Recast Renewable Energy Directive for 2021–2030 in the European Union. Brussels, Beijing, Berlin, San Francisco, Washington. 2018. Available online: https://theicct.org/publications/final-recast-renewable-energy-directive-2021-2030-european-union (accessed on 20 October 2020).
  83. Harks, E. Power-to-Gas-to-Refining (to Tank). Stromspeicher und Brücke zum Verkehr. 2015. Available online: https://www.innovationsforum-energiewende.de/fileadmin/user_upload/2015-10-IfE-P2G2R-BP-Harks-v4.pdf (accessed on 20 October 2020).
Figure 1. Turtle model—an internal network basically consists of key stakeholders and is accompanied by several external impact factors [31,32,33,34,35,36,37].
Energies 13 05522 g001
Figure 2. Turtle model for power-to-fuel (P2F)—the turtle model filled with qualitative information on the P2F innovation system gathered from stakeholders, literature review, and policy analysis. Source: authors own compilation.
Energies 13 05522 g002
Figure 3. Scheme of the agent-based model’s (ABM) conceptualization based on the conversion of the turtle model and van Dam et al. Green arrows indicate direct agent interactions, orange arrows indicate interactions within the system environment (between impact factors). Source: authors own compilation.
Energies 13 05522 g003
Figure 4. Overview of the model structure and agent types: (a) Entity Relation Diagram; (b) depiction of the agent types. All agent types consist of specified groups representing individuals with identical characteristics; (c) Overview of operator and customer groups and depiction of their major properties. Source: authors own compilation.
Energies 13 05522 g004aEnergies 13 05522 g004b
Figure 5. Simulation results of the model calibration and the base scenario (cumulated depiction)—to calibrate the model, the P2F expansion from 2011 to 2016 was successfully simulated. At constant conditions, further capacity growth was simulated until 2029. Source: authors own compilation.
Energies 13 05522 g005
Figure 6. Comparison of capacity development at specific utilization rates and increasing market prices for natural gas and mineral oil.
Energies 13 05522 g006
Figure 7. Simulation results with EEG-Fee exemption: (a) Capacity development with reduced surcharges of 6.65 ct kWh1 (without EEG fee compensation; (b) the impact on the ratio of private investments and subsidies. Source: authors own compilation.
Energies 13 05522 g007
Figure 8. Simulation results with implemented biofuel recognition: (a) Capacity development with synthetic fuels being accepted for greenhouse gas (GHG) reduction quota fulfillment; (b) P2H2 plants achieve the largest market share with >702 MW in 2035 compared to low capacities for the production of methane and liquids. Source: authors own compilation.
Energies 13 05522 g008
Figure 9. Results assuming a willingness to pay for a premium of plus 15% by 10% and of 25% by 5% of the households for synthetic fuels. Source: authors own compilation.
Energies 13 05522 g009
Figure 10. Economic uptake of the P2F technology enabled by strong regulative signals: a high certificate price (100 € per ton CO₂ from 2021), strong subsidization in the early development phase (60 million € per a until 2025 for new projects), and strong emission reduction quotas.
Energies 13 05522 g010
Figure 11. Comparison of capacity estimates in three different external scenarios for an ambitious energy system transformation [12,25,56].
Energies 13 05522 g011
Table 1. Demand volume in subdivided markets and assigned market prices in 2015 for Germany based on [40,41,42,43,44].
Energy Carrier in MarketsDemand in TWh a−1Energy Carrier in MarketsPrice in € kWh−1
Natural Gas Natural Gas
Private households289Private households0.072
Industry225Industry0.036
Transport2.47
Mineral Oil0.073
Hydrogen
Industry60Biofuels
Traffic0.025
(Own assumptions based on registered fuel cell vehicles in Germany. Assumed fuel consumption: 1 kgH2 per 100 km. At 15,000 km a−1 the total consumption equals 25 GWh a−1.)
Gas0.08
Diesel0.078
Mineral Oil Petrol0.07
Industry36
Transport681Hydrogen
Households157Industry0.06
(Own calculation of production costs for H2 via steam methane reformation at a gas price of 3 ct kWh−1.)
Transport0.28
(Price information of Clean Energy Partnership (CEP).)
Table 2. Development of investment and production costs for the different output products in the reference scenario.
20152029
Investment Costs [€ kW−1]Production Costs [ct kWh−1]Investment Costs [€ kW−1]Production Costs [ct kWh−1]
P2H2150025.7129223.6
P2M300034.0263030.4
P2L350038.7350038.7
P2H2: power-to-hydrogen; P2M: power-to-methane; P2L: power-to-liquid fuels.
Table 3. Investment and production cost development of P2H2, P2M, and P2L in the model environment with strong legal regulation conditions.
20152029
Investment Costs [€ kW−1]Production Costs [ct kWh−1]Investment Costs [€ kW−1]Production Costs [ct kWh−1]
P2H2150025.752012.8
P2M300034.0100015.4
P2L350038.7100015.4
Publisher’s Note: MDPI stays neutral with regard to jurisdictional claims in published maps and institutional affiliations.

