Article

Research on Economic Evaluation Methods of Offshore Oil Multi-Platform Interconnected Power System Considering Petroleum Production Characteristics

State Key Laboratory of Power System, Department of Electrical Engineering, Tsinghua University, Beijing 100080, China
*
Author to whom correspondence should be addressed.
Energies 2020, 13(20), 5521; https://doi.org/10.3390/en13205521
Submission received: 8 September 2020 / Revised: 14 October 2020 / Accepted: 19 October 2020 / Published: 21 October 2020
(This article belongs to the Section F: Electrical Engineering)

Abstract

:
Offshore oil multi-platform interconnected power system is developing rapidly. The proposal of an effective economic evaluation method that fits the actual production situation of offshore oilfields is very meaningful for the planning and construction of multi-platform interconnected power systems. This article proposes the electric depreciation, depletion, and amortization (DD&A) barrel oil cost S and maximum expected benefit per unit power generation Ie as economic indicators, considering the actual production characteristics and life cycle of the oil field. In order to build a complete economic evaluation system, this article also introduces the N−1 pass rate η N 1 , voltage qualification rate γ, power supply reliability ASAI (Average Service Availability Index), and other reliability indicators to evaluate the offshore power system. When calculating the weight of the indicators, analytic hierarchy method (AHP) was applied to calculate subjective weights, and an entropy method was applied to calculate objective weights. To unify the two weights, the ideal point method is proposed to obtain compound weights. Finally, this article selects an offshore oil field in Bohai Bay, China as example, and analyses short-term small-scale, long-term large-scale, and actual power system as calculation examples in different planning periods. The analysis result verifies the effectiveness of the economic evaluation method.

1. Introduction

The offshore oil and gas field multi-platform interconnected power system is a main and common power system built on the sea. Its power generation energy mainly comes from oil and natural gas extracted by the offshore oil and gas field platform. The offshore multi-platform interconnected power system has small capacity and small spare capacity, poor power supply reliability, high maintenance costs, and difficulty in starting large-scale equipment. If existing power station resources can be integrated, the power system can be planned uniformly; it can also improve system reliability, reduce system reserve capacity, and promote the economic and effective development of oil and gas fields [1,2,3]. Therefore, it is necessary to propose a multi-platform interconnected power system economic evaluation method that fits the actual production conditions of offshore oil fields. The planning and construction are very meaningful.
In terms of the selection of indicators, the economic evaluation of the offshore multi-platform interconnected power system is currently less developed. As for the economic evaluation system for the distribution network on land, the State Grid Corporation of China has proposed a complete indicator system, which is called the SEC system. S is an indicator to measure safety, E is an indicator to measure efficiency, and C is an indicator to calculate the whole life cycle cost. China Southern Power Grid has divided the evaluation indicators for the power system into multiple levels, of which there are five major levels, which represent safety, economy, flexibility, greenness, and society [4]. The offshore oil and gas field platform power system has experienced decades of development. During this period, the economy is also developing at a high speed, and economic development has also brought a huge increase in oil and gas extraction. If the economic evaluation system is copied from the land economic evaluation system, there are already some shortcomings under the current management model. The use of equipment is low in efficiency and the operating performance is poor, which has brought a significant lag to offshore oilfields that take economic benefits as the evaluation indicator [5,6].
In the determination of indicator weights, the current methods for determining index weights mainly include principal component analysis [7], analytic hierarchy process [8,9], entropy weight method [10], and Delphi method [11]. These methods all rely on expert judgments, but they deal with the evaluation information provided by experts differently. In the case of incomplete information, excessive reliance on expert judgment and insufficient use of objective information lead to strong subjectivity and contingency. The literature [12] proposed a comprehensive evaluation method for urban power grid planning based on the interval analytic hierarchy process, improved the consistency check method and weight solution method of the interval judgment matrix, and improved the uncertainty of decision-making and the subjectivity of expert judgment. The ambiguity has been handled well, but there is still the problem of relying on expert evaluation. In the literature [13], analytic hierarchy method (AHP) and Delphi were used in the evaluation of current power grids, which improved the weight accuracy of indicators at the same level, but the indicator weights obtained by the combination of the two methods are still the embodiment of expert opinions, which are not sufficient to use objective data.
The research in this article hopes to fit the actual production situation of offshore oilfields and build a complete economic evaluation system that can better reflect the rationality of the planning and construction of offshore multi-platform interconnected power systems. The example of Bohai Oilfield shows the effectiveness of the method.

2. Materials and Methods

2.1. Establishment of Economic Evaluation System

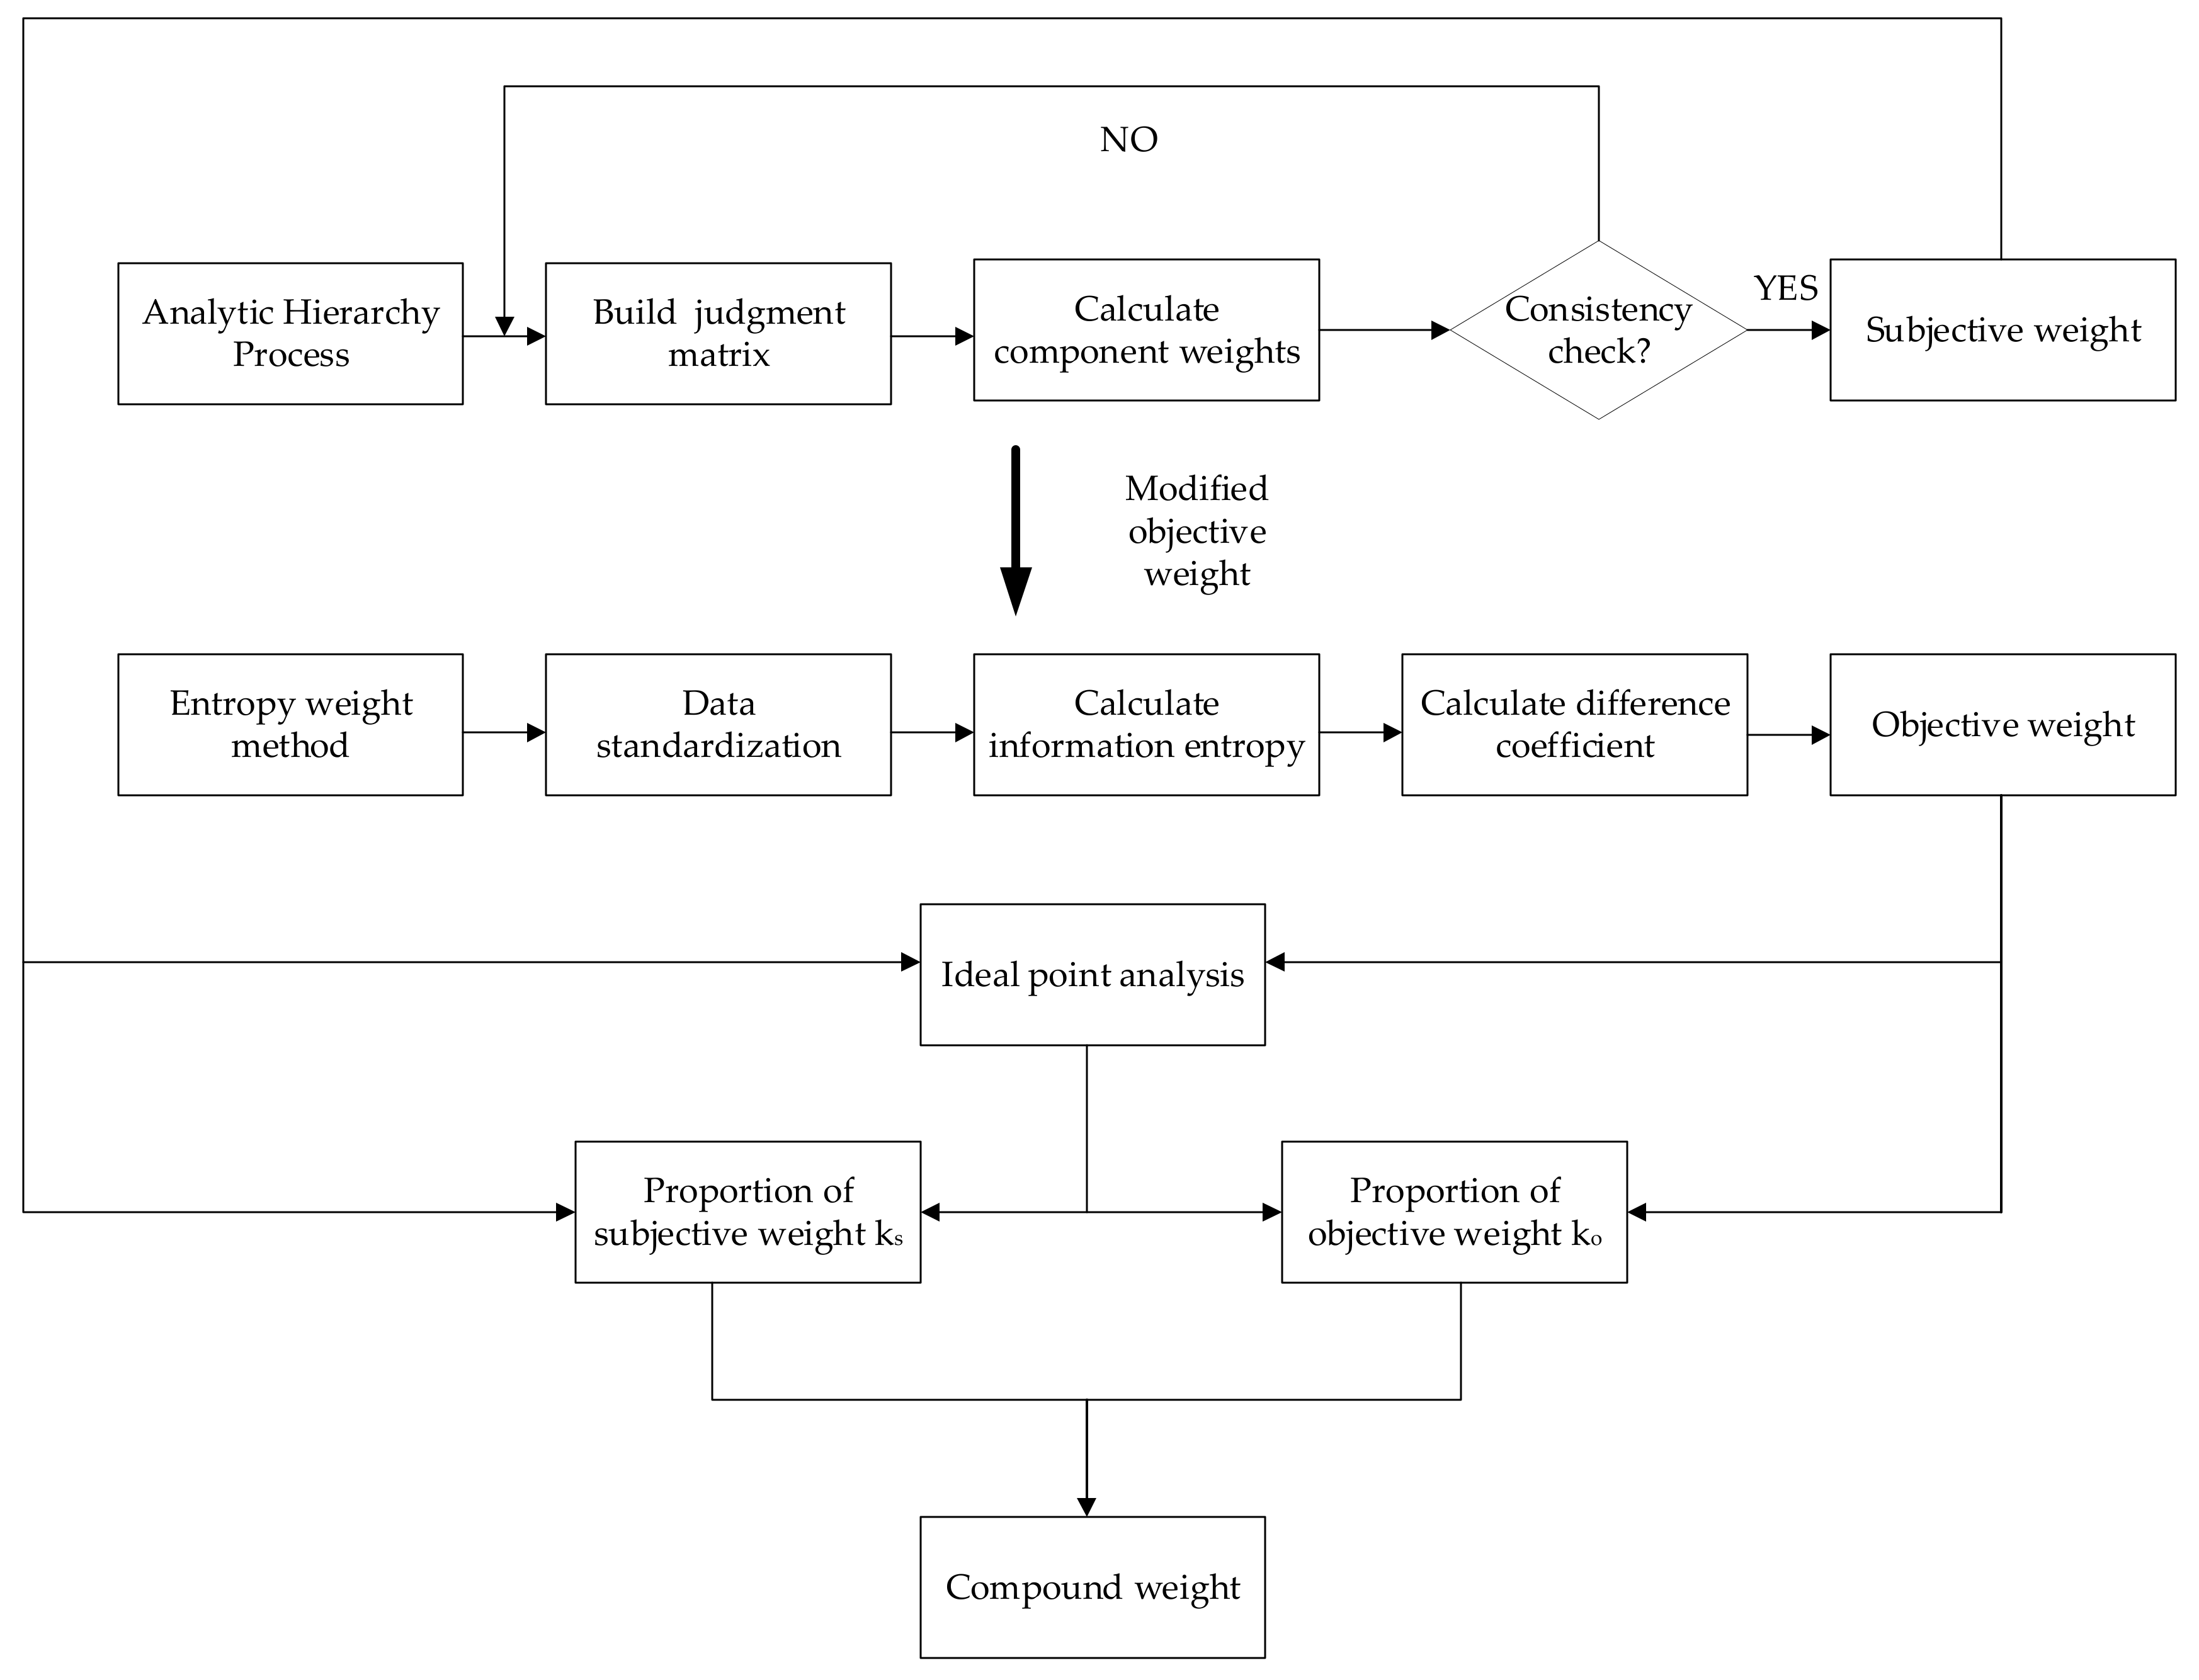
The economic evaluation system is divided into two levels: reliability and economy. The planning and evaluation decision of the power generation and transmission system is essentially the game of reliability and economy. At present, reliability decisions in the expansion planning of power generation and transmission systems often use a single user power outage loss value to turn the reliability indicator of the power generation and transmission system into an economic indicator, as the optimization goal of the power generation and transmission system planning [14]. In the economic evaluation system of the offshore oil platform power system, this article considers including more energy economic indicators and reliability indicators that fit the offshore multi-platform interconnected power system to make a comprehensive economic evaluation of the production planning of offshore oil platforms.

2.1.1. Economic Indicators

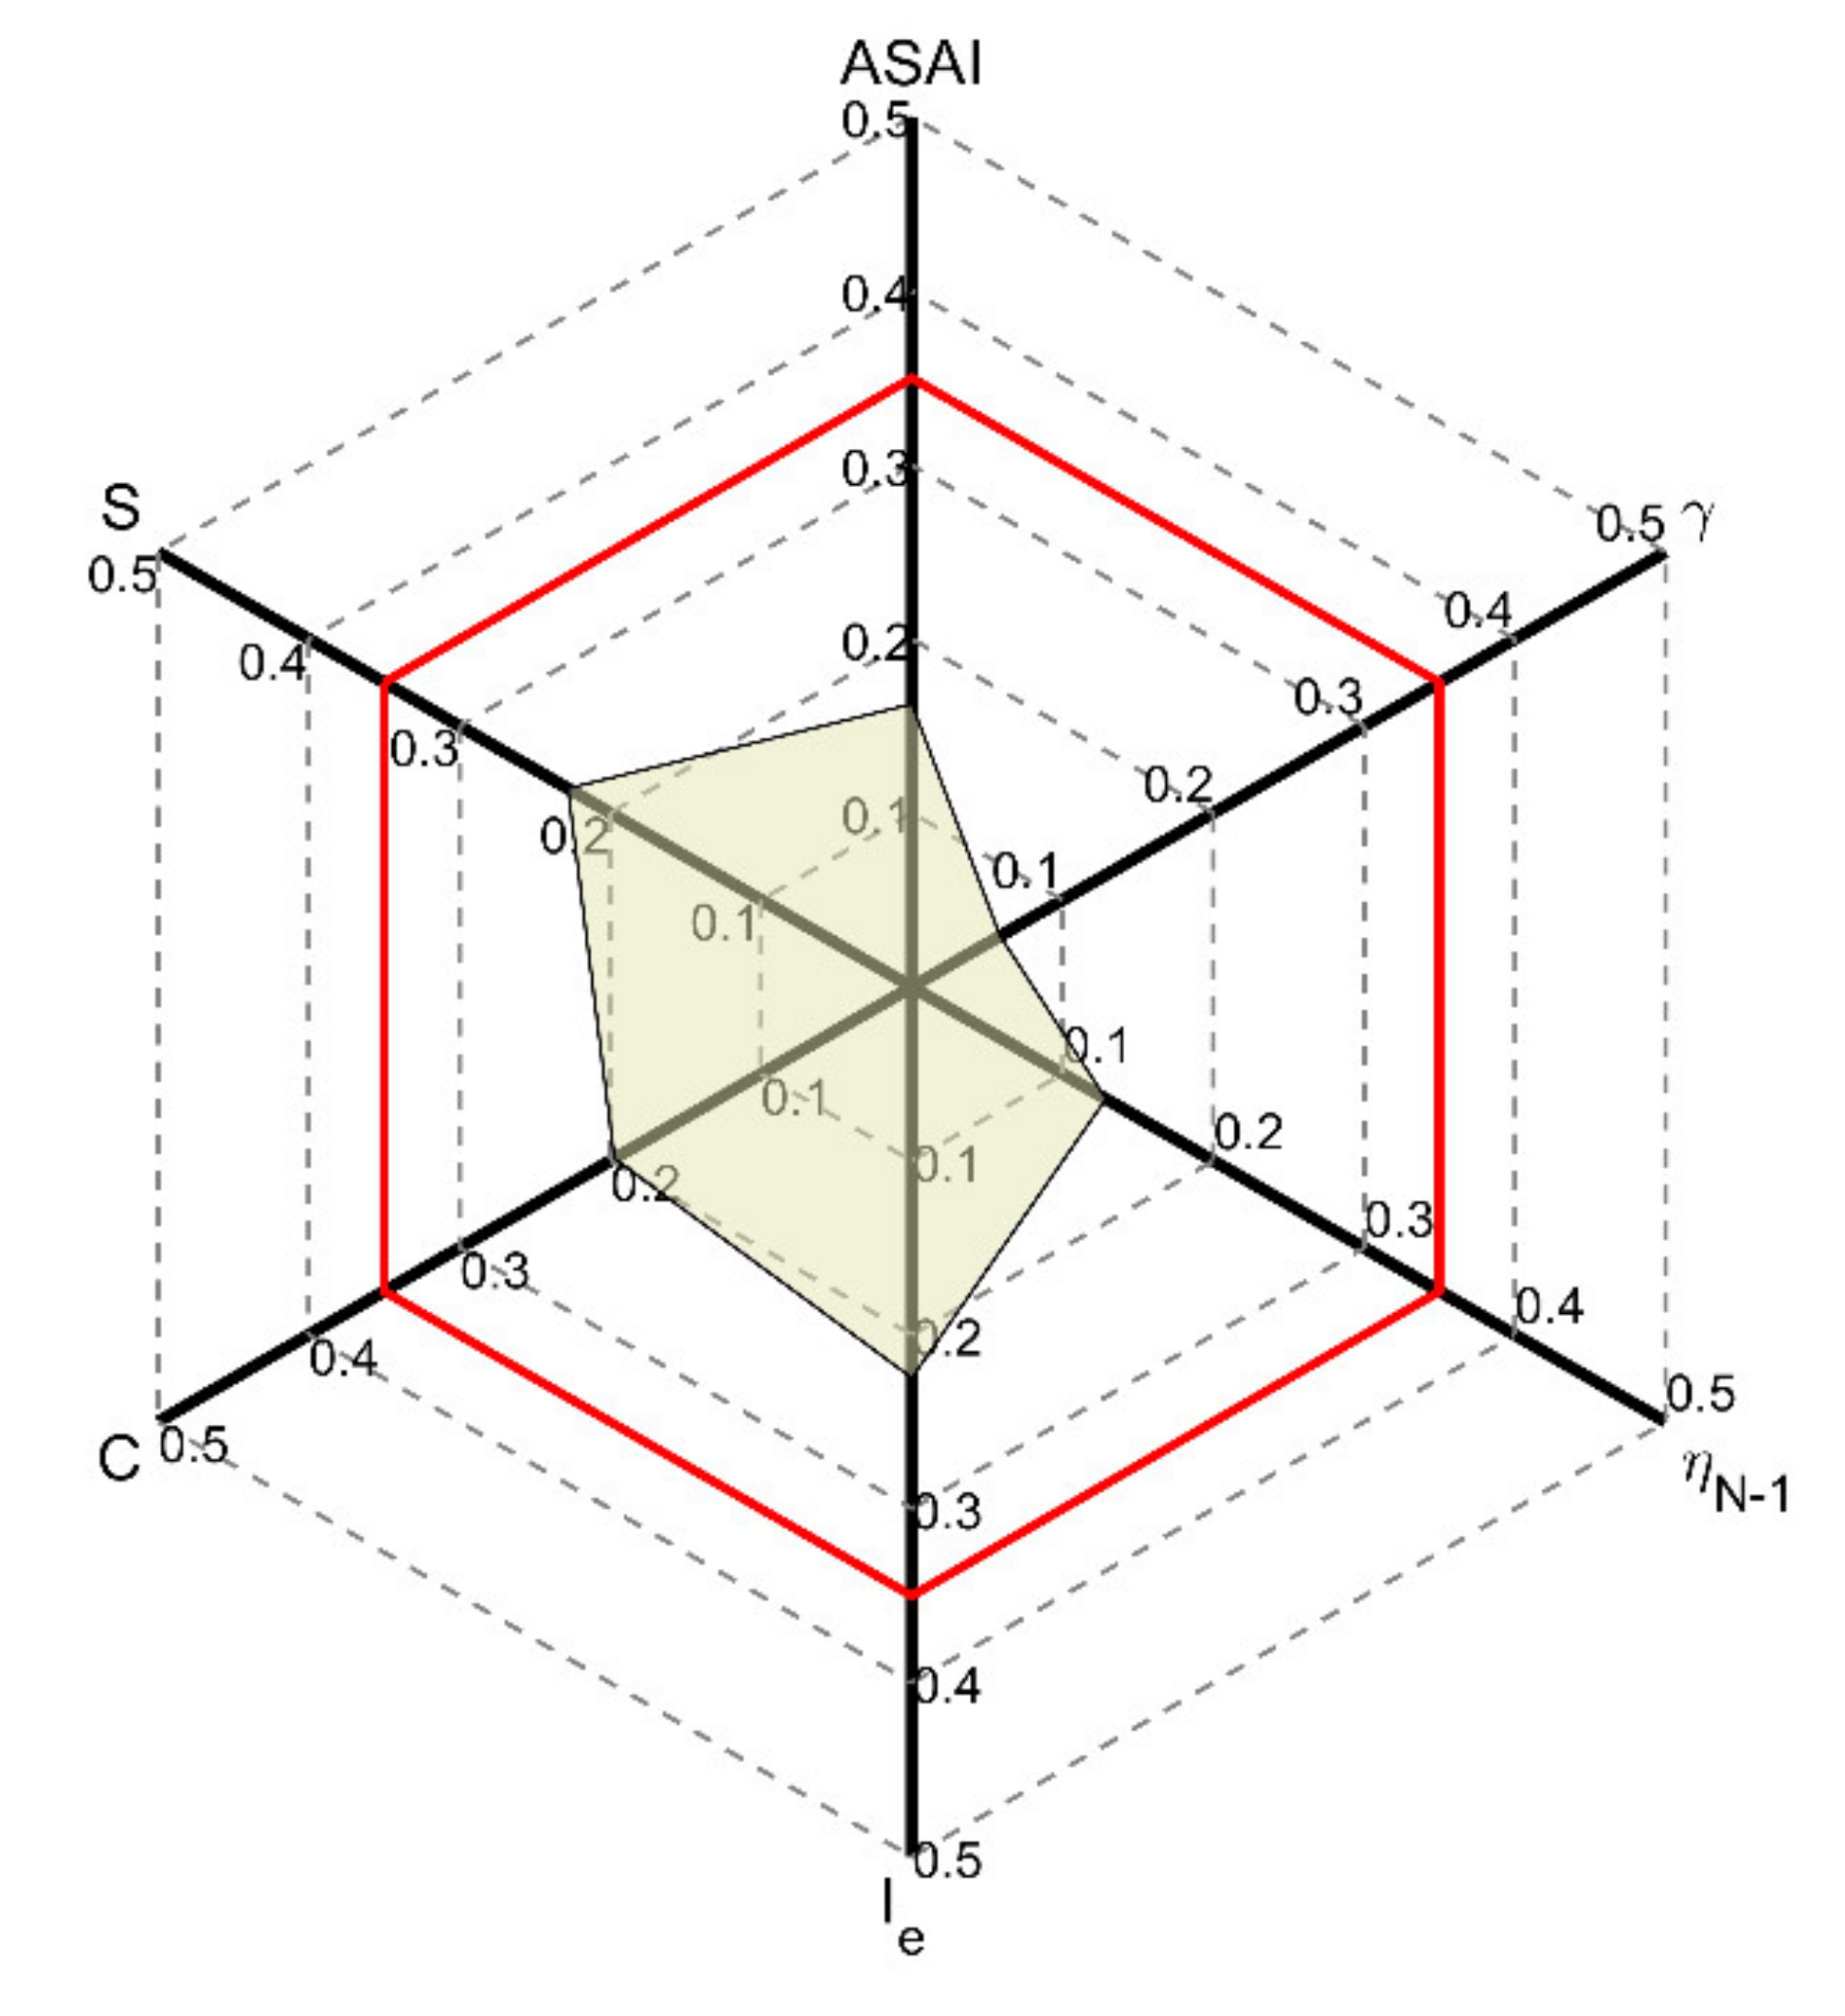
In terms of economic indicators, this article proposes the electrical depreciation, depletion, and amortization (DD&A) barrel oil cost S, the cost of network loss C, and the maximum expected benefit per unit power generation Ie. Based on the DD&A barrel oil cost widely used in the petroleum industry and the actual grid planning situation, the electrical DD&A barrel oil cost is proposed to evaluate different grid topologies.
The cost of a barrel of oil is an important indicator to measure the cost competitiveness of an oil company. The cost of a full barrel of oil represents the cost of each barrel of oil that the oil company spends [15]. In the cost of a full barrel of oil, special revenue, financial expenses, and the income tax is an uncontrollable cost of barrel oil, which is often determined by the country’s fiscal and taxation policy and cannot be changed through the efforts of oil companies. Therefore, the five controllable barrels of oil costs are more valued by oil companies. They include production operation fees of barrels oil, depreciation, depletion and amortization cost of barrel oil (DD&A barrel oil cost), disposal fee of barrel oil, sales and management fee of barrel oil, and product tax of barrel oil (taxes other than income tax and special income). Among the five costs of barrel oil, the main component is the DD&A barrel oil cost. The DD&A barrel oil cost represents the expenses incurred by the oil company before commercial production and the depletion, amortization, and depreciation of related fixed assets. The DD&A barrel oil cost accounts for about 55% of the five costs of barrels of oil, it accounts for the largest weight. Therefore, to some extent, oil companies control the DD&A barrel oil cost, and basically control the changing trend of barrels of oil cost, thereby gaining a comparative advantage and creating more profits.
The calculation of DD&A barrel oil cost is shown in Formulas (1) and (2) [16],
A f 1 = P current P 1 F 1
A w 1 = P current P D 1 W 1
Current DD&A = A f 1 + A w 1 . Among them, P current is the current output of the oil field, P 1 is the initial proven reserves of the current oil field, P D 1 is the reserves of oil fields that have public facilities but have not been exploited, and F 1 is the total investment in public facilities, including the total investment in public facilities at the beginning of the period and the investment in new public facilities in the current period. W 1 is the total investment after drilling and completion, i.e., the operating costs of the facilities in the current period.
When calculating the current barrel of oil DD&A, dividing the current output by the current DD&A results in what is shown in Formulas (3) and (4)
Current   barrel   of   oil   DD & A   = A f 1 + A w 1 P current
and so,
Current   barrel   of   oil   DD & A = F 1 P 1 + W 1 P D 1
It can be concluded that the barrel of oil DD&A is not affected by its current output, which is closely related to the current new investment and oilfield reserves.
When considering the cost of electrical DD&A barrel oil cost. F1 is the total investment in power facilities, including the construction costs of generators and submarine cables; W1 is the total investment after drilling and completion, i.e., the operating costs incurred by power facilities.
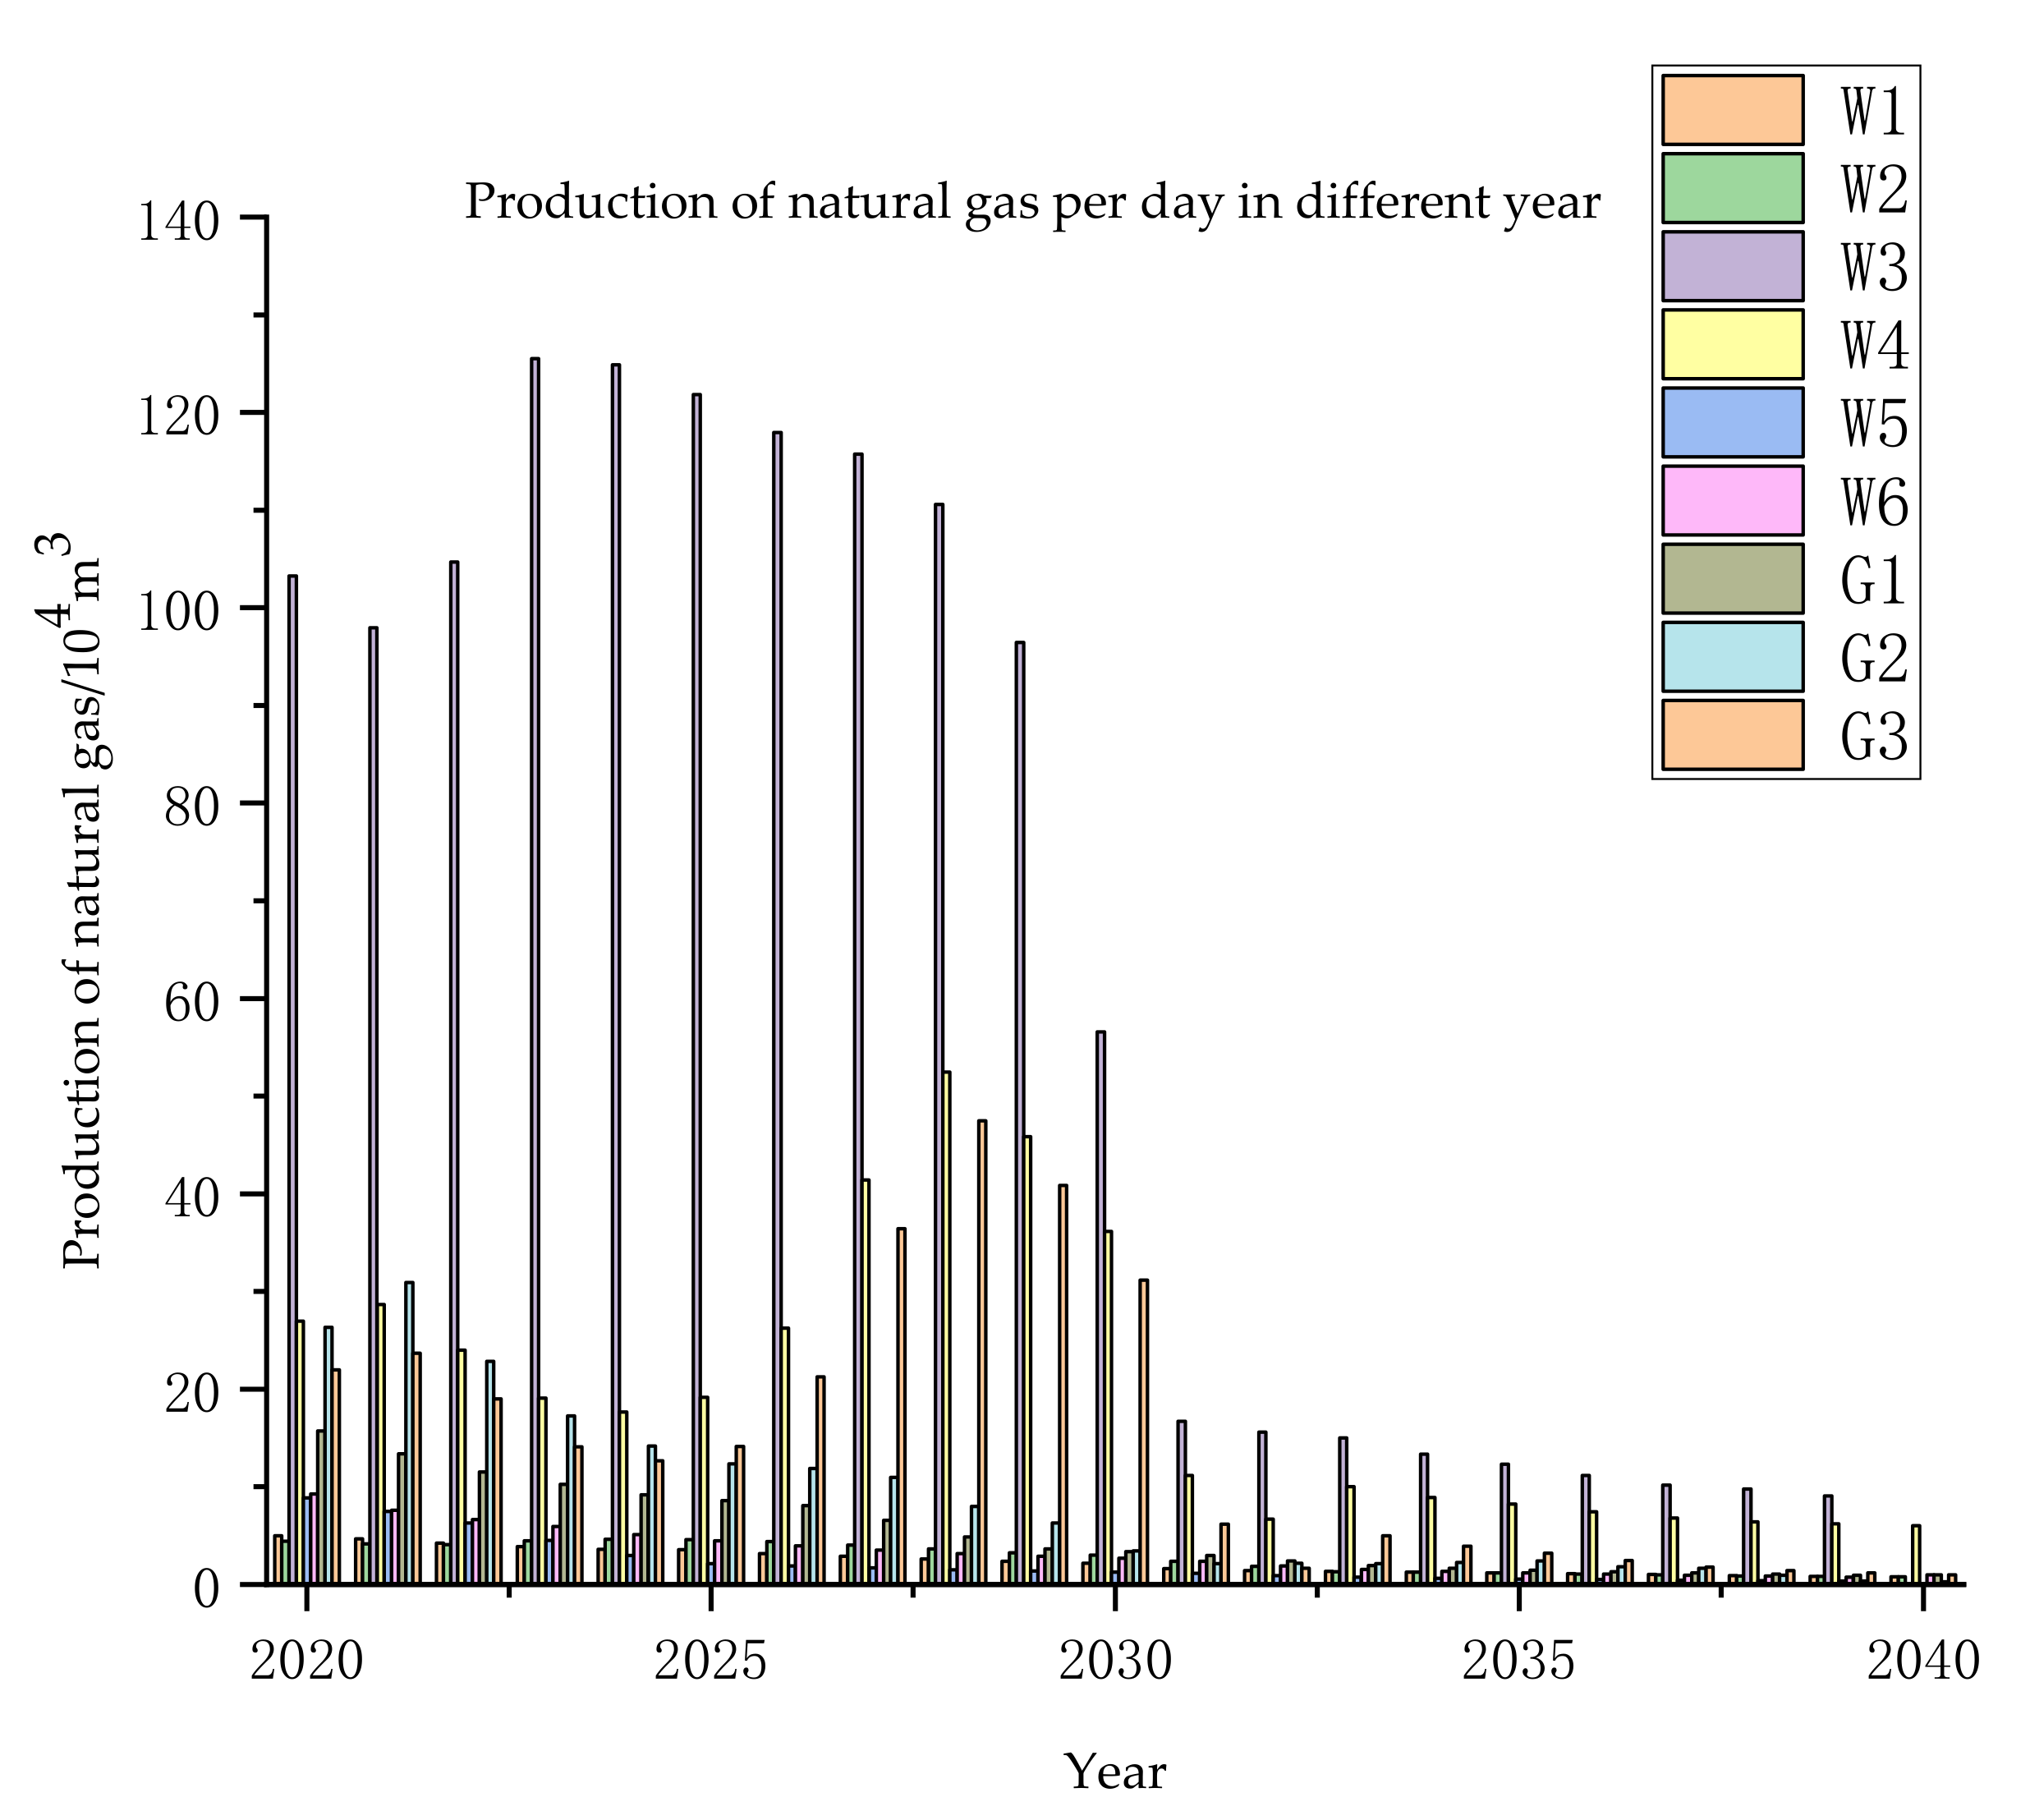
Different power topologies will produce different network losses C. When converting network losses into economic benefits, this article chooses to convert the power generation loss from network losses into the gas amount consumed by the corresponding generator, so as to determine the economic value of corresponding network loss according to the gas amount. Its calculation method is shown in Formula (5).
C = Δ S P S × δ × Μ gas
where C is the cost of network loss, Δ S is the network loss of different topologies, Ps is the total power generation of the network, δ is the total gas consumption, and Mgas is the price of natural gas.
In order to measure the production benefits of different grid topologies, this article selects maximum expected benefit per unit power generation Ie as an economic benefit indicator, its calculation method is shown in Formula (6).
I e = M gas × P gas + M oil × P oil W
Among them, M gas is the gas price, P gas is the natural gas production after deducting the natural gas consumed by the gas turbine, M oil is the price of oil, P oil is oil production, and W is the total power generation after deducting network losses.

2.1.2. Reliability Indicators

In terms of reliability indicators, this article proposes n−1 pass rate η N 1 , voltage qualification rate γ, power supply reliability ASAI (Average Service Availability Index) and other indicators.
When calculating the n−1 pass rate, this article calculates the n−1 fault for different submarine cables and the power outage loss when fault occurs. The n−1 pass rate calculation method is shown in Formula (7).
η N 1 = ( 1 m M ) × 100 %
Among them, m is the number of lines that do not occur power loss during the N − 1 calculation, and M is the total number of lines in the grid.
When calculating the voltage qualification rate, what is required is the proportion of the number of nodes whose system node voltage is within the allowable deviation range under the typical load operating conditions. The voltage qualification rate calculation method is shown in Formula (8).
γ = ( 1 n N ) × 100 %
Among them, n is the total number of nodes whose voltage does not meet the standard, and N is the total number of nodes in the grid.
When calculating the power supply reliability, the success flow method is used to calculate the probability of the system running successfully, and this probability is used as the power supply reliability of the system. The calculation process is as follows:
Firstly, the system is layered, and the search is started from the main feeder. The branch feeders on the main feeder and their connected components (including circuit breakers, transformers, overhead lines or cables, etc.) are divided into the same layer. At the same time, we looked for whether the branch feeder also contains lower-level branch feeders, and obtained network level statistics through layered search.
Secondly, according to the results obtained from the network level analysis, starting from the last layer, the values were increased sequentially [17]. The specific steps were as follows:
a.
Do a series analysis of each branch feeder in the last layer, and set the probability of successful operation of all components on the same line as the probability of successful operation of a branch feeder. For the j-th branch feeder of the i-th layer,
P ij = k ij P ij , k
Among them, P ij , k means the probability of successful operation of component k, which is in the j-th branch feeder of the i-th layer of the system.
In particular, for some important loads, dual lines are often used for power supply. Without considering the load limit, only when the two circuits exit operation at the same time will affect the load side power supply, so the probability of successful operation can be calculated in parallel.
P ij = 1 ( 1 P ij 1 ) × ( 1 P ij 2 )
In the formula: Pij1 and Pij2 are respectively the probability of successful operation of the first and second line in the double circuit line.
Each branch feeder of the i-th layer is weighted by the proportion of the load to the total load of the i-th layer, and is equivalent to component Mi. The calculation is as follows:
P M i = j = 1 n a ij × P ij
j = 1 n a ij = 1
In the formula, aij is the proportion of the j-th branch feeder in the total load of the i-th layer, and the i-th layer contains n branch feeders.
b.
Put the i-th layer branch feeder obtained from the calculation and analysis in the previous step as an equivalent element Mi into the (i−1) layer, the branch load number is the total number of load of the i-th layer, repeat the above steps to obtain the equivalent successful operation probability of the i-th layer.
c.
Repeat the steps until the equivalent value reaches the highest level, so as to obtain a main feeder line containing only series nodes (or components), and obtain its equivalent successful operation probability P.
This probability of successful operation P can be used as reliability indicator ASAI during system operation.

2.2. Weights of the Economic Evaluation System

The core idea of the analytic hierarchy process (AHP) is to determine the relative importance of elements in each level through pairwise comparison and judgment in the hierarchy model, so as to calculate the relative importance weight of each indicator [18,19]. Its advantage is to analyze qualitatively, combined with quantitative analysis. The disadvantage is that the relative importance of the indicators is selected by humans, which easily leads to the randomness and irrationality of the evaluation. The entropy weight method determines the weight based on the amount of information provided by the observation value of each indicator [20]. Its advantage is to completely define the value and weight of its data from the degree of dispersion of the data itself, which is relatively objective. Its disadvantage is that it does not consider the actual meaning of the data itself, and can only be used for multi-scheme evaluation. This article proposes the ideal point method to combine the analytic hierarchy process and the entropy method to determine the composite weight and reduce the subjectivity of the evaluation process. The basic idea is to minimize the deviation of the vector objective function from the ideal point of the problem under consideration. The calculation process is as follows.
Assuming that the subjective weight obtained by the analytic hierarchy process is λ = ( λ 1 , λ 2 , λ n ) , the objective weight is μ = ( μ 1 , μ 2 , μ n ) , the compound weight to be sought is w = ( w 1 , w 2 , w n ) , the ideal value of each indicators attribute is defined as r, and the distance between the calculation scheme i and the ideal point is shown in Formula (13).
d i = j = 1 n ( y ij y j * ) 2 1 2 = j = 1 n ( ( r ij r j * ) w j ) 2 1 2
Apparently, the smaller the di is, the closer the scheme i is to the ideal solution.
For the convenience of calculation, the vector is unitized, λ = λ λ 1 2 + λ 2 2 + λ n 2 , μ = μ μ 1 2 + μ 2 2 + μ n 2 , w = w w 1 2 + w 2 2 + w n 2 , and the square of the distance between each scheme Ai to the ideal point is:
d i 2 ( λ ) = j = 1 n ( r ij r j * ) λ j 2
d i 2 ( μ ) = j = 1 n ( r ij r j * ) μ j 2
d i 2 ( w ) = j = 1 n ( r ij r j * ) w j 2
d i 2 ( w ) d i 2 ( λ ) = j = 1 n ( r ij r j * ) 2 ( w 2 λ 2 )
d i 2 ( w ) d i 2 ( μ ) = j = 1 n ( r ij r j * ) 2 ( w 2 μ 2 )
In order to take into account the subjective weight and the objective weight, the combination weight should be selected, so that the weight deviation under the subjective and objective combination weights is as small as possible. Construct the following nonlinear programming model:
f ( w ) = d i 2 ( w ) d i 2 ( μ ) 2 + d i 2 ( w ) d i 2 ( λ ) 2
The constraint is as follows:
j = 1 n ω j 2 = 1 w j > 0 , j = 1 , 2 , n
r ij r j * = k j ,   w j 2 = t j
The original model can be written as
minf ( T ) = j = 1 n k j ( t j l j 2 ) 2 + j = 1 n k j ( t j m j 2 ) 2
j = 1 n t j = 1 t j > 0 , j = 1 , 2 , n
When seeking the extreme value of the function, the Lagrange function of Equation (23) can be constructed to solve:
L ( T , η ) = f ( T ) + 2 η ( j = 1 n t j 1 )
Taking the derivative of Formula (23), we can get
L t j = 2 j = 1 n k j ( 2 t j λ j 2 μ j 2 ) + 2 η = 0
L η = j = 1 n t j 1 = 0
Furtherly,
2 j = 1 n k j t j + η = j = 1 n ( λ j 2 + μ j 2 ) = 2
Converting Formula (26) to vector form,
2 K T E + η E = K C E
among them, K = k 1 , k 2 k n , C = λ 1 2 + μ 1 2 , λ 2 2 + μ 2 2 , λ j 2 + μ j 2 It can be inferred that 2T = C
w j = λ j 2 + μ j 2 2
The combined weight is
w j = w j j = 1 n w j
On the basis of considering the reliability and economy of the distribution network, this method realizes the unification of different indicators, it integrates subjective and objective weights, and overcomes the interference of subjective factors in traditional methods. Uses of the Lagrange function of the optimized mathematical model realizes the comprehensive evaluation of the target indicators, and the entire weight determination process is shown in Figure 1.

3. Results

The selected calculation examples are divided into two different planning periods for short-term small-scale and long-term large-scale. The short-term small-scale calculation example has only one scheme, it is used to calculate various indicators to show the rationality of the calculation of the indicators. The long-term large-scale calculation examples have 15 schemes, which are used to calculate each weight of the indicators. Finally, this article uses the established economic evaluation system to evaluate economic performance of the actual power grid in Bohai Bay and gives analysis of the result.
According to the median long-term data of the parameters, the selected calculation parameters are shown in Table 1 below.
Due to the complicated situation of submarine cables, when assessing the reliability of the power grid, it is generally considered that the failure rate of the submarine cable is proportional. By fitting the actual submarine cable fault data, the fault rate segment function is shown below.
λ L = 0.0175 L < 9.33 0.0037 L 0.017 L 9.33
Reliability parameters of elements in power system is shown in Table 2.

3.1. Short-Term Small-Scale Power System Single Scheme Evaluation

The short-term small-scale grid topology is shown in Figure 2, the submarine cable parameter table is shown in Table 3. Dash-line means the submarine cable that can be chosen in structure optimization, and single-line means that the submarine cable already exist and double-lines means that there exist two submarine cables.
The load of each platform is shown in Table 4.
The platform oil and gas outputs are predicted based on the relationship between the load and output of the existing platform. Combined with the platform data, the calculated economic evaluation system indicator values are shown in Table 5.

3.2. Long-Term Large-Scale Power System Multi-Scheme Evaluation

The long-term large-scale grid topology is shown in Figure 3. The structure optimization has obtained a total of 15 alternative topologies. The platform output is predicted based on the relationship between the load and output of the existing platform.
According to power investment and petroleum deposits, the calculated electrical DD&A barrel oil cost of different topologies is shown in Figure 4 below.
According to the life cycle of the oil field, the calculation of the maximum expected benefit per unit power generation over time is shown in Figure 5 below.
All indicators of the calculated long-term large-scale calculation example are shown in Table 6 below.
The analytic hierarchy process is used to solve the subjective weight, the entropy method is used to solve the objective weight, and the ideal point method is used to combine the two. The results are shown in Table 7 below.
The results can be represented by the indicators’ weight chart in Figure 6 below:

3.3. Economic Evaluation of Actual Power System

The actual grid structure optimization results are shown in Figure 7. The offshore multi-platform interconnected power system grid includes three oil field groups, and currently has 11 platforms, including 3 main platforms G1, G2, and G3 (platforms with generators), and 6 sub-platforms W1–W6 (load platforms). The platforms are connected by submarine cables, in which the longest distance can reach 29.8 km. The offshore multi-platform interconnected power system adopts its own power supply, and is not connected to shore power or offshore wind power. The maximum supply voltage is 35 kV and the power supply frequency is 50 Hz.
The daily oil production and daily natural gas production of the offshore oil field in the next 20 years are shown in Figure 8 and Figure 9. We can see that the oil production of each platform decreased all the time. The natural gas production of each platform also gradually decreased after a period of stabilization. According to the oil and gas production of each platform, we can obtain the maximum expected benefit per unit power generation and electrical DD&A barrel oil cost.
The values of each indicator calculated by the economic evaluation system and the economic scores are shown in Table 8.
Combining the weights of each indicator, the economic evaluation score of the actual calculation example is 84.76, which can meet the requirements well. Among them, the voltage qualification rate is low, but it has little impact on the final overall economic score. It reflects that the offshore oilfield production facilities have lower voltage requirements than on land. Economic evaluation results show that the structural optimization scheme can achieve the expected aim.

4. Conclusions

The different indicator weights determined by the economic evaluation system show that the electrical DD&A barrel oil cost and the expected benefit per unit power generation account for a large proportion in the economic evaluation system. Because of the large difference in power investment and network loss between different grid topologies, oil production cost is an important measure of the efficiency of oilfield production. Therefore, the electrical DD&A barrel oil cost and the expected benefit per unit power generation occupy a more important position in the economic evaluation of offshore power systems. The voltage qualification rate accounts for a smaller proportion because there is little difference in voltage between power grid topologies, and offshore oilfield production facilities have lower voltage requirements than on land. From the perspective of the importance of different indicators, the indicators and weights determined by the economic evaluation system can reflect the economics of different grid topologies well. This evaluation system carried out an economic evaluation of the results of the actual power system structure optimization, and achieved good expected results.
For further research, this article will give attention to the points below.
  • For the calculation of reliability, the research will adopt more accurate calculation methods, such as Monte Carlo sampling, to calculate the reliability of the whole system.
  • The research will propose more comprehensive evaluation elements for the offshore multi-platform interconnected power system, such as indicators related to environmental protection and production safety.
  • The research will change the evaluation of the economic benefits of power system from static evaluation to dynamic evaluation, and give suggestions for the withdrawal of offshore oilfield power systems from operation.

Author Contributions

Methodology, Y.L.; software, Y.L. and G.L.; validation, Q.Y.; writing—original draft preparation, Y.L.; writing—review and editing, Y.L., Z.J. and Q.Y.; supervision, Q.Y. All authors have read and agreed to the published version of the manuscript.

Funding

This work was supported by “National Key Research and Development Program of China 2018YFB0904800”.

Conflicts of Interest

The authors declare no conflict of interest.

References

  1. Li, X.; Yang, L.; Wei, C. Application of power grid technology in the oil/gas field development. China Offshore Platf. 2011, 5, 26–29. [Google Scholar]
  2. Nguyen, T.V.; Fulop, T.G.; Breuhaus, P.; Elmegaard, B. Life performance of oil and gas platforms: Site integration and thermodynamic evaluation. Energy 2014, 73, 282–301. [Google Scholar] [CrossRef] [Green Version]
  3. Tan, C.; Lu, Y.S.; Zhang, X.T. Life extension and repair decision-making of ageing offshore platforms based on DHGF method. Ocean Eng. 2016, 117, 238–245. [Google Scholar] [CrossRef]
  4. Zhang, K. Research on Comprehensive Evaluation System of Distribution Network Planning Considering Life Cycle Cost; Huazhong University of Science and Technology: Wuhan, China, 2015. [Google Scholar]
  5. Li, X.; Gao, X.; Wei, C. Discussion on the application of offshore oil platforms introducing shore power. Autom. Appl. 2018, 2, 125–126. [Google Scholar]
  6. Long, G.; Yu, Q.; Li, X.; Liu, Y.; Jiang, Z. Research on structural optimization of offshore oilfield interconnected power system considering reliability. Power Grid Technol. 2020, 1–9. [Google Scholar] [CrossRef]
  7. Gao, X.; Yan, Z. Comprehensive assessment of smart grid construction based on principal component analysis and cluster analysis. Power Syst. Technol. 2013, 37, 2238–2243. [Google Scholar]
  8. Yi, Y.; Wei, G.; Yang, J. comprehensive decision making of distribution network planning based on group AHP. Electr. Power 2012, 45, 23–28. [Google Scholar]
  9. Ma, L.; Zhang, J.; Liu, N. Multistage comprehensive evaluation of urban power distribution network planning. Electr. Power 2013, 46, 150–159. [Google Scholar]
  10. Ouyang, S.; Shi, Y. A new improved entropy method and its application in power quality evaluation. Autom. Electr. Power Syst. 2013, 37, 156–159. [Google Scholar] [CrossRef]
  11. Huang, X.; Huang, Y.; Liu, H. Root cause importance degree analysis of power production accident based on dynamic weight and delphi method. Electr. Technol. 2017, 3, 89–93. [Google Scholar]
  12. Xiao, J.; Wang, C.; Zhou, M. An IAHP-based MADM method in urban power system planning. Proc. CSEE 2004, 24, 50–57. [Google Scholar]
  13. Li, X.; Zhang, L.; Li, X. The research on the evaluation system for existing network based on analytic hierarchy process and delphi method. Power Syst. Prot. Control 2008, 36, 57–61. [Google Scholar]
  14. Gao, Y.; Kang, C.; Zhong, J.; Cheng, L.; Xia, Q. Economic value evaluation and decision of reliability in power generation and transmission system expansion. Proc. Chin. Soc. Electr. Eng. 2007, 25, 56–60. [Google Scholar]
  15. Huang, Z.; Hao, H. Depreciation, depletion and amortization under the full cost method of oil and gas accounting. J. China Univ. Pet. 2013, 29, 10–13. [Google Scholar]
  16. Zhang, H.; Zhang, Y.; Yang, Z.; He, Q.; Wang, T. Maintain and reduce oil company barrel oil cost through barrel oil DD&A change formula. Chin. Foreign Energy 2018, 23, 22–26. [Google Scholar]
  17. Tuinema, B.W.; Getreuer, R.E.; Torres, J.L.R.; van der Meijden, M. Reliability analysis of offshore grids—An overview of recent research. Wiley Interdiscip. Rev. Energy Environ. 2019, 8, e309. [Google Scholar] [CrossRef] [Green Version]
  18. Song, X.; Mou, L. In the research of economic benefits post-evaluation on the grid construction projects based on the fuzzy AHP method. In Proceedings of the International Conference on E-Product E-Service and E-Entertainment, Henan, China, 7–9 November 2010; pp. 1–4. [Google Scholar]
  19. Mao, M.; Jin, P.; Chang, L.; Xu, H. Economic analysis and optimal design on microgrids with SS-PVs for industries. IEEE Trans. Sustain. Energy 2014, 5, 1328–1336. [Google Scholar] [CrossRef]
  20. Jiang, Q.; Huang, R.; Huang, Y.; Chen, S.; He, Y.; Lan, L.; Liu, C. Application of BP neural network based on genetic algorithm optimization in evaluation of power grid investment risk. IEEE Access 2019, 7, 154827–154835. [Google Scholar] [CrossRef]
Figure 1. Flow chart of weight calculation.
Energies 13 05521 g001
Figure 2. Short-term small-scale grid topology diagram.
Energies 13 05521 g002
Figure 3. Long-term large-scale grid topology.
Energies 13 05521 g003
Figure 4. Electrical DD&A barrel oil cost of different topologies.
Energies 13 05521 g004
Figure 5. Diagram of the maximum expected return of power generation in different time units.
Energies 13 05521 g005
Figure 6. Indicators’ weight radar chart.
Energies 13 05521 g006
Figure 7. Structure diagram of actual offshore multi-platform interconnected power system.
Energies 13 05521 g007
Figure 8. Production of oil per day in different year.
Energies 13 05521 g008
Figure 9. Production of gas per day in different year.
Energies 13 05521 g009
Table 1. Economic calculation parameters table.
ParametersValue
Crude oil prices57.41 dollars/barrel
Natural gas price1.54 RMB/m3
Generator rated power12,000 kW
Thermal efficiency of gas turbine31.95%
Tax rate13%
Central parity of RMB against USD7.025
Planning year20
Table 2. Reliability parameters table.
ElementsFailure Rate (Times/Year)Repair Time (Hours)
Generator1.3823.51
Transformer branch0.111312
Circuit breaker branch0.0024.67
Table 3. Submarine cable parameters table.
Serial NumberVoltage Level (kV)Cross-Sectional Area (mm2)Ampacity
(A)
Construction Cost (RMB)
13550197710,000
23575239810,000
33595281920,000
4351203151,050,000
5351503501,150,000
6351853881,300,000
7352404401,500,000
8353004841,750,000
9354005372,250,000
Table 4. Platform load parameter table.
Platform NameMaximum Load Power Rate (kW)
16772
211,111
31297
411,967
54701
618,432
76190
89118
911,051
1011,484
118690
127192
1314,361
147903
157023
166241
Table 5. Short-term small-scale power system indicator values.
Indicator NameValue
Electrical DD&A barrel oil cost S (RMB/barrel)8.5046
Network loss cost C (ten thousand RMB)1140.22
Maximum expected benefit per unit power generation Ie (RMB/kWh)7.1868
Submarine cable n−1 pass rate η N 1 40.0%
Voltage qualification rate γ81.25%
Power supply reliability ASAI95.6%
Table 6. Indicator table of long-term large-scale calculation examples.
Indicator NameElectrical DD&A Barrel Oil Cost S (RMB/Barrel)Network Loss Cost C (Ten Thousand RMB)Maximum Expected Benefit per Unit Power Generation Ie (RMB/kWh) Submarine   Cable   n 1   Pass   Rate   η N 1 Voltage Qualification Rate γPower Supply Reliability ASAI
Grid 110.774315.5110.69451.72%83.33%99.49%
Grid 210.842436.3610.52944.83%83.33%99.45%
Grid 310.772325.5710.51944.83%80.00%99.65%
Grid 410.734321.2810.69544.83%86.67%99.71%
Grid 510.801898.4810.48248.28%80.00%99.75%
Grid 610.773077.2910.58548.28%83.33%99.28%
Grid 710.733017.7510.57951.72%83.33%99.68%
Grid 810.811751.8610.4748.28%73.33%99.66%
Grid 910.821676.0010.46348.28%76.67%99.16%
Grid 1010.761837.9610.47744.83%76.67%99.12%
Grid 1110.761858.7810.47941.38%80.00%99.50%
Grid 1210.781860.0610.47941.38%80.00%99.96%
Grid 1310.722054.9810.49644.83%76.67%99.34%
Grid 1410.721908.0910.48341.38%86.67%99.59%
Grid 1510.742846.3210.56451.72%80.00%99.22%
Table 7. Weights of each indicators in different methods.
Indicator NameElectrical DD&A Barrel Oil Cost S (RMB/Barrel)Network Loss Cost C (Ten Thousand RMB)Maximum Expected Benefit per Unit Power Generation Ie (RMB/kWh) Submarine   Cable   n 1   Pass   Rate   η N 1 Voltage Qualification Rate γPower Supply Reliability ASAI
Subjective weights0.35970.10890.19800.09300.02400.2164
Objective weights0.14520.25270.25550.15670.07730.1126
Compound weights0.22810.19720.22470.12880.05860.1626
Table 8. Indicator value table of actual calculation example.
Indicator NameElectrical DD&A Barrel Oil Cost S (RMB/Barrel)Network Loss Cost C (Ten Thousand RMB)Maximum Expected Benefit per Unit Power Generation Ie (RMB/kWh) Submarine   Cable   n 1   Pass   Rate   η N 1 Voltage Qualification Rate γPower Supply Reliability ASAI
Value10.731777.018.0955.6%77.8%99.9%
Economic scores75.4587.7588.1985.3768.5894.78
Publisher’s Note: MDPI stays neutral with regard to jurisdictional claims in published maps and institutional affiliations.

