Phase Analysis of Series Arc Signals for Low-Voltage Electrical Devices


Abstract
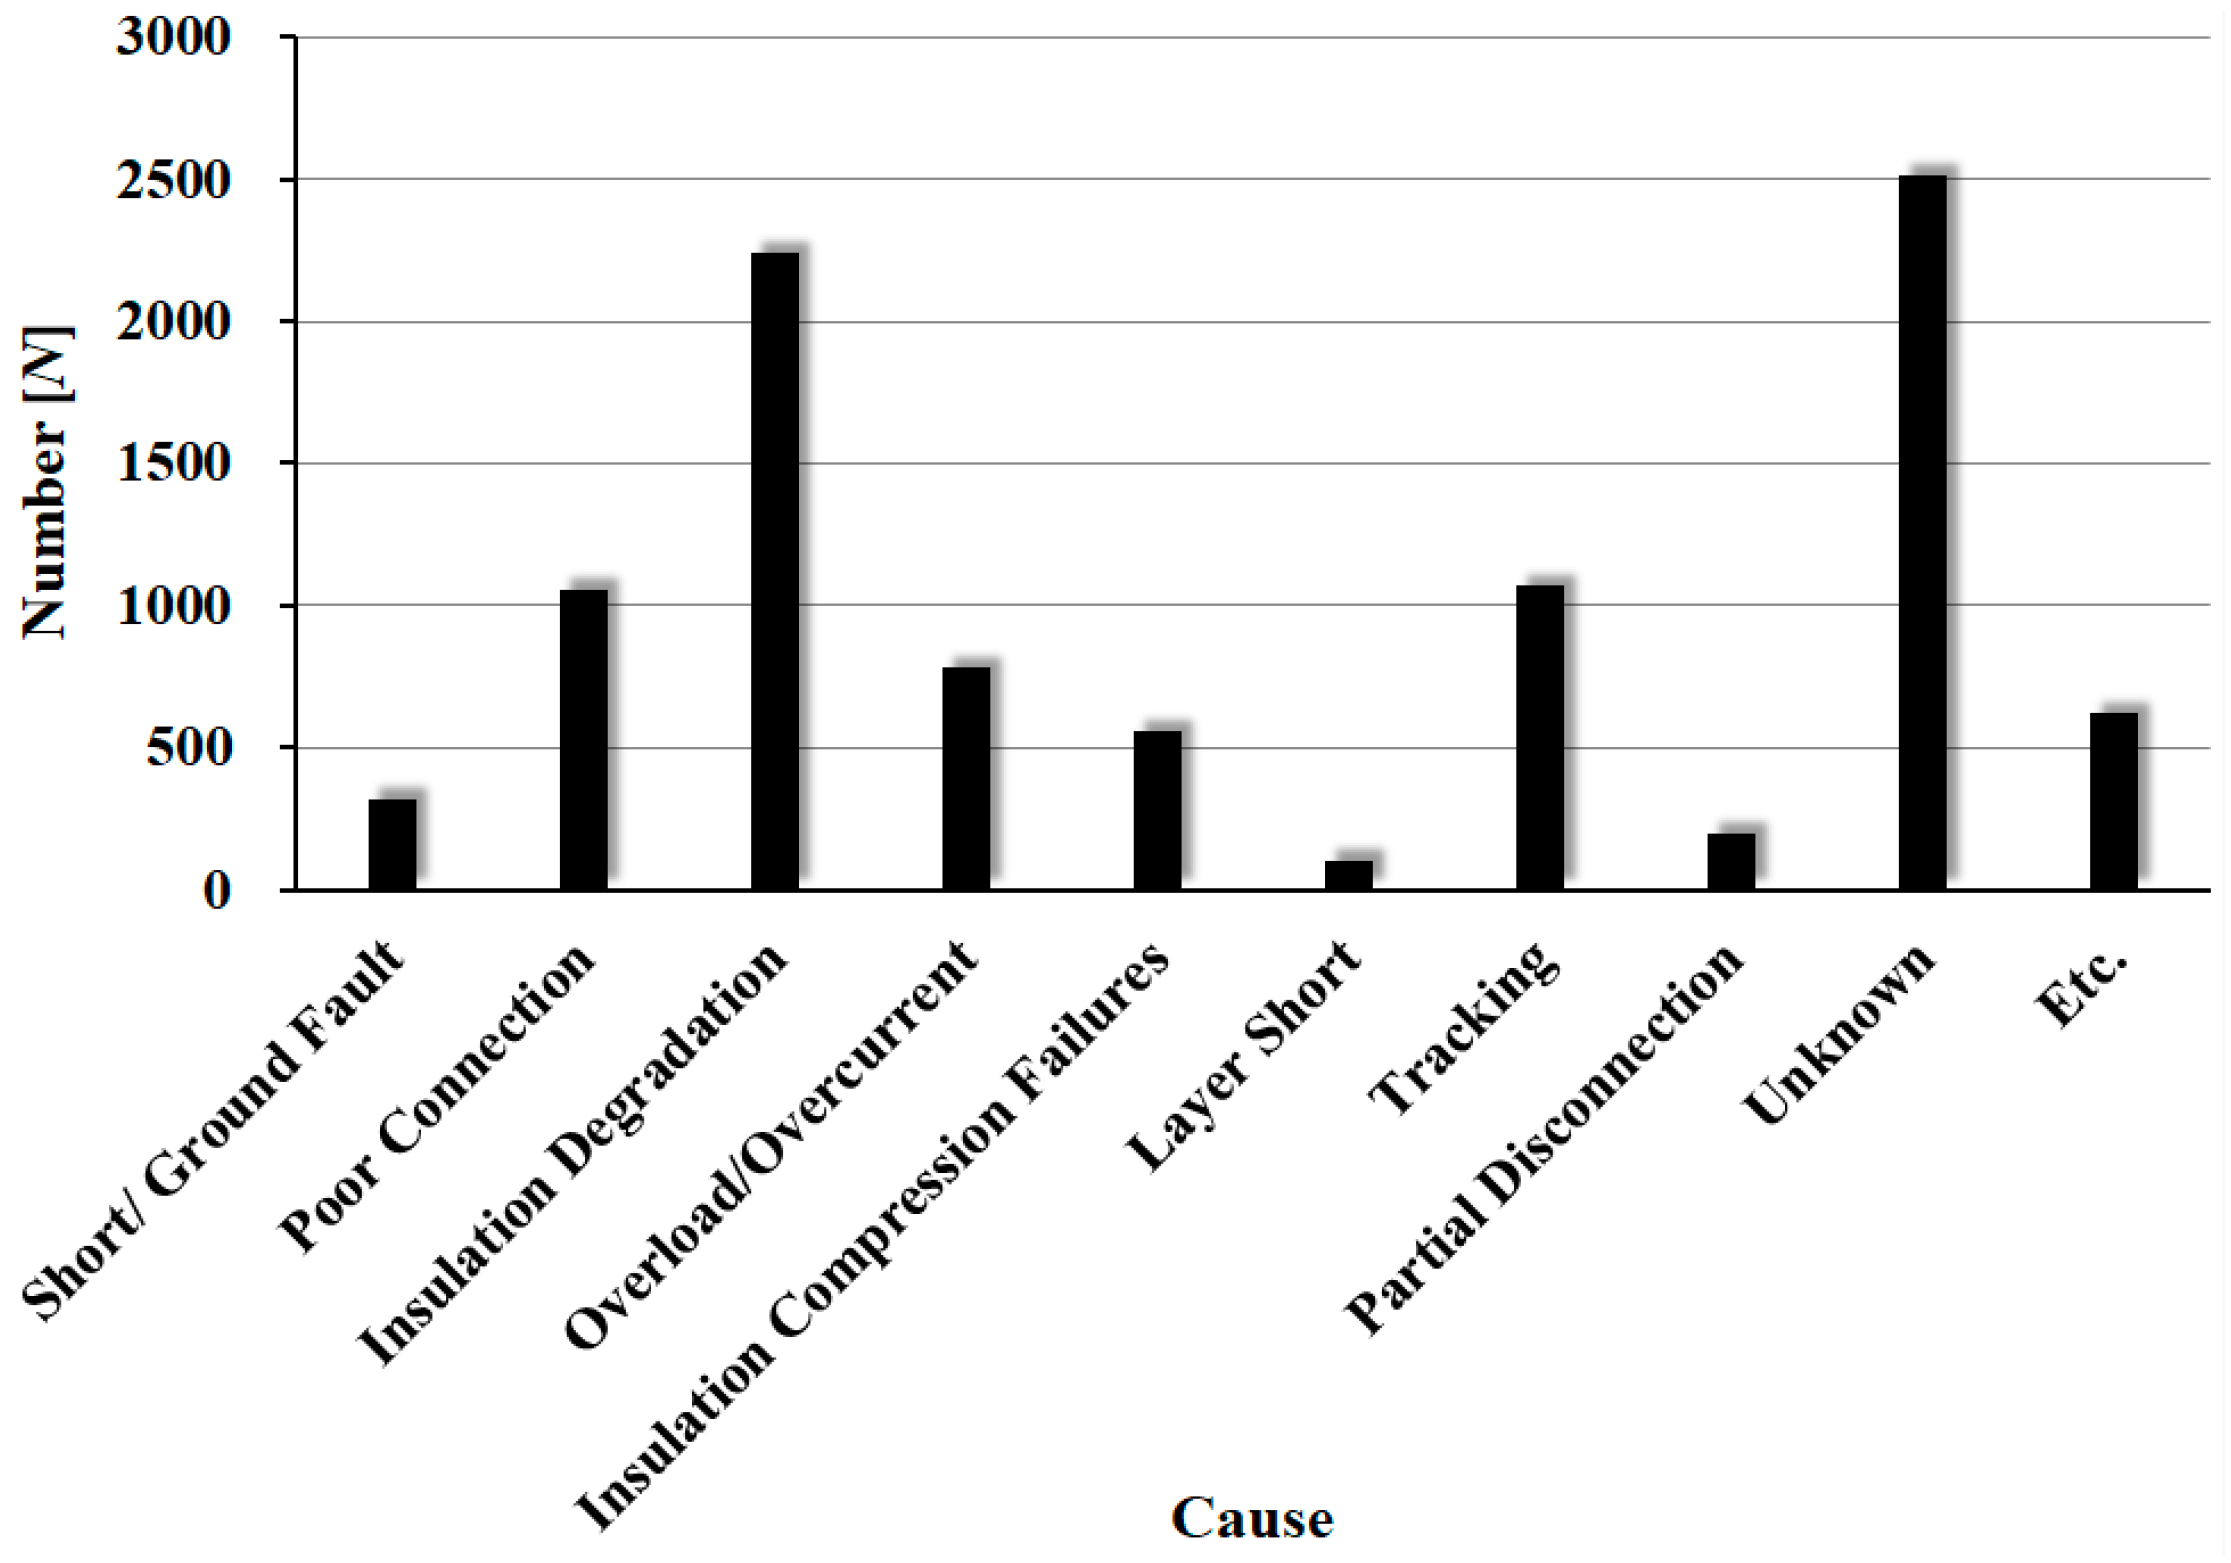
1. Introduction
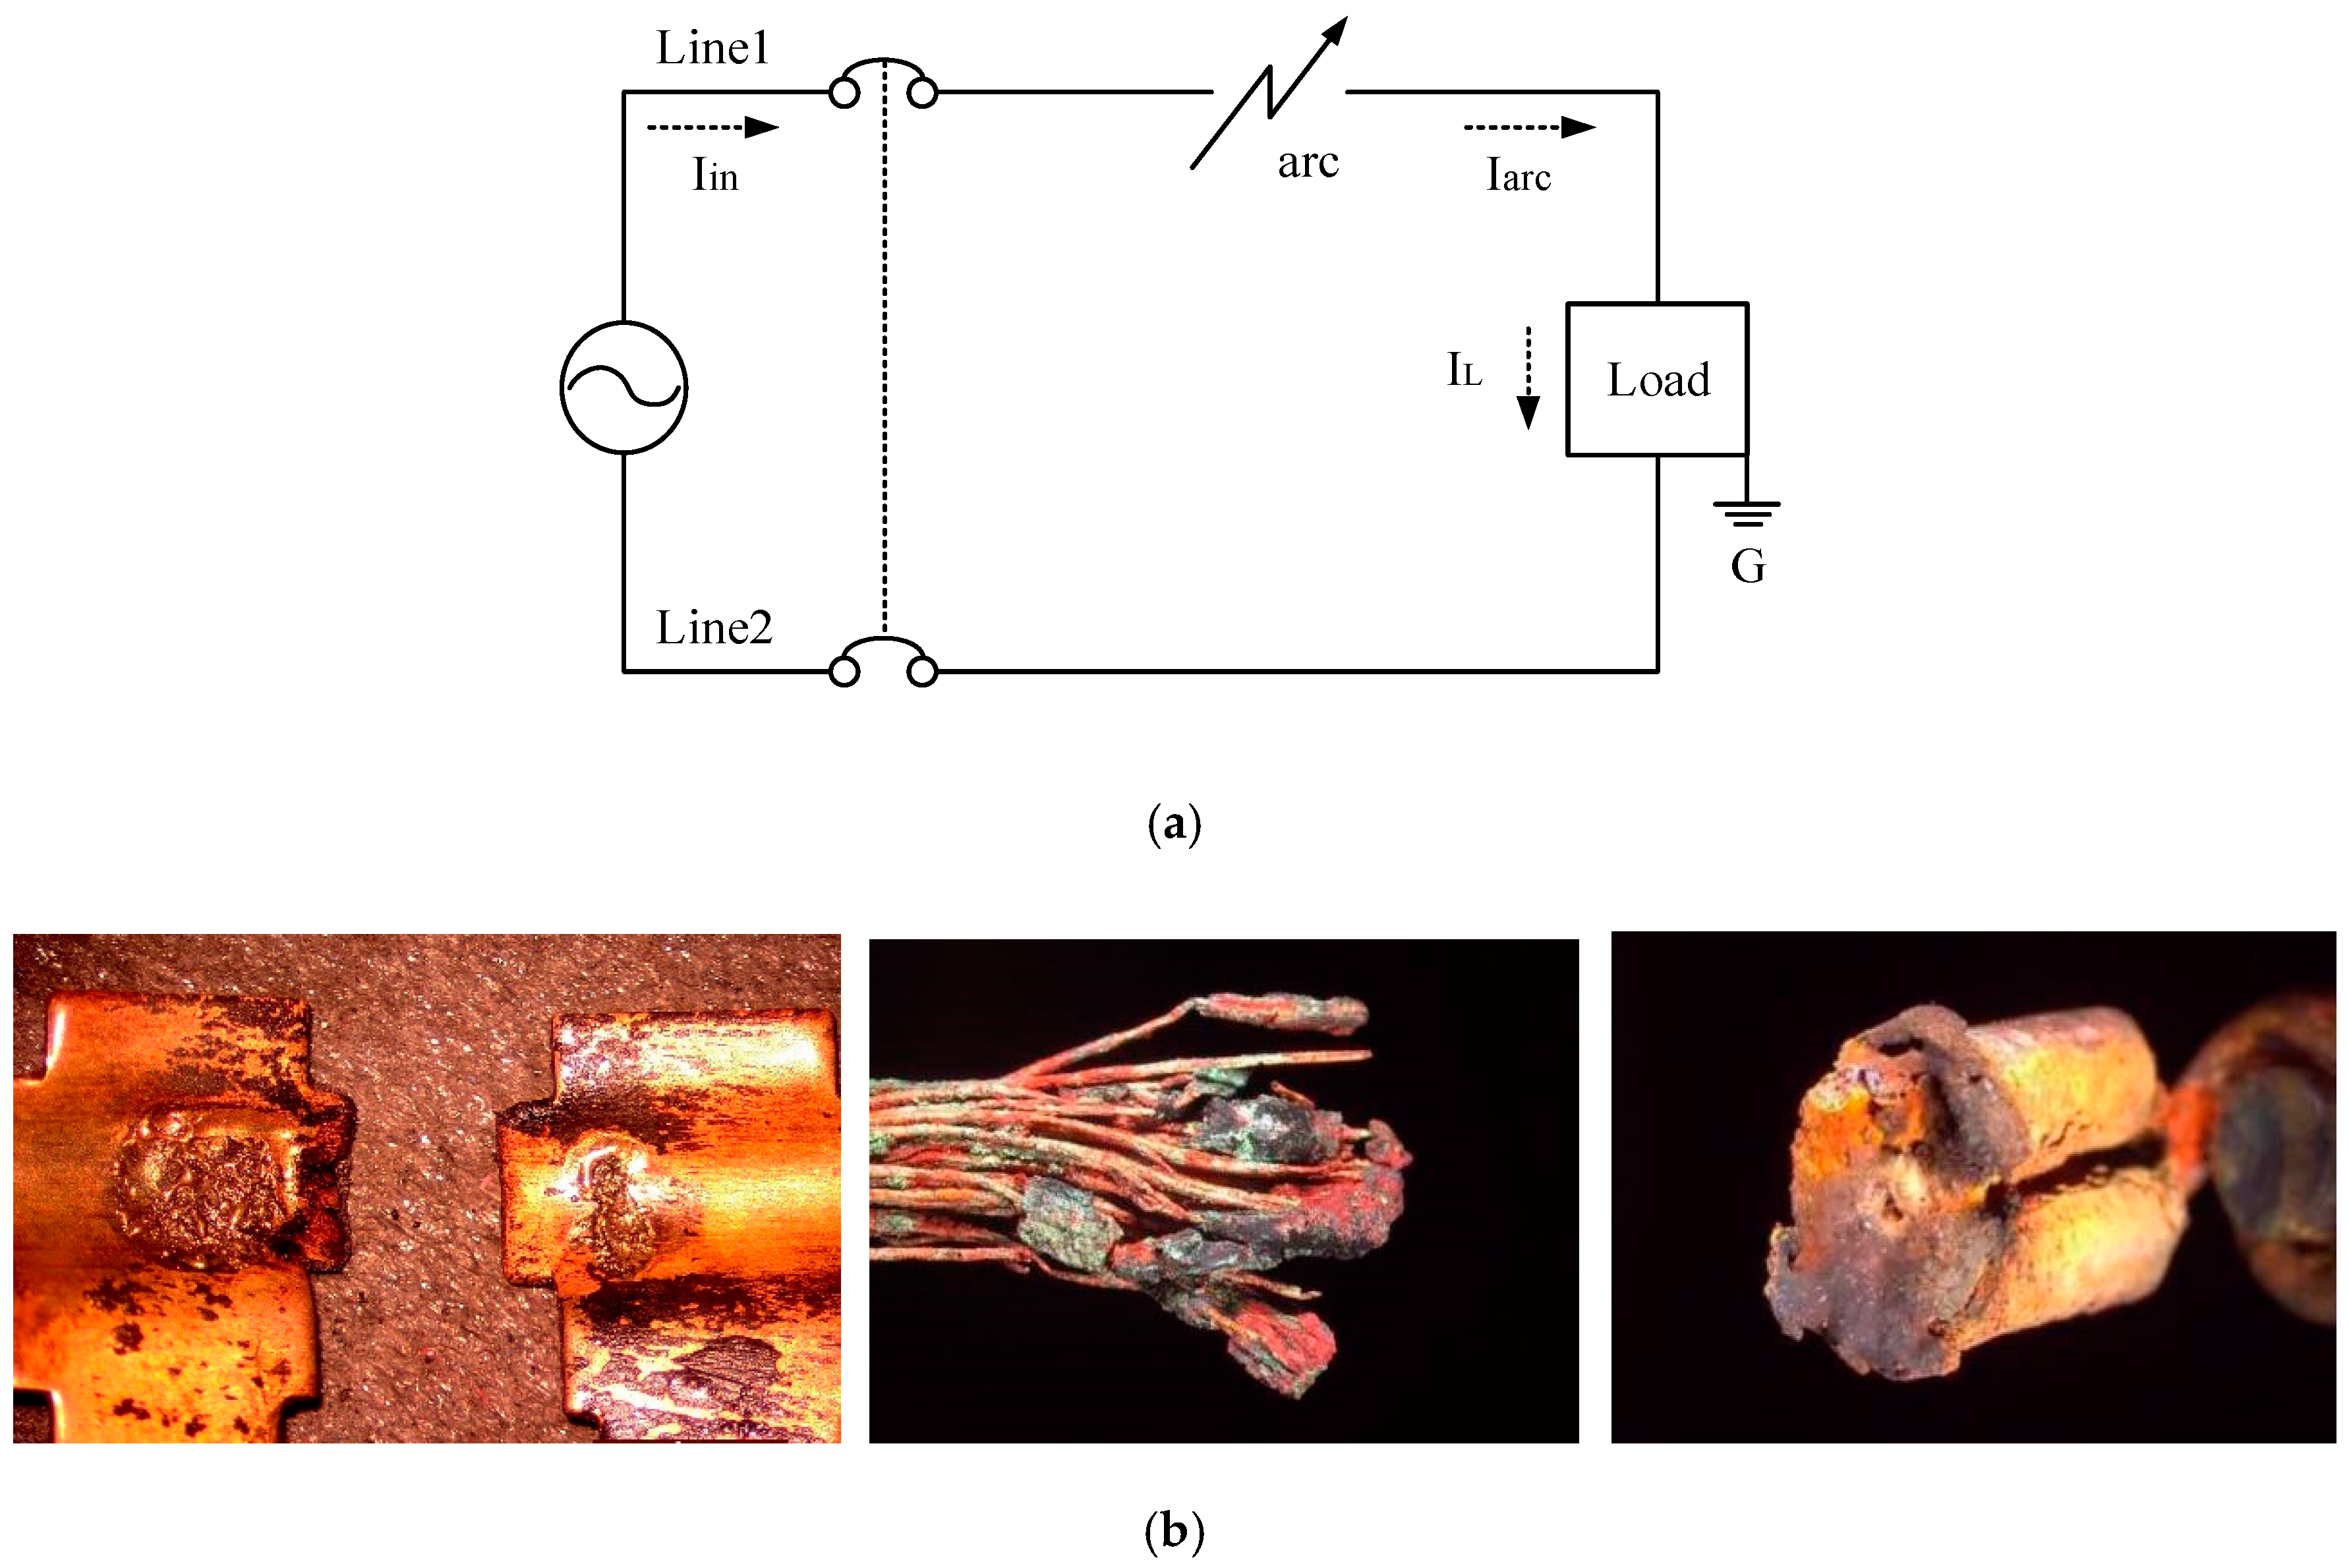
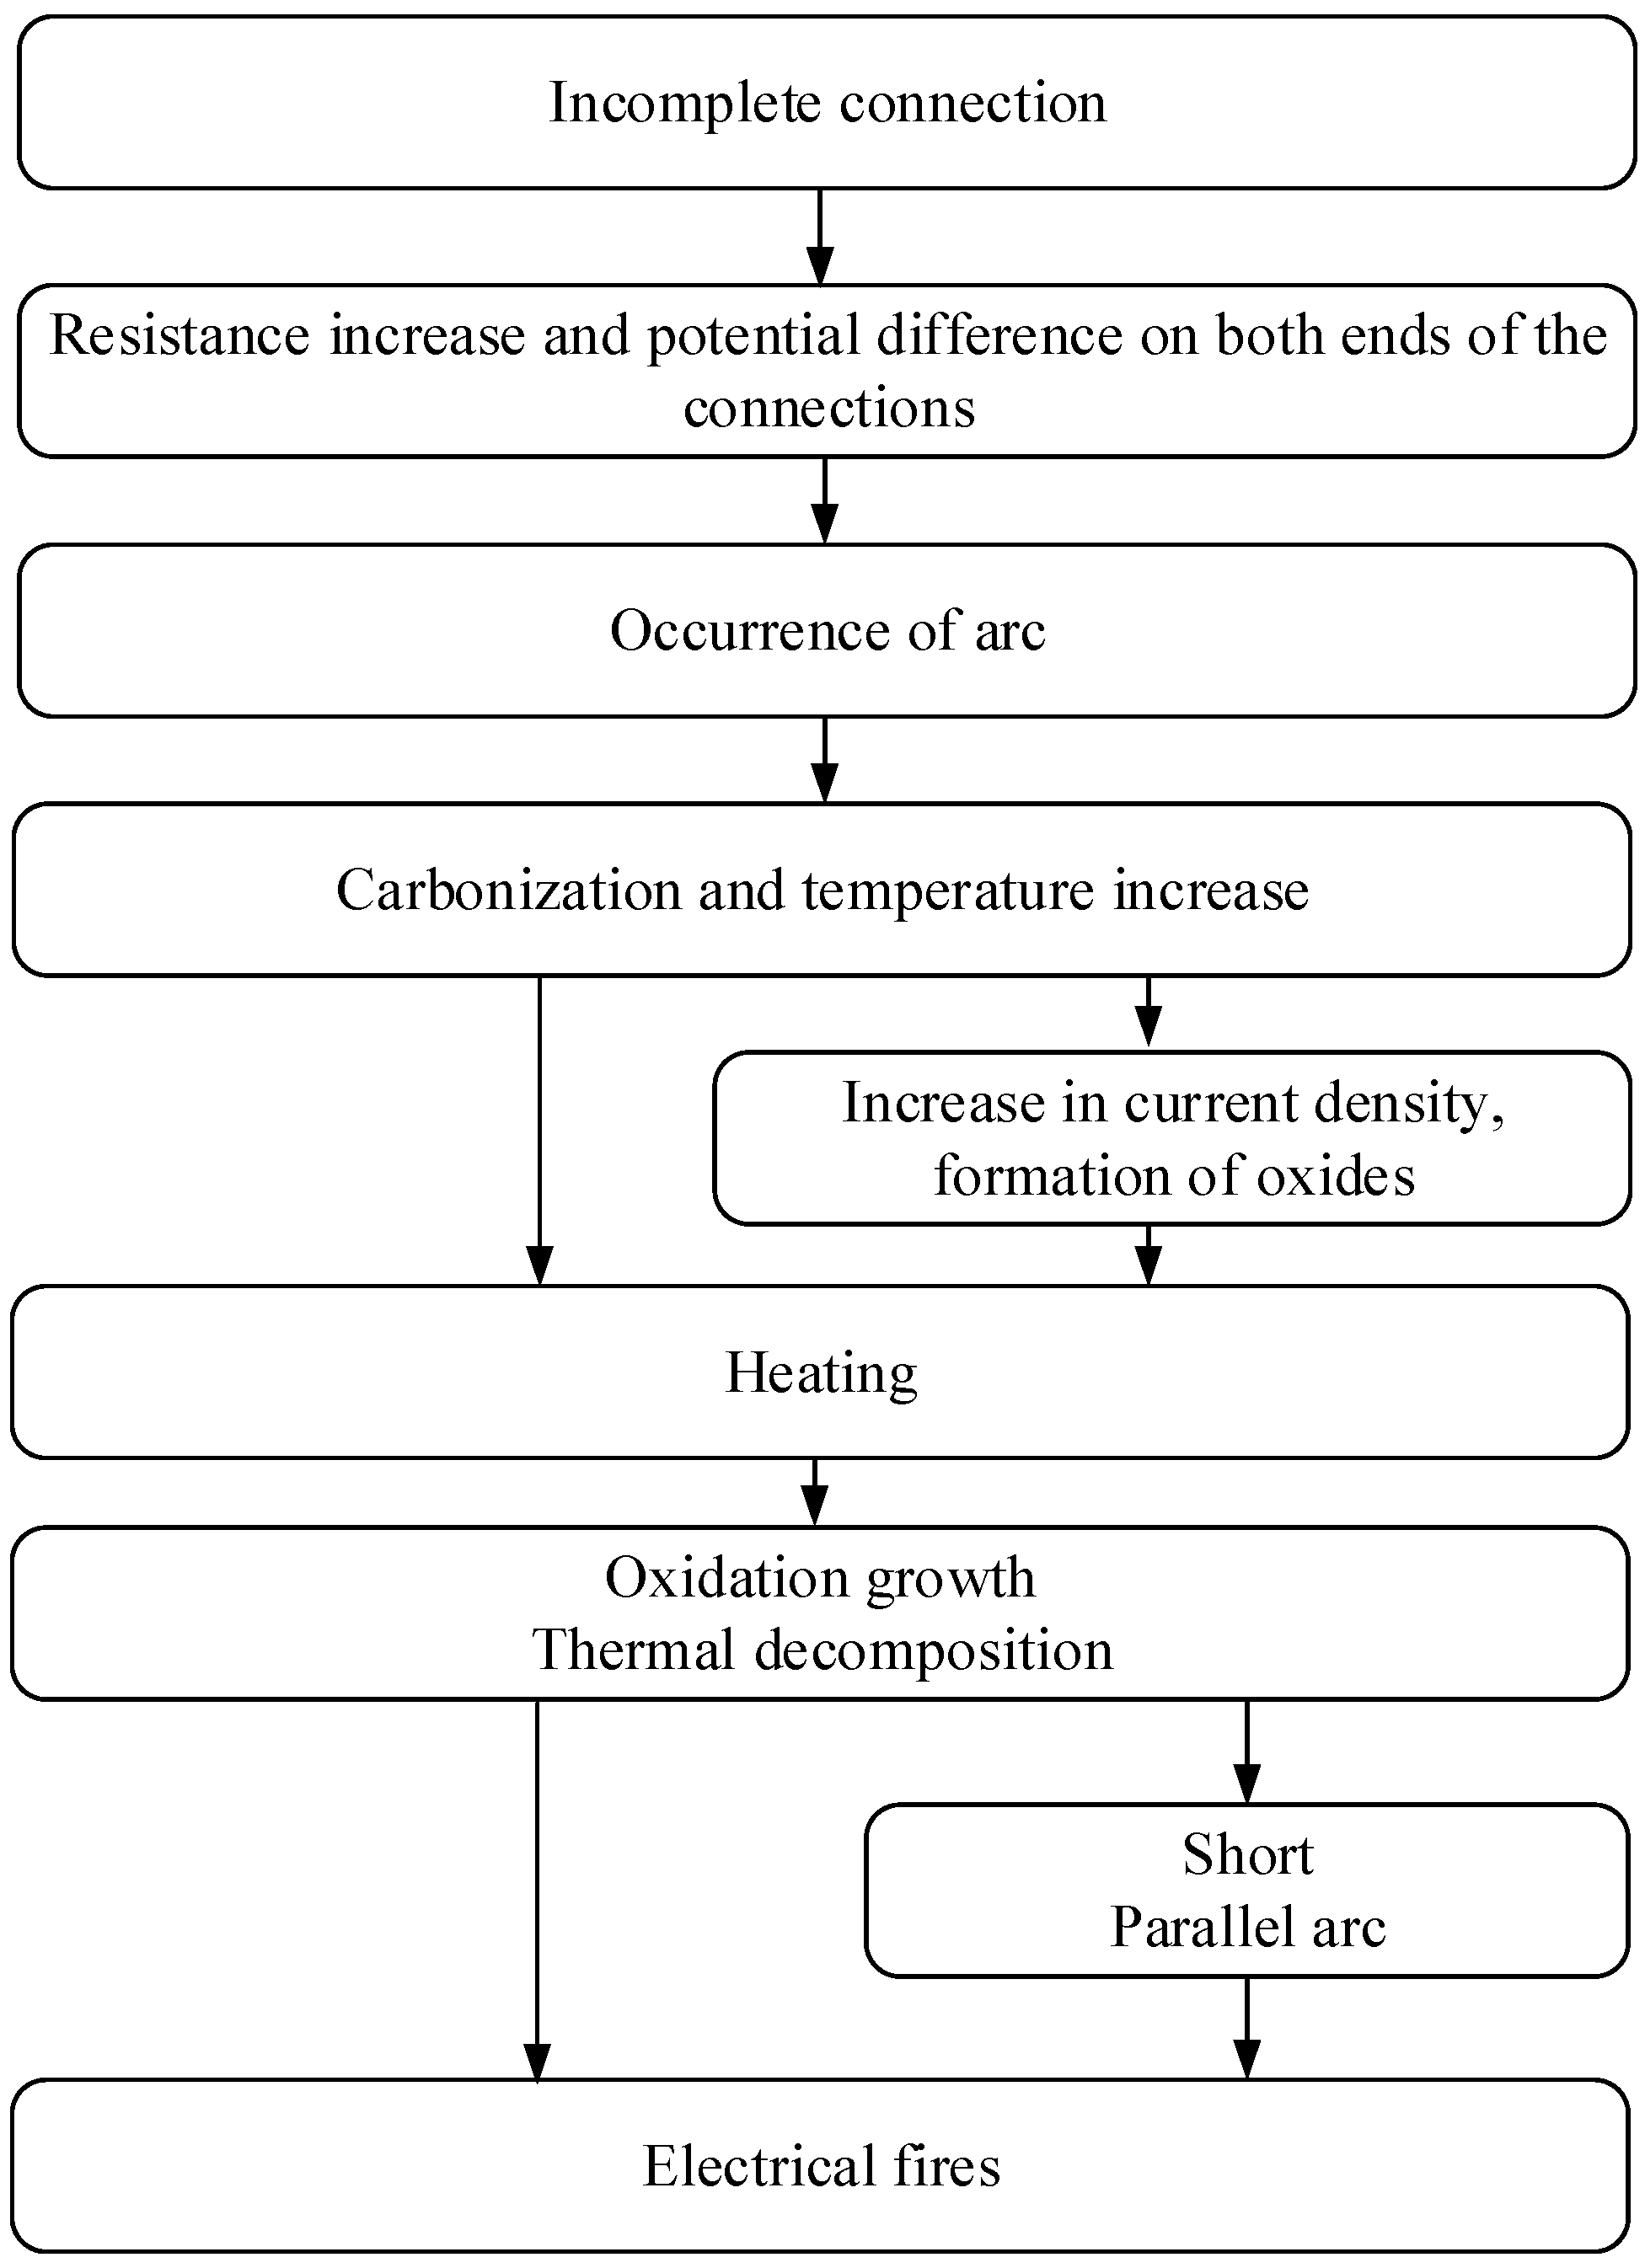
2. Series Arc
3. Experiment and Analysis
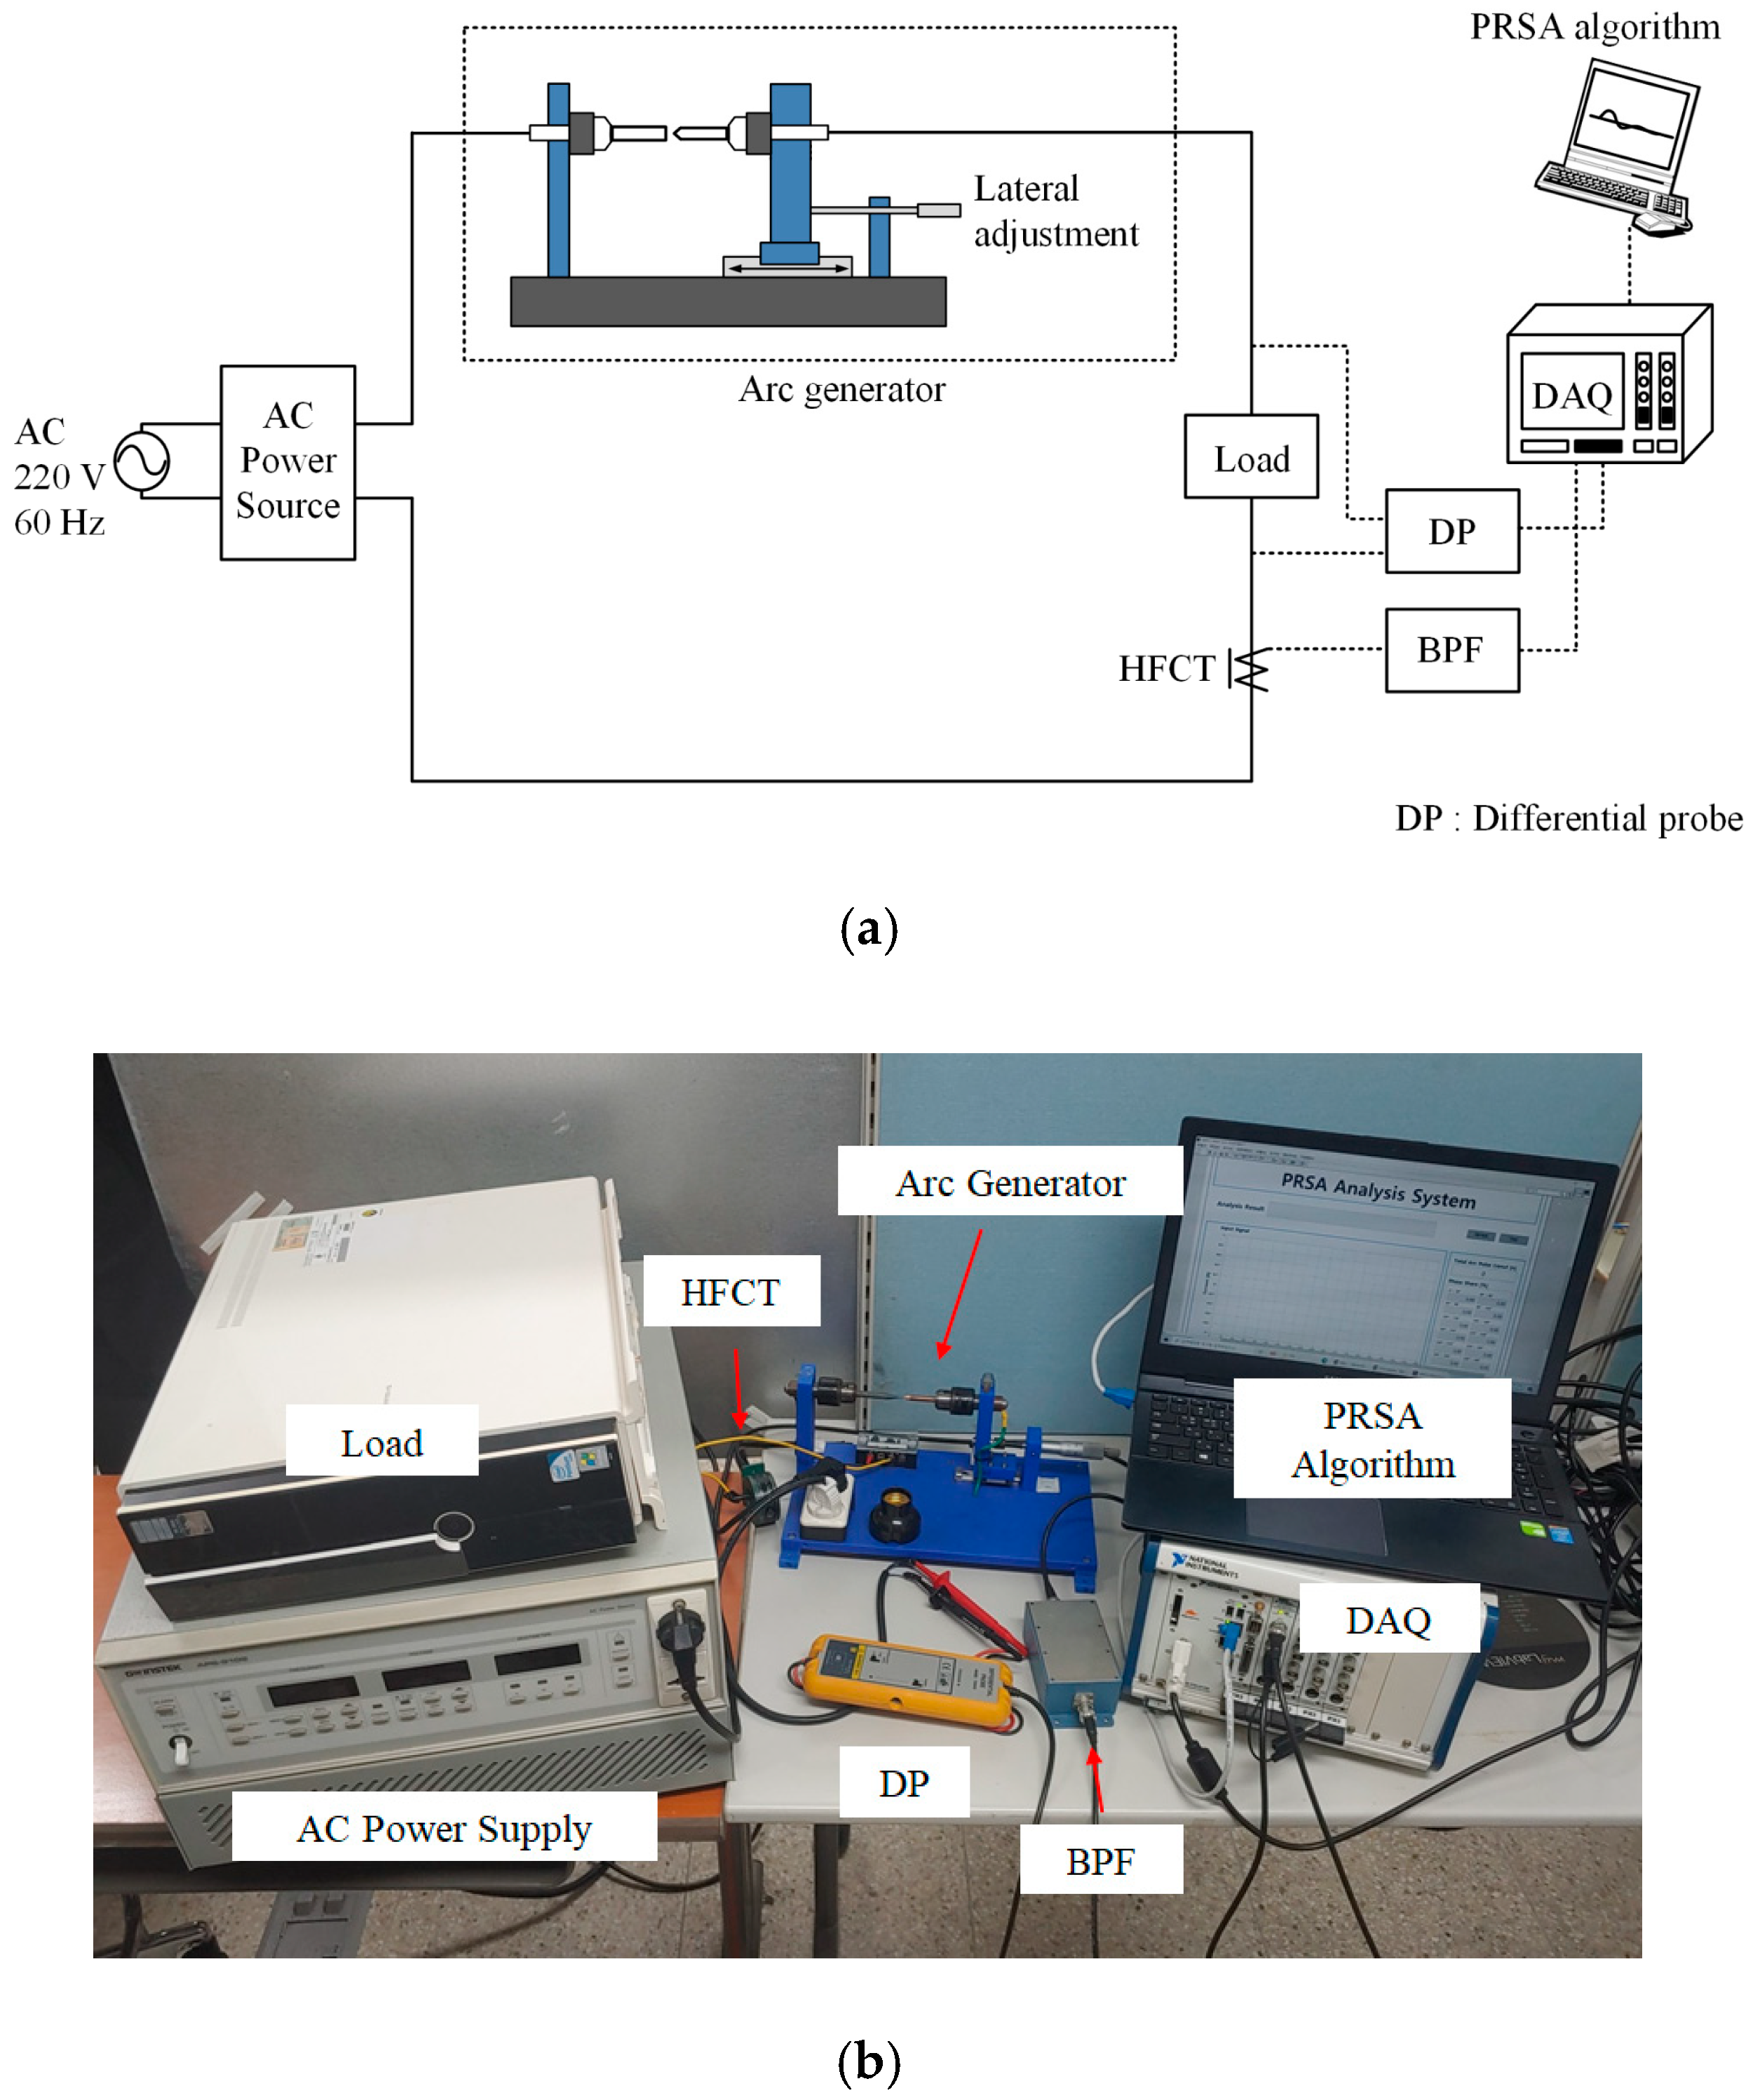
3.1. Experimental Setup
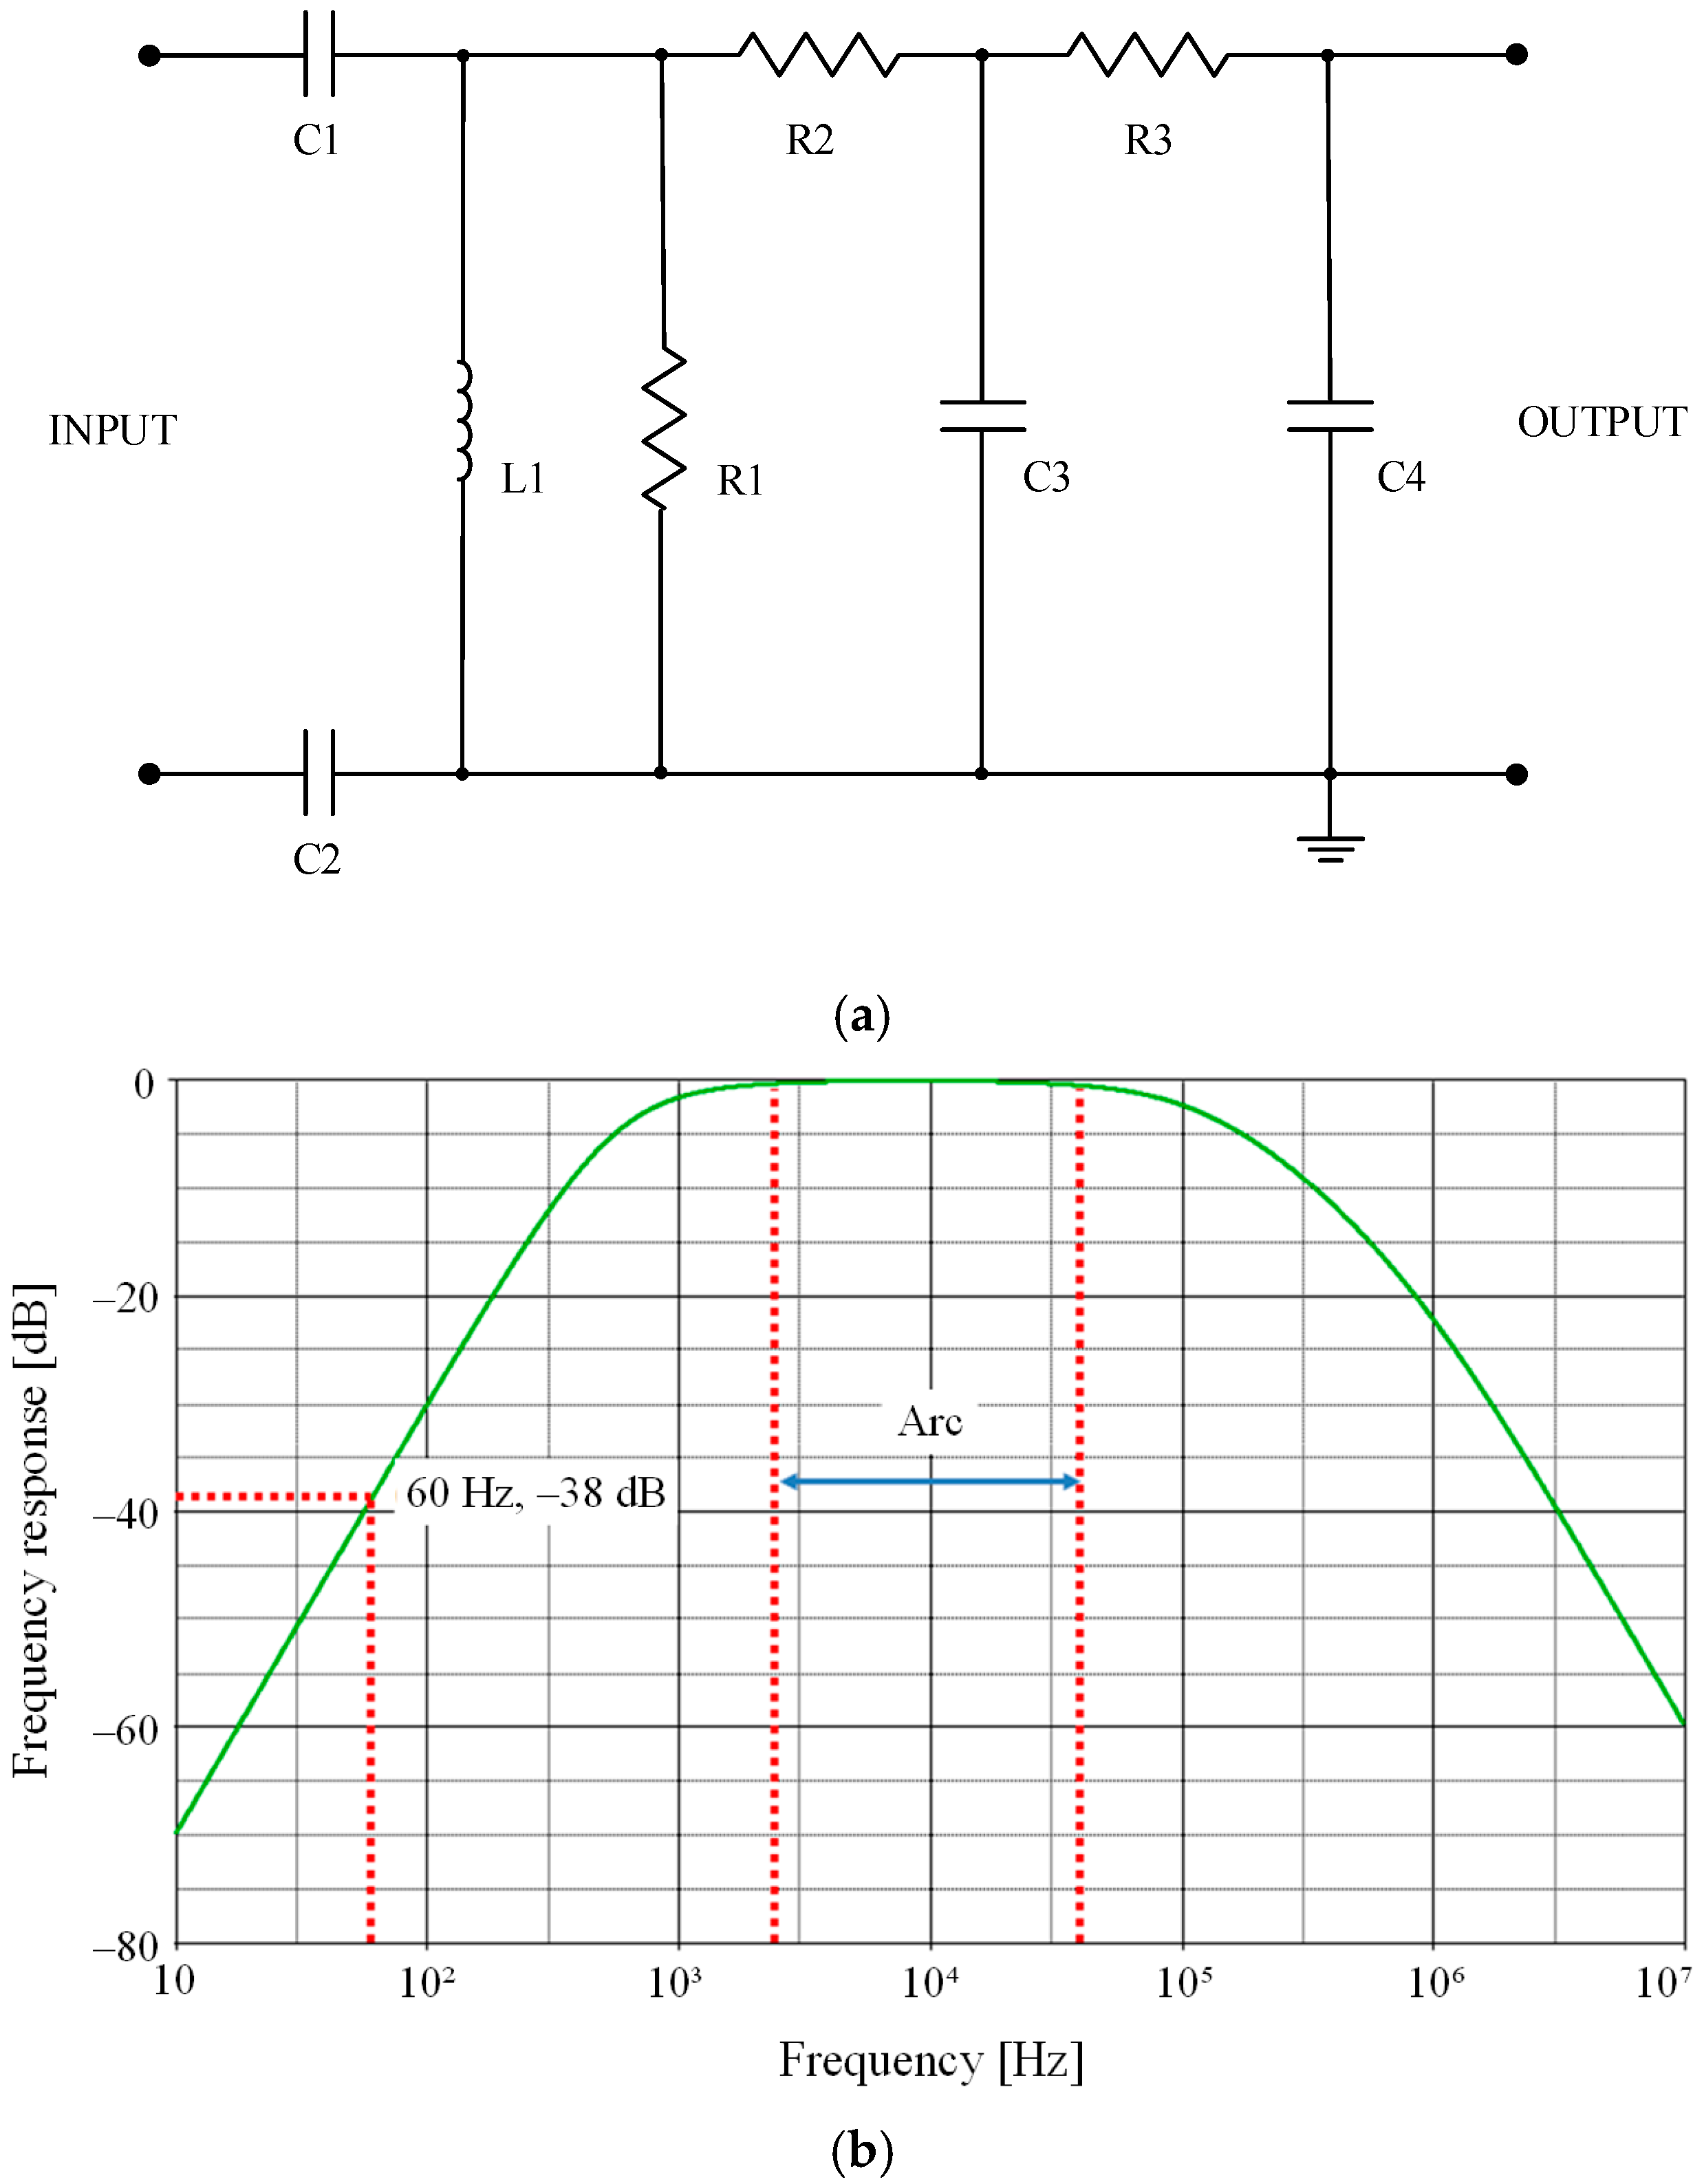
3.2. Design of a Series Arc Detection Filter
- •
- A high-pass filter consists of a capacitor, an inductor and a resistance as C1-L1-R1.
- •
- Two low-pass filters consist of resistances and capacitors as R2-C3 and R3-C4.
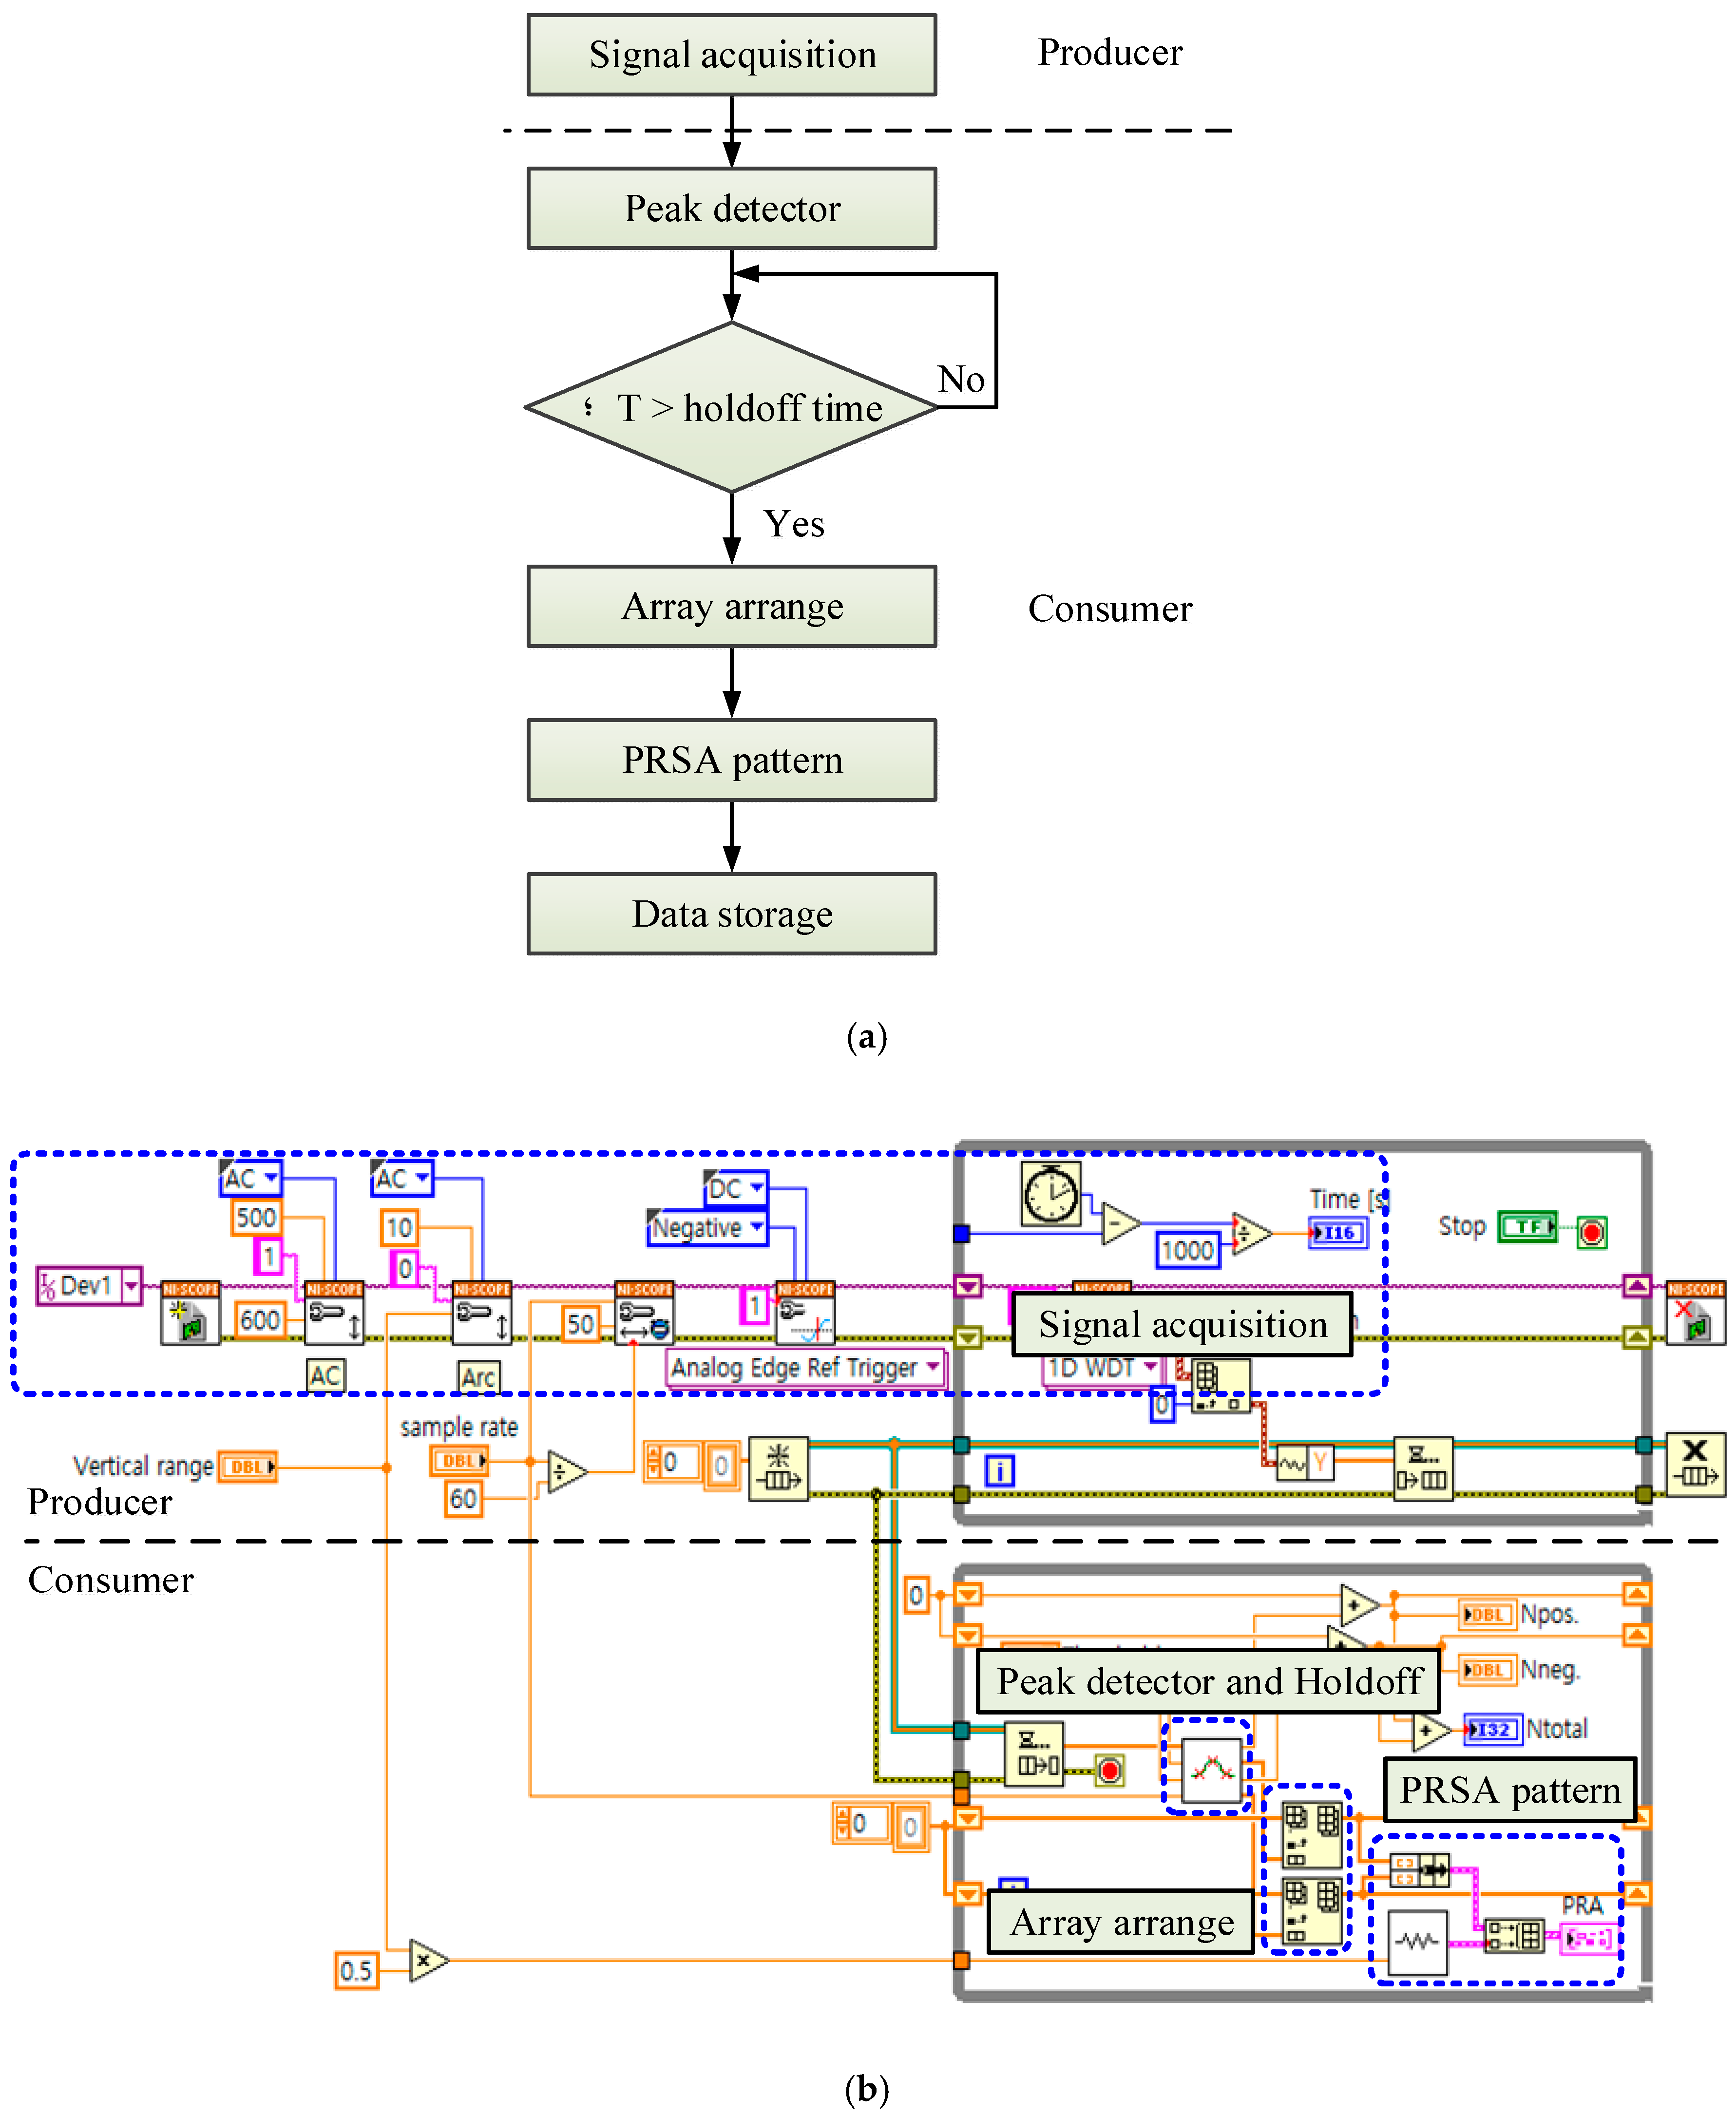
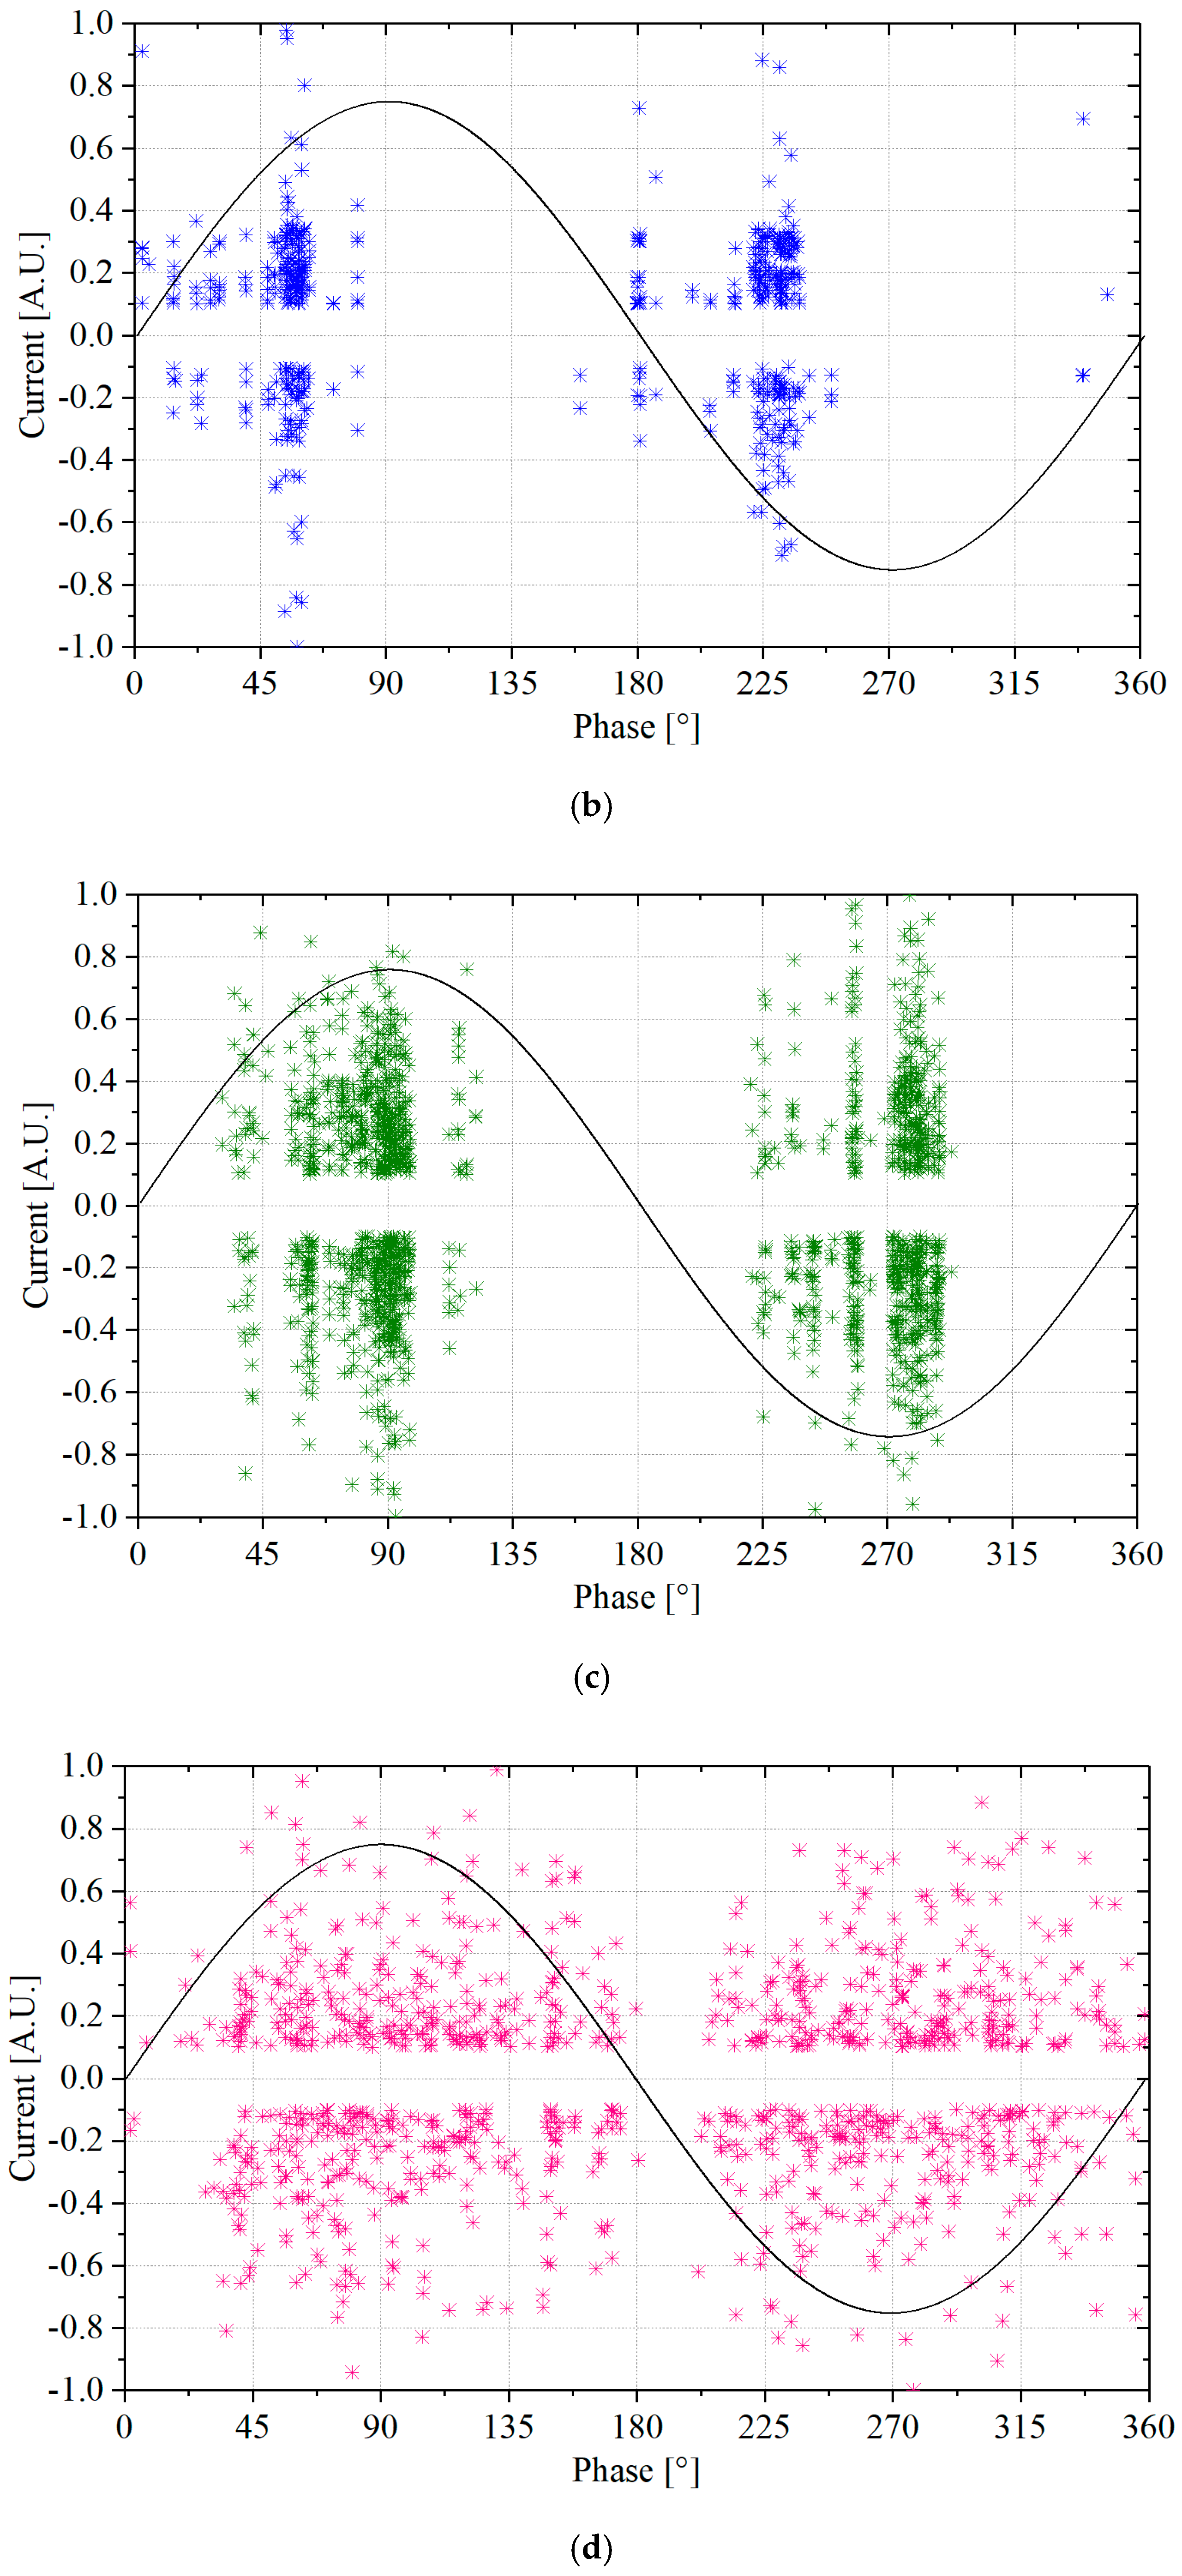
3.3. Phase-Resolved Series Arc (PRSA) Analysis for Low-Voltage Electrical Devices
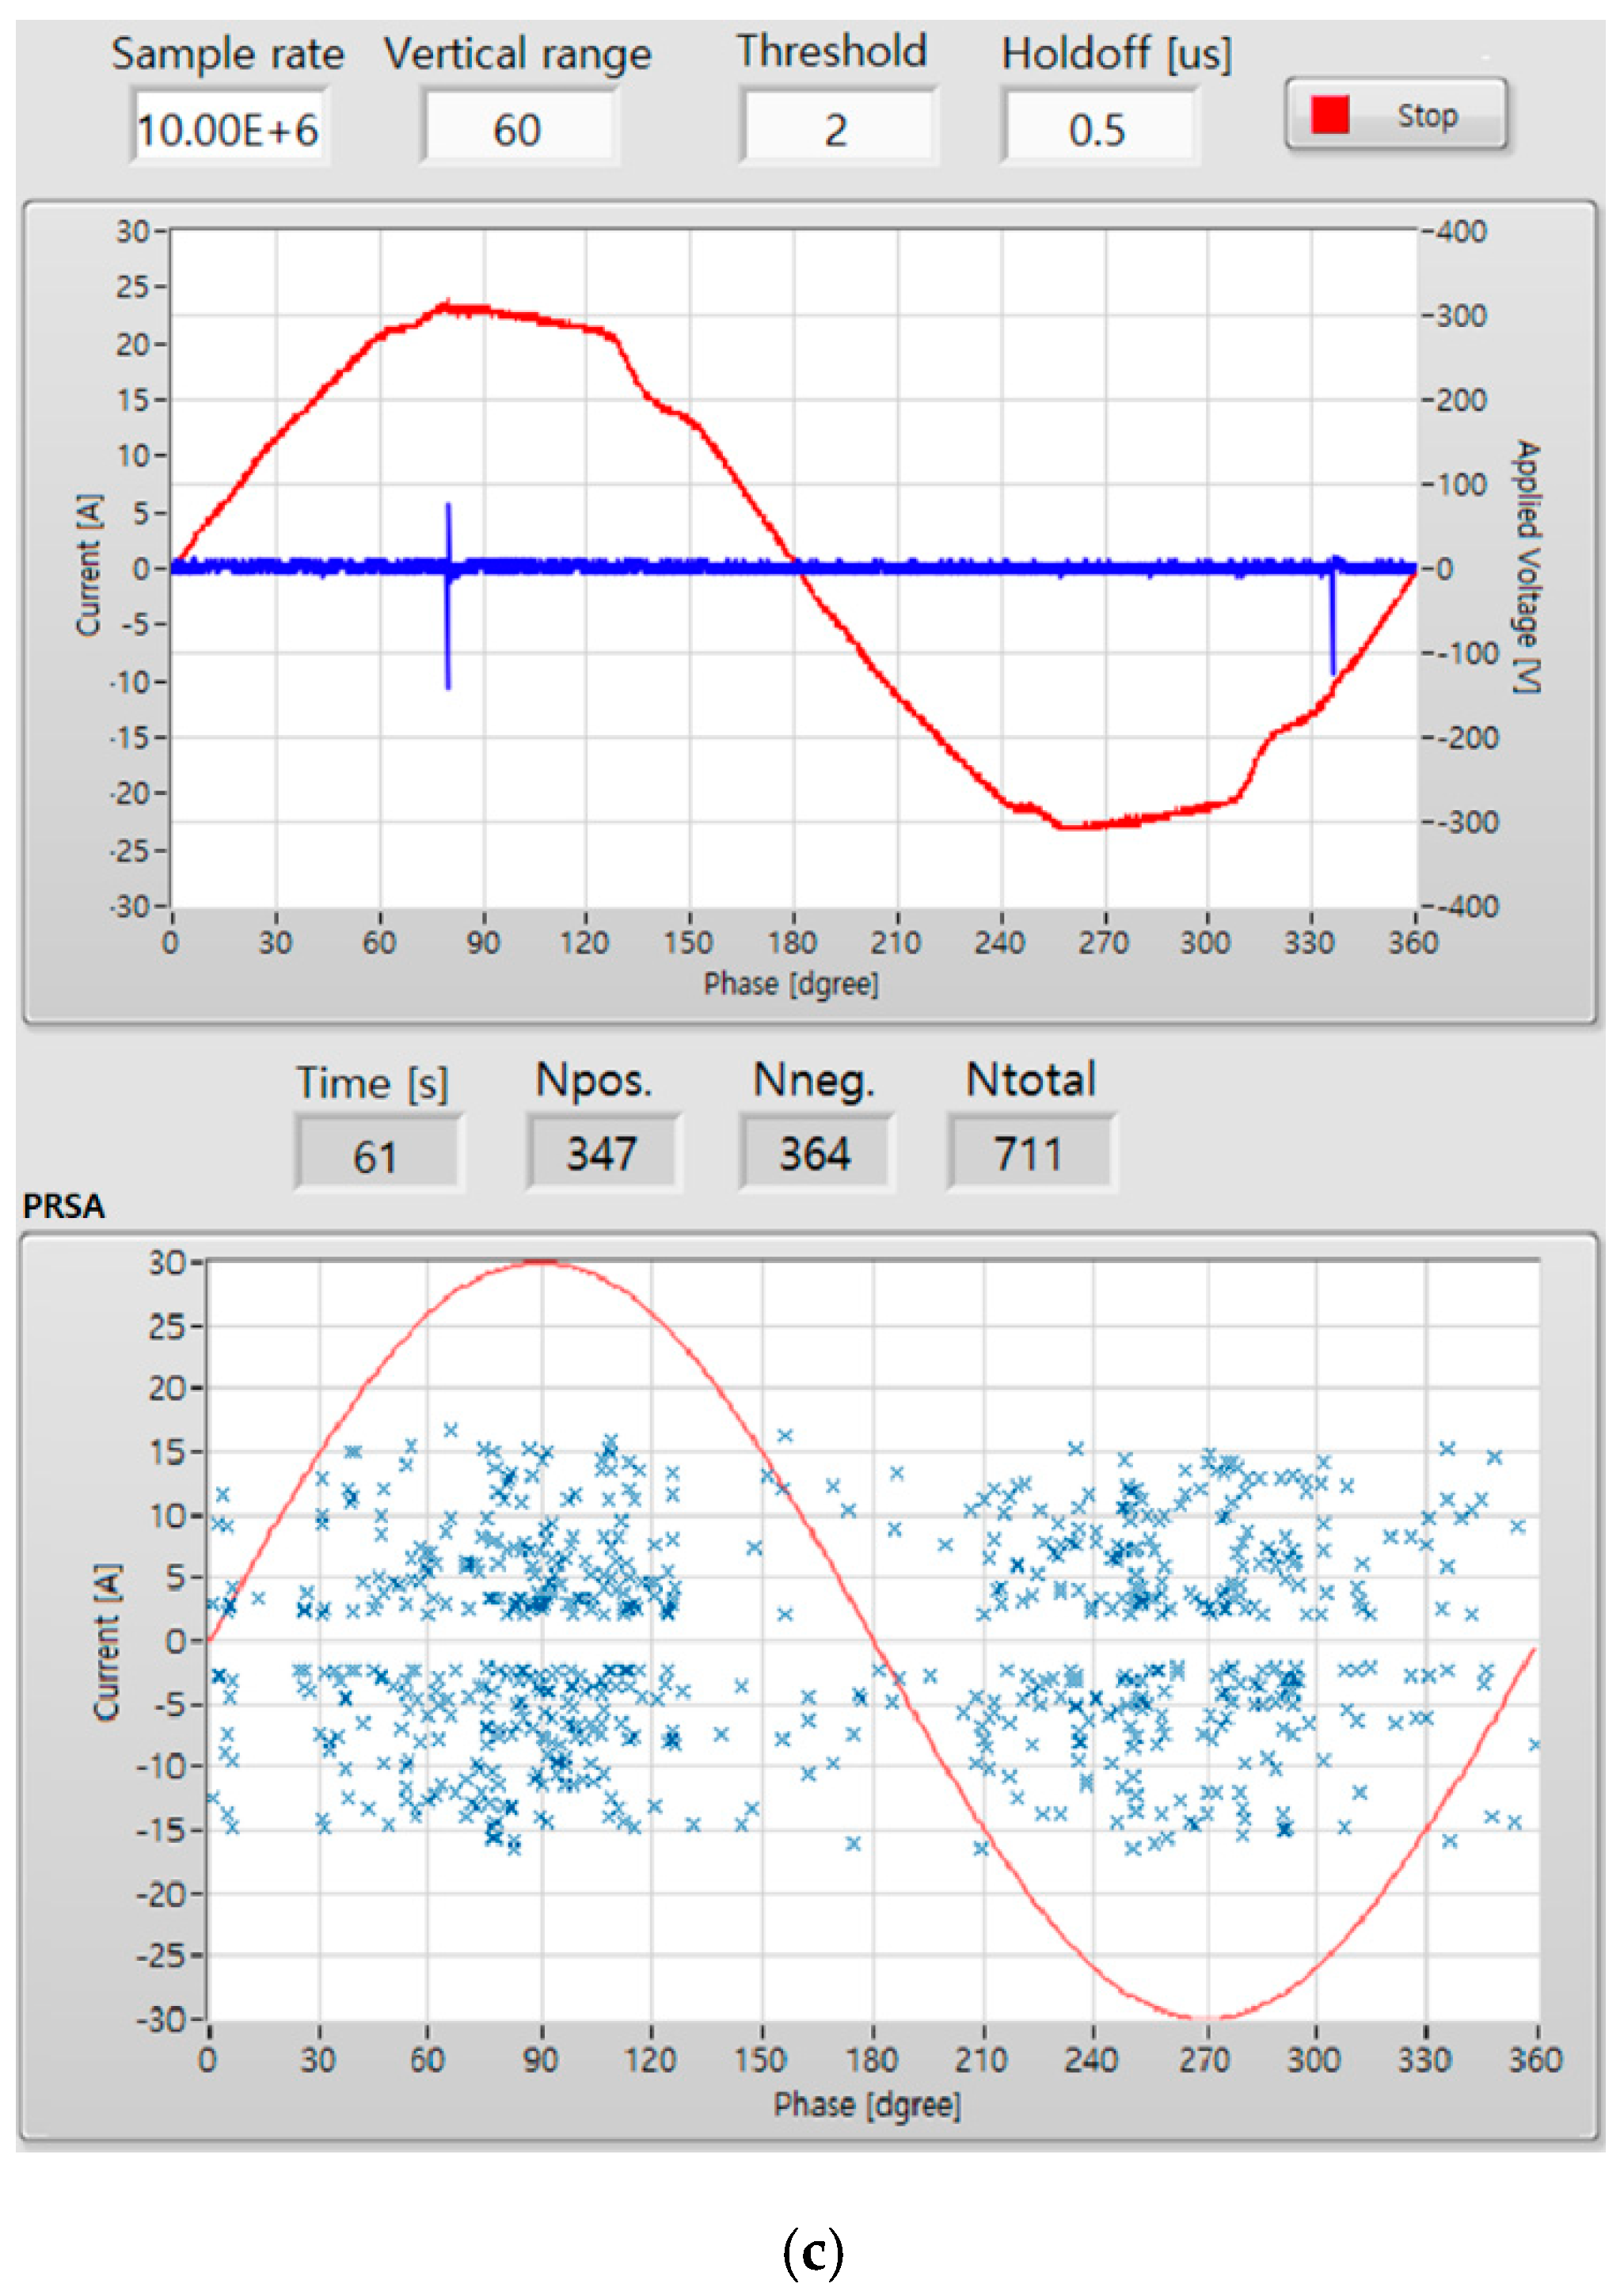
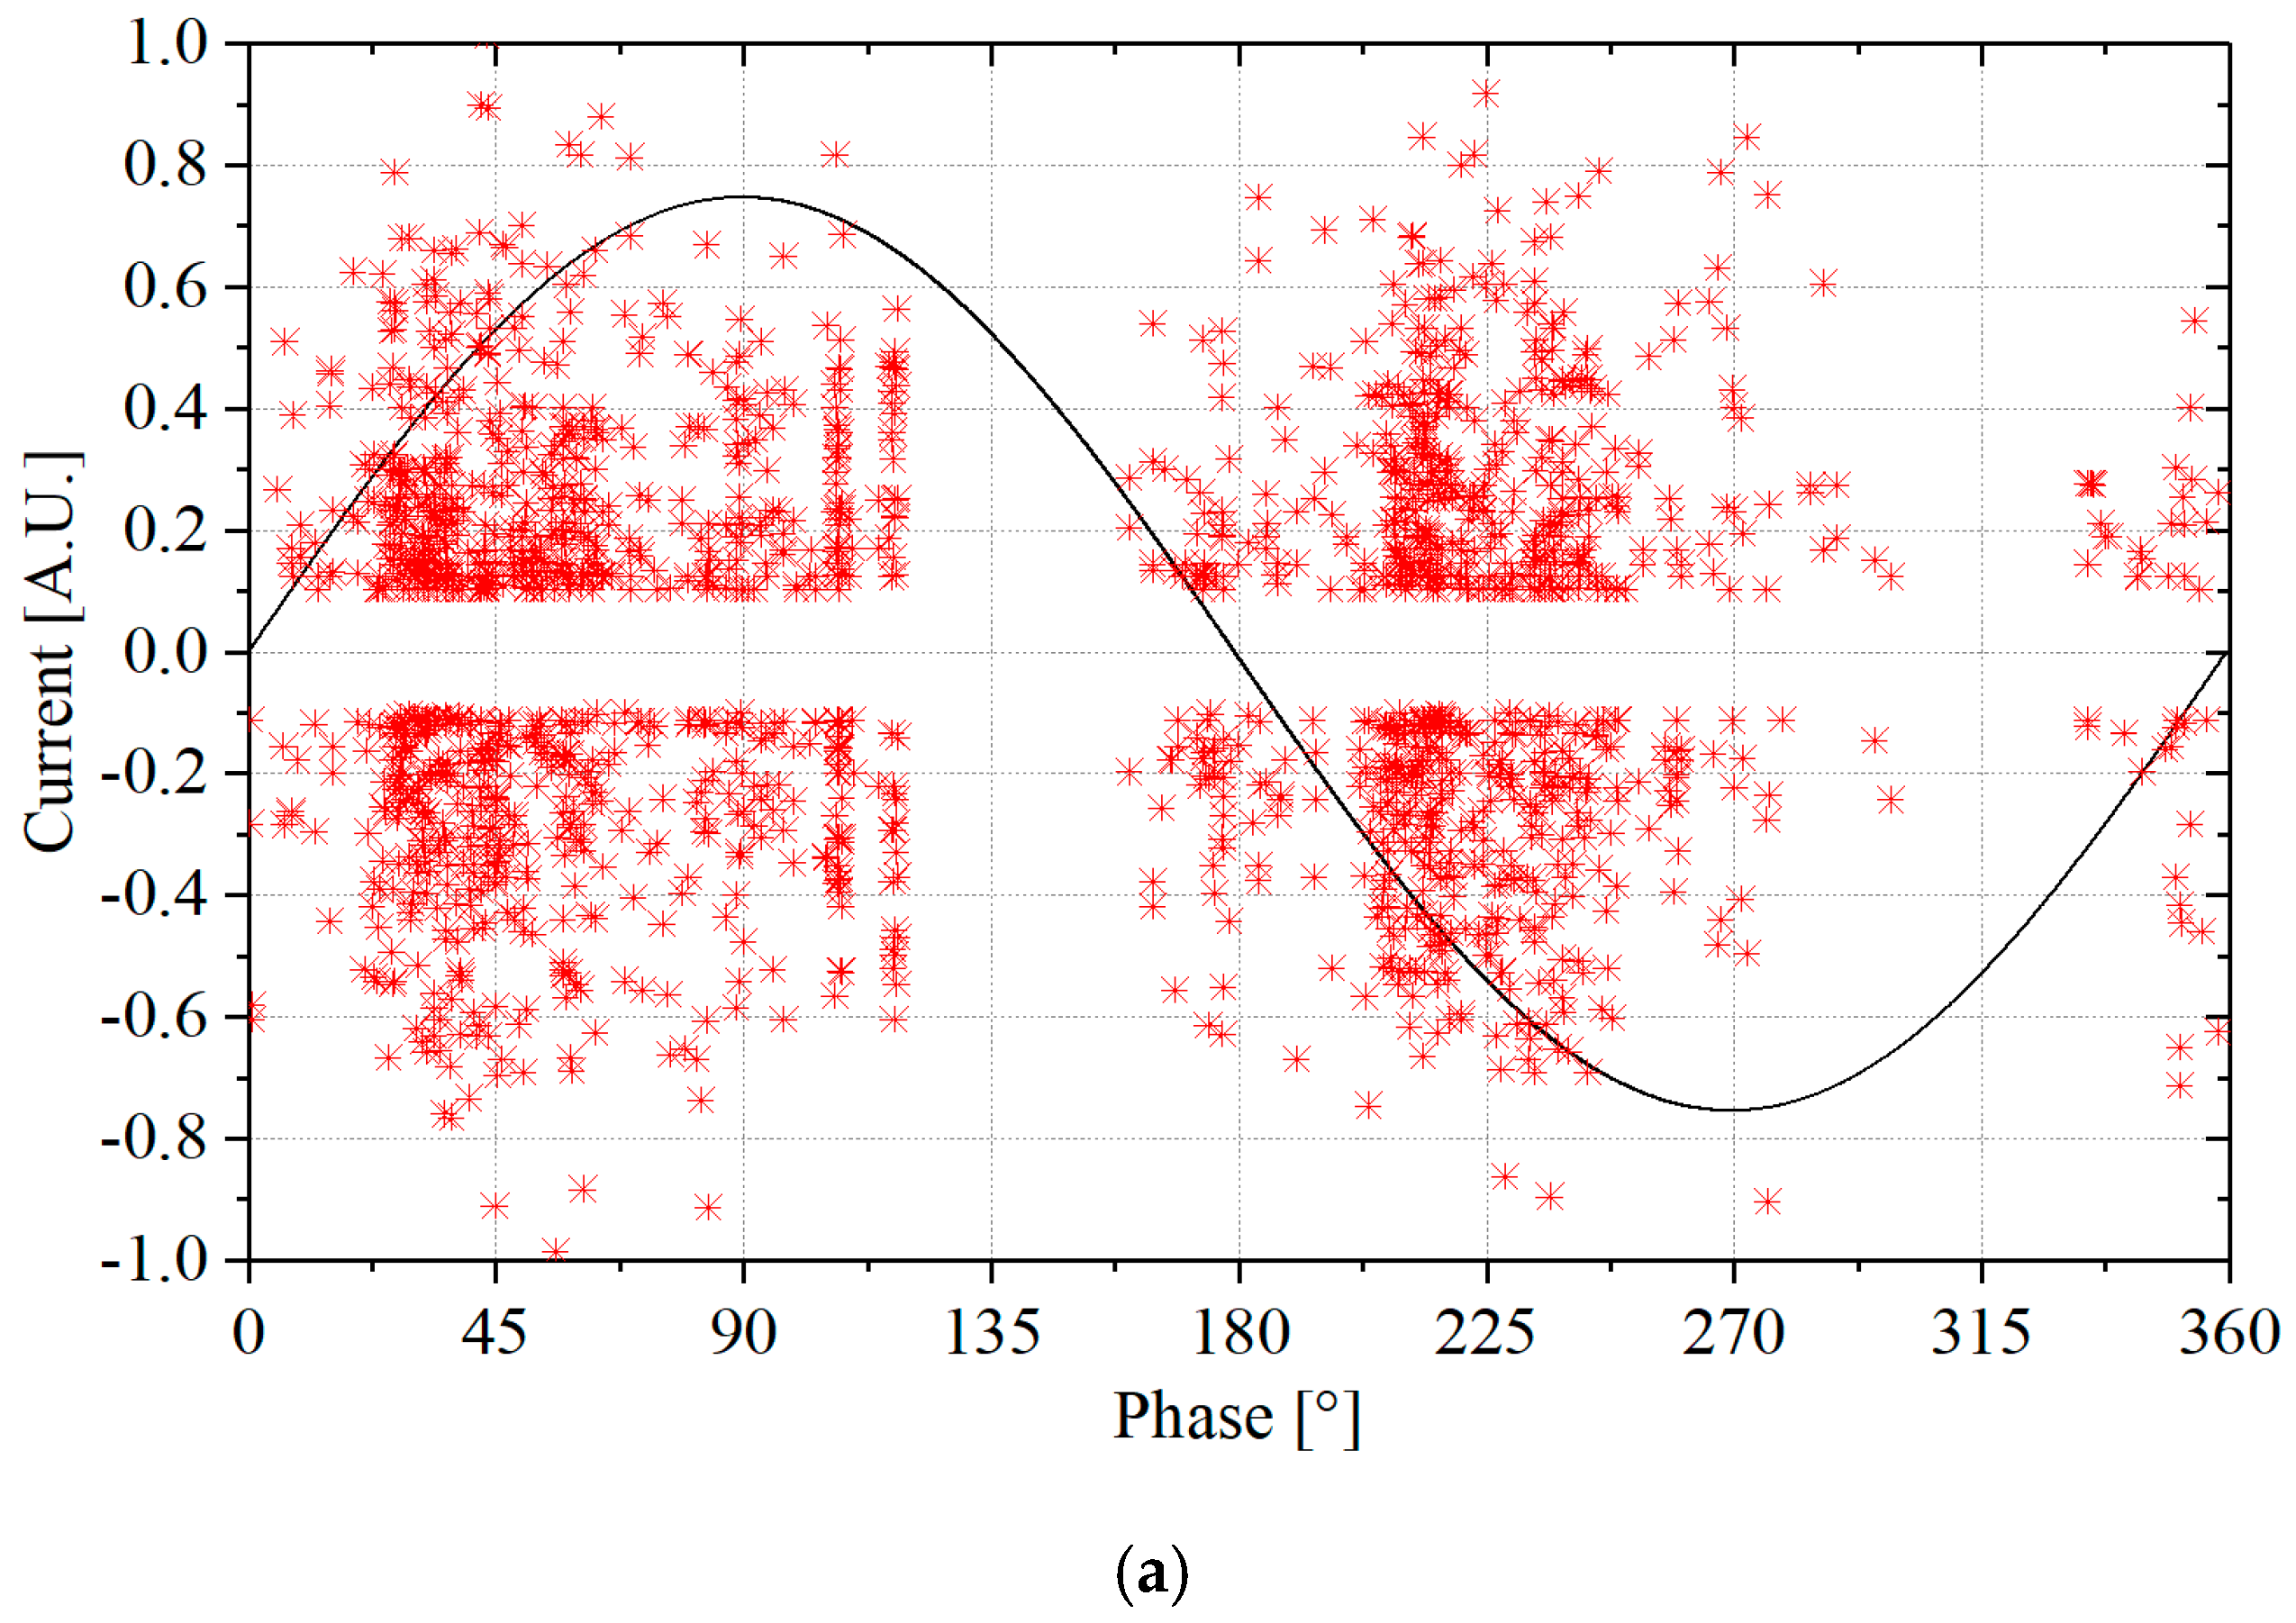
3.4. Result of PRSA Analysis
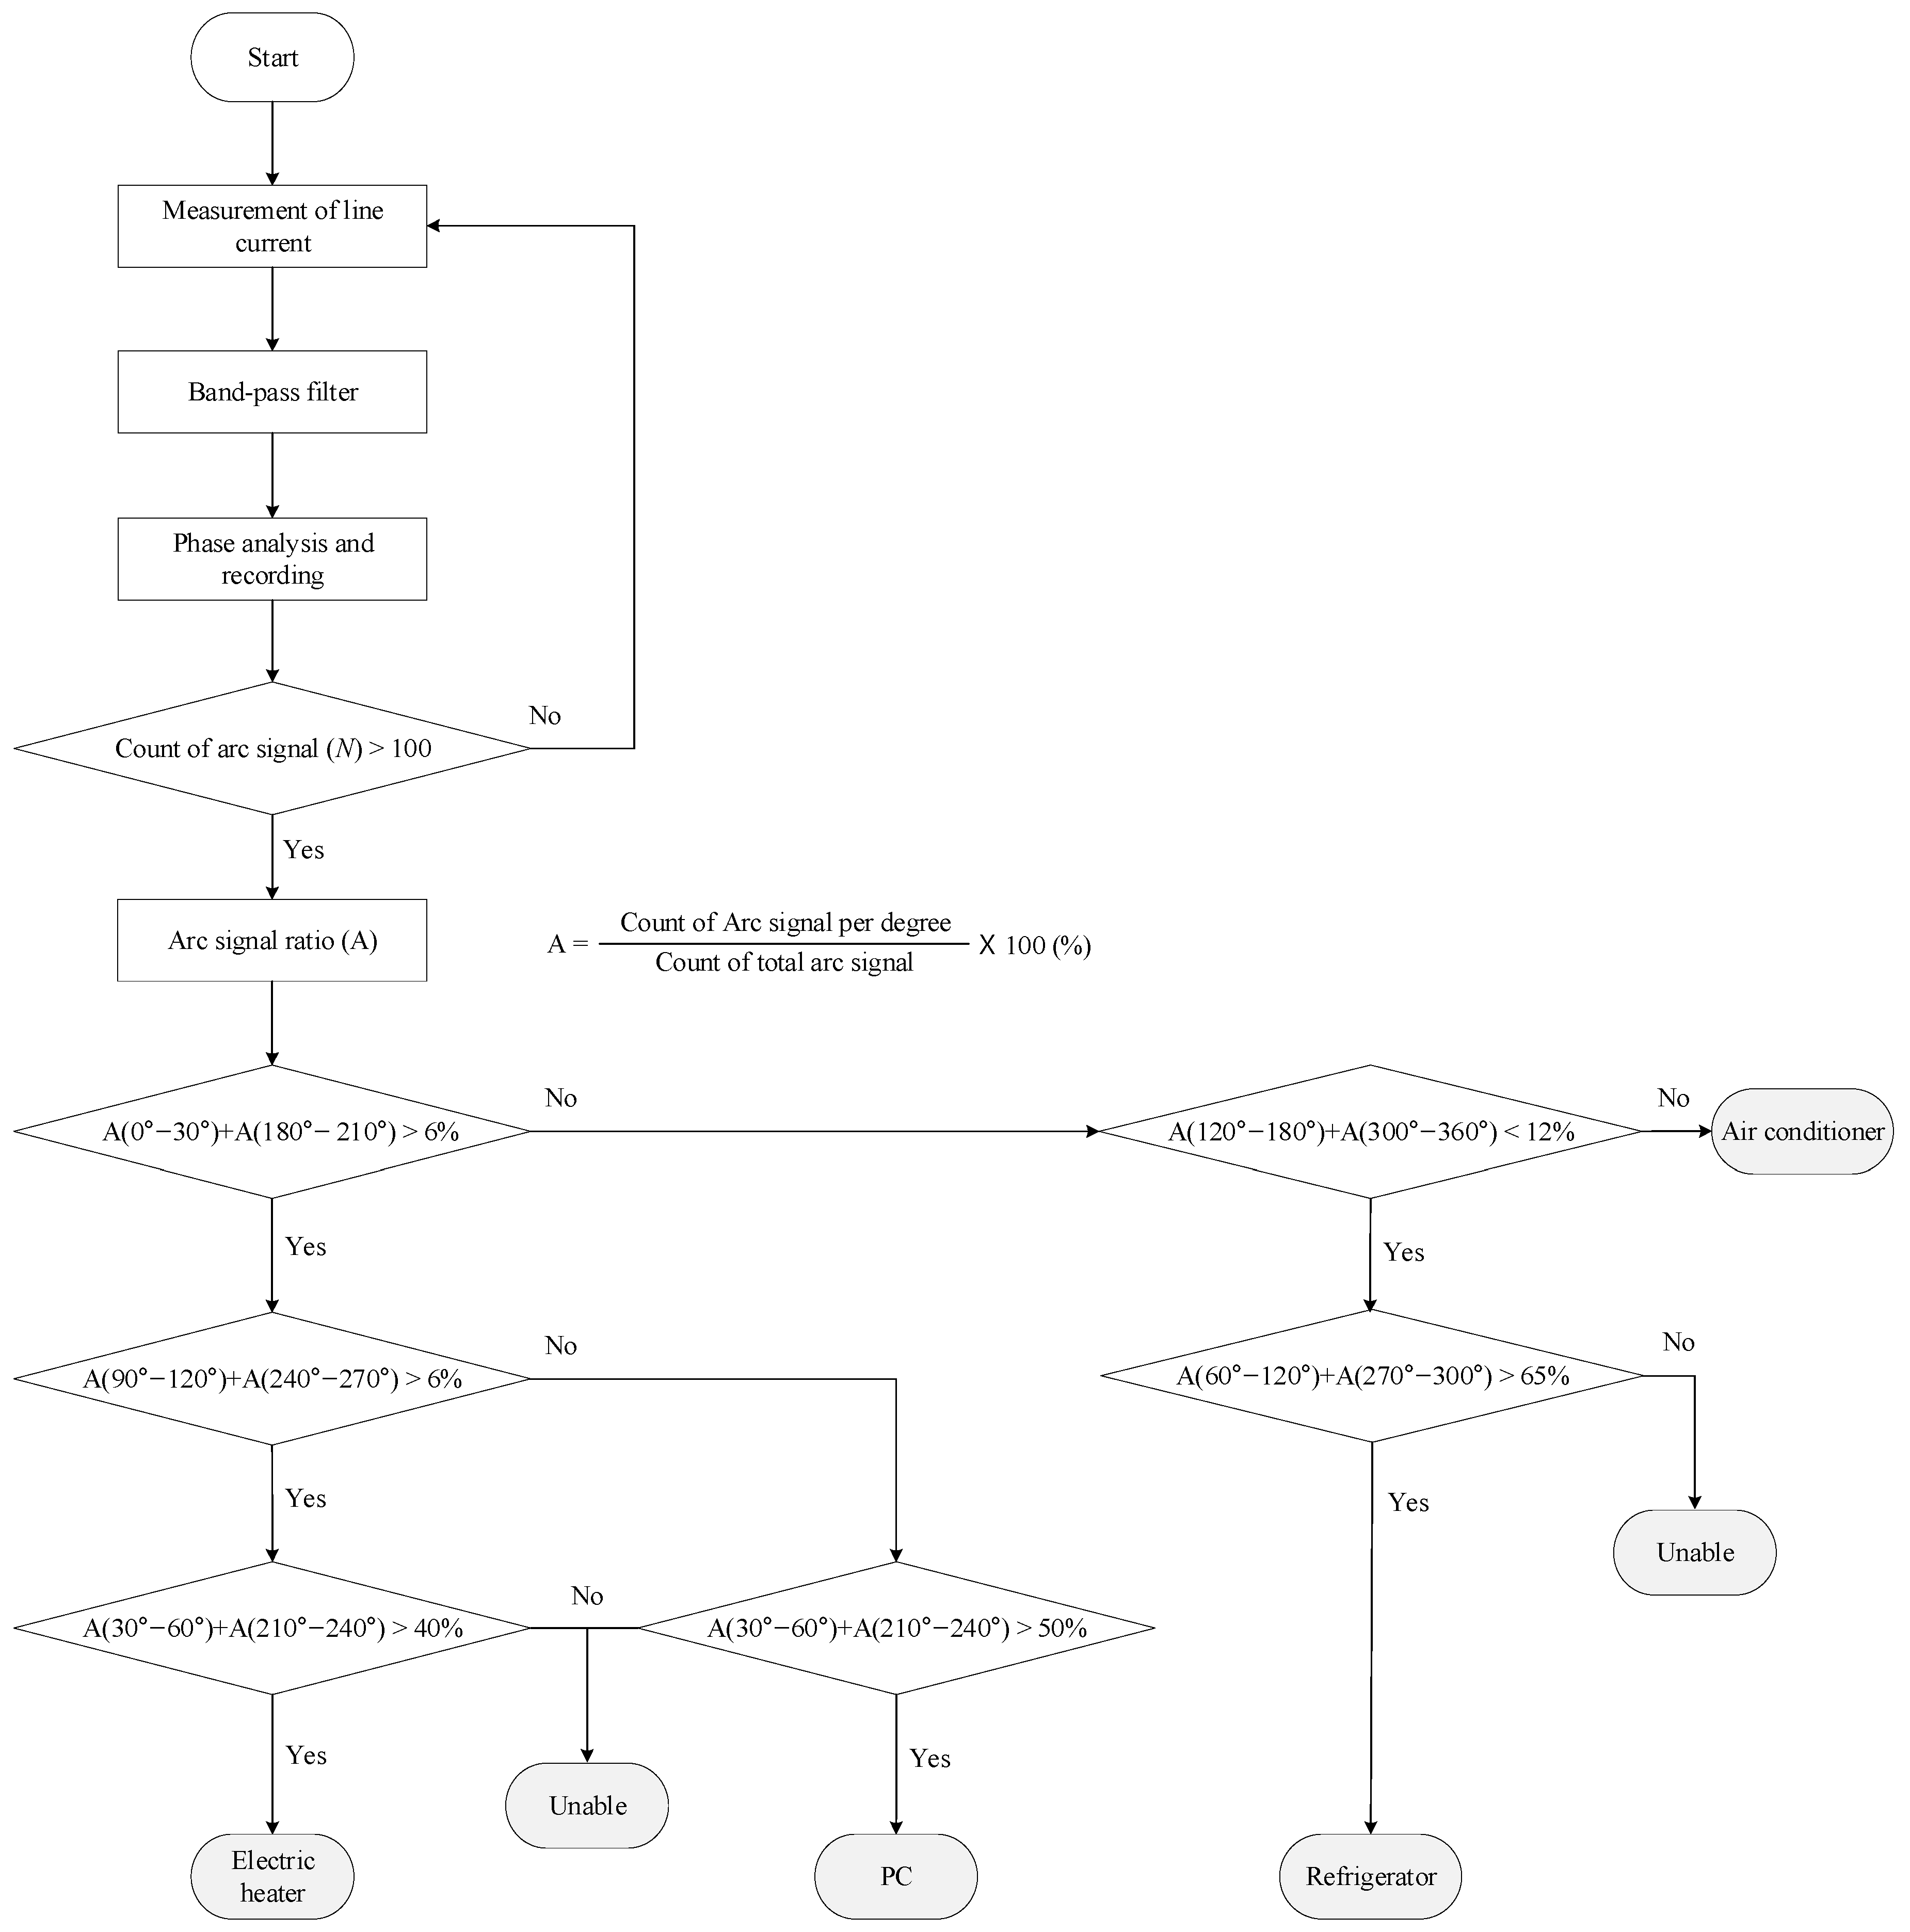
4. Algorithm for Load Identification
4.1. Development of the Algorithm
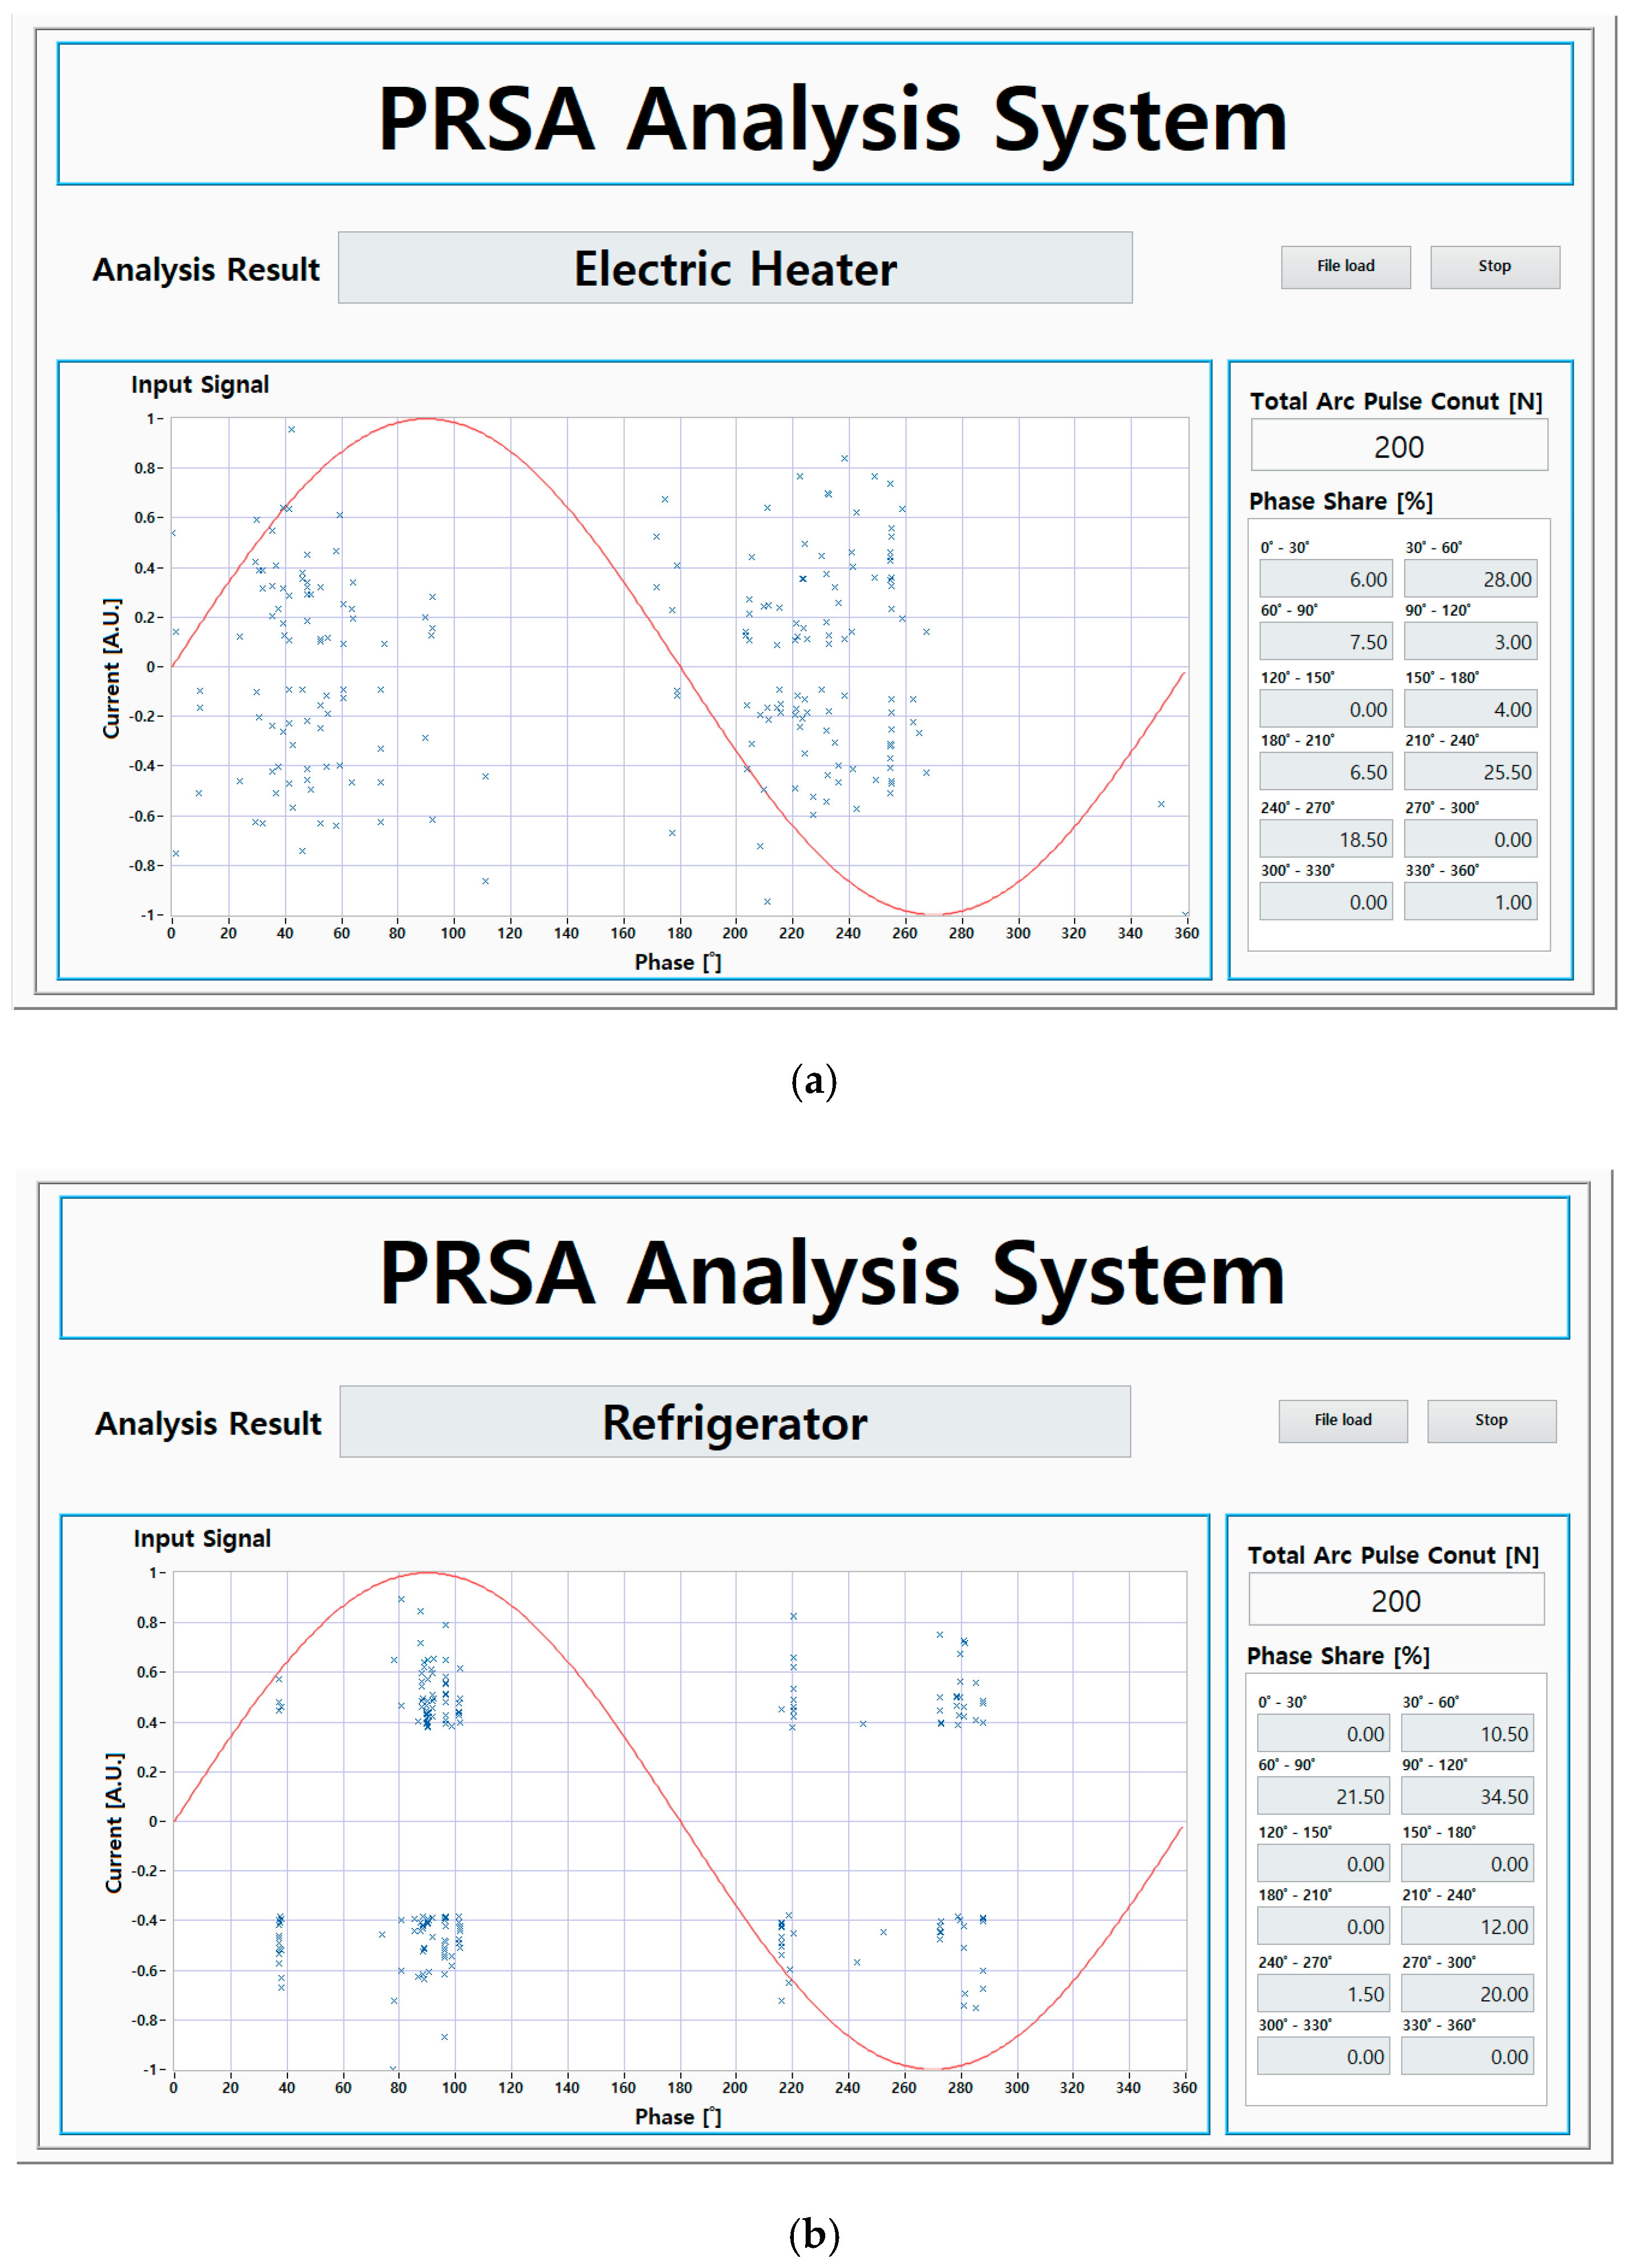
4.2. Case Studies
5. Conclusions
Author Contributions
Funding
Conflicts of Interest
References
- National Fire Data System. Available online: http://www.nfds.go.kr/ (accessed on 1 September 2020).
- John, J.S. Condition for series arcing phenomena in PVC Wiring. IEEE Trans. Compon. Packag. Manuf. 2007, 30, 532–537. [Google Scholar] [CrossRef]
- George, D.G.; Gary, W.S. The arc-fault circuit interrupter: An emerging product. IEEE Trans. Ind. Appl. 1998, 34, 928–933. [Google Scholar] [CrossRef]
- Moon, W.S.; Kim, J.C.; Jo, A.; Bang, S.B.; Koh, W.S. Ignition characteristics of residential series arc faults in 220-V HIV wires. IEEE Trans. Ind. Appl. 2015, 51, 2054–2059. [Google Scholar] [CrossRef]
- Jiang, J.; Wen, Z.; Zhao, M.; Bie, Y.; Li, C.; Tan, M.; Zhang, C. Series arc detection and complex load recognition based on principal component analysis and support vector machine. IEEE Access 2019, 7, 47221–47229. [Google Scholar] [CrossRef]
- Le, V.; Yao, X.; Miller, C.; Tsao, B.H. Series DC Arc Fault Detection Based on Ensemble Machine Learning. IEEE Trans. Power Electron. 2020, 35, 7826–7839. [Google Scholar] [CrossRef]
- Underwriters Laboratories. UL 1699 Standard for Arc-Fault Circuit-Interrupters, 3rd ed.; UL: Northbrook, IL, USA, 2017. [Google Scholar]
- International Electrotechnical Commission. IEC 62606 General Requirements for Arc Fault Detection Devices; International Electrotechnical Commission: London, UK, 2017. [Google Scholar]
- Wu, C.J.; Liu, Y.W. Smart detection technology of series arc fault on low-voltage indoor power lines. Int. J. Electr. Power Energy Syst. 2015, 69, 391–398. [Google Scholar] [CrossRef]
- Yang, K.; Zhang, R.; Yang, J.; Liu, C.; Chen, S.; Zhang, F. A novel arc gault detector for early detection of electrical fires. Sensor 2016, 16, 500. [Google Scholar] [CrossRef] [PubMed]
- Yu, Q.; Hu, Y.; Yang, Y. Identification Method for Series Arc Faults Based on Wavelet Transform and Deep Neural Network. Energies 2020, 13, 142. [Google Scholar] [CrossRef]
- Eric, B.; Matt, F.; Bailey, H.; Jin, W.; Daniel, S.; Dennis, G. Experimental Observations of the Transient Characteristics of Series dc Arcs with Capacitive Loads. In Proceedings of the IEEE International Power Modulator and High Voltage Conference (IPMHVC), Jackson, WY, USA, 3–7 June 2018. [Google Scholar] [CrossRef]
- Carlos, E.R. Arc Fault Detection and Discrimination Methods. In Proceedings of the IEEE Holm Conference on Electrical Contacts, Pittsburgh, PA, USA, 16–19 September 2007; pp. 115–122. [Google Scholar] [CrossRef]
- Lin, Y.H.; Liu, C.W.M.; Chen, C.S. A new PMU-based fault detection/location technique for transmission lines with consideration of arcing fault discrimination-part I: Theory and algorithms. IEEE Trans. Power Deliv. 2006, 19, 1587–1593. [Google Scholar] [CrossRef]
- Naidu, M.; Thomas, J.S.; Suresh, G. Arc fault detection scheme for 42-V automotive DC networks using current shunt. IEEE Trans. Power Electron. 2006, 21, 633–639. [Google Scholar] [CrossRef]
- George, D.G.; Kon, W.; Robert, F.D. More about Arc-Fault Circuit interrupter. IEEE Trans. Ind. Appl. 2004, 40, 1006–1011. [Google Scholar] [CrossRef]
- Giovanni, A.; Antonio, C.; Valentina, C.; Dario, D.C.; Salvatore, N.; Giovanni, T. Arc Fault Detection Method Based on CZT Low-Frequency Harmonic Current Analysis. IEEE Trans. Instrum. Meas. 2017, 66, 888–896. [Google Scholar] [CrossRef]
- Ji, H.K.; Wang, G.; Kim, W.H.; Kil, G.S. Optimal Design of a Band Pass Filter and an Algorithm for Series Arc Detection. Energies 2018, 11, 992. [Google Scholar] [CrossRef]
- Lu, Q.; Ye, Z.; Zhang, Y.; Wang, T.; Gao, Z. Analysis of the Effects of Arc Volt–Ampere Characteristics on Different Loads and Detection Methods of Series Arc Faults. Energies 2019, 12, 323. [Google Scholar] [CrossRef]
- Shea, J.J. Identifying causes for certain types of electrically initiated fires in residential circuits. Fire Mater. 2011, 35, 19–42. [Google Scholar] [CrossRef]
- Hussain, G.A.; Shafiq, M.; Lehtonen, M. Predicting Arc Faults in Distribution Switchgears. In Proceedings of the International Scientific Conference on Electric Power Engineering(EPE), Prague, Czech Republic, 16–18 May 2016. [Google Scholar] [CrossRef]


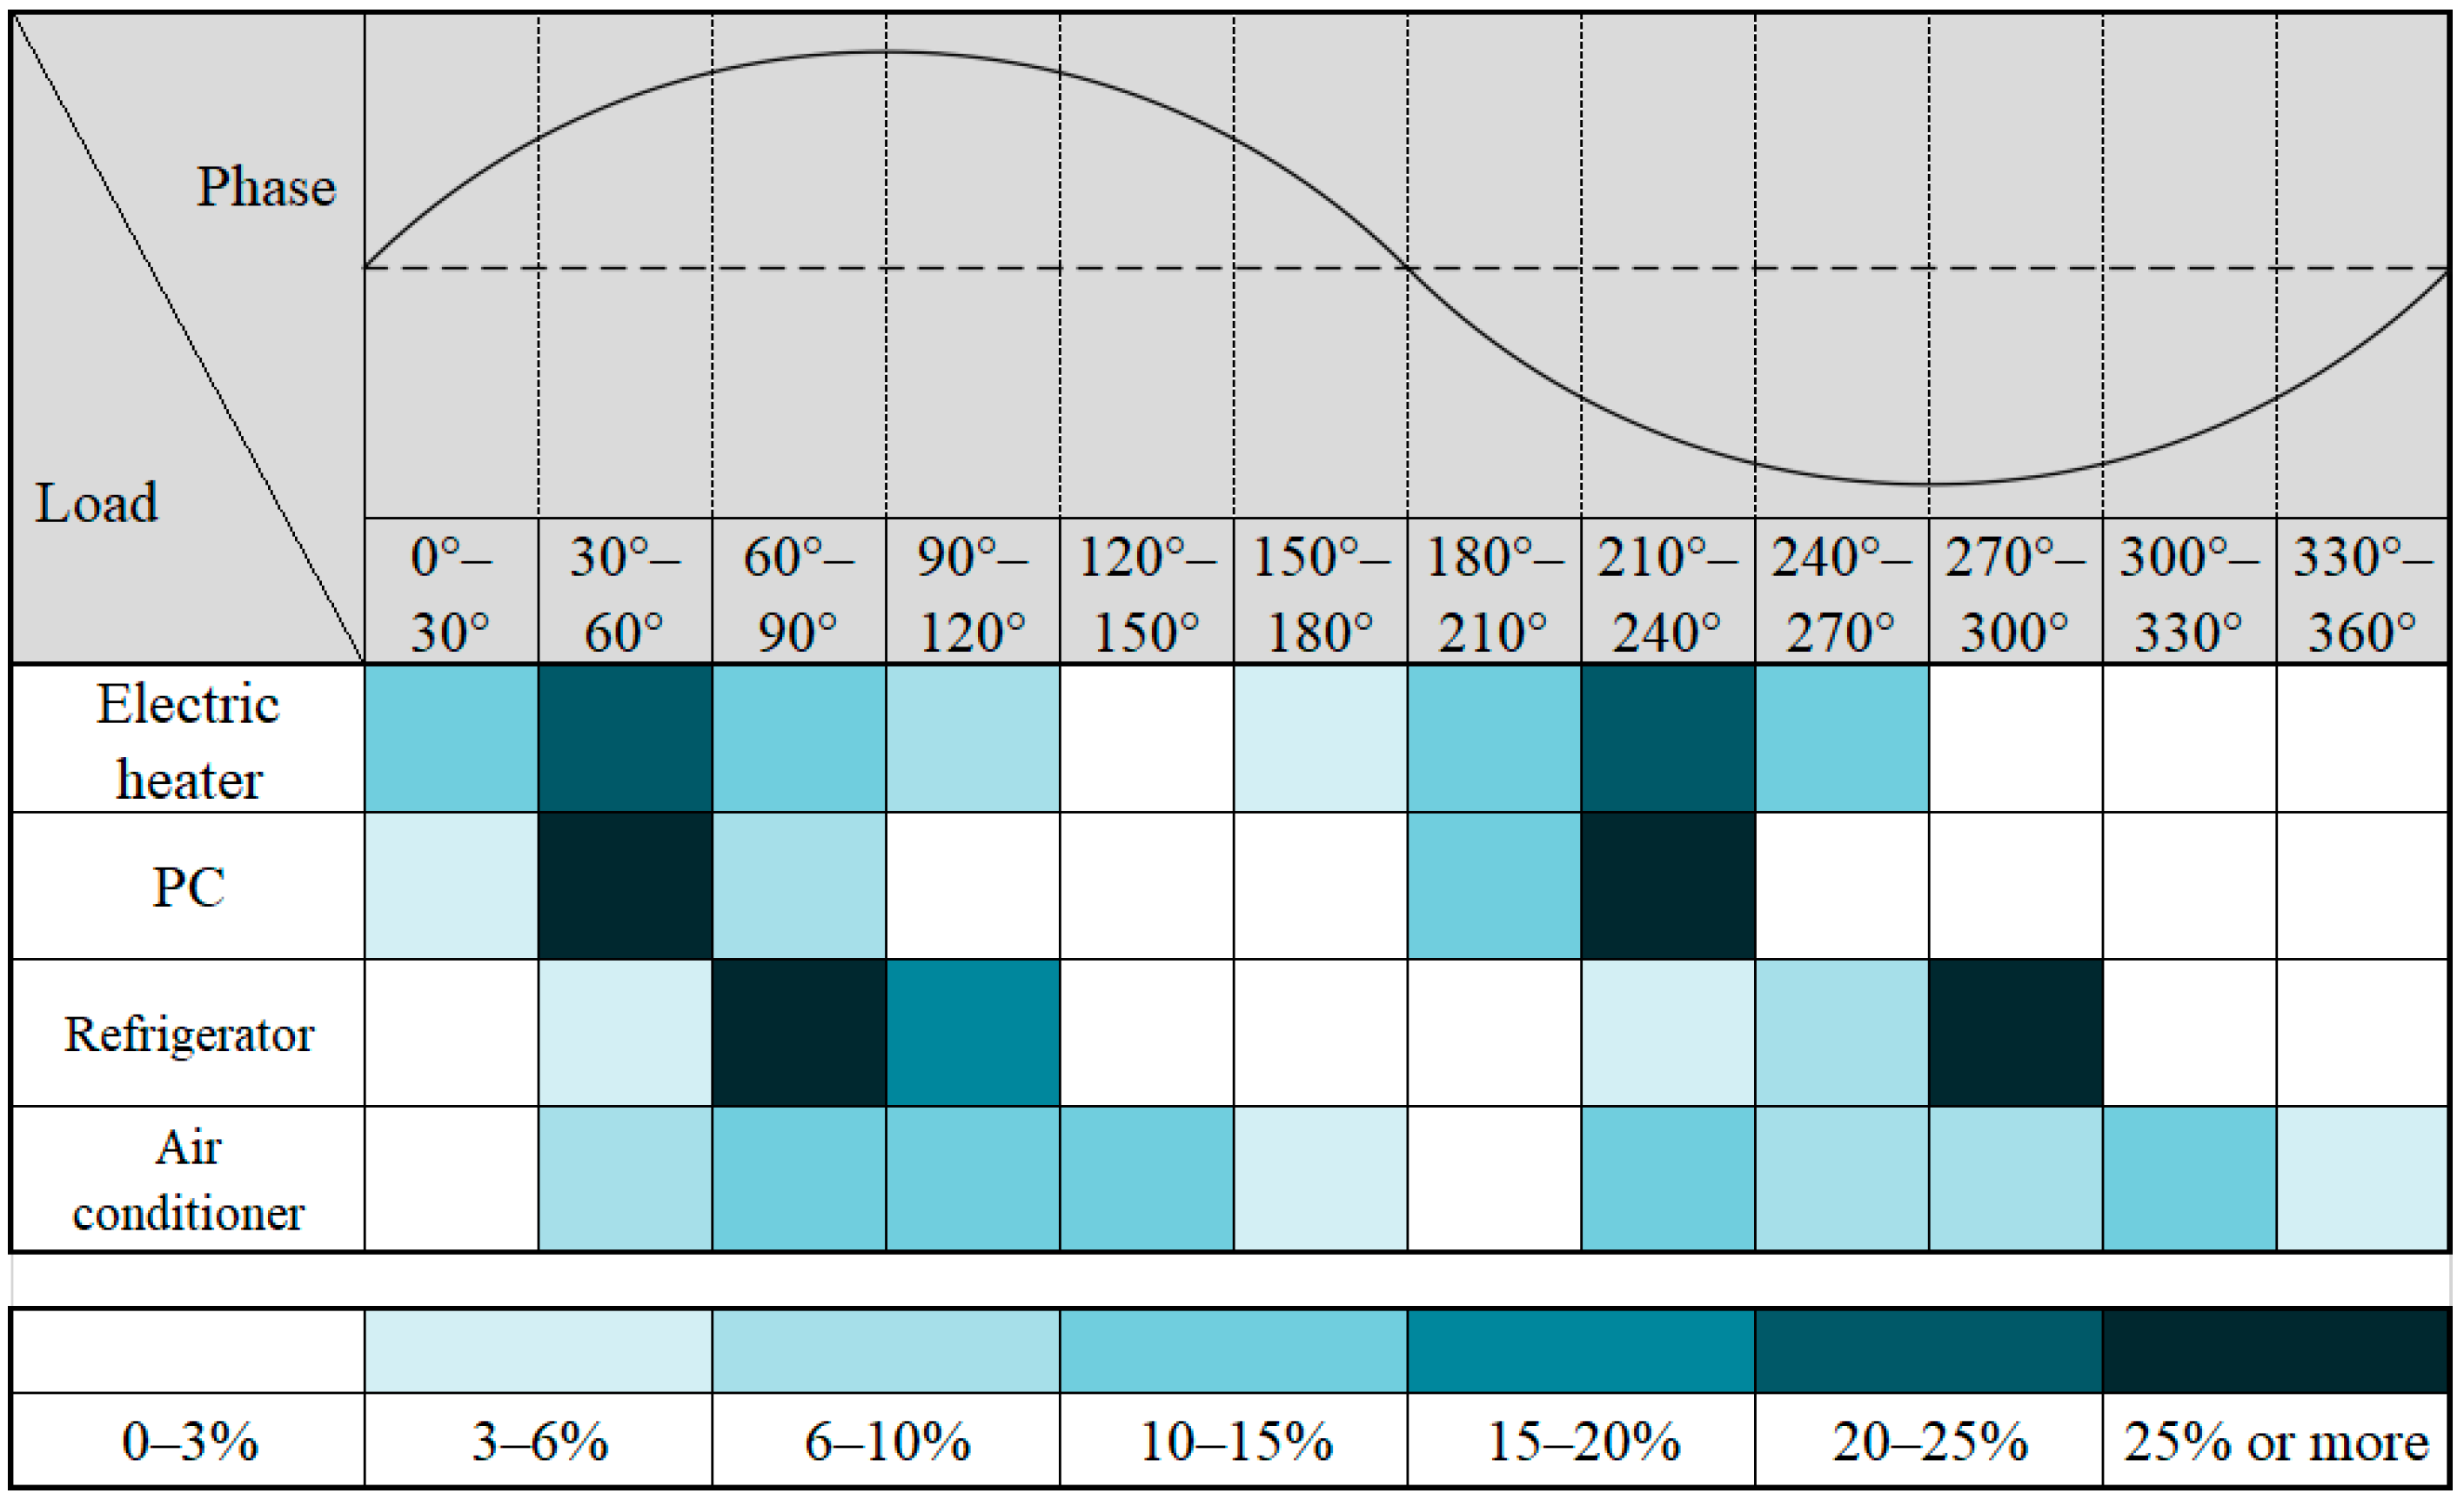
| Phase | 0°–30° | 30°–60° | 60°–90° | 90°–120° | 120°–150° | 150°–180° | 180°–210° | 210°–240° | 240°–270° | 270°–300° | 300°–330° | 330°–360° | |
|---|---|---|---|---|---|---|---|---|---|---|---|---|---|
| Load | |||||||||||||
| Electric heater (%) | 8.5 | 24.9 | 10.4 | 9.9 | 0 | 4 | 7.8 | 23.7 | 7 | 1.3 | 0 | 2.4 | |
| PC (%) | 4.7 | 33.8 | 7.4 | 0 | 0 | 1.3 | 6.3 | 44.1 | 1.4 | 0 | 0 | 0.9 | |
| Refrigerator (%) | 0 | 5.8 | 30.6 | 19.6 | 0.3 | 0 | 0 | 4.1 | 9 | 30.6 | 0 | 0 | |
| Air conditioner (%) | 1.1 | 8.6 | 13.4 | 12.6 | 10.3 | 5.3 | 1.1 | 13.7 | 9.4 | 9 | 10.4 | 5 | |
Publisher’s Note: MDPI stays neutral with regard to jurisdictional claims in published maps and institutional affiliations. |
© 2020 by the authors. Licensee MDPI, Basel, Switzerland. This article is an open access article distributed under the terms and conditions of the Creative Commons Attribution (CC BY) license (http://creativecommons.org/licenses/by/4.0/).
Share and Cite
Ji, H.-K.; Kim, S.-W.; Kil, G.-S. Phase Analysis of Series Arc Signals for Low-Voltage Electrical Devices. Energies 2020, 13, 5481. https://doi.org/10.3390/en13205481
Ji H-K, Kim S-W, Kil G-S. Phase Analysis of Series Arc Signals for Low-Voltage Electrical Devices. Energies. 2020; 13(20):5481. https://doi.org/10.3390/en13205481
Chicago/Turabian StyleJi, Hong-Keun, Sung-Wook Kim, and Gyung-Suk Kil. 2020. "Phase Analysis of Series Arc Signals for Low-Voltage Electrical Devices" Energies 13, no. 20: 5481. https://doi.org/10.3390/en13205481
APA StyleJi, H.-K., Kim, S.-W., & Kil, G.-S. (2020). Phase Analysis of Series Arc Signals for Low-Voltage Electrical Devices. Energies, 13(20), 5481. https://doi.org/10.3390/en13205481