Abstract
Structure design is of great value for the performance improvement of solid oxide electrolysis cells (SOECs) to diminish the gap between scientific research and industrial application. A comprehensive multi-physics coupled model is constructed to conduct parameter sensitivity analysis to reveal the primary and secondary factors on the SOEC performance and optimal rib width. It is found that the parameters of the O2 electrode have almost no influence on the optimal rib width at the H2 electrode side and vice versa. The optimized rib width is not sensitive to the electrode porosity, thickness, electrical conductivity and gas composition. The optimal rib width at the H2 electrode side is sensitive to the contact resistance at the interface between the electrode and interconnect rib, while the extremely small concentration loss at the O2 electrode leads to the insensitivity of optimal rib width to the parameters influencing the O2 diffusion. In addition to the contact resistance, the applied cell voltage and pitch width also has a dramatic influence on the optimal rib width of the fuel electrode. An analytical expression considering the influence of total cell polarization loss, the pitch width and the contact resistance is further developed for the benefit of the engineering society. The maximum error in the cell performance between the numerically obtained and analytically acquired optimal rib width is only 0.14% and the predictive power of the analytical formula is fully verified.
1. Introduction
Renewable energy resources, including solar, wind, tidal, and biomass, are of great significance as the fossil energy crisis is becoming increasingly serious. However, their intermittence leads to an undesirable imbalance between demand and supply [1]. An energy storage device is required so that energy can be stored and released as needed. Among various candidates for energy storage, solid oxide electrolysis cells (SOECs) have gained popularity for higher efficiency and lower pollution and even no pollution. SOEC is an energy conversion device that can convert electrical energy and heat to chemical energy, by splitting H2O/CO2 to produce H2 and CO. The products H2 and CO can be used as fuel in a solid oxide fuel cell (SOFC) to produce electricity or be stored as raw materials for the synthesis of hydrocarbons via the Fischer–Tropsch reaction.
SOEC technology is of great superiority and prospect. Among three main electrolysis configurations, it has been reported that the efficiency of hydrogen production by high temperature SOEC is more than twice of that by an Alkaline electrolysis cell, and is 1.5 times of that by proton exchange membrane electrolyzer [2]. There are mainly three kinds of SOEC according to reaction gas species: high temperature H2O electrolysis, CO2 electrolysis, H2O and CO2 co-electrolysis cell. Steam electrolysis can produce H2, which is a completely environmentally friendly fuel. In addition, H2O is rich in nature. CO2 electrolysis is advantageous in that it can consume CO2 and relieve the greenhouse effect, and the product CO is easier to store and transport than H2. However, it has a potential carbon deposit risk. H2O and CO2 co-electrolysis can produce H2 and CO mixtures, and by adjusting the inlet H2O/CO2 ratio, it can produce applicable hydrocarbon synthesis. The steam electrolysis has the highest electrolysis efficiency while CO2 electrolysis has the lowest efficiency, and the efficiency of H2O/CO2 co-electrolysis is between them. Due to the environmental friendliness and higher efficiency of steam electrolysis, high temperature H2O electrolysis attracts increased attention. With the increase of temperature, the electricity needed to electrolyze H2O decreases, while the low quality heat needed increases. Moreover, high temperature SOEC is not only thermodynamically beneficial but also kinetically favorable. Hence, high temperature SOEC has a more promising application perspective.
Materials, performance and degradation issues are still three challenges of SOEC technology to be settled. Extensive research about SOEC concentrates on the optimization of material microstructure [3,4,5], geometrical [6] and operating parameters [7] and the analysis to improve SOEC performance. Notice, however, the structural size choice is also of great significance. For example, the authors of [8] studied the effect of cathode thickness on CO2/H2O co-electrolysis performance under various operating conditions by experiment, which reveals that SOEC performance can be substantially improved by decreasing cathode thickness. For the time being, most of the SOEC researches were conducted experimentally [2,9,10,11,12]. Unfortunately, the experiment is expensive and time-consuming, so research about structure optimization by experiment is rare. Simulation is an efficient alternative to help the design of SOEC/SOFC to improve performance, especially when exploring a large combination of operating and structural parameters space. For example, Reference [1,11,12,13] studied the influence of pressure on SOEC. Ni et al. [14] researched electrode thickness, support type, electrode porosity and pore size and operating pressure on SOEC performance. It is concluded that anode-supported SOEC has the best output performance. Kong et al. [15] examined the impacts of different electrode-rib contact resistances, fuel compositions, electrode porosity, electrode thicknesses and electrode conductivity on the optimal anode and cathode ribs of SOFC independently.
The development of SOEC is later than that of SOFC. As the reverse process of SOFC, SOEC has basically the same materials system as SOFC. The research of SOFC is enlightening to the development of SOEC. In the last 20 years, during the simulation of SOFC, it found out that rib width design is of great significance to improve the cell performance [15,16,17,18], which has also been experimentally confirmed [19]. Actually, as early as 2003, Lin [16] had provided a phenomenological model and analytical expressions to estimate the rib effects on the concentration and ohmic polarization of anode-supported SOFC stacks. Jeon et al. [20] described a microstructure model and examined the influence of the rib and pitch widths and the electrode-interconnect contact area specific resistance (ASR) on the stack-cell performance. The authors of [17] investigated the effect of ASR between the electrode and the rib on the performance of SOFC, and conducted the rib width optimization by 2D SOFC multi-physical modes. In [18], the authors primarily compared the optimal rib width result attained by 2D and 3D multi-physical models, and revealed that the optimization result of 2D and 3D models are in good agreement. The authors of [15,21] optimized the anode and cathode rib width for anode-supported and cathode-supported SOFCs, respectively. An analytical expression of optimal rib width is deduced to help the engineering design of SOFC. In [22], the authors conducted the optimization of the cylindrical interconnect rib width of SOFC, and it found out that anode and cathode rib width should be optimized separately, which is in consistent with the conclusion in Reference [21]. Reference [23] studied the influence of rib size on the performance of a reversible solid oxide cell. It takes into account the efficiency of a solid oxide fuel cell and electrolysis cell comprehensively.
However, the polarization process of SOEC is vastly different from SOFC. During past years, to our knowledge, it is still not clear how to choose the rib width when fabricating the SOEC interconnector characterized by the rib-channel structure, i.e., the optimization of rib width has not been clearly addressed. This paper conducts a comprehensive parameter sensitivity analysis on the rib width optimization of SOEC by 2D multi-physics simulations. Analytical expressions for the optimal cathode rib width design are obtained to provide an easy-to-use guide for designing the rib-channel layout of SOEC.
2. Model Description
A typical unit of SOECs contains a dense electrolyte sandwiched by a porous anode and cathode, channels and inter-connector. To obtain better electrochemical performance, a relatively denser and thinner porous layer are generally added between the electrode and electrolyte, which is called the function layer. The working principle of SOEC is illustrated in Figure 1a. Figure 1b shows a 2D cross section of the SOEC repeating unit, displaying the rib-channel design parameters: the pitch width, dpitch, and the rib width, drib. The multi-physics coupled modeling is applied to a pitch unit of SOEC and considers the mass, species, momentum transfer processes, the current conduction and the electrochemical reaction.
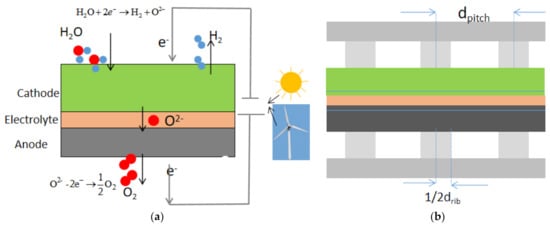
Figure 1.
(a) Schematic of solid oxide electrolysis cell (SOEC) working principle; (b) a cross section of a SOEC repeating unit.
2.1. Species Transfer Process
The species conservation equation can be expressed as:
Here, Ni is the total molar flux vector, which includes the convective flow and the diffusion flow. Dieff, Ci, and Si are effective diffusion coefficient, molar concentration and source or sink of species i, respectively. Si is source or sink of species i by electrochemical consumption and production in the electrode.
The species diffusion is modeled by a multi-component Dusty–Gas model [24], which is proved to be the most accurate model to simulate gas diffusion in a porous electrode of SOFC [25]. A binary molecular diffusion coefficient is generally used directly in channels, where gas convective transfer rather than the diffusion transfer is dominant, and the binary molecular mutual diffusion coefficient is expressed as [18]:
where T, vi and Mi is the temperature, diffusion volume and mole mass of species i. P is the total gas pressure.
In the electrode, the influence of porosity and tortuosity should be considered to describe the effective binary molecular diffusion coefficient:
ε, τ are porosity and tortuosity of the electrode, respectively.
In the electrode, molecular mutual diffusion dominates when the electrode pore is larger than the molecular mean free path, while Knudsen diffusion becomes primary when the pore size is small and the collision between the species and pore wall increases. The effective Knudsen diffusion coefficient is expressed as:
Here rg is pore radius, and rg is expressed as:
Considering both molecular diffusion and Knudsen diffusion simultaneously, the effective diffusion coefficient in the electrode is formally expressed as [18]:
2.2. Electrochemical Reaction Model
The electrochemical reactions include the H2O reduction reaction at the fuel electrode and the oxidation reaction at the O2 electrode, which are expressed as:
The electronic current and ion current are governed by charge continuity equations:
where n is the number of electrons transferred in the electrochemical reaction, iel and iio are the electronic and ionic current density vector, ϕel, ϕio are the electronic and ionic potential. λTPB,eff is the effective three phase boundary (TPB) density per unit. jTPB is the current density at TPB.
Nernst potential is the minimum cell voltage needed to drive an electrochemical reaction in SOEC:
Here, ΔG is the Gibbs free energy change of electrochemical reaction. PH2, PO2, PH2O are partial pressures of H2, O2 and H2O. P0 is the standard atmospheric pressure.
The applied voltage in an operating SOEC is:
where ηohmic, ηact, ηcon are ohmic, activation and concentration loss, respectively. Ohmic loss is induced by the conductivity resistance of electron and ion transfer in solid components and is calculated according to Ohm’s law:
Here, ASRohm is total area specific resistance.
The occurrence of the electrochemical reaction needs to overcome the reaction activation energy barrier, leading to irreversible activation loss. The relationship between current density and the activation loss is described by the Butler–Volmer equations:
The concentration polarization is induced by a change of species concentration when SOEC is in operation:
EO2 and EH2 are, respectively, the activation energies for the O2 and H2 electrode electrochemical reactions.
2.3. Effective Material Property Model
The intrinsic material conductivity is temperature dependent [1,6,15,26]:
where R is the universal gas constant.
For the porous electrode, the relationship between the material macro property and microstructure can be expressed by coordination number theory and percolation theory [27]:
where σk0 is the intrinsic electric conductivity of the kth phase material in the dense solid. ϕk is the volume fraction of the kth phase particles in the composite material, ϕkt is the percolation threshold volume fraction of the k phase particles, which is determined by
where Z is the average coordination number for each particle and set as six for a random packing of spheres [15]. rel and rio are, respectively, the electronic conductivity particle radius and the ionic conductivity particle radius.
LSCF is a material that can conduct electrons and ions simultaneously. For the LSCF-GDC composite electrode, the effective electronic conductivity is expressed as:
The effective ionic conductivity can be considered as the parallel current conduction of LSCF and GDC. The ionic conductivity of the composite electrode is expressed as:
where γ is a Bragg factor and is usually set as 1.5. Pk is the percolation probability of phase k. Both the percolation probabilities of LSCF and GDC are assumed to be 1.
The TPB density per unit volume of a composite electrode with a binary mixture is expressed as [27]:
The relevant physical quantities are expresses as follows,
More details about the specific symbols are referred to in [27].
The multi-physics simulations are conducted with the commercial finite element software COMSOL 4.3b. Simulations were first carried out to reproduce the performance of an experimental cell that is designated as the standard cell. The parameters used to reproduce the experiment are listed in Table 1, and are referred to as the standard parameter set. Unless explicitly stated otherwise, the parametric analysis was conducted by varying one parameter as the variable while all the other parameters are kept as the standard case.

Table 1.
Basic model parameters used in the standard cell modeling.
2.4. Model Verification
To verify the multi-physics model of SOEC, simulated I–V data are compared with our experimental results. The experimental cell contains a cathode support layer (CSL), a cathode function layer (CFL), an electrolyte, a diffusion barrier layer and the anode. CSL and CFL are mixtures of nickle oxide (NiO) and yttria stabilized zirconia (YSZ), and the electrolyte is a dense YSZ layer. The composite anode is made of La0.6Sr0.4Co0.2Fe0.8O3-δ (LSCF) and Ce0.9Gd0.1O1.95 (GDC). The diffusion barrier layer (GDC) is sandwiched between anode and electrolyte to avoid formation of the insulating phase. The SOEC is operating at 750 °C with the inlet gas H2O:H2 = 0.9:0.1 at the cathode side and O2:N2 = 0.21:0.79 at the anode side. Furthermore, the pitch width and rib width are 2 and 1 mm, respectively. The contact resistance is set at 0.056 Ωcm2 as deduced by our impedance measurement. The other parameters used to reproduce the experiment are listed in Table 1. The micro-structure parameters are taken from the literature experiments [29,30,31,32].
As can be seen from Figure 2, the experimental and simulation results agree well, demonstrating the validity of the multi-physics model. Naturally, some discrepancies between the experimental and theoretical I–V curves are observed. Nevertheless, the theoretical and experimental difference is less than 0.02 V for any given current densities.
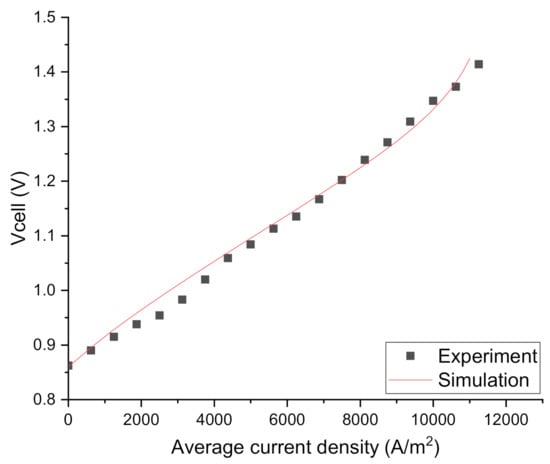
Figure 2.
Comparison of experimental and simulated I–V curves.
3. Results
3.1. Parameters Sensitivity Analysis for Rib Width Optimization at the H2 Electrode Side
As seen in Figure 3, the current density first increases to a peak value then decreases with the increase of rib width. This is quite understandable as the concentration loss increases and the ohmic loss decreases when the rib width increases. Therefore, there is an optimized rib width drib-m where the current density reaches its maximum value. When drib < drib-m, with the increase of rib width, the decrease of ohmic loss is higher than the increase of concentration loss, the current density tends to increase. When drib > drib-m, with the increase of rib width, the decrease of ohmic loss is smaller than the increase of concentration loss, and the current density decreases. The competition between the concentration polarization and the ohmic polarization determines the final optimized rib width.
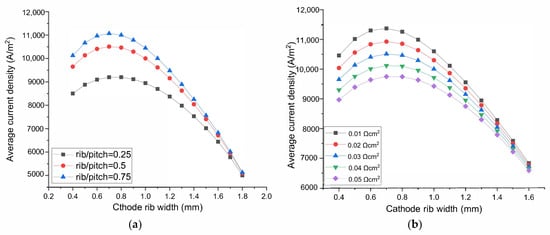
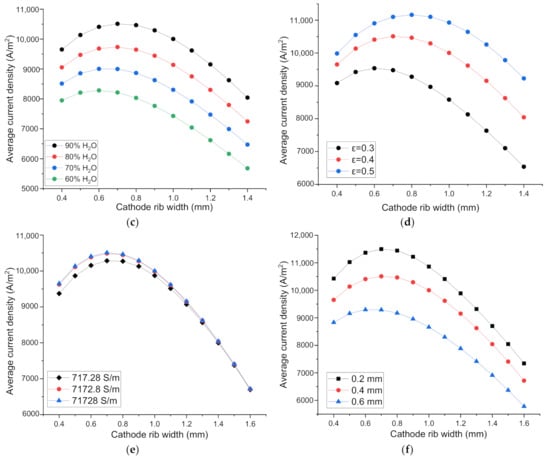
Figure 3.
The effect of rib width on the SOEC performance. Parameter on the O2 electrode side: (a) the rib/pitch ratio, (b) the rib-electrode ASR. Parameter on the H2 electrode side: (c) Inlet H2O content, (d) Electrode porosity, (e) Electrode conductivity, (f) Electrode thickness.
As shown in Figure 3a, when the rib/pitch width ratio at the O2 electrode side increases from 0.25 to 0.5 then to 0.75, the optimized H2 electrode rib width is 0.752, 0.720, 0.710 mm, respectively. Notice, however, although the optimized rib widths are different, the width of 0.72 mm is sufficiently optimal for all the O2 electrode rib/pitch ratio conditions. The maximum current density difference between optimal rib width and 0.72 mm are only 0.05%, 0.007% for the rib/pitch ratio of 0.25 and 0.75, respectively. Therefore, it is concluded that the optimized rib width at the H2 electrode side is not sensitive to the rib/pitch ratio at the O2 electrode side.
The experimentally measured ASR of SOFC is in the range 0.01–0.05 Ωcm2 [33]. SOEC has the same electrode and inter-connector materials. However, the oxidation atmosphere of both the electrodes of SOEC means potentially larger oxidation risk of inter-connector than SOFC, so the maximum ASR studied here is 0.08 Ωcm2. ASR of both the electrodes in the range of 0.04–0.08 Ωcm2 is used to conduct parameter sensitivity analysis to optimize rib width. To study the parameters’ influence on the rib width optimization at one electrode side, ASR of another electrode side is set as 0.03 Ωcm2. As displayed in Figure 3b, when ASR between the O2 electrode and rib increases from 0.01 to 0.05 Ωcm2, the current density decreases gradually because of the increased ohmic loss. The optimized H2 electrode rib width is 0.689, 0.705, 0.720, 0.734, 0.746 mm when ASR at the O2 electrode side are 0.01, 0.02, 0.03, 0.04, 0.05 Ωcm2, respectively. However, when choosing 0.72 mm as the optimal rib width for the other four cases, the differences between the maximum current density at the optimal rib width and the current density with a rib width of 0.72 mm are 0.0756%, 0.0165%, 0.0128%, 0.04% for ASR 0.01, 0.02, 0.04, 0.05 Ωcm2, respectively. Hence, the optimized rib width on the H2 electrode side is not sensitive to the ASR on the O2 electrode side.
Along the fuel flow direction, H2O is consumed gradually, the molar fraction of H2O changes correspondingly. Furthermore, for practically operating SOEC, high H2O conversion rate is favorable, so the research about the rib width optimization should take into account different H2O molar fractions. Figure 3c shows, for a fixed rib width, the current density increases with the increase of H2O molar fraction. This is because the Nernst potential decreases and the electrochemical reaction rate increases with the increased H2O molar fraction, and the current density increases when the applied voltage is fixed. The optimal rib width is 0.720, 0.687, 0.648, 0.602 mm when H2O molar fractions are 90%, 80%, 70%, 60%, respectively. Because with the increase of H2O molar fraction, current density increases, concentration polarization and ohmic polarization both increase simultaneously, which leads to a slight change in the optimized rib width. This result is also in accordance with that of SOFC [15]. Nevertheless, 0.65 mm width is sufficiently optimal for SOEC with different H2O molar fraction, because the difference between the maximum current density and the current density at the rib width of 0.65 mm is only 0.0002%, 0.0004%, 0.0001%, 0.0028% for SOEC with the inlet H2O molar fraction of 90%, 80%, 70%, 60%, respectively. The optimized rib width can be considered independent of the H2O fraction.
The SOEC H2 electrode porosity is in the range of 0.3–0.5 [34]. As shown in Figure 3d, the optimal rib width increases with the increase of electrode porosity due to the reduced gas diffusion resistance. For the porosity of 0.3, 0.4, 0.5, the optimized rib width is 0.616, 0.720, 0.800 mm, respectively. Even the optimized rib width for the three porosities seems to be quite different, the maximum current densities for porosity 0.3 and 0.5 are only 0.98% and 0.35% higher than the current density with a rib width of 0.720 mm. Therefore, the optimized rib width is not sensitive to the H2 electrode porosity.
As shown in Figure 3e, when the H2 electrode electrical conductivity increases from 717.28 to 7172.8 S/m, the current density increases relatively drastically. However, when H2 electrode electrical conductivity increases from 7172.8 to 71,728 S/m, the current density has almost no change. It means that the electrical conductivity of 7172.8 S/m is large enough, electrical conductivity larger than 7172.8 S/m has no evident improvement for SOEC performance. The optima rib width for the electrode electric conductivity of 717.28, 7172.8 and 71,728 S/m is 0.741, 0.722 and 0.719 mm, respectively. However, using a rib width of 0.720 mm, the current density differs from the maximum only by 0.03% for the conductivity of 717.28 S/m, and virtually zero for the conductivity of 71,728 and 7172.8 S/m. Hence, the optimal rib width is basically independent of the electrode conductivity.
As seen in Figure 3f, the performance of SOEC decreases with the increase of H2 electrode thickness. The increase of electrode thickness means longer gas diffuse path from the channel-electrode interface to the active three phase boundary. The diffusion process becomes more difficult, and the concentration loss increases accordingly. Moreover, a thicker electrode inevitably leads to larger ohmic loss for current in the thickness direction. Hence, the overall SOEC performance decreases when electrode thickness increases. However, as the electrode thickness increases, the optimized rib width changes only slightly. The optimized rib width for the electrode thickness of 0.2, 0.4 and 0.6 are 0.719, 0.720 and 0.646 mm, respectively. However, the width of 0.720 mm is sufficiently optimal. The current density for the rib width of 0.72 mm differs only 0.006% and 0.41% from the maximum for the electrode thickness of 0.2 and 0.6 mm, respectively. Therefore, the optimal rib width is insensitive to the electrode thickness. The reason behind this is that both the concentration and ohmic polarizations increase comparatively at the same time when the electrode thickness increases.
As displayed in Figure 4a, fixing the rib width, the current density decreases significantly with the increase of rib–electrode ASR due to directly the increased ohmic polarization loss. Moreover, the optimal H2 electrode rib width increases, because the increased ohmic loss due to the increase of ASR can be partially offset by increasing the rib width. As seen in Figure 4b, the optimized rib width increases almost linearly with the increase of ASR. When ASR increases from 0.01 to 0.05 Ωcm2, the optimized rib width increases from 0.511 to 0.840 mm, or an increase of 64.4%. This ASR effect is quite dramatic. With the increase of ASR, the current density decreases, the concentration loss decreases passively. The increased ohmic loss and the decreased concentration loss collectively leads to the dramatic increase of the optimal rib width.
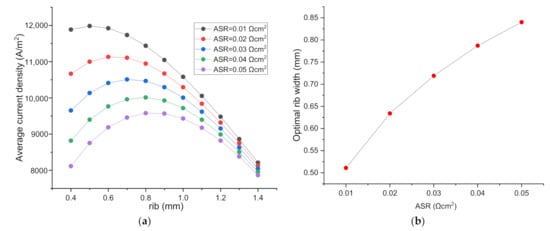
Figure 4.
(a) The effect of ASR of the H2 electrode and rib interface on SOEC performance and the optimized rib width; (b) The relationship between optimal rib width and ASR.
3.2. Parameters Sensitivity Analysis for the Rib Width Optimization on the O2 Electrode Side
As can be seen in Figure 5a, with the increase of rib/pitch ratio on the H2 electrode side, the current density decreases, which can be attributed to the increased concentration polarization in the cathode due to the increased rib width. When the rib/pitch ratio increases from 0.25 to 0.5, the SOEC performance decreases slightly. However, the when rib/pitch ratio increases from 0.5 to 0.75, the SOEC performance decreases drastically. It can be inferred that when the rib/pitch ratio exceeds 0.5, the negative effect of the concentration loss increase is far greater than the positive effect of the ohmic loss decrease as induced by the increase of the H2 electrode rib width. However, when the rib width on the O2 electrode side increases, the current density increases all the way, independent of the rib/pitch ratio on the H2 electrode side, indicating the optimized rib width on the O2 electrode side is not sensitive to the rib/pitch ratio on the H2 electrode side.
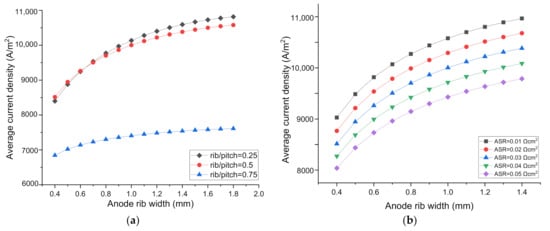
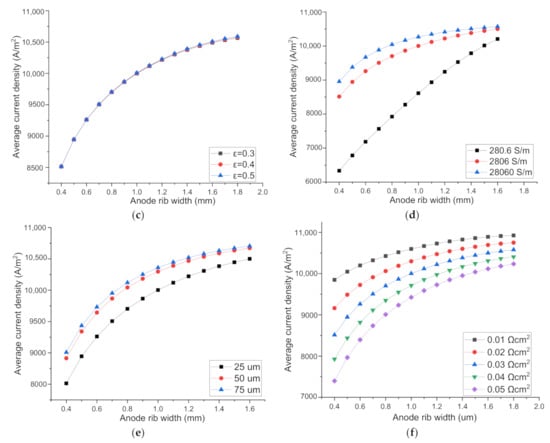
Figure 5.
The effect of parameters on SOEC performance and the optimal O2 electrode rib width. H2 electrode parameters: (a) rib/pitch ratio on the H2 electrode side; (b) rib-H2 electrode area specific resistance (ASR); O2 electrode parameters: (c) porosity; (d) electrical conductivity; (e) thickness; (f) rib-O2 electrode ASR.
As shown in Figure 5b, when ASR on the H2 electrode side increases from 0.01 Ωcm2 to 0.05 Ωcm2, the current density decreases gradually. For a fixed ASR, the current density increases with the increased rib width on the O2 electrode side, independent of the ASR change on the H2 electrode side. Hence, the optimized O2—electrode rib width is not sensitive to the ASR of the H2 electrode.
Figure 5c shows the current density increases extremely slightly with the increase of O2 electrode porosity from 0.3 to 0.4 then to 0.5, indicating the polarization loss induced by O2 diffusion inside the anode is rather small. This is also ascribed to the thinness of the O2 electrode. Furthermore, the current density increases with the increase of rib width, for all the anode porosities examined. It can be concluded that the optimal O2-electrode rib width is independent of the O2 electrode porosity.
Figure 5d shows the current density increases with the increase of the O2 electrode electrical conductivity, due to the decreased ohmic polarization. The current density increases more dramatically when the conductivity increases from 280.6 to 2806 S/m, but increases slightly when the conductivity increases from 2806 to 28,060 S/m, indicating the ohmic polarization is no longer a major factor limiting the cell performance when the anode conductivity is above 2806 S/m. For a fixed conductivity, the current density increases with the increase of rib width. The increase of current density with the rib width is quite large for the low conductivity of 280.6 S/m, but only moderate for the conductivity of 2806 and 28,060 S/m, indicating a conductivity of 2806 S/m is adequately high for the anode.
Figure 5e shows the current density increases with the increase of O2 electrode thickness, which is opposite to the trend of the cathode shown in Figure 4f. The opposite trends imply that the major polarization factors in the anode and cathode are different. The concentration loss is more influential than the ohmic polarization in the cathode, while the ohmic polarization is much larger than the concentration polarization in the anode. The thicker anode increases the difficulty of both the O2 diffusion and the current conduction along the electrode thickness direction. However, the current passage through the narrow cross section of the electrode to the rib is the main ohmic polarization loss. The increase of electrode thickness can reduce the major ohmic loss and improves the SOEC performance, as observed experimentally [19]. For all the anode thicknesses considered, the current density increases with the increased O2 electrode rib width, due to the reduced ohmic polarization by the shorter conduction path.
As shown in Figure 5f, fixing the rib width, the SOEC performance decreases with the increased anode ASR due to the increased ohmic loss. Meanwhile, the current density increases continuously with the increase of rib width, independent of the ASR value, confirming the concentration loss is far lower than the ohmic loss in the O2 electrode. The optimal rib width can be quite close to the whole pitch size.
3.3. Analytical Expression of the Optimal Rib/Pitch Ratio on the H2 Electrode Side
From Figure 6, it can be seen that with the increase of pitch width, the optimal rib width increases, while the optimal rib/pitch ratio (R) decreases. Furthermore, for a SOEC with pitch width 2 mm and ASR 0.01 Ωcm2, the optimal rib width is 0.387 and 0.603 mm when loaded with applied voltage 1.6 and 1.2 V, increasing by 56%, so the influence of the applied voltage on optimal rib width cannot be ignored. The specific voltage is meaningless, the possible influence factor is the total polarization loss η = Vcell−Enerst. However, here the explored total polarization change is induced only by applied voltage change. Combining the parameters sensitivity analysis above, it can be distinguished that ASR, polarization loss and pitch width from all the parameters studied as the major factors affecting optimal rib width. Here we take the rib/pitch ratio into consideration, and analytically express the relationship between optimal rib/pitch ratio with pitch width, rib-electrode ASR, total polarization loss. Finally, we get the expression for the applicable voltage range 1.2–1.6 V for SOEC. The optimal rib/pitch ratio is denoted as R1.2V, R1.4V, R1.6V.
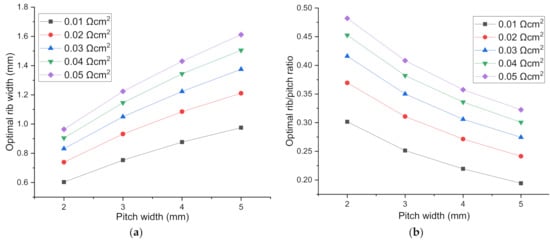
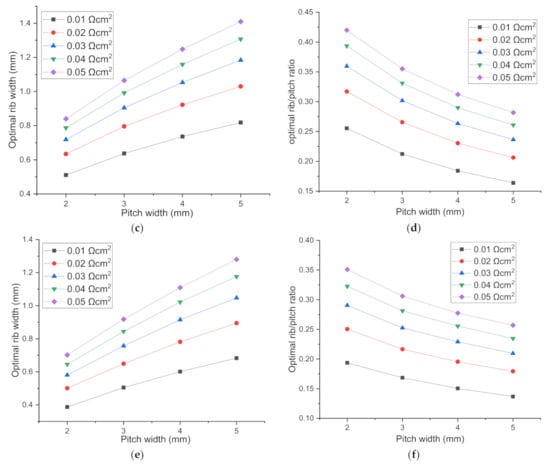
Figure 6.
The optimal H2 electrode rib width and rib/pitch ratio for different pitch width for the cell voltage of (a,b): 1.2 V; (c,d): 1.4 V; (e,f): 1.6 V.
R can be expressed generally as R = (a1*ASR + a2) + (a3*ASR + a4). The total polarization for SOEC with applied voltage 1.2, 1.4, 1.6 is 0.34, 0.54, 0.74, respectively. The four sets of coefficients are listed in Table 2 and the relationship between the coefficients and η is displayed in Figure 7.
Table 2.
Coefficient of R.
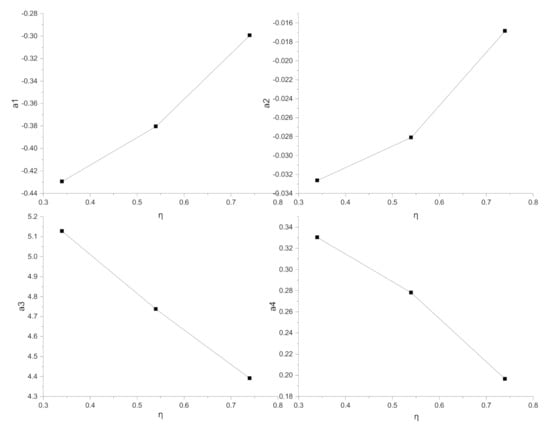
Figure 7.
The relationship between coefficient a1, a2, a3, a4 and η.
By simplifying the relationship between a1, a2, a3, a4 and η, a1 = 0.325η − 0.54523, a2 = 0.0395η − 0.04719, a3 = −2.06325η + 5.89582, a4 = −0.33428η + 0.4488 are obtained to describe the relationship between η and a1, a2, a3, a4 linearly. The synthetic expression of R considering the influence of pitch width, rib—electrode ASR, and the total polarization is formulated as:
It should be pointed out that in Equation (41), the units of ASR, η, dpitch are Ωcm2, V, mm, respectively. Subsequently, the optimal rib can be formulated as:
Here, drib,a (mm) is the optimal rib width obtained analytically. It should be noted that even the drib,a (mm) is the quadratic function of dpitch, the coefficient for the first order term is an order of magnitude larger than the quadratic term. Therefore, the relationship between optimal rib width and pitch width is mainly linear.
To verify the reliability of Equation (42), two accuracy parameters are defined as
where imax-n is the maximum current density corresponding to the optimal rib width drib-n obtained numerically. imax-a is the maximum current density for the analytically predicted optimal rib width drib-a. λ1, λ2 are defined to evaluate the effectiveness of the analytical expression for predicting optimal rib width. Even the maximum margin of error for optimal rib width (λ2) is about 8.575%, the current density for the analytically predicted optimal rib is only 0.14% different from the maximum current density for the numerically attained optimal rib width. Hence, the cathode rib width predicted by Equation (42) is sufficiently optimal.
4. Conclusions
We have developed a comprehensive mathematical model for the performance research of SOEC. The impacts of the electrode rib widths on SOEC performance are systematically examined by varying the contact resistance, fuel composition, electrode porosity, electrode thickness and electrode electric conductivity. Different from rib width at the H2 electrode side, the optimal rib width at the O2 electrode side is not so sensitive to ASR and other parameters. With the increase of rib width, current density almost increases all the way, because the concentration polarization at the O2 electrode side is too small, the ohmic loss induced by ASR is overwhelmingly greater than concentration loss. Nevertheless, the current density increase rate decreases when rib width is large enough. More importantly, it finds out three main factors affecting optimal rib width at the H2 electrode side: ASR at the rib–electrode interface, the pitch width, and the applied cell voltage. Giving the pitch width and contact resistance, the optimal rib width decreases with the increase of cell voltage. Giving the cell voltage and contact resistance, the optimal rib width increases and the optimal rib/pitch ratio decreases with the increase of pitch width. When ASR at H2 electrode side is in the range of (0.01, 0.05) Ωcm2, the optimal rib width at the cell voltage of 1.4 V is in the range (0.511, 0.840), (0.637, 1.065), (0.736, 1.248) and (0.818, 1.410) mm for the corresponding pitch width of 2, 3, 4 and 5 mm, respectively. Finally, an analytical expression is proposed to formulate the relationship between the optimal rib width and total polarization loss, ASR, and pitch width. The prediction error between the maximum current density obtained by numerically and analytically optimal rib width is within 0.14%, proving the predictive ability of the analytical expression.
Author Contributions
Conceptualization, M.G.; methodology, M.G. and Z.L.; validation, M.G. and X.R.; formal analysis, M.G. and Z.L.; investigation, M.G., X.R. and G.X.; data curation, M.G. and G.X.; writing—original draft preparation, M.G.; writing—review and editing, M.G. and Z.L.; supervision, Z.L.; project administration, Z.L. and J.W.; funding acquisition, Z.L. and J.W. All authors have read and agreed to the published version of the manuscript.
Funding
This research was funded by the National Natural Science Foundation of China (11774324 & 12074362), the Strategic Priority Research Program of the Chinese Academy of Sciences (XDA 21080200) and the Youth Innovation Promotion Association of the Chinese Academy of Sciences (2018298).
Acknowledgments
The financial support of the National Natural Science Foundation of China (11774324 & 12074362), the Strategic Priority Research Program of the Chinese Academy of Sciences (XDA 21080200) and the Youth Innovation Promotion Association of the Chinese Academy of Sciences (2018298) are gratefully acknowledged.
Conflicts of Interest
The authors declare no conflict of interest.
References
- Lee, S.J.; Jung, C.Y.; Yi, S.C. Computational analysis on the electrode geometric parameters for the reversible solid oxide cells. Electrochim. Acta 2017, 242, 86–99. [Google Scholar] [CrossRef]
- Liu, T.L.; Wang, C.; Hao, S.J.; Fu, Z.Q.; Peppley, B.A.; Mao, Z.M.; Wang, J.L.; Mao, Z.Q. Evaluation of polarization and hydrogen production efficiency of solid oxide electrolysis stack with La0.6Sr0.4Co0.2Fe0.8O3−δ- Ce0.9Gd0.1O1.95 oxygen electrode. Int. J. Hydrogen Energy 2016, 41, 15970–15978. [Google Scholar] [CrossRef]
- Hauch, A.; Brodersen, K.; Chen, M.; Mogensen, M.B. Ni/YSZ electrodes structures optimized for increased electrolysis performance and durability. Solid State Ion. 2016, 293, 27–36. [Google Scholar] [CrossRef]
- Wang, Y.; Yang, Z.; Han, M.; Chang, J. Optimization of Sm0.5Sr0.5CoO3−δ-infiltrated YSZ electrodes for solid oxide fuel cell/electrolysis cell. RSC Adv. 2016, 6, 112253–112259. [Google Scholar] [CrossRef]
- Shao, L.; Wang, S.; Qian, J.; Ye, X.; Wen, T. Optimization of the electrode-supported tubular solid oxide cells for application on fuel cell and steam electrolysis. Int. J. Hydrogen Energy 2013, 38, 4272–4280. [Google Scholar] [CrossRef]
- Li, W.; Shi, Y.; Luo, Y.; Cai, N. Theoretical modeling of air electrode operating in SOFC mode and SOEC mode: The effects of microstructure and thickness. Int. J. Hydrogen Energy 2014, 39, 13738–13750. [Google Scholar] [CrossRef]
- Baldinelli, A.; Barelli, L.; Bidini, G. Performance characterization and modelling of syngas-fed SOFCs (solid oxide fuel cells) varying fuel composition. Energy 2015, 90, 2070–2084. [Google Scholar] [CrossRef]
- Mahmood, A.; Bano, S.; Yu, J.H.; Lee, K.H. Performance evaluation of SOEC for CO2/H2O co-electrolysis: Considering the effect of cathode thickness. J. Co2 Uti. 2019, 33, 114–120. [Google Scholar] [CrossRef]
- Zheng, Y.; Li, Q.; Chen, T.; Wu, W.; Xu, C.; Wang, W.G. Comparison of performance and degradation of large-scale solid oxide electrolysis cells in stack with different composite air electrodes. Int. J. Hydrogen Energy 2015, 40, 2460–2472. [Google Scholar] [CrossRef]
- Leng, Y.; Chan, S.H.; Liu, Q. Development of LSCF-GDC composite cathodes for low-temperature solid oxide fuel cells with thin film GDC electrolyte. Int. J. Hydrogen Energy 2008, 33, 3808–3817. [Google Scholar] [CrossRef]
- Riedel, M.; Heddrich, M.P.; Friedrich, K.A. Analysis of pressurized operation of 10 layer solid oxide electrolysis stacks. Int. J. Hydrogen Energy 2019, 44, 4570–4581. [Google Scholar] [CrossRef]
- Fan, H.; Keane, M.; Singh, P.; Han, M.J. Electrochemical performance and stability of lanthanum strontium cobalt ferrite oxygen electrode with gadolinia doped ceria barrier layer for reversible solid oxide fuel cell. J. Power Sources 2014, 268, 634–639. [Google Scholar] [CrossRef]
- Henke, M.; Willich, C.; Kallo, J.; Friedrich, K.A. Theoretical study on pressurized operation of solid oxide electrolysis cells. Int. J. Hydrogen Energy 2014, 39, 12434–12439. [Google Scholar] [CrossRef]
- Ni, M.; Leung, M.K.H.; Leung, D.Y.C. Parametric study of solid oxide steam electrolyzer for hydrogen production. Int. J. Hydrogen Energy 2007, 32, 2305–2313. [Google Scholar] [CrossRef]
- Kong, W.; Li, J.; Liu, S.; Lin, Z. The influence of interconnect ribs on the performance of planar solid oxide fuel cell and formulae for optimal rib sizes. J. Power Sources 2012, 204, 106–115. [Google Scholar] [CrossRef]
- Lin, Z.; Stevenson, J.W.; Khaleel, M.A. The effect of interconnect rib size on the fuel cell concentration polarization in planar SOFCs. J. Power Sources 2003, 117, 92–97. [Google Scholar] [CrossRef]
- Liu, S.; Song, C.; Lin, Z. The effects of the interconnect rib contact resistance on the performance of planar solid oxide fuel cell stack and the rib design optimization. J. Power Sources 2008, 183, 214–225. [Google Scholar] [CrossRef]
- Liu, S.; Kong, W.; Lin, Z. Three-dimensional modeling of planar solid oxide fuel cells and the rib design optimization. J. Power Sources 2009, 194, 854–863. [Google Scholar] [CrossRef]
- Kornely, M.; Leonide, A.; Weber, A.; Ivers-Tiffée, E. Performance limiting factors in anode-supported cells originating from metallic interconnector design. J. Power Sources 2011, 196, 7209–7216. [Google Scholar] [CrossRef]
- Jeon, D.H.; Nam, J.H.; Kim, C.-J. Microstructural Optimization of Anode-Supported Solid Oxide Fuel Cells by a Comprehensive Microscale Model. J. Electrochem. Soc. 2006, 153, A406. [Google Scholar] [CrossRef]
- Kong, W.; Gao, X.; Liu, S.; Su, S.; Chen, D. Optimization of the interconnect ribs for a cathode-supported solid oxide fuel cell. Energies 2014, 7, 295–313. [Google Scholar] [CrossRef]
- Gao, X.; Zhang, Q.; Zhang, W.; Chen, D. Optimization of distributed cylindrical interconnect ribs for anode- and cathode-supported solid oxide fuel cell. Int. J. Electrochem. Sci. 2015, 10, 7521–7534. [Google Scholar]
- Nguyen, V.N.; Fang, Q.; Packbier, U.; Blum, L. Long-term tests of a Jülich planar short stack with reversible solid oxide cells in both fuel cell and electrolysis modes. Int. J. Hydrogen Energy 2013, 38, 4281–4290. [Google Scholar] [CrossRef]
- Kong, W.; Zhu, H.; Fei, Z.; Lin, Z. A modified dusty gas model in the form of a Fick’s model for the prediction of multicomponent mass transport in a solid oxide fuel cell anode. J. Power Sources 2012, 206, 171–178. [Google Scholar] [CrossRef]
- Tseronis, K.; Kookos, I.K.; Theodoropoulos, C. Modelling mass transport in solid oxide fuel cell anodes: A case for a multidimensional dusty gas-based model. Chem. Eng. Sci. 2008, 63, 5626–5638. [Google Scholar] [CrossRef]
- Yang, C.; Wang, J.; Zhao, J.; Wu, Y.; Shu, C.; Miao, H.; Wang, F.; Ye, W.; Yuan, J. CFD modeling and performance comparison of solid oxide fuel cell and electrolysis cell fueled with syngas. Int. J. Energy Res. 2019, 43, 2656–2677. [Google Scholar] [CrossRef]
- Chen, D.; Lin, Z.; Zhu, H.; Kee, R.J. Percolation theory to predict effective properties of solid oxide fuel-cell composite electrodes. J. Power Sources 2009, 191, 240–252. [Google Scholar] [CrossRef]
- Zhu, H.; Kee, R.J. Modeling distributed charge-transfer processes in SOFC membrane electrode assemblies. J. Electrochem. Soc. 2008, 155, B715. [Google Scholar] [CrossRef]
- Kim, S.J.; Choi, G.M. Stability of LSCF electrode with GDC interlayer in YSZ-based solid oxide electrolysis cell. Solid State Ion. 2014, 262, 303–306. [Google Scholar] [CrossRef]
- Jiang, S.P. Sintering behavior of Ni/Y2O3-ZrO2 cermet electrodes of solid oxide fuel cells. J. Mater. Sci. 2003, 38, 3775–3782. [Google Scholar] [CrossRef]
- Çelikbilek, O.; Siebert, E.; Jauffrès, D.; Martin, C.L.; Djurado, E. Influence of sintering temperature on morphology and electrochemical performance of LSCF/GDC composite films as efficient cathode for SOFC. Electrochim. Acta 2017, 246, 1248–1258. [Google Scholar] [CrossRef]
- Reddy, K.R.; Karan, K. Sinterability, mechanical, microstructural, and electrical properties of gadolinium-doped ceria electrolyte for low-temperature solid oxide fuel cells. J. Electroceram. 2005, 15, 45–56. [Google Scholar] [CrossRef]
- Wei, W.; Chen, W.; Ivey, D.G. Oxidation resistance and electrical properties of anodically electrodeposited Mn-Co oxide coatings for solid oxide fuel cell interconnect applications. J. Power Sources 2009, 186, 428–434. [Google Scholar] [CrossRef]
- Lee, T.-R.; Im, H.N.; Jeon, S.Y.; Yoo, Y.S.; Chavan, A.U.; Song, S.J. Dependence of H2O/CO2 Co-Electrolysis Performance of SOEC on Microstructural and Thermodynamic Parameters. J. Electrochem. Soc. 2016, 163, F728–F736. [Google Scholar] [CrossRef]


Publisher’s Note: MDPI stays neutral with regard to jurisdictional claims in published maps and institutional affiliations. |
© 2020 by the authors. Licensee MDPI, Basel, Switzerland. This article is an open access article distributed under the terms and conditions of the Creative Commons Attribution (CC BY) license (http://creativecommons.org/licenses/by/4.0/).