Abstract
Steady state flow boiling experiments were carried out on several heated tubes with outer diameter 9.14 mm at outlet pressures 120, 200 and 300 kPa, inlet temperatures 64, 78 and 91 °C and approximately 400, 500, 600 and 800 kg/(m2·s) mass flux entering the vertically aligned test annulus until critical heat flux (CHF) was reached. The tubes were made of Inconel 625 with a length of 400 mm. The Inconel tubes were tested in three different modifications as smooth, abraded with 150 grit sandpaper and bead blasted. Multiple experiments were repeated on the same specimen to investigate the effect of surface characteristic changes (i.e., wettability, roughness and oxide layer morphology) on the occurrence of CHF. Despite the changes in initial wettability, the CHF dependency was not clearly observed, however, the changes in roughness led to an increase in CHF. The total number of 115 experimental runs were collected and the results were also compared with other literature experimental data.
1. Introduction
The critical heat flux (CHF) causes a fast reduction of heat transfer coefficient with a rapid increase of cladding temperature, which may lead to physical failure of the heated material. Understanding the CHF phenomena and boiling behavior is key for nuclear fuel design and crucial for reactor thermal margin and safety analysis. As a departure from nucleate boiling would damage the fuel claddings, a safety margin from CHF has to be kept during reactor operation, leading to a limitation on the reactor power. Measures to scale up the CHF are therefore interesting for economic and safety reasons. Because of its complexity, the CHF is still an active research topic of interest.
Boiling experiments can be divided into two groups by the flow of coolant. The first group represents pool boiling experiments that are easily maintained and therefore are very popular among various research teams. The experiments are usually carried out at atmospheric pressure on small steel plates or thin wires. In the last years, a lot of pool boiling CHF were measured with the main goal of comparing a variety of materials with different surface characteristics (i.e., wettability, roughness, porosity and oxide layer morphology). Pool boiling studies showed a strong agreement on the impact of surface morphology on CHF. It can be seen in the work of O’Hanley et al. [1], Seo et al. [2], Son et al. [3], Ali et al. [4], Kam et al. [5] and Liang et al. [6].
The other group is represented by flow boiling experiments where the surface effects can be also studied but firstly, the flow parameters together with the geometry of the test section have to be set. Sun et al. [7] carried out experiments on smooth and enhanced copper tubes using refrigerants as a working medium. Results obtained at a pressure of 1 MPa, mass fluxes from 70 to 200 kg/(m2·s) and heat fluxes in the range from 10 to 35 kW/m2 showed higher heat transfer performance for enhanced tubes than the smooth one, which authors attributed to the complex two-layer surface structures of enhanced tubes. Extensive studies were performed for high pressure together with high flow conditions on tubes and rod bundles [8], however, for low pressure and low flow, the experimental data are rare. The conducted experiments were usually close to normal operating conditions (pressures over 15 MPa and specific mass fluxes around 4000 kg/(m2·s)) in nuclear reactors but these days the aim is to perfectly analyze accident conditions for which the low pressure is characteristic.
Haas [9] did an extensive background research of the flow boiling experiments at low flow and pressure performed with emphasis on annular geometry. The general comparison of CHF in annulus to CHF in a tube was performed by Doerffer [10], who collected data from 980 kPa to 14,100 kPa which can be still considered as high pressure. Chun [11] conducted the experiments at a wider range of pressures from 570 kPa to 15,010 kPa. Fiori and Bergles [12] investigated CHF in annular geometry at low pressures of 148–600 kPa and using an outer glass tube, they observed flow regimes during experiments. Rogers [13], El-Genk [14] and Schoesse [15] investigated CHF at constant pressures of 156, 118 and 128 kPa at different mass fluxes. Mishima and Nushihara [16] focused on very low subcooling of inlet water at a pressure of 100 kPa. Mayer et al. [17] also measured CHF in the annulus at pressures from 110 kPa to 225 kPa with a variety of mass fluxes and compared their data with several correlations of researchers above. The summarized experimental parameters of literature data are stated in Table 1.

Table 1.
Experimental parameters of literature data of critical heat flux (CHF) experiments in annular geometry.
Haas [9,20] also presented his experimental data from the COSMOS test facility which inspired the authors’ research team in developing a test facility of similar design. Haas mentioned that pretests in the test facility showed that the flow boiling process without stabilizing precautions was highly affected by instabilities. A pulsating flow boiling process could be observed in case of unstable flow conditions. These oscillations caused premature CHF at a much lower input than for stable conditions. This had to be taken into account during pretests at the present test facility.
The results of surface characteristics of CHF for flow boiling in the vertical annulus are very scarce. Lee et al. [21,22] performed several experiments on heated tubes with a variety of materials including Zircaloy, stainless steel, Inconel and FeCrAl. Despite the notable changes in CHF during pool boiling caused by different wettability, roughness and porosity, the measured flow boiling CHF did not provide a suitable explanation for the observed CHF difference. The authors emphasized the wider range of macroscopic parameters or microscopic-level investigations of boiling phenomena to explain material sensitivity on flow CHF. Haas et al. [20] did an extensive study on micro-structures of Zircaloy and there was also no clear link between the CHF values and the wettability characteristics appropriate to describing the similarities and differences in CHF performance. Their observation indicated that capillarity effects and porosity can have a positive impact on CHF because of the increase of nucleation sites.
Lee [23] demonstrated that CHF tends to decrease with increasing thickness of cladding up to 0.711 mm. Nascimento [24] and Wang [25] studied flow boiling CHF with nanofluids deposition. The results indicated that CHF of nanofluid flow boiling is enhanced compared with base fluid. Another detailed review was done by Moghadasi et al. [26] who concentrated on the use of nanoparticles. Authors analyzed that metal oxide nanoparticles surface modification leads to the CHF enhancement. In their work, authors addressed diverse aspects of the current field of study, such as physical, technical and theoretical and they discussed the enhancement findings made so far. Additional information related to micro\nanoscale surface coating could be found in the work of Khan et al. [27].
In this work, the set of experiments were performed on Inconel 625 material and its surface modifications. The experiments were conducted at different pressures, inlet temperatures and inlet mass fluxes in order to achieve the least amount of oscillations. The aim of the work was to compare measured data to available literature and to analyze the impact of flow properties together with different surface modifications on measured CHF. The collected data will serve as a reference for future comparison.
2. Experimental Setup
The flow boiling experiments were performed on the Mobile Research Critical Heat Flux Apparatus (MRCHA) which was constructed and operated by the Brno University of Technology at the Faculty of Electrical Engineering and Communication.
The flow boiling test facility consisted of two circuits. The primary loop serves as transport of deionized water to the test section under desired conditions. The secondary loop regulates the temperature differences between primary loop and water mains. The secondary loop basically consists of heat exchangers, circulation pump and several bypasses. The primary circuit consists of pressurizer, condenser, preheater, test section, pump and instrumentation as can be seen in Figure 1.
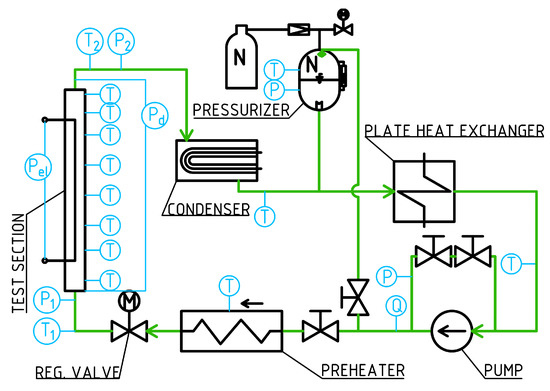
Figure 1.
Process flow diagram of the Mobile Research Critical Heat Flux Apparatus (MRCHA) test facility primary loop.
The pressurizer is connected to the primary circuit and stores working fluid and maintains the required level of test section output pressure. The primary heat exchanger decreases the temperature of condensed water from the condenser. The cooled-down water is delivered from the heat exchanger to the preheater by the main circulation pump. The preheater adjusts inlet subcooling of the working fluid entering the test section. A control valve is placed right behind the preheater to throttle and control the flow of water to the test section. The working fluid enters the test section in a vertical alignment. The heated fluid from the test section flows to the condenser through a backflow valve ensuring the safety of the facility.
The deionized water with conductivity approximately equal to 30 μs/cm and pH equal to 9.4 (the average values measured at the beginning and the end of the test day) had been used as the working fluid until an ionex filter bypass was installed. The facility was insulated with a steam-resistant high-temperature fiberglass insulation to minimize heat losses to the environment.
2.1. Test Section
A detailed cross-sectional view of the test section is shown in Figure 2. The test section for flow boiling CHF experiments is designed as the vertical annulus. The heated tube is connected to the power supply by copper rods which create inlet and outlet non-heated Sections 144 mm and 114 mm long. The copper power terminal on the inlet was machined to 9 mm outer diameter and the outlet to 10 mm outer diameter. Both copper terminals were covered by nickel. To ensure test section tightness, the test tube and copper terminals were pressed together and then soldered with lead-free tin solder. The bottom copper rod is connected to the power supply via thermal expansion joint (see part g) of Figure 3) to compensate for possible thermal dilatation.
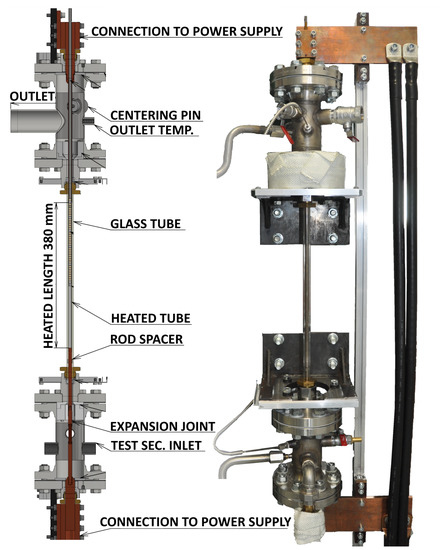
Figure 2.
The cross-sectional view of the MRCHA test section and its actual photography.
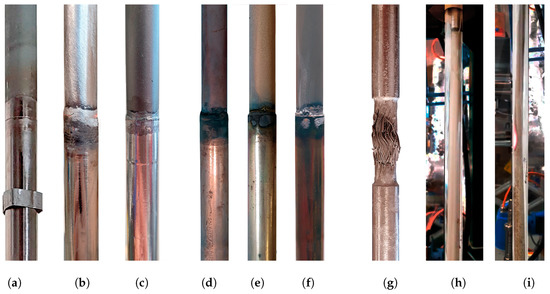
Figure 3.
(a) bottom connection of IN to the copper electrode (with a spacer below); (b) upper connection of IN150 to the copper electrode; (c) upper connection of INB to the copper electrode; (d) upper connection part of IN after experiments; (e) upper connection part of IN150 after experiments; (f) upper connection part of INB after experiments; (g) thermal dilatation joint; (h) bending of the heated IN150 tube at the boiling crisis; (i) glowing of already oxidized IN150 tube.
The test annulus geometry is described in Table 2. The test tube is centered in the glass tube by a spacer (see part a) of Figure 3) located in the lower part of the test section and by a centering pin in the upper part of the test section. The heat losses of the glass tube were estimated to 50 W with an input power of 20 kW. Inside of the test tube a measurement probe is inserted.
Table 2.
The details of test annulus geometry.
The test section is heated by the direct current power supply via copper power terminals. DC power supply was tested up to 97.5 kW and at 1500 A and 65 V and for a short time it can provide up to 1700 A and 70 V.
The heated length of the test tube is 380 mm (400 mm tubes are connected by 10 mm from both sides) and the temperature is measured by nine K-type thermocouples with a sheet diameter of 0.5 mm placed on the inner surface of the heated length as using a test probe. Thermocouples measure the surface temperature and detect the temperature overshoot from the CHF occurrence. Inlet and outlet temperature of the fluid from the test section is measured by two four-wire platinum PT100 sensors. During operation of the facility, a camera was used to record a progression of the experiment.
The test probe went through several improvements. The first version was inspired by Haas [9] and was made from steel parts with small plastic rings from PEEK material (see parts (a) and (b) of Figure 4) intended to isolate thermocouple from the steel part and to pin the thermocouples down to the test tube, see Figure 4. The first version was not functional at all, probably due to bad electric isolation of thermocouples and the probe, so a new version was made. The second version was made completely from PEEK material, as can be seen in parts (c) and (d) of Figure 4. The isolation of thermocouples was perfect, however, the temperature stability of the plastic rings was weak so this version was also not ideal for long-term use. However, the first half of experimental data were collected with this version.
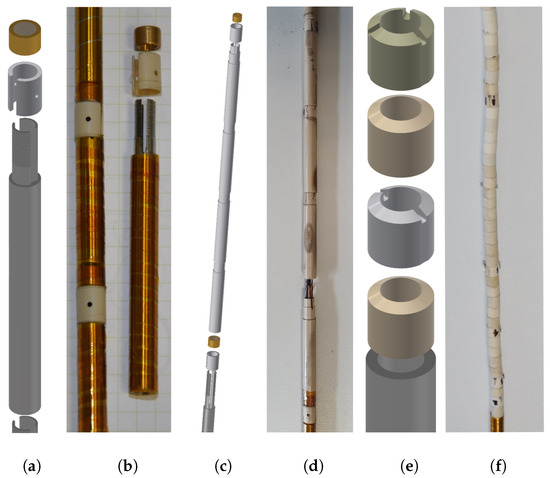
Figure 4.
(a) design of the first measurement probe; (b) photo of the first probe; (c) design of the second measurement probe; (d) photo of the second probe (e) design of the third measurement probe; (f) photo of the third probe.
Finally, the third version of the test probe was created. The whole probe was made from ceramic rings. The design of all three measurement probes can be seen in part (e) of Figure 4 together with its actual appearance in part (f). Apart from the very top ring from PEEK, the third version of the probe can last in high temperatures and it is completely nonconducting. With this version the experiments could be performed at higher mass fluxes and higher pressures. The thermocouples were isolated from each other by capton bands. All of the versions had the same setup of thermocouples with axial positions from top to bottom at 10, 60, 110, 160 and 210 mm. The top position was crucial so the thermocouples were doubled (two TC at the same height 180 degrees from themselves) at the four top positions.
2.2. Measurement Procedure and Uncertainties
The CHF experiments at the MRCHA facility are carried out in the vertical annulus test section at different pressure, mass flux and inlet temperature. The parameters are kept constant while the power input is smoothly increased with circa 350 W/min according to heated tube electric resistance.
Every test day begins with degassing of the primary circuit to remove non-condensable gases. The degassing process usually takes about 70 min when the water is boiling until the oxygen content in the loop reaches the value of circa 0.8 mg/L. After this the loop is ready to use and the parameters are adjusted to desired values (as can be seen in Table 3, the standard deviation in the table shows deviation from target value) and the power can be slowly increased until the CHF is detected.
Table 3.
Experimental setup of parameters with deviations.
The CHF is detected by temperature overshoot measured by one of the K-type thermocouples described above. The temperature limit is fixed to specific values based on the pretests. When the limit temperature is reached the input power is automatically shut off. Usually every experimental run takes about 30 min.
Different measurement devices were installed in the test loop in order to control and adjust the state of it. Mass flow was measured by Coriolis flow meter Promass 80F15, inlet fluid temperature was measured by PT100 sensors. Pressure was captured with pressure transmitters DMP 331i. The output from the power source was measured by a shunt resistor. The devices were checked in calibration tests and the accuracy of every measured parameter is stated in Table 4.
Table 4.
Accuracy of measurement devices.
The power is calculated by multiplication of electric current and voltage. The heat flux is then estimated by dividing the power by the heated surface which is equal to where is the inner diameter of the annulus and L is the heated length. Based on the slight differences in diameters of individual tubes, the effect of surface treatment, operation and precision of measuring it is assumed that is equal to 0.05 mm, similarly the = 2 mm because of the uncertainty of pressing depth. The relative deviation of critical heat flux is derived from statistical experimental data processing theory [28] and above description. It is calculated as:
The Coriolis flow meter is quite accurate, however, the deviation of quartz glass alongside the axis is substantial and the diameter deviation is 0.11 mm. The mass flux is calculated by dividing the measured mass flow rate F by the flow area of the annulus and the relative deviation is based also on the statistical analysis and can be therefore determined as:
The same approach was used for example by Haas et al. [9]. All calculated relative deviations together with accuracy of measured parameters can be seen in Table 4.
2.3. Surface Characteristics Measurement
The investigated material was Inconel 625 with its three surface modifications including a technically smooth surface tube (IN), an abraded tube with 150 grit sandpaper (IN150) and bead-blasted with 80–140 μm glass balls (INB) tube, see Figure 3a–c. The glass tube creating the test annulus was damaged during the tests and had to be replaced. Unfortunately, the reserve glass tube had a different diameter. All details of test annulus geometry are stated in Table 2.
2.3.1. Roughness
Surface roughness measurements were performed by a confocal laser microscope Olympus Lext OLS4100 according to CSN EN ISO 4288 standard [29]. The samples were cleaned with demineralized water and isopropyl alcohol before the measurements.
At first, the modification of Inconel tubes had to be prepared. Sandpapering was done manually at 45° angle to the vertical axis as can be seen in Figure 5. It is visible that the surface was scratched, however, the scratches were not very deep, with a maximal Rt value of 8.64 μm compared to 4.83 μm of smooth Inconel tube, see Figure 6. The small difference in Rt value was probably caused by the hardness of Inconel 625. A similar behavior was observed on the bead-blasted Inconel tube (Figure 7) which, despite being blasted with 80–140 μm glass balls, had Rt equal to 10.93 μm. The highest value of roughness was measured on the bead-blasted tube, see Table 5.
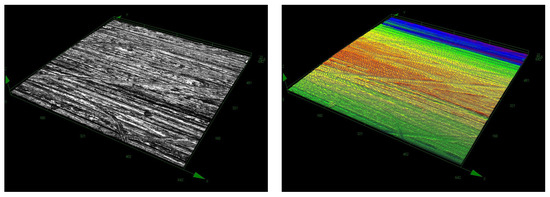
Figure 5.
Surface microscopic image of abraded Inconel tube.
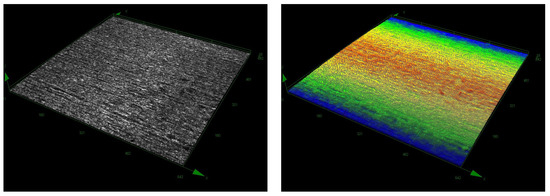
Figure 6.
Surface microscopic image of smooth Inconel tube.
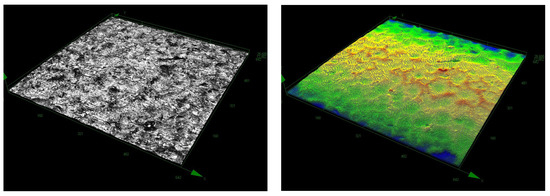
Figure 7.
Surface microscopic image of bead blasted Inconel tube.
Table 5.
Roughness
2.3.2. Surface Wettability and Static Contact Angle
The surface wettability was measured by a static sessile drop method using the See System E tool created by Advex Instruments [30]. It was conducted after the roughness measurement. The system consists of a camera with a high-resolution glass objective lens that takes pictures and the SEE software analyzes the drop of liquid. The software calculates the contact angle based on the tangents between a drop of liquid and a studied material. The examples for individual materials are shown in the Figure 8, Figure 9 and Figure 10.
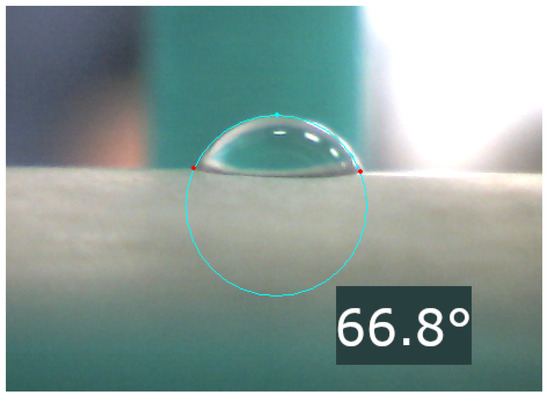
Figure 8.
Smooth IN surface contact angle.
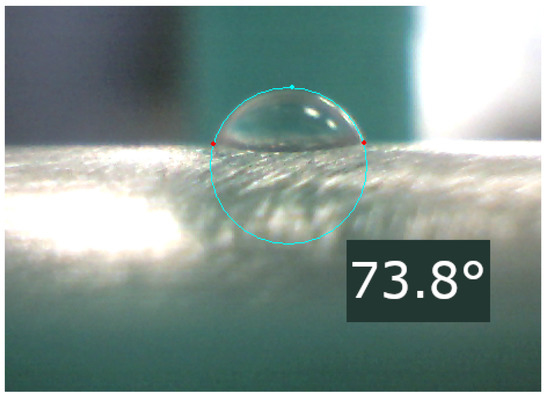
Figure 9.
IN150 surface contact angle.
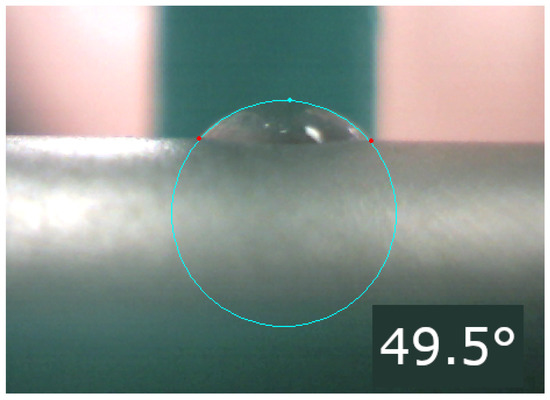
Figure 10.
INB surface contact angle.
The samples were put into acetone for approximately 1 minute and then into hydrochloric acid for 5–10 s. During the measurement, each sample was placed in a 3D printed stand to prevent movement of the tube and then the liquid was applied using a micropipette. The amount of 2.5 μL demineralized water sampled directly from the test loop was used for every measured value. After a drop was placed onto a sample, the camera was manually focused and multiple shots of the drop were taken. Afterwards, the SEE software was used to calculate contact angle, the software required the user to manually select three points on the surface of the water drop to analyze the sample.
At least fifteen tests were performed on each sample, then the average values and standard deviations were calculated. The results and deviations can be seen in Table 6. The relatively high deviation can be caused by the manual application of the water and small diameter of the tubes which could cause a drop to spill. However, the results are in reasonably good agreement with [31].
Table 6.
Wettability measurement results as contact angle.
3. Results and Discussion
The critical heat flux experiments were performed on the Inconel 625. From this alloy, three specimens were manufactured including a technically smooth surface tube (IN), abraded tube with 150 grit sandpaper (IN150) and bead-blasted (INB) tube, see Figure 3a–c. The CHF was observed on all of the tubes in a vertical, internally heated annular test section at different mass fluxes, outlet pressure and inlet temperature conditions. The modification of surfaces lead to small changes in diameters and also to different length to diameter ratios. During the experiments the glass tube had been damaged so it was swapped for a different one with a slightly bigger diameter. The flow rates were adjusted to keep the same mass flux. All modifications of geometry are summarized in Table 2 and the flow parameters are stated in Table 3.
In this section, the analysis of measured data from the MRCHA facility will be presented. First, the variety of effects on CHF will be discussed including flow parameters (i.e., inlet temperature, outlet pressure and mass flux) and surface characteristics (i.e., wettability, roughness and oxide layer morphology), then the implications and future research will be stated.
3.1. Comparison with Literature Data
Since the experimental data from the MRCHA facility have never been presented, a comparison with literature data is needed to confirm its validity. Because every CHF test facility has slightly different test section geometry including the inner or outer diameter of annulus, heated length or the flow experimental parameters, as can be seen in Table 1, the comparison is possible only with limited accuracy.
It can be seen that the MRCHA facility has similar ranges of flow parameters and similar geometry with Haas, Rogers and El-Genk although there are differences in length to heated diameter ratio and only some of the range of inlet parameters exactly fit.
Although the direct comparison was practically impossible, the data were compared to the most similar experiments. In the Figure 11 the measured values of the present work were compared with literature results. Despite the changes in experimental parameters, our own measured data were in accordance with the tendencies and the ranges of the literature data and especially with the Haas’s data [20]. The experimental parameters of the chosen literature data can be seen in Table 7. Only Chun’s data exceeded the pressure value of 500 kPa, the rest mostly around 120 kPa.
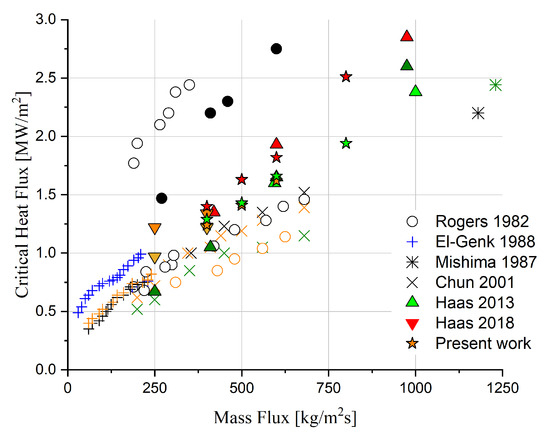
Figure 11.
Comparison of CHF results from literature data [9,20] and the MRCHA facility results with description in Table 7.
Table 7.
Experimental parameters of CHF literature data depicted in Figure 11.
3.2. Axial Position of Critical Heat Flux
The CHF occurrence does not need to be only at the top end axial position in accordance with a simplified physical model, which takes into account smaller fluid quality, greater enthalpy together with lower pressure. Although the vast amount of experiments support this model i.e., Rogers et al. [13], El-Genk [14] and Haas [9] using small annulus, however, there are several examples of exceptions, where the CHF occurred in lower positions. Schoesse [15], Fiori [12], Mayer [17] and Haas [9] with large annulus spotted minor number of CHF at lower axial positions.
Fiori et al. [12] mentioned that they observed a glowing hot patch which led to melting of the zirconium tube. Small oxidized spots were also visible after intensive boiling on the surface of the Zircaloy tube. These small dots were assumed to refer to nucleation sites where the surface was temporarily dried out during the periodic bubble growth and departure cycle.
Although a quite big number of glowing spots were observed on Inconel samples no melting-through behavior occurred, which can be explained by the higher temperature and strength resistance of Inconel 625 compared to stainless steel or zirconium alloy. The glowing sport is visible in part i) in Figure 3 and bending of the tube in part h) of the same figure.
Table 8 presents the statistics of axial positions of CHF occurrence for the top and the other parts in total. The majority of cases detect CHF on thermocouple number 1 and 2 at the top end part as it was expected according to the simplified physical model, however, almost at every fourth experimental run, the CHF was detected at a lower position. The effect of different axial positions between lower thermocouples generally appears to be random without any schematic form. It can be partially caused by instabilities.
Table 8.
Axial positions of CHF occurrence.
During the experimental runs, a camera was set to record the history of the experiments so the glowing phenomenon could be observed in detail. However, the glowing was mostly connected to the CHF close at the top position of the test section, it was spotted also at lower parts.
Because the non-measured distance between the thermocouples was from 1.5 cm (half of the perimeter) to 5 cm long the CHF could last as long as the crisis had grown and reached a position on the thermocouple. When the CHF occurred between the thermocouple, glowing and bending of the heated tube was recorded (Figure 3).
The frequency of CHF occurrence at the top was significantly higher, thus the number of detected glowing is also higher in the top part of the test section. However, when the CHF occurred at different positions than the top, the probability of glowing was higher. This is probably caused by the further spacing of the thermocouples.
3.3. The Effect of Outlet Pressure and Mass Flux on the CHF
The pressure influences fluid properties such as boiling temperature, density, viscosity or surface tension and, therefore, the dependency on CHF is not negligible and has to be examined even at low pressures. The other effect which was simultaneously investigated was the effect of mass flux. The amount of flow rate influences the speed of departure of bubbles from the surface and also it helps to create a turbulent flow which leads to higher values of CHF. At higher mass fluxes the decreasing outlet quality also significantly biases the CHF.
The measurements were carried out for pressures of 120, 200 and 300 kPa and mass fluxes of 400, 500, 600 and 800 kg/(m2·s). Since the inlet temperature was increased together with pressure, its effect was the same.
The effect of pressure and mass flux on CHF has been widely investigated for the annular geometry and CHF tends to increase as the pressure and mass flux increase. Chun [11], Haas et al. [9] and Mayer et al. [17] have also investigated this effect and the present work is in agreement with them as can be seen in Figure 12, Figure 13 and Figure 14 where the data from three different surfaces are plotted.
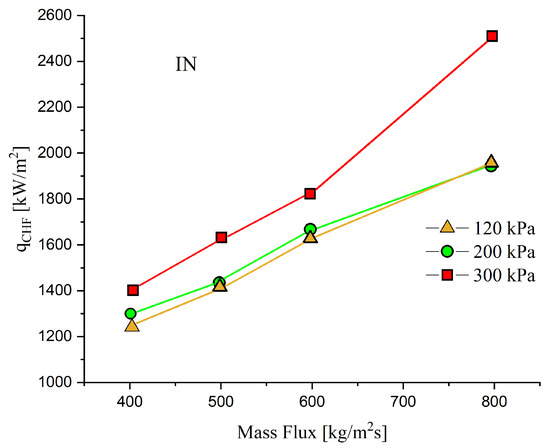
Figure 12.
CHF measurements as a function of mass flux at different outlet pressures and inlet subcooling on smooth Inconel tube.
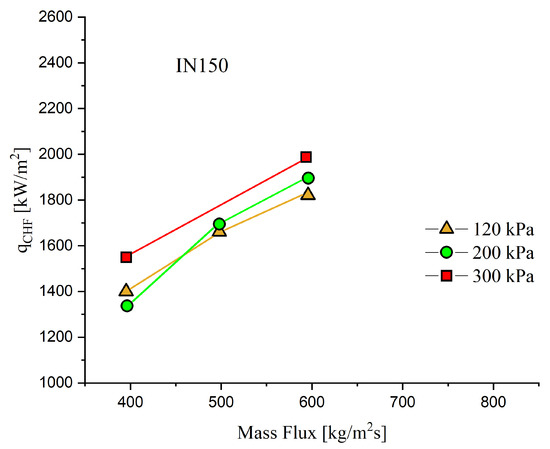
Figure 13.
CHF measurements as a function of mass flux at different outlet pressures and inlet subcooling on abraded Inconel tube.
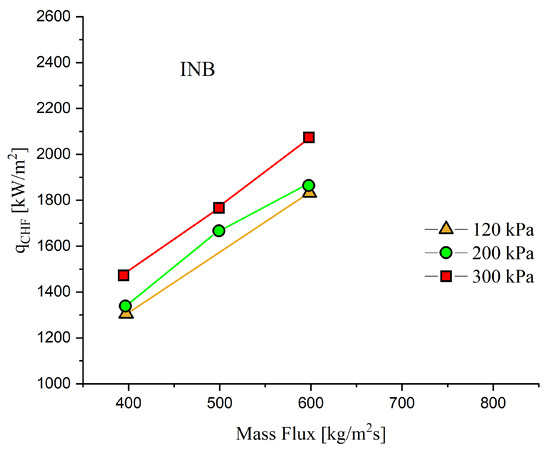
Figure 14.
CHF measurements as a function of mass flux at different outlet pressures and inlet subcooling on Inconel bead blasted tube.
The figure illustrates that the effect of outlet pressure is more obvious at higher mass fluxes where the differences are substantial, however, at low mass fluxes the difference in CHF is almost negligible concerning the measurement uncertainties. The most obvious dependency of increasing CHF with rising pressure was observed at smooth Inconel material (see Figure 12). The tendencies for the abraded (see Figure 13) and bead blasted (see Figure 14) IN surface were almost identical with small differences between 120 and 200 kPa and with obviously higher CHF at 300 kPa. These tendencies are in agreement with Mayer et al. [17] who observed almost linear growth of CHF with pressure but at smaller mass fluxes. These results better comply with Haas et al. [9]. However, the changes in inlet subcooling were small in the present work, Hass measured pressure effects at the constant value of subcooling. Haas also found a more distinct increase at higher pressures and what is more the results at 400 kg/(m2·s) are almost in agreement with Haas’s later experiments [20] on Zircaloy-4. Unfortunately, the higher mass fluxes were not measured there so the comparison with our work is not possible.
3.4. The Effect of Different Surface Treatment
The effect of flow conditions has an obvious impact on CHF however, in the literature there are no clear implications of surface characteristics influencing the CHF values. Taking aside the pool boiling experiments where the surface clearly influences the CHF, during the flow boiling experiments no such conclusion was made. The flow boiling measurements on different surfaces were observed only by Haas et al. [20] and Lee et al. [21,22]. Haas stated that there were no clear links between CHF and wettability but also stated that porosity and capillarity can have a positive impact on CHF. Lee wrote that there were no clear relationships between notable changes in wettability, roughness and oxide layer characteristics and the occurrence of CHF. Lee [23] observed a relationship between cladding thickness and CHF, however, in the present work all the claddings had comparable thicknesses.
In the present work, the tubes with different surface treatments from Inconel 625 were tested including a technically smooth tube (IN), abraded tube with 150 grit sandpaper (IN150) and bead-blasted tube (INB). The smooth Inconel tube was chosen as a reference specimen. On these three specimens, the analyses of wettability, roughness and oxide layer characteristics were made. The geometric parameters are stated in Table 2, static contact angles in Table 6 and roughness in Table 5.
The materials were tested at several experimental conditions, as can be seen in Table 3. Unlike the literature data, the material modification had an obvious impact on CHF. At the outlet pressure of 120 kPa (Figure 15 and Table 9) there is a clear increase in CHF for IN150 at different mass fluxes up to 17.3%. At the bead-blasted surface the changes were also notable yet smaller, up to 12.5%.
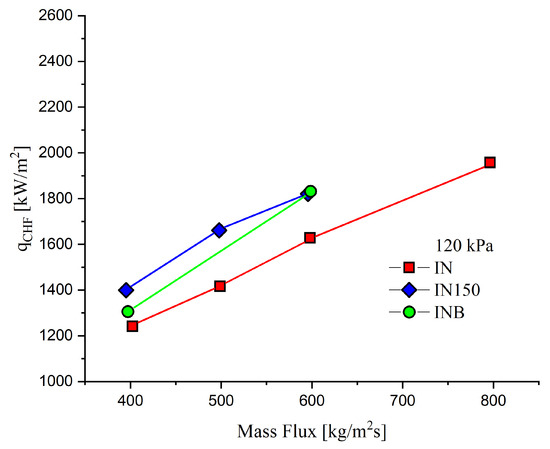
Figure 15.
Measured CHF at kPa and °C on four different surfaces in the function of mass flux.
Table 9.
CHF results of all investigated samples at 120 kPa.
At the pressure of 200 kPa (Figure 16 and Table 10) the differences in CHF were even more clear. Despite the lowest measured mass flux where the CHF was the same on every surface, the rest of the data illustrates an increase in the CHF values. The most notable were again the IN150 and INB surfaces where the rise reached 16.2 and 18.0% of the reference value.
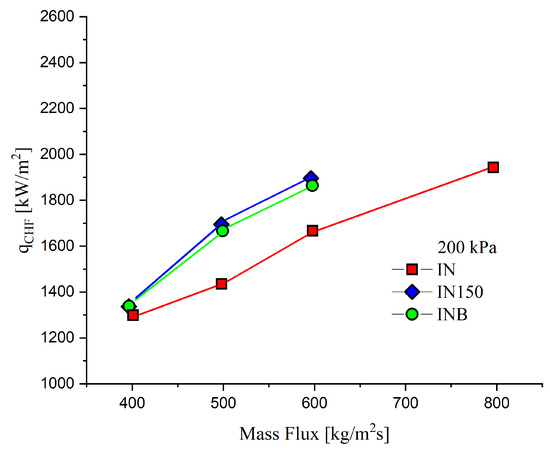
Figure 16.
Measured CHF at kPa and °C on four different surfaces in the function of mass flux.
Table 10.
CHF results of all investigated samples at 200 kPa.
The last measured pressure was at 300 kPa. Here the IN150 tube had again reached the highest CHF of all surfaces (see Table 11 and Figure 17). It was up to 10.2% higher than the reference tube results. The differences in CHF were also not so obvious at the lowest mass flux as at 200 kPa but with the rising flow rate the differences also grew. At the 800 kg/(m2·s) mass flux a sudden rise in CHF on the reference tube was observed at 300 kPa but at 200 kPa the smooth specimen tube behaved according to previous trends. During the highest mass flux, the CHF progression was faster together with temperature increase leading to a higher probability of tube glowing and bending. Bending of the tube at 1000 kg/(m2·s) led to fatal damage of the glass tube and that is why the number of data points at higher mass flux was smaller. The other surfaces were not measured at this mass flux value and it will be further observed in the future.
Table 11.
CHF results of all investigated samples at 300 kPa.
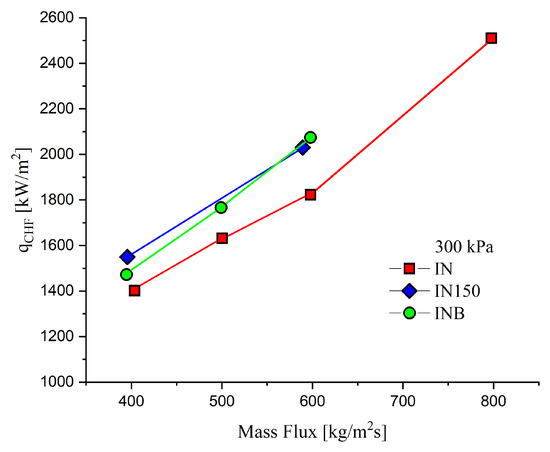
Figure 17.
Measured CHF at kPa and °C on three different surfaces in the function of mass flux.
Flow boiling experiments are only directly comparable if the flow parameters and the geometry are similar. In Table 1 the literature overview is given and it can be clearly seen that the direct comparison is not possible. Despite this fact Haas et al. [20] measured Zircaloy-4 tube at 400 kg/(m2·s), the same outlet pressures and inlet subcooling but with different geometry and concluded to comparable results of CHF.
3.5. The Effect of Oxide Layer
Another effect concerning the CHF measurement was witnessed during repetitive measurements at the same flow parameters at different times. The change of CHF values observed over the operation time (counted only as a time of boiling on the tube) alongside with the surface change after a number of CHF experiments. As a result, the oxide layer was created, mostly from passivation of Inconel surface and deposits from the carbon steel in the loop. A chemical analysis of the oxide layer had been conducted, which showed that the constituent substances are nickel and iron oxides (see the middle part of Figure 3). The CHF was plotted as a function of time in the Figure 18 only for a smooth IN tube, since the largest number of experimental runs were carried out on those samples.
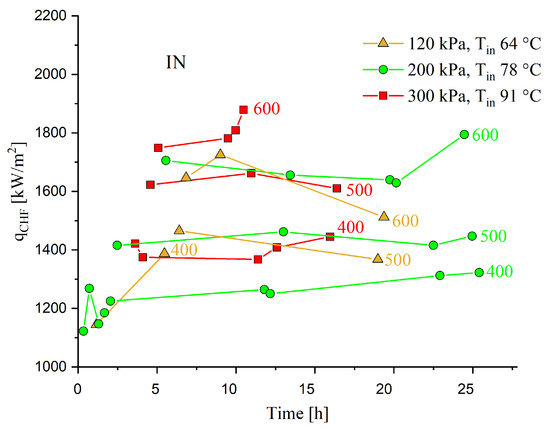
Figure 18.
Measured CHF on smooth Inconel tube in different operation time.
Despite the notable changes of CHF over time no clear relationship could be observed. It can be seen that for the pressure of 120 kPa the CHF value decreases in time, however, for 200 kPa the tendency is inverse or less obvious. At 300 kPa the effect of the oxide layer is barely visible and cannot be distinguished against the measurement uncertainties.
The oxide layer affected wettability, cladding thickness and roughness of the specimens, which could be an explanation of CHF increase as O’Hanley [1] stated. The transition was mostly visible at IN150 and INB surfaces probably because the modifications damaged the top layers of surfaces and the material was more vulnerable to oxidation, whereas the smooth tubes were more resilient to the deposits. Considerable work regarding oxide layer formation and its influence on boiling phenomena had been done by Wang [32,33,34]. In the [33] author studied surface oxidation under flow boiling condition at certain mass fluxes 60, 320 and 640 kg/(m2·s), where we observed a similar tendency of CHF change in contrast to current work, mainly the first CHFs of each mass flux was almost the same (not the case for 400 kg/(m2·s) in Figure 18) however, after some time (around 11 h for the current study), the CHF enhancement became higher. Nonetheless, this is not definite for all cases due to the randomness of the oxidation process forcing the CHF enhancements to different ratios [32].
The detailed investigation into the precise nature of the layer and its effect on the CHF will be subject to further research, since it was not the original aim of the experiments.
3.6. The Effect of Wettability and Roughness
The wettability and roughness can have an impact on CHF occurrence. Although in the flow boiling studies from Haas [20] and Lee [21] no dependencies of wettability on CHF have been found, a positive impact was observed during pool boiling experiments by O’Hanley [1], Ali [4] and Son [3]. In this work the differences in wettability were characterized by contact angle and summarized in Table 6. Considering the deviations the highest contact angle was measured at abraded Inconel tube and the lowest at a bead-blasted Inconel tube which both showed the highest values of detected CHF. Therefore, no clear relationships could be observed between wettability and CHF results. The contact angles in the present work varied from 50 to almost 80°, the effect would probably be possible to observe with extreme hydrophobic or hydrophilic materials [21]. The wettability can have an impact on CHF only with connection to other surface characteristics (i.e., capillarity, porosity or roughness).
Since the oxide layer creation had been observed on the specimen surface, the wettability was changing during the loop operation. The results of wettability should be supported by measurements of contact angles after a certain number of experimental runs. Unfortunately during the experiments, the contact angles were not measured directly after removing the tubes from the test section and because oxidation was faster on the air the results could not be presented here.
The roughness effect was again observed clearly during pool boiling experiments but during the flow boiling only Lee [21] focused on the roughness measurements with no clear implications. Haas [20] concentrated more on the porosity effect which could lead to similar observations. The results of roughness measurement is stated in Table 5. Apart from the wettability, the effect of roughness on CHF was apparent. The greatest or values were measured on the abraded and bead-blasted Inconel and so the CHF values. Despite the fact that evident implications of roughness effect on CHF were found, these results are only applicable to certain values of pressure and mass flux. The broader ranges of inlet fluid parameters should be compared together with greater changes in roughness.
4. Conclusions
In this study, the flow boiling critical heat flux experiments were conducted in annular geometry on three different surfaces under outlet pressures of 120, 200 and 300 kPa, inlet temperatures of 64, 78, 91 °C and mass fluxes of 40, 500, 600 and 800 kg/(m2·s). The surfaces included a smooth Inconel 625 tube, abraded Inconel 625 tube with 150 grit sandpaper and bead-blasted Inconel 625. The regimes were chosen in order to allow direct and consistent comparison of the specimens. Multiple measurements were performed on the same surface during the same test parameters to investigate the effects of surface characteristics changes (i.e., roughness, wettability, and oxide layer morphology) to the occurrence of CHF.
Since the fluid in the primary cycle had not been cleansed by ionex filters between the experiments the tubes tended to corrode. A black oxide layer was apparent after several days of testing on Inconel specimens. Evaluation of the arisen layer effect was also performed in this paper.
Since the low pressure and low flow data are scarce, moreover absent for Inconel 625 sample, the obtained results broaden the CHF database for values of different pressures, mass fluxes and heat fluxes stated above. This data can be used for CHF evaluation during accidents because the pressure is much lower during accidents and together with surface structure analysis it can help to better understand CHF phenomena. This knowledge can be therefore used when designing new types of nuclear fuel with enhanced accident tolerance. The key findings are as follows:
- Our measured data comply with general observations found in low pressure and low flow conditions meaning that the CHF values increases with increasing pressure and mass flux. The effect of rising mass flux is observed on every specimen as well as the increase of CHF with pressure.
- The measured CHF values agree with limited literature data in the value range and tendencies.
- The CHF axial position varies in the upper half of the test section. According to results, almost every fourth experimental run leads to CHF occurrence at a different axial position than the top one.
- The CHF occurrence was observed on three different modifications of Inconel 625. The abrading modification leads to a substantial increase (up to 18%) in CHF among all the tested pressures and mass fluxes. The bead blasted tube results also show a rise in CHF value but not as high as the abraded tube. The mass flux of 800 kg/(m2·s) is measured only at a smooth Inconel surface because during higher mass fluxes the CHF occurrence together with temperature increase were significantly faster, leading to a higher probability of glass tube damage.
- Despite the notable changes in wettability no clear tendencies on CHF occurrence are found, however, comparing the roughness results the effect on CHF value is visible. With growing roughness, the CHF also increases.
- During the operation of the facility the oxide layer has been created on the specimens changing its surface characteristics. The variation of CHF values is observed during operation time however, no clear relationships have been found. The specimens should be measured for a longer time period and in similar time spans to better evaluate the conclusions from its effect on CHF.
The presented work supports the validation of the MRCHA test facility thus allowing us to continue with the research in this field. In the future more data points should be measured to better support observed phenomena. These data should serve as a reference for other measurements with other materials including accident tolerant fuel [35]. The facility should be improved for ionex filters preventing the corrosive particles from depositing on test tubes and therefore extend the operation time with a clean surface. A change of design of the inlet section should provide a better stability of flow with fewer disturbances. The improvement of the measuring probe should allow us to measure at higher mass fluxes. The wettability and roughness should be measured after the same time spans and also directly after the specimen removal in order to secure the unaffected results by other phenomena. The analysis of surface characteristics will continue and the findings will be supported by CHF calculations and comparisons of the CHF correlations. Effects on CHF of other surface characteristics (i.e., porosity or capillarity) will also be investigated.
Author Contributions
conceptualization, L.S.; methodology, L.S., K.S.; software, L.S.; validation, L.S., K.S. and T.P.; formal analysis, L.S.; investigation, D.V., T.P. and L.S.; resources, D.V.; data curation, T.P.; writing—original draft preparation, D.V.; writing—review and editing, D.V.; visualization, T.P.; surface analysis, P.G., K.S.; project administration, K.S.; funding acquisition, K.S. All authors have read and agreed to the published version of the manuscript.
Funding
The support from Student grant contest from the Czech Technical University with code SGS20/187/OHK4/3T/14 and from grant LTAUSA18198 of the Brno University of Technology is gratefully acknowledged.
Acknowledgments
Special thanks belong to Karel Katovsky who provided supervision and expert advice.
Conflicts of Interest
The authors declare no conflict of interest.
Abbreviations
The following abbreviations are used in this manuscript:
| Symbols | ||
| Inlet subcooling | (kJ/kg) | |
| Heated equivalent diameter | (mm) | |
| Tube outer diameter | (mm) | |
| Glass tube inner diameter | (mm) | |
| F | Mass flow rate | (kg/h) |
| G | Mass flux | (kg/(m2·s)) |
| L | Heated length | (mm) |
| Outlet pressure | (kPa) | |
| Q | Power output of DC source | (kW) |
| Critical heat flux | (kW/m2) | |
| Reference critical heat flux | (kW/m2) | |
| Mean width of the profile | (μm) | |
| Roughness average | (μm) | |
| Max. height of the profile | (μm) | |
| Average max. height of the profile | (μm) | |
| x | Inlet thermodynamic quality | (-) |
| Acronyms | ||
| CHF | Critical Heat Flux | |
| DC | Direct Current | |
| IN | Inconel 625 | |
| IN150 | Inconel 625 abraded with 150 grit sandpaper | |
| INB | Inconel 625 bead blasted | |
| MRCHA | Mobile Research Critical Heat Flux Apparatus | |
| PEEK | Polyether Ether Ketone | |
| TC | Thermocouple |
References
- O’Hanley, H.; Coyle, C.; Buongiorno, J.; McKrell, T.; Hu, L.W.; Rubner, M.; Cohen, R. Separate effects of surface roughness, wettability, and porosity on the boiling critical heat flux. Appl. Phys. Lett. 2013, 103, 1–5. [Google Scholar] [CrossRef]
- Seo, G.H.; Jeun, G.; Kim, S.J. Enhanced pool boiling critical heat flux with a FeCrAl layer fabricated by DC sputtering. Int. J. Heat Mass Transf. 2016, 102, 1293–1307. [Google Scholar] [CrossRef]
- Son, H.H.; Cho, Y.S.; Kim, S.J. Experimental study of saturated pool boiling heat transfer with FeCrAl- and Cr-layered vertical tubes under atmospheric pressure. Int. J. Heat Mass Transf. 2019, 128, 418–430. [Google Scholar] [CrossRef]
- Ali, A.F.; Gorton, J.P.; Brown, N.R.; Terrani, K.A.; Jensen, C.B.; Lee, Y.; Blandford, E.D. Surface wettability and pool boiling Critical Heat Flux of Accident Tolerant Fuel cladding-FeCrAl alloys. Nucl. Eng. Des. 2018, 338, 218–231. [Google Scholar] [CrossRef]
- Kam, D.H.; Lee, J.H.; Lee, T.; Jeong, Y.H. Critical heat flux for SiC- and Cr-coated plates under atmospheric condition. Ann. Nucl. Energy 2015, 76, 335–342. [Google Scholar] [CrossRef]
- Liang, G.; Chen, Y.; Yang, H.; Li, D.; Shen, S. Nucleate boiling heat transfer and critical heat flux (CHF) from micro-pit surfaces. Int. J. Heat Mass Transf. 2020, 152, 119970. [Google Scholar] [CrossRef]
- Sun, Z.C.; Ma, X.; Ma, L.X.; Li, W.; Kukulka, D. Flow Boiling Heat Transfer Characteristics in Horizontal, Three-Dimensional Enhanced Tubes. Energies 2019, 12, 927. [Google Scholar] [CrossRef]
- Thermohydraulic Relationships for Advanced Water Cooled Reactors, 1st ed.; IAEA: Vienna, Austria, 2001.
- Haas, C.; Schulenberg, T.; Wetzel, T. Critical heat flux for flow boiling of water at low pressure in vertical internally heated annuli. Int. J. Heat Mass Transf. 2013, 60, 380–391. [Google Scholar] [CrossRef]
- Doerffer, S.; Groeneveld, D.; Cheng, S.; Rudzinski, K. A comparison of critical heat flux in tubes and annuli. Nucl. Eng. Des. 1994, 149, 167–175. [Google Scholar] [CrossRef]
- Chun, S.Y.; Chung, H.J.; Moon, S.K.; Yang, S.K.; Chung, M.K.; Schoesse, T.; Aritomi, M. Effect of pressure on critical heat flux in uniformly heated vertical annulus under low flow conditions. Nucl. Eng. Des. 2001, 203, 159–174. [Google Scholar] [CrossRef]
- Fiori, M.P.; Bergles, A.E. Model of Critical Heat Flux in Subcooled Flow Boiling; M.I.T. Dept. of Mechanical Engineering: Cambridge, MA, USA, 1968. [Google Scholar]
- Rogers, J.T.; Salcudean, M.E.; Tahir, A.E.E. Flow Boiling Critical Heat Fluxes for Water in a Vertical Annulus at Low Pressure and Velocities. In International Heat Transfer Conference (IHTC-7); Begel House Inc.: New York, NY, USA; Danbury, CT, USA, 1982; pp. 339–344. [Google Scholar] [CrossRef]
- El-Genk, M.S.; Haynes, S.J.; Sung-Ho, K. Experimental studies of critical heat flux for low flow of water in vertical annuli at near atmospheric pressure. Int. J. Heat Mass Transf. 1988, 31, 2291–2304. [Google Scholar] [CrossRef]
- Schoesse, T.; Aritomi, M.; Kataoka, Y.; Lee, S.R.; Yoshioka, Y.; Chung, M.K. Critical Heat Flux in a Vertical Annulus under Low Upward Flow and near Atmospheric Pressure. J. Nucl. Sci. Technol. 1997, 34, 559–570. [Google Scholar] [CrossRef]
- Mishima, K.; Nishihara, H. Effect of channel geometry on critical heat flux for low pressure water. Int. J. Heat Mass Transf. 1987, 30, 1169–1182. [Google Scholar] [CrossRef]
- Mayer, G.; Nagy, R.; Nagy, I. An experimental study on critical heat flux in vertical annulus under low flow and low pressure conditions. Nucl. Eng. Des. 2016, 310, 461–469. [Google Scholar] [CrossRef]
- Kumamaru, H.; Koizumi, Y.; Tasaka, K. Critical heat flux for annulus under high-pressure, low-flow and mixed inlet conditions. J. Nucl. Sci. Technol. 1990, 27, 68–80. [Google Scholar] [CrossRef]
- Shah, M. A general correlation for critical heat flux in annuli. Int. J. Heat Mass Transf. 1980, 23, 225–234. [Google Scholar] [CrossRef]
- Haas, C.; Meyer, L.; Schulenberg, T. Flow Instability and Critical Heat Flux for Flow Boiling of Water in a Vertical Annulus at Low Pressure. In ASME/JSME 2011 8th Thermal Engineering Joint Conference; ASME: Honolulu, HI, USA, 2011; Volume 2011, p. 11. [Google Scholar] [CrossRef]
- Lee, S.K.; Liu, M.; Brown, N.R.; Terrani, K.A.; Blandford, E.D.; Ban, H.; Jensen, C.B.; Lee, Y. Comparison of steady and transient flow boiling critical heat flux for FeCrAl accident tolerant fuel cladding alloy, Zircaloy, and Inconel. Int. J. Heat Mass Transf. 2019, 132, 643–654. [Google Scholar] [CrossRef]
- Lee, S.K.; Lee, Y.; Brown, N.R.; Terrani, K.A.; Blandford, E.D.; Ban, H.; Jensen, C.B.; Lee, Y. Elucidating the Impact of Flow on Material-Sensitive Critical Heat Flux and Boiling Heat Transfer Coefficients. Int. J. Heat Mass Transf. 2020, 158, 643–654. [Google Scholar] [CrossRef]
- Lee, S.K.; Liu, M.; Brown, N.R.; Terrani, K.A.; Lee, Y. Effect of Heater Material and Thickness on the Steady-State Flow Boiling Critical Heat Flux. Nucl. Technol. 2020, 206, 339–346. [Google Scholar] [CrossRef]
- do Nascimento, F.J.; Moreira, T.A.; Ribatski, G. Flow boiling critical heat flux of DI-water and nanofluids inside smooth and nanoporous round microchannels. Int. J. Heat Mass Transf. 2019, 139, 240–253. [Google Scholar] [CrossRef]
- Wang, Y.; Deng, K.; Wu, J.; Su, G.; Qiu, S. The characteristics and correlation of nanofluid flow boiling critical heat flux. Int. J. Heat Mass Transf. 2018, 122, 212–221. [Google Scholar] [CrossRef]
- Moghadasi, H.; Malekian, N.; Saffari, H.; Mirza Gheitaghy, A.; Zhang, G. Recent Advances in the Critical Heat Flux Amelioration of Pool Boiling Surfaces Using Metal Oxide Nanoparticle Deposition. Energies 2020, 15, 4026. [Google Scholar] [CrossRef]
- Khan, S.; Atieh, M.; Koç, M. Micro-Nano Scale Surface Coating for Nucleate Boiling Heat Transfer: A Critical Review. Energies 2018, 11, 3189. [Google Scholar] [CrossRef]
- Meloun, M.; Militky, J. Statisticke Zpracovani Experimentalnich Dat; AV ČR, ACADEMIA: Prague, Czech Republic, 2004. [Google Scholar]
- ČSN EN ISO 4288; Czech Office for Standards, Metrology and Testing: Brno, Czech Republic, 1999.
- See System E. 2020. Available online: http://www.advex-instruments.cz/ (accessed on 15 August 2020).
- Yu, H.S.; Jeong, Y.H. Critical heat flux enhancement of nuclear fuel cladding with a nano-porous oxide film by anodization. In Transactions of the Korean Nuclear Society Spring Meeting; Korean Nuclear Society: Daejeon, Korean, 2018. [Google Scholar]
- Wang, K.; Erkan, N.; Okamoto, K. Effects of carbon steel surface oxidation on critical heat flux in downward-face pool boiling. Int. J. Heat Mass Transf. 2019, 136, 470–485. [Google Scholar] [CrossRef]
- Wang, K.; Erkan, N.; Okamoto, K. A study on the effect of oxidation on critical heat flux in flow boiling with downward-faced carbon steel. Int. J. Heat Mass Transf. 2020, 147, 118966. [Google Scholar] [CrossRef]
- Wang, K.; Erkan, N.; Okamoto, K. Oxidation effect of copper on the downward-facing flow boiling CHF under atmospheric condition. Int. J. Heat Mass Transf. 2020, 156, 119866. [Google Scholar] [CrossRef]
- Accident Tolerant Fuel Concepts for Light Water Reactors; Number 1797 in TECDOC Series; IAEA: Vienna, Austria, 2016.


© 2020 by the authors. Licensee MDPI, Basel, Switzerland. This article is an open access article distributed under the terms and conditions of the Creative Commons Attribution (CC BY) license (http://creativecommons.org/licenses/by/4.0/).